U.W Shanika Dilrukshi
Sachin P Uduge
Sachin N Abeykoon
Avisha S Seneviratne
Ugeema De Silva
Mohommad Althaf
Foundation 14-01-008
Foundation 14-01-1
Foundation 14-01-001
Foundation-14-01-0
Foundation-14-01-0
Foundation-14-01-0
GROUP MEMEBERS
HOW SRI LANKA BECOMES AN DEVELOPING COUNTRY
An attractive destination
Good geographical location
Sri Lanka has seen high growth at around 8% annually
Infrastructure development
Sri Lanka’s production and export of tea, rubber and cinnamon
Sri Lanka’s major economic sectors include tourism, clothing and textiles
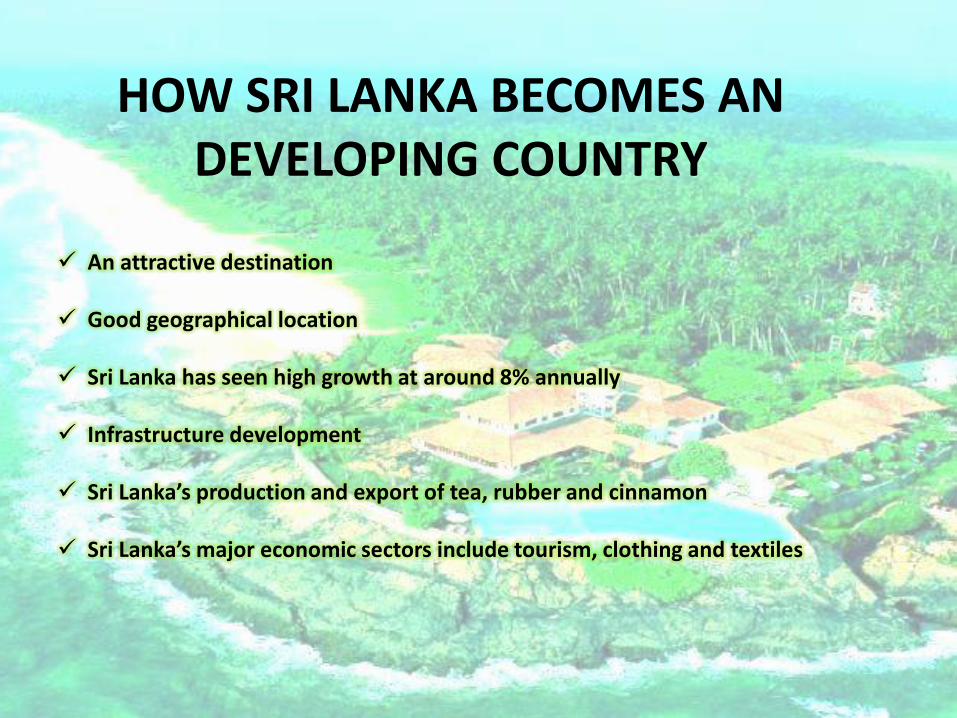
upgrade the sea, air, road, power and telecom backbone of the country
• Telecommunication Infrastructure Development,
• Major power projects in progress, such as Trincomalee Coal Power Project, Upper Kothmale Hydro Power Project,
• Development of High Mobility Road Network such as Colombo - Kandy Highway, Southern Highway, Colombo - Katunayake Expressway,
• Sea Port and Airport Development, such as Expansion of Bandaranaike International Airport, Colombo South Port Expansion
INFRASTRUCTURE DEVELOPMENT
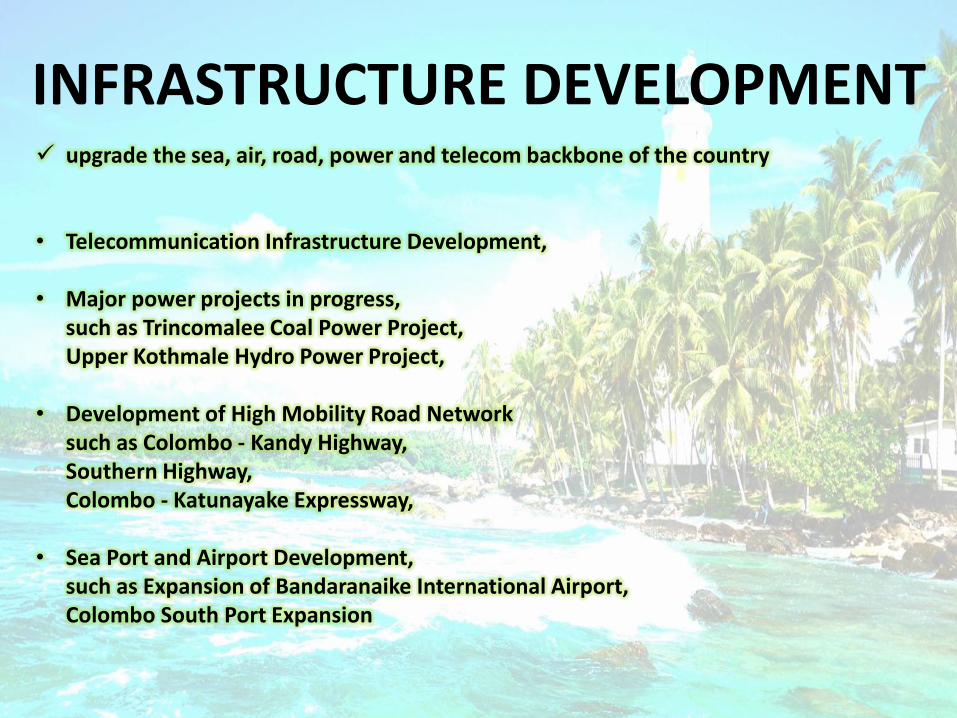
Total Area of Sri Lankan land is 65,610 km2
Total Area of Singapore land is 716.1 km2
Which means that Sri Lanka has an area 92 times larger than Singapore
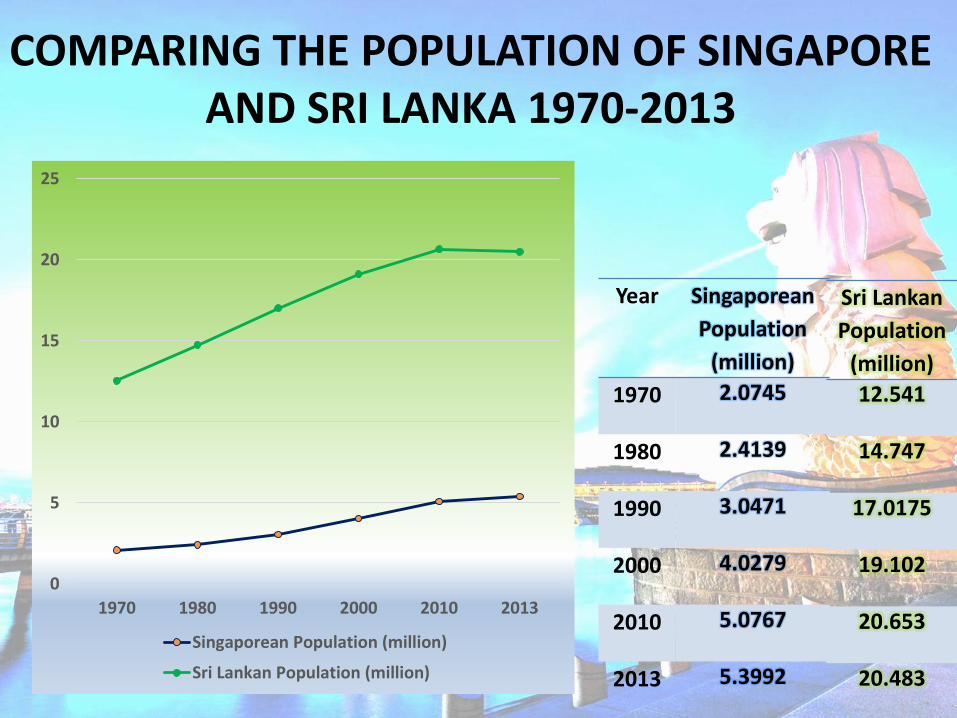
Year Singaporean
Population
(million)
1970 2.0745
1980 2.4139
1990 3.0471
2000 4.0279
2010 5.0767
2013 5.3992
Sri Lankan
Population
(million)
12.541
14.747
17.0175
19.102
20.653
20.483
0
5
10
15
20
25
1970 1980 1990 2000 2010 2013
Singaporean Population (million)
Sri Lankan Population (million)
COMPARING THE POPULATION OF SINGAPORE AND SRI LANKA 1970-2013

0
1
2
3
4
5
6
Year Unemployment
rate (%)
1999 3.2
2002 4.59
2004 3.4
2006 3.09
2008 2.20
2010 2.09
2011 2
UNEMPLOYMENT RATE (%) IN SINGAPORE 1999-2011

0
1
2
3
4
5
6
7
8
9
10
Year Unemployment
rate (%)
1998 9.5
2001 7.69
2004 7.8
2006 7.59
2008 5.19
2011 4.2
UNEMPLOYMENT RATE (%) IN SRI LANKA 1998-2011

Agriculture, animal husbandry, fishing, forestry, mining, energy and power, industry, science and technology, domestic trade and foreign trade.
Year Agriculture Industry Construction Trade Transport Service
1970 2.7 21.5 6.9 27.8 11.4 29.6
1980 1.6 29.9 6.3 21.1 14.5 26.7
1990 0.34 27.1 4.8 16.6 14.1 37.1
2000 0.1 28.7 5.9 15.8 13.9 35.6
2010 0.039 23.1 4.2 21.3 12.2 39.2
2013 0.034 20.1 4.4 20.7 11 43.8
STRUCTURE OF ECONOMY IN SINGAPORE
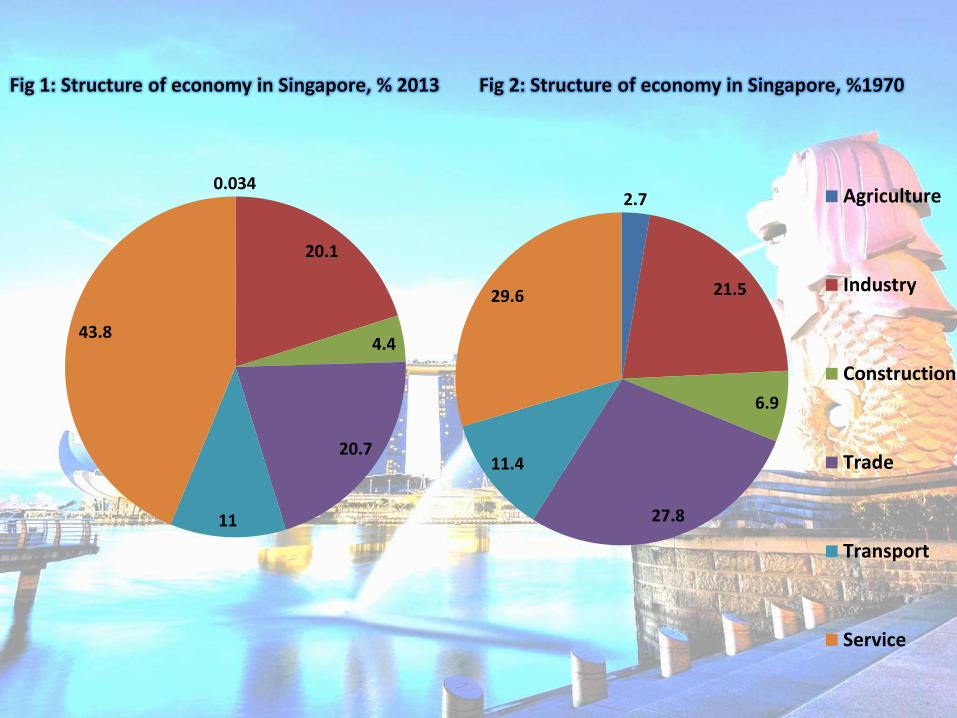
Fig 1: Structure of economy in Singapore, % 2013 Fig 2: Structure of economy in Singapore, %1970
0.034
20.1
4.4
20.7
11
43.8
2.7
21.5
6.9
27.8
11.4
29.6
Agriculture
Industry
Construction
Trade
Transport
Service

STRUCTURE OF ECONOMY IN SRI LANKA
Year Agriculture Industry Construction Trade Transport Service
1970 38.1 16 6.1 14.5 9.9 15.4
1980 28.6 21.6 10 14.9 11.3 13.7
1990 25.6 22.1 7.3 17.5 11.1 16.4
2000 17.6 22.9 7.1 21.6 11.7 19.2
2010 12.8 21.9 7.6 20.2 12.7 24.9
2013 10.8 22.1 10.3 20 13.4 23.4

38.1
166.1
14.5
9.9
15.4
Fig 3: Structure of economy in Sri Lanka, % 2013 Fig 4: Structure of economy in Sri Lanka, %1970
10.8
22.1
10.3
20
13.4
23.4
Agriculture
Industry
Construction
Trade
Transport
Service

EXCHANGE RATES
What are exchange rates?
Exchange rates can be affected by Factors that increase the supply of or decrease the demand.
Exchange rates can be weaken or lose value.

COMPARING EXCHANGE RATES OF SINGAPORE AND SRI-LANKA
Figure 10: 1Singapore Dollar is equal to 95.79 Sri Lankan Rupees

GROSS DOMESTIC PROFIT (GDP)
usually calculated on an annual basis.
It includes •private and public consumption, •government outlays, •Investments,•exports less imports.
gauge the health of a country's economy

GDP of Singapore in 1970
GDP of Singapore in 2013
During 1970-2013 GDP of Singapore

Year GDP in Billion Dollars’ Share %
World’s Economy Share
(%)
Asia’s Economy Share
(%)
1970 1.9 0.056 0.38
1980 12 0.098 0.48
1990 38.8 0.17 0.7
2000 94.3 0.28 1
2010 233.3 0.36 1.1
2013 295.7 0.39 1.2
0
50
100
150
200
250
300
350
1970 1980 1990 2000 2010 2013
GDP OF SINGAPORE 1070-2013
GDP in Billion Dollars’

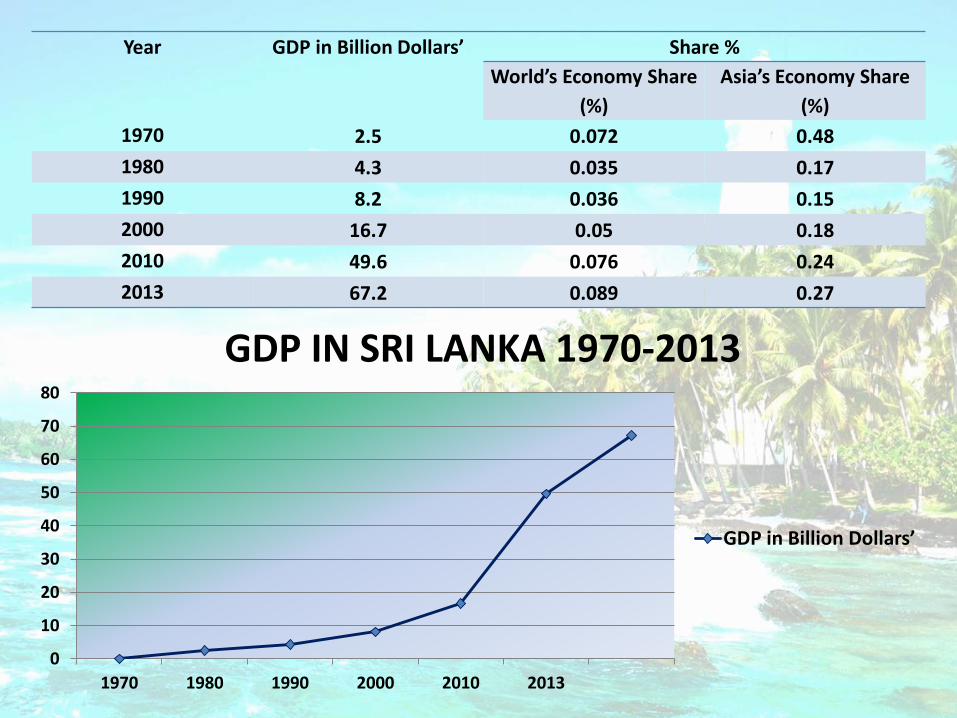
Year GDP in Billion Dollars’ Share %
World’s Economy Share
(%)
Asia’s Economy Share
(%)
1970 2.5 0.072 0.48
1980 4.3 0.035 0.17
1990 8.2 0.036 0.15
2000 16.7 0.05 0.18
2010 49.6 0.076 0.24
2013 67.2 0.089 0.27
0
10
20
30
40
50
60
70
80
1970 1980 1990 2000 2010 2013
GDP IN SRI LANKA 1970-2013
GDP in Billion Dollars’

COMPARISON BETWEEN THE GDP OF SINGAPORE AND SRI LANKA IN 1970 AND IN 2013
In 1970
Country GDP in Billion Dollars
Singapore 1.9
Sri Lanka 2.5
In 2013
Country GDP in Billion Dollars
Singapore 295.7
Sri Lanka 67.2
0
0.5
1
1.5
2
2.5
Singapore-1970 Sri Lanka-1970
GDP in Billion Dollars - 1970
0
50
100
150
200
250
300
Singapore-2013 Sri Lanka-2013
GDP in Billion Dollars-2013
This means that GDP of Sri Lanka was 1.32 Times higher than Singapore in 1970
This means that GDP of Singapore is 4.4times higher than the GDP of Sri Lanka

IMPORT
Import is goods or services brought into one country from another.
Form the backbone of international trade
Efficient or cheap

IMPORT OF SINGAPORE, 1970-2013
Represents a significant share of gross domestic profit (GDP).
Singapore access to goods and services from other nations.
Without Imports Singapore would be limited to the goods and services withinits borders.
Singapore’s main imports• Refined petroleum (23%)• Crude Petroleum (12%)• Integrated circuits (6.5%)• Computers(2.7%)• Petroleum gas (2.0%)
Singapore’s main import originsChina, Malaysia, South Korea, United States and Japan.

Import of Singapore in 1970 - 2.8 billion US dollarsRanked 26th in the world.Share of Import of Singapore in the world was 0.73%.
Import of Singapore in 2013 - 498 billion US dollarsRanked 13rd in the worldShare of Import of Singapore in the world was 2.2%
During 1970-2013 import of Singapore rose by 495.2 billion US.change occurred by 4.4 billion US dollars .
Minimal import of Singapore was in 1970 (2.8 billion US dollars).Maximal import of Singapore was in 2013 (498 billion US dollars).
IMPORTS OF SINGAPORE, 1970-2013

SRI LANKA IMPORTS COMMODITIES:
Textile fabricsMineral productsPetroleumFoodstuffsMachinery and transportation equipment
SRI LANKA’S IMPORTS PARTNERS :
India china Iran Singapore south Korea

IMPORTS OF SRI LANKA, 1970-2013
Import of Sri Lanka in 1970 - 0.66 billion US dollarsranked 66th in the world Share of Import of Sri Lanka in the world was 0.17%.
Import of Sri Lanka in 2013 - 21 billion US dollarsranked 81st in the world Share of Import of Sri Lanka in the world was 0.093%.
During 1970-2013 import of Sri Lanka increased by 20.3 billion US dollars
Minimal import of Sri Lanka was in 1972 (0.61 billion US dollars). Maximal import of Sri Lanka was in 2011 (22.3 billion US dollars).

Imports per billion USD in Singapore 1970-2013
Year imports per Billion Dollars’ imports per capita Dollars’
1970 2.8 1342.3
1980 25.2 10454
1990 65 21550.3
2000 169.3 43200.6
2010 405.2 79784.1
2013 498 92031.9
Imports per billion USD in Sri Lanka 1970-2013
Year Imports per Billion Dollars’ imports per capita Dollars’
1970 0.66 52.6
1980 2.2 146.5
1990 3.1 176.6
2000 8.1 429.7
2010 15.2 732.8
2013 21 989.3
COMPARISON OF IMPORTS IN SINGAPORE AND SRI LANKA -1970-2013

0
100
200
300
400
500
600
1970 1980 1990 2000 2010 2013
imports per Billion Dollars’ in Singapore 1970-2013
Imports per Billion Dollars’ in Sri Lanka 1970-2013

EXPORTS Goods produced in one country is shipped to another country for future sale or trade.
adds to the producing nation's gross output.
forms of economic transfer
effect on internal trade and economic stability
restrictions on trade, such as tariffs or subsidies.
helps an economy to grow
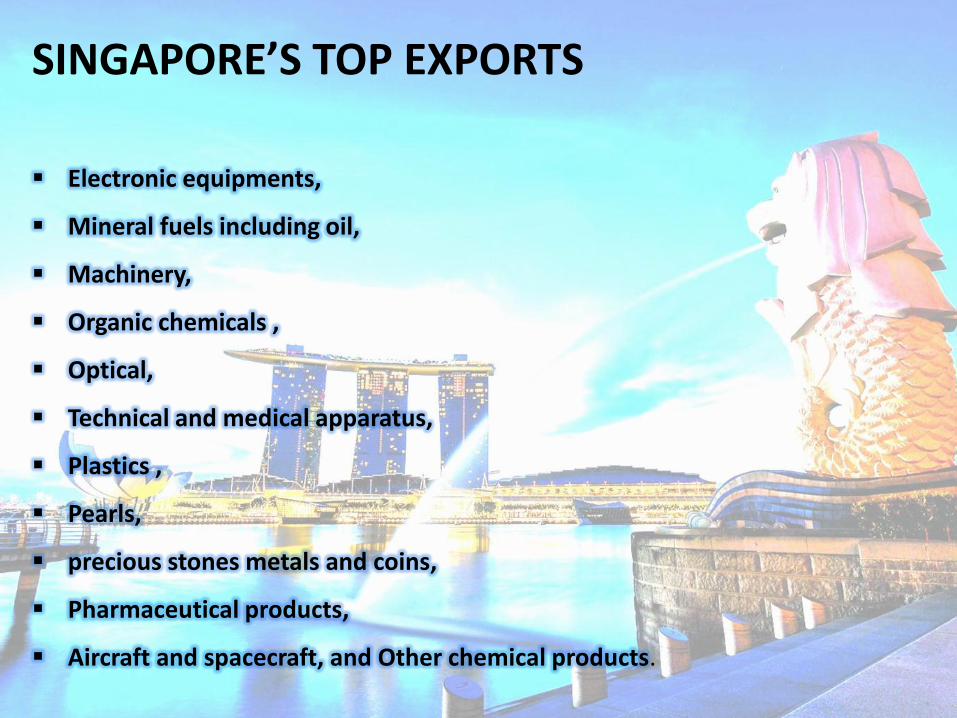
SINGAPORE’S TOP EXPORTS
Electronic equipments,
Mineral fuels including oil,
Machinery,
Organic chemicals ,
Optical,
Technical and medical apparatus,
Plastics ,
Pearls,
precious stones metals and coins,
Pharmaceutical products,
Aircraft and spacecraft, and Other chemical products.

Export of Singapore in 1970 - 2.4 billion US dollarsRanked 30th in the world.
Export of Singapore in 2013 - 566.2 billion US dollarsRanked 12nd in the world
During 1970-2013 export of Singapore increased by 563.8 billion US dollars
Minimal export of Singapore was in 1970 (2.4 billion US dollars). Maximal export of Singapore was in 2013 (566.2 billion US dollars).
EXPORT OF SINGAPORE IN 1970-2013

SRI LANKA EXPORTS COMMODITIES The major export commodities of Sri Lanka are: Textiles and apparel Tea and spices Diamonds Emeralds Rubies Coconut products Rubber manufactures Fish
SRI LANKA’S MAIN IMPORT PARTNERS US (20.4%), UK (9.9%), India (5.8%), Italy (4.7%), Belgium (4.3%), Germany (4.3%)

EXPORT OF SRI LANKA, 1970-2013
Export of Sri Lanka in 1970 - 0.58 billion US dollarsRanked 65th in the world
Export of Sri Lanka in 2013 - 14.7 billion US dollarsRanked 90th in the world
During 1970-2013 export of Sri Lanka grew by 14.1 billion US dollars
Minimal export of Sri Lanka was in 1972 (0.57 billion US dollars). Maximal export of Sri Lanka was in 2013 (14.7 billion US dollars).

Exports in Singapore 1970-2013Year per Billion Dollars’ per capita Dollars’
1970 2.4 1166.4
1980 24.4 10108.2
1990 68.9 22846.5
2000 181.4 46293.7
2010 470.7 92673.9
2013 566.2 104632.2
Exports in Sri Lanka 1970-2013Year per Billion Dollars’ per capita Dollars’
1970 0.58 46.8
1980 1.3 86.2
1990 2.4 140.1
2000 6.4 339.2
2010 11.1 534.4
2013 14.7 691.9
COMPARING THE EXPORTS OF SINGAPORE AND SRI LANKA FROM 1970-2013

0
100
200
300
400
500
600
1970 1980 1990 2000 2010 2013
Exports per Billion Dollars’ in Sri Lanka
Exports per Billion Dollars’ in Singapore

CONCLUSION
1970 Singapore was an undeveloped country
Singapore was even Poorer than Sri Lanka in 1970
Singapore population is even less than Sri Lanka
Singapore has very limited land and natural resources than Sri Lanka
2013 Singapore is a well developed country
Singapore overcame their unfriendly environment and lacking
resources
2013 Sri Lanka is still a developing country

RECCOMENDATIONS
Needs a rapid economic growth
Increase the exports
Develop international trade
lower the unemployment rate
Utilize the country's comparative advantage
Gain Business operation stability,
Help the market diversification
Bring additional source of revenues to the country

Recommended