Pattern Recognition Letters 24 (2003) 2711–2721
www.elsevier.com/locate/patrec
Shape measures for image retrieval
George Gagaudakis *, Paul L. Rosin
Department of Computer Science, Cardiff University, Newport Road, Cardiff, CF24 3XF, UK
Received 15 December 2002; received in revised form 12 March 2003
Abstract
One of the main goals in content-based image retrieval is to incorporate shape into the process in a reliable manner.
In order to overcome the difficulties of directly obtaining shape information (in particular avoiding region segmenta-
tion) we develop several shape measures that tackle the problem in an indirect manner, requiring only a minimal
amount of segmentation. A histogram-based scheme is then used, maintaining low complexity with high efficiency and
robustness. The obtained results showed that the combination of the shape measures provide an improvement over the
colour histogram.
� 2003 Elsevier B.V. All rights reserved.
Keywords: Content-based image retrieval; Histogram; Shape; Texture; Colour
1. Introduction
A limitation with content-based image retrieval
(CBIR) systems is their restriction to primitiveimage features such as colour and texture. Ideally
CBIR systems would operate on the semantic im-
age content and accept queries of that nature (e.g.
find pictures of steam trains in the country;
Eakins, 1996).
The early CBIR systems used techniques such
as colour histograms because they were easy to
compute, robust, and fairly effective. However,
* Corresponding author. Tel.: +44-2920875588; fax: +44-
2920874598.
E-mail addresses: [email protected], g.gagaudakis@
cs.cardiff.ac.uk (G. Gagaudakis), [email protected] (P.L.
Rosin).
0167-8655/$ - see front matter � 2003 Elsevier B.V. All rights reserv
doi:10.1016/S0167-8655(03)00114-4
randomly scrambling the positions of all the pixels
in the image leaves its histogram unaltered, and it
soon became apparent that it was necessary to
incorporate some spatial information into thesearch. One scheme was to allow the user to sketch
query shapes which were matched to the image
database (Flickner et al., 1995), but this is not
convenient to the average (unartistic) user. Alter-
natively, in (Pass and Zabih, 1999) a scheme of
joint histograms is exploited to incorporate more
information, than just colour, in the process of
image indexing. That approach kept the indexingprocess automated while performance was in-
creased.
An obvious approach to include shape is to
segment the image into regions. It is then straight-
forward to measure region shape as well as deter-
mining spatial interrelationships between regions.
The difficulty is that segmentation is inherently
ed.

2712 G. Gagaudakis, P.L. Rosin / Pattern Recognition Letters 24 (2003) 2711–2721
such a difficult task that the performance of
current algorithms falls far short of being able
to provide an adequate input to such schemes
(Gurari and Wechsler, 1982; Cooper, 1998). In
some contexts this may not be such a problem. For
instance, in region-based classification it is ac-ceptable to over-segment the image since the
fragmentation does not disadvantage the classifier.
However, for CBIR the region sizes, shapes, and
positions are just as relevant as their underlying
colour, intensity, and texture. Thus the assump-
tion of many region-based CBIR schemes on very
high-quality segmentation was unrealistic (Chang
et al., 1987), while more recent approaches thatminimise their dependency on good segmenta-
tion are limited in scope (Smith and Li, 1999).
(Of course, in some specific applications such as
trademark retrieval it is feasible to reliably extract
the objects as simple segmentation such as thres-
holding is often sufficient, and then a host of shape
measures can be applied; Mehtre et al., 1997.)
Rather than perform region segmentation someresearchers have investigated the use of interest
points as a means of localising processing to sig-
nificant image windows. Properties, preferably in-
variant to intensity scaling, rotation, etc. can then
be extracted, and used for retrieval within a voting
scheme (Schmid and Mohr, 1997) or by histogram
matching (Wolf et al., 2000). Still, the difficulty is
that corner detection and other interest operatorsare typically unreliable since they are looking for
relatively complex features based on small win-
dows of information.
This suggests edge detection as a more reliable
approach, since it lies somewhere in between re-
gions and points. It does not require a complete
partitioning of the image like region segmentation.
Only the edges are of interest, and they only cover afraction (e.g. a tenth) of the image. It is true that
edges are detected using local window operators
just like corners. However, the standard linking
phase to generated connected edge curves provides
a level of noise suppression, and easily enables
isolated insignificant edges to be eliminated. Nev-
ertheless, although edge detection may be more
tractable than region or corner detection it is stillprone to many errors such as mislocalisation, false
edges, drop-out, incorrect linking, and so on, and
therefore edge-based CBIR techniques must be
able to cope with these difficulties.
Some of our earlier work was based on edges
(Gagaudakis and Rosin, 2002). The multi-scale
salience distance transform (Rosin and West,
1995) was run on the edge gradient map. This hadthe effect of propagating weighted distances from
the edges throughout the image. These values were
histogrammed, and used as a signature of the im-
age. The advantage of this approach was that it
utilised some of the spatial information within the
image without requiring high quality segmenta-
tion. The distance transform is not dependent on
connectivity, and small changes in the edges gen-erally only cause small changes in the distance
map. Weighting the distances by the edge magni-
tudes also reduces the effect of low strength spu-
rious edges while avoiding the sensitivity to an
edge magnitude threshold. The benefit of the his-
togram approach is that it is robust since relatively
small numbers of potentially large errors can be
accommodated. Thus, errors in the edge mapproduce limited effect on the histogram. It can be
seen that our goal is to incorporate some aspects of
shape information into the CBIR process, prefer-
ably without explicitly having to extract shapes
(i.e. regions) from the image.
In the same vein of obtaining some aspect of
shape from edges are approaches by Jain and
Vailaya (1996) and Zhou and Huang (2000). Theformer histograms the edge orientations. Since
the resulting histogram is not rotation invariant
matching requires the histogram to be cyclically
shifted to find the best match. The latter is based
on the analogy of filling edge curves with a flow of
water. Various features are extracted such as fill
time, the number of forks encountered, the num-
ber of loops, etc. Our previous work also exploredother non-edge-based methods of indirect shape
measurement.
2. Methods
Our objective is to enhance the colour histo-
gram with additional information extracted fromimages. We exploited our strategy in three steps.
We first tried to expand our current methods to

G. Gagaudakis, P.L. Rosin / Pattern Recognition Letters 24 (2003) 2711–2721 2713
take the spatial distribution of colour into ac-
count, as shown in Section 2.1. Then we used
statistical methods over local windows to extract
aspects of colour and textural characteristics from
the image (Sections 2.2 and 2.3). The final step was
to calculate different shape aspects of the image inan indirect fashion (Sections 2.4 and 2.5).
2.1. Colour labels vs. distance transforms
In (Gagaudakis and Rosin, 2002) we histo-
grammed the intensities of the distance map, pro-
duced by applying multi-scale distance transform
to the detected edges (Fig. 1b). This incorporatedspatial information with respect to intensity
changes, but ignored colour content. To remedy
this we followed a similar trend and applied the
multi-scale distance transform to the boundaries
of the extracted colour region boundaries (Fig. 1c)
creating a 1D histogram of distances to colour
edges.
Trying to use colour in a more active way weexpanded the process by combining the colour and
shape information, forming a two-dimensional
histogram. Each bin in that histogram represents
the frequency of occurrence of a colour at some
distance from a feature. We applied this approach
both on the detected edges and the boundaries of
the colour regions to obtain two histogram fea-
tures.A straightforward approach was taken to the
colour region segmentation. The objective was not
to provide semantically meaningful regions, but
rather to provide a stable partitioning. Assuming
no severe illumination change, we achieved that by
a transformation of the image from the RGB space
to a perceptual set of colour labels (Berlin and
Fig. 1. Example of image and the resulting distance transforms wi
Original, (b) edges, (c) region boundaries.
Kay, 1969; see M. Seaborn and Stonham (1999)
for a recent application). The RGB values were
mapped to Berlin and Kay colour labels, this way
pixels of perceptually similar colour were assigned
the same label. To reduce noise we first apply
Gaussian smoothing (r ¼ 2:8) to the RGB imageand after labelling run majority voting filtering
using a 5 · 5 mask.
2.2. Local colour entropy
In an attempt to involve more colour in the
feature histograms we calculated entropy in local
windows over the hue map of the image. As a firststep we transformed the image to HSV keeping
only the hue channel, throwing away the rest of
the information (as we are interested only on the
plain colour aspect of the image). Then we define a
set of N � N overlapped windows. For each win-
dow, centered at position (x; y), we generate the
histogram of the hues and then calculate the en-
tropy (EHxy ¼ �P
pi log2 pi) of the histogram. Thedesired image signature is then obtained by simply
histogramming the entropy values over all the
windows.
The size of the hue histogram affects the cal-
culation of the colour entropy. We experimented
with static and dynamic histogram sizes and the
best results we obtained was with dynamically
sized histograms containing size ¼ minðw2; 256Þbins with w being the width of the window.
2.3. Local vs. global statistics
Next we experimented with histogramming the
relation between local statistical image information
and the corresponding global image information.
th the relevant overlayed colour region edges/boundaries. (a)

2714 G. Gagaudakis, P.L. Rosin / Pattern Recognition Letters 24 (2003) 2711–2721
In particular we wish to capture the similarity and
difference of the local statistics of small windows
against the corresponding statistics of the whole
image. This way we managed to capture the ho-
mogeneity of the image as well as the variation of
the statistics across the image. This can be con-sidered as capturing some sort of global texture of
the image. The basic tool we used for this process is
based on Tsai�s (1985) moment preserving binary
thresholding. This choice was based on a brief
comparative study of a set of automatic thres-
holding methods used for CBIR, as described in
(Gagaudakis and Rosin, 2002).
Thresholding is applied both globally to theimage and locally to the individual windows. Then
the percentage of pixels in the window that have
different values according the two thresholds is
histogrammed.
Additionally, we histogrammed the amount of
blackness (proportion of black pixels) found in the
window content after thresholding.
In both Sections 2.2 and 2.3 we used over-lapping windows. The difference caused by the
amount of overlap was found to be negligible. In
our experiments we used an overlap of 25% of
the window size in each direction. In Fig. 2 an ex-
ample of thresholding for measuring the difference
is illustrated.
2.4. Delaunay triangulation
In this section we consider another approach to
indirectly measuring shape. Its basis is the gener-
ation of the Delaunay triangulation (Preparata
and Shamos, 1985) of a set of edges. Edge detec-
tion and linking is first carried out, which enables
us to easily eliminate spurious short edge lists. The
Fig. 2. A sub-window is shown in (a). The result of thresholding u
thresholding the full image produces the result in (c). The difference be
pixels) between local and global statistics.
remainder is further sub-sampled by a factor of 10
which both speeds up triangulation and effectively
performs some noise suppression. The strength of
this approach is that connectivity is used to help
filter out noise but nevertheless the triangulation is
not dependent on connectivity and therefore cancope with edge linking errors. In (Tao and Grosky,
1999a,b) used the Delaunay triangulation for im-
age indexing. In (Tao and Grosky, 1999a) their
scheme requires isolated objects while in (Tao and
Grosky, 1999b) it is assumed that the image con-
tent is rigid. While the method is scale and rotation
invariant it is not tolerant to rearrangement of
objects. Our scheme does not exploit any objectextraction methods and we do not try to capture
any spatial dependencies explicitly.
We calculate different aspects of the individual
triangles and histogram their properties over the
complete triangulation. In particular we are in-
terested in:
Area: The area of each triangle.Aspect ratio: The ratio of the longest to the
shortest edge of each triangle.
Length: Lengths of triangle edges.
In Fig. 3, an example of an image and the ob-
tained triangulation is illustrated. Note, the sub-
sampling of the edges was chosen to be very coarse
for viewing purposes.
2.5. More shape methods
In an attempt to use more shape in the process
we tried to calculate shape measures in a more
direct way. Avoiding meaningful segmentation,
which is not practical (Gurari and Wechsler, 1982;
sing only the local window information is shown in (b) while
tween the two (d) captures the difference (indicated by the black

Fig. 3. Triangulation of sub-sampled edges.
G. Gagaudakis, P.L. Rosin / Pattern Recognition Letters 24 (2003) 2711–2721 2715
Cooper, 1998), we used edges and colour regions
which are potentially more robust. Using the
outcome of that partitioning we calculated several
shape characteristics of region edges and colour
regions.
2.5.1. Edge curvature
In a similar manner to edge orientation histo-gram we generated an edge curvature histogram.
Not only will this contain higher order shape in-
formation, but it is invariant to change and ori-
entation. Curvature is calculated using the cosine
curvature. Due to the difficulty in reliably estima-
tion curvature the resulting histogram appeared
to be noisy when the window size was relatively
small. To compensate we smoothed the results byusing a large fixed window size (although more
sophisticated adaptive methods are possible).
2.5.2. Region shape histograms
Although reliable segmentation is problematic
we did consider a region-based shape extraction
method. Colour regions were extracted using the
same process as in Section 2.1. Then we calculatedthe following properties: triangularity, elliptic-
ity, rectangularity, convexity, circularity (Rosin,
2000). In an attempt to overcome faulty segmen-
tation the shape properties were histogrammed
and used as a shape feature. Thus a few incorrect
regions would only have a small effect in the his-
togram.
Initial testing showed that both of these meth-ods produced poor results and so no further ex-
periment details are provided. The edge curvature
did not appear to provide useful discriminatory
information, while the region shape method failed
due to variations in segmentation that occurred
between even similar images.
3. Testing and results
3.1. Testing protocol
Our objective is to improve the effectiveness of
the simple colour histogram by incorporating
shape. At this point we examine the performance
and potential of these shape methods when com-bined with other features. There are two main
aspects of interest in this context, namely, effec-
tiveness and efficiency.
Efficiency is closely related with the storage re-
quirements and responsiveness of a CBIR system.
Histogram-based approaches tend to have a low
level of computational complexity. However, at
this point we are not greatly concerned with allaspects of efficiency, such as the histogram size.
Modifications of histogram sizes are possible and
capable of increasing efficiency according to cer-
tain trade-offs.
Effectiveness approximates the performance of
a system by taking into account the relevance of
the retrieved images, given a query, as perceived by
the user. A simple way of obtaining such a rankingis by employing the recall and precision measures.
Recall represents the proportion of ‘‘correct’’
matches in the top-N list of the retrieved images.
Precision represents the spread of a cluster in a
database. So given a cluster the bigger the spread
the worse the precision.
Two remaining issues need to be clarified, (a)
how image similarity is quantified and (b) howmultiple histogram features can be joined to a
single similarity value. Image similarity can be de-
termined by the distance between histograms. We
have experimented with various methods to fit the
purpose, such as Euclidian, Chi-square, Earth�sMover etc. The results shown in this paper were
2716 G. Gagaudakis, P.L. Rosin / Pattern Recognition Letters 24 (2003) 2711–2721
obtained using the Euclidean distance, while mul-
tiple histogram distances were combined using the
geometric mean to avoid the parameter tuning that
may be required by the weighted sum and the
complexity of more sophisticated methods.
Using the above methods, an experimentaldata-set for which the ground-truth classification
is available is essential. It is not hard to create a
collection of still images that can be clustered into
disjoint classes, as long as the content is simple
(such as faces, buildings, landscapes etc.). How-
ever as the number of classes increases and dis-
tinctions become more subtle it becomes harder to
complete the collection without the evaluationbecoming very subjective.
To avoid the difficulty (and impracticality) of
manual groundtruthing, we follow a method sim-
ilar to Milanese and Cherbuliez�s (1999) where stillimages extracted from video clips are used. A
broadcast TV signal from a local Greek station
(CRETA Channel) was captured at a resolution of
two frames-per-second. This was then re-sampledto obtain nine still images representing each clip. A
total of 387 images, giving 42 groups, were used.
As in (Milanese and Cherbuliez, 1999) we assumed
that (a) the continuity of the visual content of a
clip is implied by the uninterrupted recording of a
video camera, (b) there is gradual change of con-
tent, from frame to frame, due to camera opera-
tions and subject motion, object appearance anddisappearance.
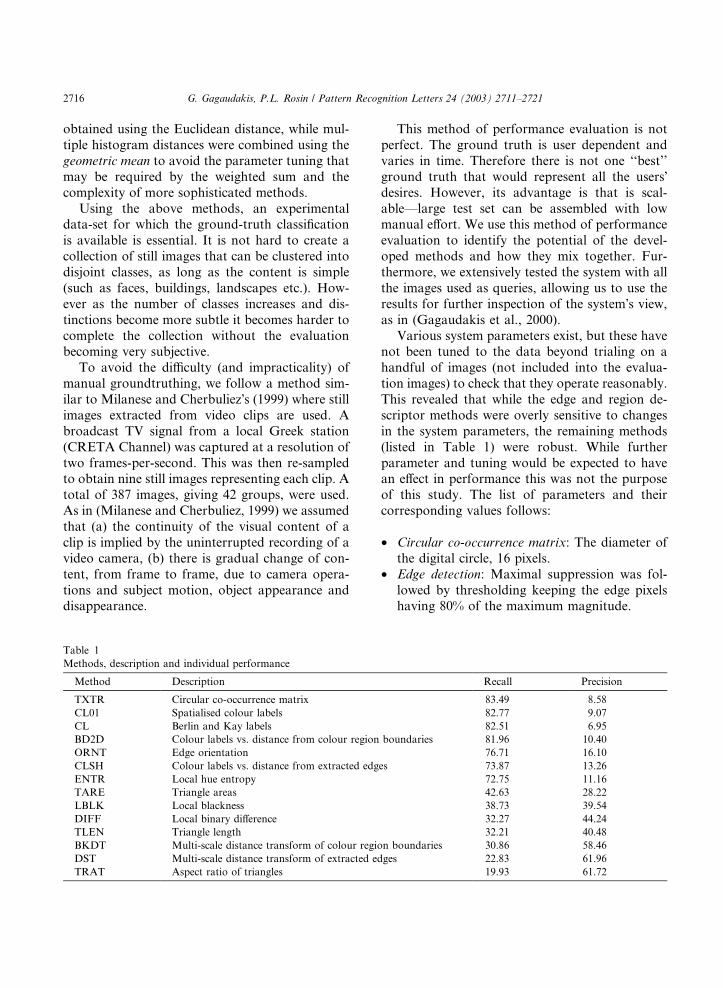
Table 1
Methods, description and individual performance
Method Description
TXTR Circular co-occurrence matrix
CL01 Spatialised colour labels
CL Berlin and Kay labels
BD2D Colour labels vs. distance from colour region
ORNT Edge orientation
CLSH Colour labels vs. distance from extracted edg
ENTR Local hue entropy
TARE Triangle areas
LBLK Local blackness
DIFF Local binary difference
TLEN Triangle length
BKDT Multi-scale distance transform of colour regio
DST Multi-scale distance transform of extracted ed
TRAT Aspect ratio of triangles
This method of performance evaluation is not
perfect. The ground truth is user dependent and
varies in time. Therefore there is not one ‘‘best’’
ground truth that would represent all the users�desires. However, its advantage is that is scal-
able––large test set can be assembled with lowmanual effort. We use this method of performance
evaluation to identify the potential of the devel-
oped methods and how they mix together. Fur-
thermore, we extensively tested the system with all
the images used as queries, allowing us to use the
results for further inspection of the system�s view,as in (Gagaudakis et al., 2000).
Various system parameters exist, but these havenot been tuned to the data beyond trialing on a
handful of images (not included into the evalua-
tion images) to check that they operate reasonably.
This revealed that while the edge and region de-
scriptor methods were overly sensitive to changes
in the system parameters, the remaining methods
(listed in Table 1) were robust. While further
parameter and tuning would be expected to havean effect in performance this was not the purpose
of this study. The list of parameters and their
corresponding values follows:
• Circular co-occurrence matrix: The diameter of
the digital circle, 16 pixels.
• Edge detection: Maximal suppression was fol-
lowed by thresholding keeping the edge pixelshaving 80% of the maximum magnitude.
Recall Precision
83.49 8.58
82.77 9.07
82.51 6.95
boundaries 81.96 10.40
76.71 16.10
es 73.87 13.26
72.75 11.16
42.63 28.22
38.73 39.54
32.27 44.24
32.21 40.48
n boundaries 30.86 58.46
ges 22.83 61.96
19.93 61.72

G. Gagaudakis, P.L. Rosin / Pattern Recognition Letters 24 (2003) 2711–2721 2717
• Colour label regions: Prior to labelling the image
pixels Gaussian smoothing (r ¼ 2:4) was ap-
plied to the image, as we found out that it
helped to avoid some small spurious regions.
• Delaunay triangulation: After linking the imageedges, we kept one every tenth pixel, while edges
of less than 10 pixels were excluded.
• Window size: In all methods where the image
was partitioned to windows, the window size
was dependent to the image size and it was such
that a total of 20 · 20 windows would fit.
3.2. Results
In this paper we investigate the potential of
shape measures in CBIR, when used individually or
combined with other measures. Fourteen methods
were considered, including those described in this
paper as well as in (Gagaudakis and Rosin, 2002).
Table 1 shows the individual methods and their
ranking. We developed a system to try out all the
Table 2
Combinations of methods along with recall/precision ranking
Method
TXTR ENTR
CL ORNT
ORNT ENTR BD2D
TXTR ORNT ENTR
TXTR ORNT ENTR BD2D
TXTR ORNT ENTR DIFF
TXTR ORNT ENTR DIFF BD2D
TXTR ORNT ENTR BD2D TARE
TXTR ORNT ENTR LBLK DIFF BD2D
TXTR ORNT ENTR DIFF BD2D TARE
TXTR ORNT ENTR LBLK BD2D TARE TRAT
TXTR ORNT ENTR LBLK DIFF BD2D TLEN
TXTR ORNT ENTR LBLK DIFF BD2D TARE TRAT
TXTR ORNT ENTR LBLK DIFF BD2D TRAT TLEN
TXTR ORNT ENTR LBLK DIFF BD2D TARE TRAT TLEN
TXTR DIST ORNT ENTR LBLK DIFF BD2D TARE TRAT
CL01 TXTR DIST ORNT ENTR LBLK DIFF BD2D TARE TL
CL01 TXTR DIST ORNT ENTR LBLK DIFF BD2D TARE TR
CL01 TXTR ORNT ENTR CLSH LBLK DIFF BD2D TARE T
CL01 TXTR ORNT ENTR CLSH LBLK DIFF BKDT BD2D T
CL01 TXTR ORNT ENTR CLSH LBLK DIFF BKDT BD2D T
CL01 TXTR DIST ORNT ENTR LBLK DIFF BKDT BD2D TA
CL01 TXTR DIST ORNT ENTR CLSH LBLK DIFF BKDT BD
CL CL01 TXTR DIST ORNT ENTR LBLK DIFF BKDT BD2D
CL CL01 TXTR DIST ORNT ENTR CLSH LBLK DIFF BKDT
Good methods should gain high recall and low precision values.
possible combinations of subsets of those 14
methods, giving a total of over 16,000 combina-
tions. The results were then grouped the results in
terms of the number of methods used. From these
groups we kept only the best two methods,
according to their ranking, which are listed inTable 2.
Brief investigation showed that some methods
seem to be appearing in most (if not all) the
combinations. Particularly, the hue entropy and
the texture methods are on the top of the list.
Followed by the edge orientation and the colour
labels vs. distance of colour region boundaries. The
methods using the triangulation although not onthe top of the list they are involved in the top
performing combinations. That shows we cannot
really predict the result of a methods combination
based only on their individual performance.
The nature of the image source suggested that
noise levels vary according to different parameters
like signal strength and external interference which
Recall Precision
91.12 5.79
90.03 4.92
93.65 4.45
93.65 4.74
94.80 3.59
94.17 4.50
95.09 3.49
95.03 3.65
95.23 3.68
95.14 3.52
95.26 4.12
95.20 4.02
95.11 3.96
95.06 4.23
94.65 4.50
94.45 4.60
EN 94.28 4.62
AT 94.20 4.61
RAT TLEN 94.14 4.52
ARE TRAT 94.08 4.19
ARE TRAT TLEN 94.02 4.39
RE TRAT TLEN 93.97 4.78
2D TARE TRAT TLEN 93.71 4.77
TARE TRAT TLEN 93.36 4.53
BD2D TARE TRAT TLEN 92.99 4.65

2718 G. Gagaudakis, P.L. Rosin / Pattern Recognition Letters 24 (2003) 2711–2721
vary in time. Our target was to investigate the
homogeneity of noise levels through clusters as
well as looking for any potential correlation be-
tween noise levels and feature performance. We
estimated the noise level of the images by mea-
suring the standard deviation of their grayscalemap using a fast noise variance estimation (Im-
merkaer, 1996) method. In Fig. 4, the noise level
Fig. 4. Relation of noise and performance of difference histogram
(solid line) across the dataset is illustrated overlaid
by the performance of four features (dotted lines).
These graphs show that there is no visible depen-
dency of the feature performance to noise.
The results (Tables 1 and 2) suggested that the
clusters may not be really disjoint as we were ex-pecting. This warned us to take a look at the
database from two different aspects. At a individ-
features, in parenthesis the Pearson correlation coefficient.

G. Gagaudakis, P.L. Rosin / Pattern Recognition Letters 24 (2003) 2711–2721 2719
ual image level, inspecting the histograms of the
images and at a cluster level, inspecting the dis-
tances between images.
At an individual image level we created images,
that resemble a form of spectrogram, of the image
histograms (see Fig. 5). Each column of pixels onthese images is a histogram of an image. The white
lines are used to separate the image clusters (given
by the ground truth). The images are post-pro-
cessed for viewing purposes. This representation
enabled us to have a visual feel of the similarity or
dissimilarity of the image features, individually.
Additionally we deducted conclusions on the ap-
plicability and discrimination potential of features:
Global level uniformity: In some cases the fea-
tures showed, e.g. DST, some uniformity limit-
ing the discrimination power to a narrow part
of the histogram.
Noise: In addition, a ‘‘noisy’’ nature of the his-
togram caused problems, limiting the discrimi-
nation power even more.Dithering effect: In another case, BKDT, the
histograms showed a high degree of uniformity
in cluster level and variation in global level,
which would be the ideal behaviour of a feature.
Although, performance was not as good as ex-
pected due to small variations of the histo-
grams, it looks like the histograms are shifted
Fig. 5. Histogram spectrums. (a) BKDT
slightly, which is not taken into account in the
distance measure calculation.
Narrow band bin-population: In many cases a
narrow band of the histograms is populated
leaving a small part of the histogram to beused for discrimination, like TARE, TRAT or
TLEN. Rescaling the histograms could consti-
tute a partial solution, which would potentially
fail in cases of noisy histograms.
Global level variation: This is the kind of behav-
ior of the top performing features. Narrow
banding appears in some cases without consider-
ably affecting the discrimination power of thehistogram. Such a phenomenon would suggest
that compression could be easily achieved by
carefully tuning the size of the histogram bins.
At a cluster level, we extracted the distances of
each image to all the other images in the database.
Since the number of possible combinations is large,
we selectively used some features, according to theirperformance. We used the extracted distances to
produce images, as shown in Fig. 6 where the po-
sition of each pixel represents two image indices and
the intensity their distance, the higher the intensity
the more similar the images. The matrix is arranged
in such a way that inter-cluster distances are rep-
resented by 9 · 9 blocks on the diagonal. We
used the distance matrices as an indicator for
, (b) BD2D, (c) DST, (d) TXTR.

Fig. 6. Distance matrices. (a) Clusters are evident on the diagonal indicating good precision but there is confusion as shown by high
off-diagonal values which suggest poor recall, (b) clustering is not visible indicating poor precision, (c,d) clusters are formed with the
diagonal blocks being highlighted indicating high recall and precision; the difference in precision between the two methods is visible
through the intensity difference of the off-diagonal blocks.
2720 G. Gagaudakis, P.L. Rosin / Pattern Recognition Letters 24 (2003) 2711–2721
(a) precision, which is indicated by homogeneoussquare blocks on the diagonal and (b) recall, the
diagonal blocks are brighter than the blocks formed
in the rest of the matrix. The performance mea-
sures, calculated inSection 3,were comparedagainst
the distance matrices and verified their expected
appearance. That is, high performing methods dis-
played the behavior in these two aspects.
4. Conclusions
This paper describes a number of new shape
measures for use in CBIR. The general strategy
was to avoid performing region segmentation asthis was considered too unreliable. Instead a va-
riety of schemes based on edges were developed.
We ran the methods on our existing system and
tested all possible combinations of our new and
old measures. In many cases by incorporating
shape the performance was improved over the
plain colour labels histogram. Initial experiment
showed that the edge curvature and the colourregion shape measure did not work well, and so
they were not investigated further. Focusing on the
shape aspect, we identified the potential of mea-
suring indirect shape using the Delaunay triangu-
lation.

G. Gagaudakis, P.L. Rosin / Pattern Recognition Letters 24 (2003) 2711–2721 2721
Our future work schedule includes further in-
vestigation on the proposed methods, in particu-
lar:
Local vs. global statistics: As well as investigat-
ing local vs. global statistics we will also measurethe change of local statistics over a neighbour-
hood, capturing local information in a more de-
tailed manner.
Delaunay triangulation: Use more properties of
the triangulation like, vertex order (the number
of edges incident to a vertex), triangle perimeter
and triangle altitude. Further more we will use
the triangulation as a form of interest operator,using the triangles to partition the image and
focus the extraction of features (e.g. colour,
texture) on local triangular windows.
Method ranking: Currently we combine mea-
sure using the geometric mean of the distances
between individual feature histograms. This is
simple and non-parametric however we would
like to investigate a more adaptive way of fusingthem. One approach could be to learn appropri-
ate combination rules from training data.
Additionally we are working on involving a
learning process to be used as a feature selector. By
investigating individual query results a system
could possibly be enabled to suggest feature com-
binations that comply with certain performancerequirements, finding a balance to achieve the best
performance with the least effort (computational
complexity and method reliability compensation).
Acknowledgement
This project is funded by EPSRC grant no. GR/L94628.
References
Berlin, B., Kay, P., 1969. Basic Color Terms: Their Universality
and Evolution. University of California Press.
Chang, S., Shi, Q., Yan, C., 1987. Iconic indexing by 2-D
strings. PAMI 9 (3), 413–428.
Cooper, M., 1998. The tractability of segmentation and scene
analysis. IJCV 30 (1), 27–42.
Eakins, J., 1996. Automatic image content retrieval––are we
getting anywhere? In: Proc. Third Internat. Conf. Electronic
Library and Visual Information (ELVIRA3). pp. 123–135.
Flickner, M., Sawhney, H., Niblack, W., Ashley, J., Huang, Q.,
Dom, B., Gorkani, M., Hafner, J., Lee, D., Petkovic, D.,
Steele, D., Yanker, P., 1995. Query by image and video
content: The QBIC system. Computer 28 (9), 23–32.
Gagaudakis, G., Rosin, P.L., 2002. Incorporating shape into
histograms for CBIR. Pattern Recognition 35, 81–91.
Gagaudakis, G., Rosin, P., Chen, C., 2000. Using CBIR and
pathfinder networks for image database visualisation. In:
ICPR00, vol. I. pp. 1052–1055.
Gurari, E., Wechsler, H., 1982. On the difficulties involved in
the segmentation of pictures. IEEE Trans. PAMI 4 (3), 304–
306.
Immerkaer, J., 1996. Fast noise variance-estimation. CVIU 64
(2), 300–302.
Jain, A., Vailaya, A., 1996. Image retrieval using color and
shape. Pattern Recognition 29 (8), 1233–1244.
M. Seaborn, L.H., Stonham, J., 1999. Fuzzy colour category
map for content based image retrieval. British Machine
Vision Conf., 103–112.
Mehtre, B., Kankanhalli, M., Lee, W., 1997. Shape measures
for content based image retrieval: A comparison. Inf. Proc.
and Manag. 33 (3), 319–337.
Milanese, R., Cherbuliez, M., 1999. A rotation, translation, and
scale-invariant approach to content-based image retrieval. J.
Visual Comm. Image Representation 10, 186–196.
Pass, G., Zabih, R., 1999. Comparing images using joint
histograms. Multimedia Systems 7, 234–240.
Preparata, F., Shamos, M., 1985. Computational Geometry.
Springer-Verlag.
Rosin, P., 2000. Measuring shape: Ellipticity, rectangularity,
and triangularity. In: ICPR00, vol. I. pp. 952–955.
Rosin, P., West, G., 1995. Salience distance transforms.
Graphical Models Image Process. 57, 483–521.
Schmid, C., Mohr, R., 1997. Local grayvalue invariants for
image retrieval. PAMI 19 (5), 530–535.
Smith, J., Li, C., 1999. Image classification and querying using
composite region templates. CVIU 75 (1/2), 165–174.
Tao, Y., Grosky, W., 1999a. Delaunay triangulation for image
object indexing: A novel method for shape representation.
In: IST SPIE Symposium on Storage and Retrieval for
Image and Video Databases VII.
Tao, Y., Grosky, W., 1999b. Object-based image retrieval using
point feature maps. In: Proc. Internat. Conf. Database
Semantics (DS-8). pp. 59–73.
Tsai, W., 1985. Moment-preserving thresholding. Computer
Vision, Graphics Image Process. 29, 377–393.
Wolf, C., Jolion, J., Kropatsch, W., Bischof, H., 2000. Content
based image retrieval using interest points and texture
features. In: ICPR00, vol. IV. p. 1A.
Zhou, X., Huang, T., 2000. Image representation and retrieval
using structural features. In: ICPR00, vol. I. pp. 1039–1042.
Recommended