Impact Factor Value 4.046 e-ISSN: 2456-3463
International Journal of Innovations in Engineering and Science, Vol 5, No.01, 2020 www.ijies.net
7
Seismic Behavior of Coupled Shear Wall with
Variation of Opening Dimensions and
Considering the Performance Level of Frame
Saba Sarlakchivaei1, Hamid Saber
2
1Graduate student of Civil Engineering, Ale- Taha Institute of Higher Education, Tehran, Iran 2 Assistant Professor, Department of civil engineering, university of eyvanekey, Semnan, Iran
Abstract –In recent years, Coupled Shear Wall system
has been used in tall and medium buildings because it
has advantages such as providing large spaces for
creating various uses in floor and architectural
considerations as doors, windows, and doorways. So this
was brought into the attention of the designers. The
lateral structural response is exactly dependent on the
shear walls behavior; therefor these elements must
response well under different loading situation. So this
paper aims to study the effects of near and far fault
earthquakes on the two series of mid-rise frame with the
steel plate shear wall with the coupling system. In both
series, the coupled shear wall will be evaluated by
variation of opening dimensions, one in length of 1 and
another in length of 2 meters and the width of once 0.6
and again 0.9 meters with the height ground floor of 2.8
and other floors of 3 meters regular in the plan. Firstly,
structures were model in ETABS computer software.
Then, the nonlinear static and time history analysis were
carried out. Subsequently, the performance of walls was
studied using two coupled near and two far fault
records. Finally in the nonlinear time history analysis
was measured relative displacement, absolute
displacement of floor, base shear, and in story base
shear. The results show that with the increased opening
dimension, the measure relative and absolute
displacements were increased, also with decrease
opening dimension, the measure base shear and in story
base shear decreased.
Keywords-Coupled Shear Wall, Variation of Opening
Dimension, Nonlinear Static Analysis, Time History
Analysis, Performance Levels
I- INTRODUCTION
The steel shear wall has been used in North America,
Canada and Japan for the last four decades as a gravity
loads and side loads resistant system. [1-2] Because it
has advantages such as providing large spaces for
creating various uses in floor and architectural
considerations as doors, windows, and doorways. So this
was brought into the attention of the designers. [3] The
coupled shear wall system as a resist system to lateral
forces has high resistance, high lateral stiffness and
energy dissipation capability. [4]
Despite the importance of the opening category and the
need to study its effects on system behavior, despite
numerous years of research by researchers in this field,
few numerical or laboratory studies have yet been
conducted on the presence of opening in steel shear
walls. [5] Can be mentioned for example: the pulse
characteristics of near-field earthquakes and detailed
analysis such as nonlinear static analysis (Pushover) and
dynamic time history analysis and performance levels
analysis for order to better predict the seismic behavior
of structures with coupled shear wall with Variation of
Opening Dimension under near and far-field earthquakes
from fault, to design more efficient structures. The
following researches can be mentioned:
II-METHOLOGY
In 1974, Pauli investigated the enhancement of coupled
shear wall ductility using the new reinforcement method.
In this method, an armature knot was inserted into the
beam in diameter and tight wraps were wrapped around
them to prevent buckling of the diagonal reinforcement.
He showed that the proposed reinforcement method
significantly increases the energy absorption capacity of
the coupling beams and that these beams will have a
more stable response at higher cycles, without
decreasing in strength and stiffness. [3] In 1992, Roberts
et al. investigated the effect of central circular opening

Impact Factor Value 4.046 e-ISSN: 2456-3463
International Journal of Innovations in Engineering and Science, Vol 5, No.01, 2020 www.ijies.net
8
on the cyclic behavior of steel shear panels. They
showed that the hardness and strength of the panels with
opening can be conservatively estimated by applying a
linear decrease coefficient to the hardness and resistance
of the panel without opening. [5] In 1995, Koblat et al.
investigated in vitro the coupled shear wall interface
beam. They performed an analytical work on the 18-
story building with shear walls by replacing HPFRCC
concrete at critical points and duplicate beams. They
showed that the use of this concrete increases the shear
strength of the concrete and increases the structural
ductility, as well as the simulation results, the structural
behavior of the earthquake, and the improved plastic
joints and cracking control. [6] In 2011, Fahnesto and
Borlow investigated several frames with a 6-storey steel
coupled shear wall.
Also, 3-storey laboratory samples from the checked
models were made 6-storey models.
In this study, the beam sections of the specimens had
100%, 200% and 400% plastic capacity of the floor
beams. They showed that by increasing the modulus of
the plastic cross-section of the graft beam compared to
the beam, the base shear increased and also displacement
in the lower floors increased. [1] In 2012, they also
investigated that they were 6 and 12 behavior and
mechanism of steel coupled shear wall. They referred to
the relationship of the coupling degree (DC). In this
study, 32 buildings story were modeled based on a 9
story building pattern and two types of 1.8 and 2.8 m
bonding beams with 25% to 600% plastic floors
sections. They showed that as the bond length increased,
the coupling degree did not always increase. [1] Sabouri
et al. (2012) investigated the effect of changing the size
and location of rectangular openings on the hardness and
toughness of hardened steel panels (with a series of
horizontal and vertical sheets) without hardening. They
showed that the rectangular opening position is not of
much importance in the behavior of hardened steel
panels, whereas in non-rigid models, the toughness and
resistance of the panel varies drastically with the change
of the opening position. [5] Gholikhani and Hatami in
2015 investigated the lateral behavior of cold rolled steel
shear walls with cover of steel panel in finite element
method. They analyzed shear wall panels using Abacus
finite element software and developed a simple method
for modeling the screws connecting cover sheets to
frame that allow to simulate breakdown at the joints. [7]
In 2017, Shaynfar et al. investigated the steel shear wall
based on the performance-based plastic design method.
They compared the proposed method of performance-
based plastic design with the AISC seismic code
guidelines for designing a 4-storey office building with a
steel shear wall as a lateral load-resistant system. [8] In
2018, Sharbatdar and Khosroabadi examined the
adequacy of codes for the seismic design of steel panel
shear walls with geometrical and physical variables.
They first designed a steel sheet shear wall system in a
high seismic zone for a 5-story building with accordance
in AISC 05-341 seismic requirements, then to
investigate the seismic behavior of the structure and to
achieve hysteresis curves under periodic load. And the
influence of geometrical and physical variables on its
behavior, considering the effects of local instability
(buckling) and nonlinearity of materials, designed the
model of the wall specimen and similar specimens
having different dimensions, sections, and states (with
openings and hardenings) were modeled and analyzed in
the Abacus finite element program. They showed that
with the increasing number of floors, mode of the main
breakdown of wall appears as a general buckling at the
foot of the column, which is accompanied by a
deterioration of strength and hardness [9].
In this paper, the effect of opening dimensions On
changes in performance levels of regular steel structures
in plan under pulse record of near and far basin species
is investigated. To achieve a more accurate response
were used from nonlinear analyzes such as static
nonlinear (cover) analysis and dynamic time history
analysis and the seismic behavior of these structures was
investigated by obtaining amount of the displacement
relative, absolute, floor shear and base shear.
2. Theoretical Foundations of Research
2-1 Nonlinear Static Analysis (Pushover)
Due to the development process of loading regulations
and design on the performance of structures and non-
responsiveness of linear analysis to ensure the design
accuracy for estimating the actual structure response in
earthquake there are two solutions:
1-Nonlinear static analysis method
2-Nonlinear dynamic analysis method
The nonlinear static method has an acceptable ability to
estimate nonlinear structural behavior. This method can
accurately determine the needle displacements.
Detection of fracture mechanism to ensure that
prevention of weak floor or column mechanism - strong
beam does occur with this method. In this method there
are constant gravitational loads and the lateral load
gradually increases. Nonlinear static analysis consists of
two parts:

Impact Factor Value 4.046 e-ISSN: 2456-3463
International Journal of Innovations in Engineering and Science, Vol 5, No.01, 2020 www.ijies.net
9
1- Capacity curve
2- Combine the results of the capacity curve with the
structural requirement for system response estimation
[10].
The pushover curve continues until the target
displacement. This displacement is called in the FEMA
356- and improvement instructions the target
displacement and the demand displacement in the
40ATC [11].
2-1-1 Target Relocation in FEMA-356
Target displacement represents the maximum relative
displacement a building may experience under an
earthquake. There are different methods of determining
target location that are FEMA-356 and the same
optimization procedure. The advantage of the method
introduced in FEMA 356 - the method introduced in
40ATC - is its ease of application. In this method, a
nonlinear static analysis must first be performed and the
base shear curve obtained against the lateral
displacement of the control point (Pushover Curve).
From the resulting pushover curve, by calculating a set
of coefficients, the target displacement can be obtained.
According to FEMA-356 and the Target Relocation
Improvement Instruction is equal to:
𝛿𝑡 = 𝐶0𝐶1𝐶2𝐶3𝑆𝑎
𝑇𝑒2
4𝜋2𝑔
In order to calculate the target displacement, one must
first calculate the effective principal alternation time
(Te) as follows.
𝑇𝑒 = 𝑇𝑖 × 𝐾𝑖
𝐾𝑒
Where Ti is the main periodicity of the building
assuming linear behavior and based on FEMA-356
obtained from a dynamic elastic analysis in seconds, Ki
is the elastic lateral stiffness and Ke isthe effective
lateral stiffness of building along the desired length. It is
worth noting that the values of Ti, Te, Ki and Ke are
obtained from the two-line diagram of the structural
capacity curve.
C_0 is the correction factor for the relation of the
spectral displacement of a degree of freedom to the roof
displacement (reference displacement) of a degree of
freedom.
C_1 is the correction factor for converting the calculated
displacements from the elastic linear response to the
maximum expected non-elastic displacements of the
structure.
C_2 is the correction factor to take the shape of the
hysteresis curve and reduce the stiffness and
deterioration of the structural members' resistance to
maximum displacements. This coefficient takes into
account the quality and quality of the structure and the
desired performance level.
C_3 is the correction factor to consider the increase in
displacements caused by the dynamic effects of p-Δ. Sa
is the spectral acceleration based on the main periodicity
of the structure and g is the acceleration of gravity. [11-
12-13]
2-2 Dynamic Time History Analysis
In the nonlinear dynamic analysis method, the structural
response is calculated by considering the nonlinear
behavior of the materials and the non-geometric
behavior of the structures. The method assumes that the
stiffness and attenuation matrix can be changed from one
step to the next, but is constant over each time step and
the model response under earthquake acceleration is
calculated numerically and for each time step. Nonlinear
dynamic analysis is the most accurate method used in
structural analysis. The main purpose of this method
according to Equation 3 is to solve the dynamic
equilibrium differential equation of motion. Nonlinear
dynamic analysis is performed by two general methods
of direct integration and modal analysis.
𝐾𝑢 𝑡 + 𝐶𝑢 𝑡 + 𝑀𝑢 𝑡 = 𝑟 𝑡
In the above relation K , C and M are the stiffness ,
damping and mass matrices , respectively and u , u ̇
and u ̈ are the displacement , velocity and
acceleration vector, respectively. r(t) is the vector
of external forces. [14]
3. Specifications of Distant and Near Fault Records
In order to perform dynamic time history analysis, 4 off-
field records and 4 near-fault records according to
Tables 1 and 2 with pulse effect (8 records in total) were
used. The magnitude of the record is between 6.2 and 7.6
on the Richter scale obtained from the Peer site. [15] The
criterion for near-fault records based on Mr. Baker's
2007 proposal is based on the following three criteria.
[16]

Impact Factor Value 4.046 e-ISSN: 2456-3463
International Journal of Innovations in Engineering and Science, Vol 5, No.01, 2020 www.ijies.net
10
1-The pulse index is greater than 0.85.
2-The pulse is formed in the early moments of the
mapping speed.
3- PGA earthquake record exceeds 30 m / s.
The soil type of records was considered type 3 according
to Iranian Code 2800. [15] Using the aforementioned
records for dynamic analysis of temporal history, the
seismic behavior of steel structures along the coupled
shear wall was obtained by variation of opening
dimension changes.
Table1: Seismic characteristics of far-fault record
No. Record
Year Richter
Distance
from
Fault
(km)
The
Dominate
Period (s)
Maximum
Earth
Speed
(cm/s)
1
Chi-CHI
CHY101-
W,
Taiwan, 20
September,
1999
7/6 11/14 1/29 70/64
2
Imperial
Valley, H-
E01240, 15
October,
1979
6/5 10/4 0/75 31/58
3
Loma
Prieta,
G03090,
18
October,
1989
6/9 14/4 0/92 39/03
4
Northridge,
CNP196,
17 January,
1994
6/7 15/8 0/8 60/7
Table2: Seismic characteristics of near-fault record
No. Record
Year Richter
Distance
from
Fault
(km)
The
Dominate
Period (s)
Maximum
Earth
Speed
(cm/s)
1
Nigata
Japan,
NIGH11,
2004
6/6 8/9 1/8 36/4
2
Kobe,
Japan,
Takatori,
1995
6/9 1/47 1/6 170
3
Northridge,
01,Jensen
Filter Plant
1994
6/7 5/43 3/5 67
4
Morgan
Hill,
Coyote
Lake Dam
(SW Abut)
6/2 0/53 1 62
4. Frames Modeling in ETABS Software
Two 8-storey frame reference sheets with shear
wall variations, one with 1 m length and one with 2
m length and 0.6 m once width and with the other
0.9 m (4 frames total) with ground floor height of
2.8 m and the other 3 m regular floors were
included in the plan with a span of 5 m for all
structures.
Structural uses were considered residential and the
soil was according to Iranian Code 2800 [17], and
the acceleration ratio of the design was considered
to be a very high relative risk zone (0.PGA = 0.35)
for all structures.
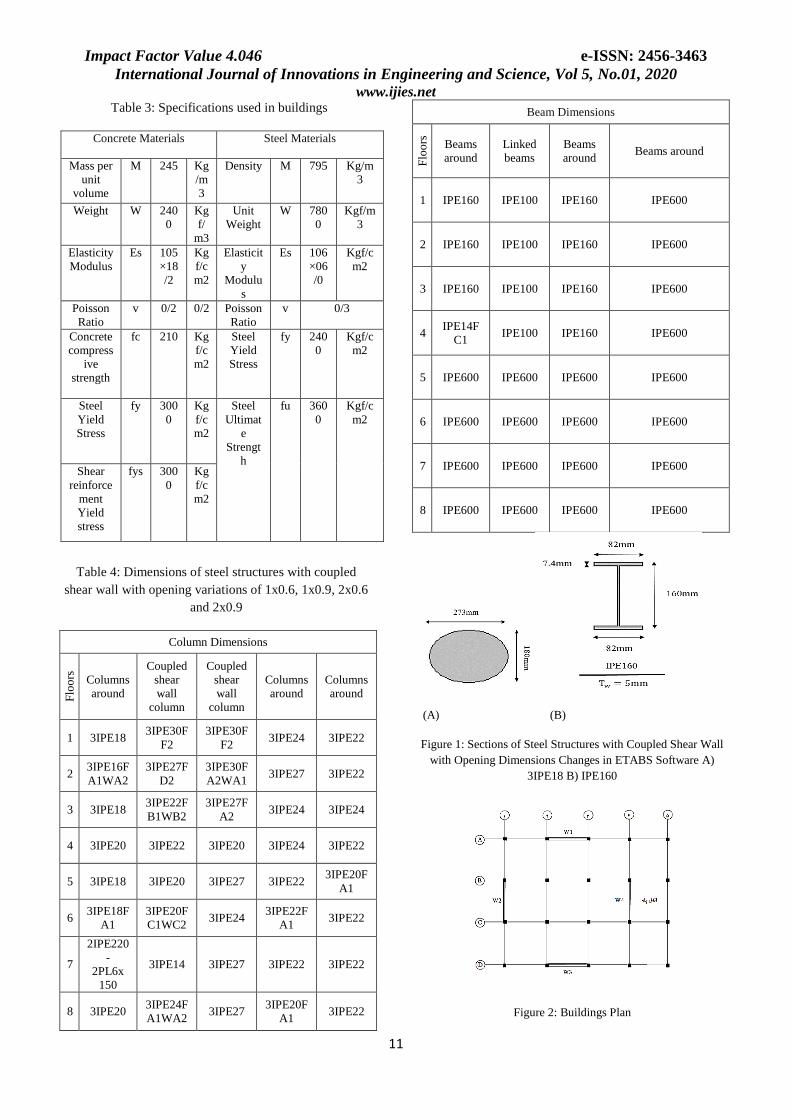
The specifications of the materials used in the
structure are as shown in Table 3. Solid sections are
used for column sections. As shown in Fig. 1 (a),
section 18IPE3, which forms one of the first floor
pillars of all the structures under consideration, has
a depth of 180 mm and a width of 273 mm. IPE
sections have also been used for beam sections. As
shown in Fig. 1B, the 160IPE cross-section, which
is one of the first floor beams of all the structures
under study, has a height of 82 mm and a low width
of 5 mm and a total height of 160 mm. Is other
dimensions of beam and column sections are shown
in Table 4. Thickness of shear wall dimensions in
all classes for steel structures with coupled shear
wall with opening dimensions of 0.6x1, 0.9x9 and
0.6x2 40W cross section, 40mm and for 45W cross
section 0.9x2mm, 45mm, 45mm Was used.
As shown in Figure 2, linear and nonlinear
modeling of the aforementioned structures was
performed 3D in ETABS version 2015 software.
Also, according to Fig. 3, the results of nonlinear
analysis such as static nonlinear and dynamic time
history analysis of one frame with D grid line were
investigated.
Impact Factor Value 4.046 e-ISSN: 2456-3463
International Journal of Innovations in Engineering and Science, Vol 5, No.01, 2020 www.ijies.net
11
Table 3: Specifications used in buildings
Concrete Materials Steel Materials
Mass per
unit
volume
M 245 Kg
/m
3
Density M 795 Kg/m
3
Weight W 240
0
Kg
f/
m3
Unit
Weight
W 780
0
Kgf/m
3
Elasticity
Modulus
Es 105
×18
/2
Kg
f/c
m2
Elasticit
y
Modulu
s
Es 106
×06
/0
Kgf/c
m2
Poisson
Ratio
v 0/2 0/2 Poisson
Ratio
v 0/3
Concrete
compress
ive
strength
fc 210 Kg
f/c
m2
Steel
Yield
Stress
fy 240
0
Kgf/c
m2
Steel
Yield
Stress
fy 300
0
Kg
f/c
m2
Steel
Ultimat
e
Strengt
h
fu 360
0
Kgf/c
m2
Shear
reinforce
ment
Yield
stress
fys 300
0
Kg
f/c
m2
Table 4: Dimensions of steel structures with coupled
shear wall with opening variations of 1x0.6, 1x0.9, 2x0.6
and 2x0.9
Column Dimensions
Flo
ors
Columns
around
Coupled
shear
wall
column
Coupled
shear
wall
column
Columns
around
Columns
around
1 3IPE18 3IPE30F
F2
3IPE30F
F2 3IPE24 3IPE22
2 3IPE16F
A1WA2
3IPE27F
D2
3IPE30F
A2WA1 3IPE27 3IPE22
3 3IPE18 3IPE22F
B1WB2
3IPE27F
A2 3IPE24 3IPE24
4 3IPE20 3IPE22 3IPE20 3IPE24 3IPE22
5 3IPE18 3IPE20 3IPE27 3IPE22 3IPE20F
A1
6 3IPE18F
A1
3IPE20F
C1WC2 3IPE24
3IPE22F
A1 3IPE22
7
2IPE220
-
2PL6x
150
3IPE14 3IPE27 3IPE22 3IPE22
8 3IPE20 3IPE24F
A1WA2 3IPE27
3IPE20F
A1 3IPE22
Beam Dimensions
Flo
ors
Beams
around
Linked
beams
Beams
around Beams around
1 IPE160 IPE100 IPE160 IPE600
2 IPE160 IPE100 IPE160 IPE600
3 IPE160 IPE100 IPE160 IPE600
4 IPE14F
C1 IPE100 IPE160 IPE600
5 IPE600 IPE600 IPE600 IPE600
6 IPE600 IPE600 IPE600 IPE600
7 IPE600 IPE600 IPE600 IPE600
8 IPE600 IPE600 IPE600 IPE600
(A) (B)
Figure 1: Sections of Steel Structures with Coupled Shear Wall
with Opening Dimensions Changes in ETABS Software A)
3IPE18 B) IPE160
Figure 2: Buildings Plan

Impact Factor Value 4.046 e-ISSN: 2456-3463
International Journal of Innovations in Engineering and Science, Vol 5, No.01, 2020 www.ijies.net
12
(A)
Figure 3: Steel Structures with Coupled Shear Wall with
Opening Dimensions Changes for Nonlinear Analysis in
ETABS Program with Grid Line D a) Opening
Dimensions 1x0.9 b) Opening Dimensions 1x0.6 c)
Opening Dimensions 2x0.9 d) Opening Dimensions
(B)
(C)
(D)
5. PERFORM ANALYSIS
5-1 Nonlinear Static Analysis
These structures were subjected to nonlinear static
analysis in 3D. In this analysis, the lateral loading
pattern of the first case and FEMA-356 constant
coefficient method were used to determine the target
displacement. By performing nonlinear static analysis
for intermediate order structures with coupled shear wall
system and obtaining displacement values in meters
versus base shear in Kgf was drawn, to compare and
evaluate the seismic performance, the 4-frame pushover
curves with grid D are shown in a diagram as Figure 4.
The curves for the two design-basis earthquake hazard
(DBE) and maximum considered earthquake (MCE)
levels are two-line, with examples of these curves shown
in Figure 5.
As shown in Fig. 4, with the slight increase in the cross-
sectional area from 0.6 to 0.9 m 2, there is no differences
were observed in their pushover curves but with the
increase of the Opening area from 1.2 to 1.8 square
meters, the pushover curve has gradually tilted
downwards. By decreasing the cross section from 1.2 to
0.6 m 2 and also from 1.8 to 0.9 m 2, the ultimate
resistance value decreased by 1.5 and 2.5%, respectively,
this indicates that the effect of the area of the Opening
under study on the seismic performance of the frame is
very small.

Impact Factor Value 4.046 e-ISSN: 2456-3463
International Journal of Innovations in Engineering and Science, Vol 5, No.01, 2020 www.ijies.net
13
Figure 4: Comparison of Pushover curves
(A)
(B)
(C)
(D)
Figure 5: Dual Linearization of Pushover Curves in ETABS
Software A) Opening Dimensions 2x0.6 at Maximum
Considered Earthquake (MCE) b) Opening Dimensions 2x0.6
at Design Basis Earthquake (DBE) c) Opening Dimensions
2x0.9 at Maximum Considered Earthquake (MCE) c) Opening
Dimensions of 2x0.9 at Design Basis Earthquake (DBE)
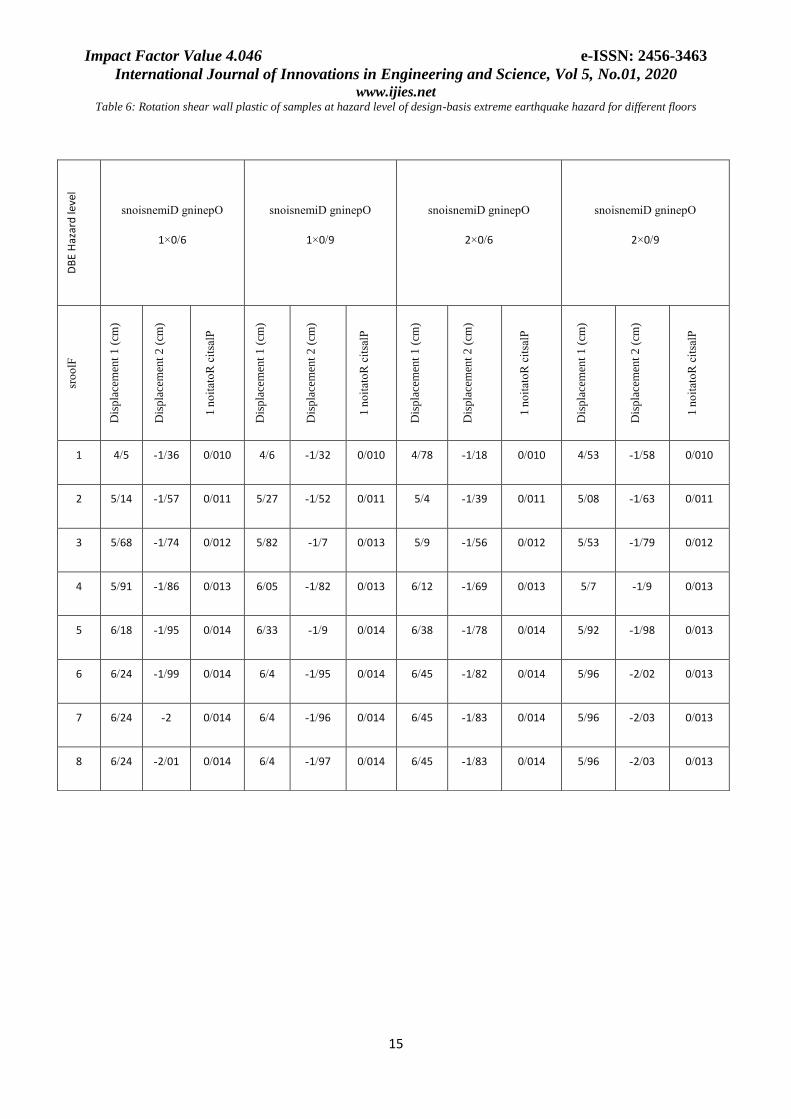
5-1-1 Control of Shear Wall Performance Levels
According to the Journal 360, shear wall permitted
values for plastic rotation for life safety performance
(LS) are 0.010 and the collapse prevention (CP) is 0.015.
The shear wall plastic rotation values were calculated for
both design-basis earthquake (DBE) and maximum
considered earthquake (MCE) and results are shown in
Tables 5 and 6. As shown in Table 5, the plastic rotation
values for all frames examined at hazard level of design
basis earthquake are life safety performance and also,
according to Table 6, the plastic rotation values for the
very severe earthquake hazard level are equal the
collapse prevention performance.

Impact Factor Value 4.046 e-ISSN: 2456-3463
International Journal of Innovations in Engineering and Science, Vol 5, No.01, 2020 www.ijies.net
14
Table 5: Rotation shear wall plastic of samples at level of design-basis earthquake hazard for different floors
Ear
thqu
ake
haz
ard
pla
n l
evel
snoisnemiD gninepO
6/0×1
snoisnemiD gninepO
9/0×1
snoisnemiD gninepO
6/0×2
snoisnemiD gninepO
9/0×2
sro
olF
Dis
pla
cem
ent
1 (
cm)
Dis
pla
cem
ent
2 (
cm)
no
itat
oR
cit
salP
1
Dis
pla
cem
ent
1 (
cm)
Dis
pla
cem
ent
2 (
cm)
no
itat
oR
cit
salP
1
Dis
pla
cem
ent
1 (
cm)
Dis
pla
cem
ent
2 (
cm)
no
itat
oR
cit
salP
1
Dis
pla
cem
ent
1 (
cm)
Dis
pla
cem
ent
2 (
cm)
no
itat
oR
cit
salP
1
1 44/1 69/0- 004/0 42/1 58/0- 003/0 65/1 55/0- 004/0 66/1 75/0- 004/0
2 93/1 78/0- 005/0 92/1 98/1- 007/0 16/2 76/0- 005/0 1/2 91/0- 005/0
3 34/2 95/0- 005/0 35/2 94/0- 005/0 6/2 92/0- 006/0 47/2 06/1- 006/0
4 37/2 06/1- 006/0 54/2 05/1- 006/0 8/2 04/1- 006/0 63/2 16/1- 006/0
5 75/2 14/1- 006/0 77/2 13/1- 007/0 04/3 13/1- 007/0 82/2 24/1- 007/0
6 61/2 18/1- 006/0 84/2 17/1- 007/0 11/3 17/1- 007/0 87/2 27/1- 007/0
7 81/2 19/1- 007/0 84/2 19/1- 007/0 11/3 18/1- 007/0 87/2 28/1- 007/0
8 81/2 2/1- 007/0 84/2 19/1- 007/0 11/3 19/1- 007/0 87/2 29/1- 007/0
Impact Factor Value 4.046 e-ISSN: 2456-3463
International Journal of Innovations in Engineering and Science, Vol 5, No.01, 2020 www.ijies.net
15
Table 6: Rotation shear wall plastic of samples at hazard level of design-basis extreme earthquake hazard for different floors
DB
E H
azar
d le
vel
snoisnemiD gninepO
6/0×1
snoisnemiD gninepO
9/0×1
snoisnemiD gninepO
6/0×2
snoisnemiD gninepO
9/0×2
sro
olF
Dis
pla
cem
ent
1 (
cm)
Dis
pla
cem
ent
2 (
cm)
no
itat
oR
cit
salP
1
Dis
pla
cem
ent
1 (
cm)
Dis
pla
cem
ent
2 (
cm)
no
itat
oR
cit
salP
1
Dis
pla
cem
ent
1 (
cm)
Dis
pla
cem
ent
2 (
cm)
no
itat
oR
cit
salP
1
Dis
pla
cem
ent
1 (
cm)
Dis
pla
cem
ent
2 (
cm)
no
itat
oR
cit
salP
1
1 5/4 36/1- 010/0 6/4 32/1- 010/0 78/4 18/1- 010/0 53/4 58/1- 010/0
2 14/5 57/1- 011/0 27/5 52/1- 011/0 4/5 39/1- 011/0 08/5 63/1- 011/0
3 68/5 74/1- 012/0 82/5 7/1- 013/0 9/5 56/1- 012/0 53/5 79/1- 012/0
4 91/5 86/1- 013/0 05/6 82/1- 013/0 12/6 69/1- 013/0 7/5 9/1- 013/0
5 18/6 95/1- 014/0 33/6 9/1- 014/0 38/6 78/1- 014/0 92/5 98/1- 013/0
6 24/6 99/1- 014/0 4/6 95/1- 014/0 45/6 82/1- 014/0 96/5 02/2- 013/0
7 24/6 2- 014/0 4/6 96/1- 014/0 45/6 83/1- 014/0 96/5 03/2- 013/0
8 24/6 01/2- 014/0 4/6 97/1- 014/0 45/6 83/1- 014/0 96/5 03/2- 013/0

Impact Factor Value 4.046 e-ISSN: 2456-3463
International Journal of Innovations in Engineering and Science, Vol 5, No.01, 2020 www.ijies.net
16
5-2 Nonlinear Dynamic Analysis
Dynamic time history analysis for steel structures with
coupled shear wall system with opening dimensional
change in 3D was performed under distant and near fault
records. The coupling acceleration of the selected
mappings was scaled according to the following to
Iranian Code . [17]
1. All mapping acceleration is scaled to its maximum
value. This means that the maximum acceleration of
them all equals the acceleration of gravity g.
2. The acceleration response spectrum of each pair of
scaled acceleration mappings is determined by applying
a damping ratio of 5%.
3. Response spectra of each coupled acceleration
mapping using the combined square root method and
make a single compound spectrum for each pair.
4. Hybrid response spectra of the three mapped
acceleration pairs, averaged and compare the T2 / 0 and
T5 / 1 alternation times with the standard design
spectrum. Determine the scale coefficient such that the
average values in any situation would not less than 1.4
times that of the standard range. T is the main periodic
time of the building.
5. The specified scale factor shall be multiplied by the
acceleration of the scaled mappings in paragraph 1 and
used in dynamic analysis.
By performing dynamic time history analysis for
structures listed under the acceleration of earthquake
mapping Kobe – Japan as the nearest field obtained
maximum values of relative displacement, absolute,
floor shear and base shear that the frame with grid D the
examples of the results are shown in Tables 7, 8 and 9
and Figures 6 and 7.
According to the tables and diagrams below, the relative
and absolute displacements of the floors increase with
increasing opening dimensions. Also, the shear rate of
the floors and the base shear decreases with decreasing
opening dimensions, indicating that opening dimensions
has highly influence in seismic behavior of the coupled
shear wall.
Table 7: Maximum relative displacement of floors
with opening dimension changes
Maximum
Relative
Displacem
ent
(cm)
gninepO
snoisnemiD
6/0×1
gninepO
noisnemiD
s
9/0×1
gninepO
oisnemiD
sn
6/0×2
gninepO
isnemiD
sno
9/0×2
Floor 1st 44/0 47/0 54/0 53/0
Floor 2nd 46/0 48/0 6/0 63/0
Floor 3rd 6/0 64/0 64/0 65/0
Floor 4th 68/0 79/0 78/0 86/0
Floor 5th 73/0 84/0 8/0 92/0
Floor 6th 81/0 89/0 95/0 11/1
Floor 7th 85/0 1 1 16/1
Floor 8th 9/0 09/1 08/1 24/1
Table 8: Maximum absolute displacement of floors with
opening dimension changes
Maximum
Absolute
Displace
ment
(cm)
gninepO
snoisnemiD
6/0×1
gninepO
noisnemiD
s
9/0×1
gninepO
snoisnemiD
6/0×2
ninepO
g
snemiD
snoi
9/0×2
Floor 1st 44/0 47/0 54/0 53/0
Floor 2nd 9/0 95/0 14/1 16/1
Floor 3rd 5/1 59/1 78/1 81/1
Floor 4th 18/2 38/2 56/2 67/2
Floor 5th 91/2 22/3 36/3 59/3
Floor 6th 72/3 11/4 31/4 7/4
Floor 7th 57/4 11/5 31/5 86/5
Floor 8th 47/5 2/6 39/6 1/7

Impact Factor Value 4.046 e-ISSN: 2456-3463
International Journal of Innovations in Engineering and Science, Vol 5, No.01, 2020 www.ijies.net
17
Table 9: Shear on floors with opening dimensions changes
Shear
on
Floors
(t)
gninepO
noisnemid
6/0×1
gninepO
noisnemid
9/0×1
gninepO
noisnemid
6/0×2
gninepO
noisnemid
9/0×2
Floor
1st 124 138 148 171
Floor
2nd 118 128 135 156
Floor
3rd 108 120 127 141
Floor
4th 95 110 119 139
Floor
5th 88 96 110 130
Floor
6th 73 89 101 121
Floor
7th 65 77 93 110
Floor
8th 49 65 83 98
(A)
(B)
Figure 6: Comparison of displacement floors with opening
dimensions changes a) Relative displacement b) Absolute
displacement
Figure
7: Comparison of shear on floors with opening dimension
changes
In order to compare the seismic performance of the
frames, the maximum mean values of displacement were
calculated based on near and far fault records, an
example of curve which is shown in Fig. 8. As shown in
the figure below, Maximum values of midrange
structural displacement with opening dimensions of
2x0.9 in relation to structures with opening dimensions
of 1x0.6 under both far and near fault sets on the lower
and middle floors are about 2% higher, indicating that
the impacts it was not so noticeable.
(A)
(B)
Figure 8: Comparison of maximum measure of displacement
between frame with coupled shear wall with opening
dimensions of 1x0.6 and 2x 0.9 a) In far-fault records b) In
near-fault records

Impact Factor Value 4.046 e-ISSN: 2456-3463
International Journal of Innovations in Engineering and Science, Vol 5, No.01, 2020 www.ijies.net
18
CONCLUSION
The results of the analysis of intermediate steel
structures with the coupled shear wall system with
considering changes of opening dimensions showed that:
•The relative and absolute displacements of the floors
increase with the increase in the opening dimensions.
Also, the amount of shear on the floors and the base
shear is reduced by decreasing the opening dimensions,
which indicates the large effect of the opening
dimensions on the seismic behavior of the coupled shear
wall with considering the performance levels of the
frame.
•The performance level of all frames was within the
design earthquake hazard level, in the area of lifesafety
and in the extreme earthquake hazard level, in the
collapse prevention.
•By increasing the opening dimensions, the stress around
them as well as the wall foot is about 2% higher at
similar performance levels. In addition, as the opening
dimensions increase, the maximum stress extends to the
upper floors relative to the walls of the smaller ones.
•The average maximum displacement of the frames
under the near-fault records is about 25% higher than the
far-fault records.
•The maximum displacement of the frame with the
dimensions of 2x0.9 under the near and far records was
2% more than that of the frame with dimensions of
1x0.6. Therefore, the effect of increasing the assumed
opening on the seismic performance of the frames is
negligible and can be ignored.
•By increasing the opening dimensions from 1x0.6 to
1x0.9 in the shear wall, the ultimate strength does not
change to some extent but with the further increase in
the opening dimensions, the ultimate strength of the
frames has finally been reduced to 2.5%.
REFERENCES
[1] Gholhaki, Majid and Ghadkesar, Muhammad Bagher.
(2018). Evaluation the performance of link beam length
under nonlinear dynamic analysis in the coupled steel
shear wall system with rigid joint. Journal of Ferdosi
Civil Engineering, Vol. 30,No. 2, page (19-32).
[2] Poursha, M.Khoshnoudian, F.and Moghadam, AS.
(2009). A consecutive modal pushover procedure for
estimating the seismic demands of tall buildings.Journal
of Engineering Structures, Vol. 31, page(591–599).
[3] Razaz, Seyyed Mostafa. and Shariatmadar, Hashem.
(2016). Evaluation the behavior of the coupled shear wall
under the effect of near-fault earthquakes. Journal of
Ferdosi Civil Engineering, Vol. 27,No. 1, page(1-16).
[4] Rahgozar, Reza. Saffari, Hamed and Khani, Ahmad
Sadegh. (2003). Determination of parametric stress
distribution functions for approximation stress in the
coupled shear wall. The First Conference on
Immunization and Structures Rehabilitation, City: Tehran,
Vol. 1.
[5] Barkhordari, Mohammad Ali.Hossein Zadeh, Seyyed Ali
Asghar and Sedighi, Mahdi. (2017). Evaluation of the
behavior of steel shear walls with strengthen opening.
Journal of SharifCivil, Vol. 2/32, No. 1/2, page (79-89).
[6] Sharbatdari, Mohammad Kazem. Shayani, Ehsan. and
Khairuddin, Ali. (2019) Laboratory evaluation of the
behavior of the coupled shear wall using the reinforced
fiber concrete HPFRCC in link beam with different
reinforcement arrangement. Journal of Sharif Civil, Vol.
2/34, No. 2/2, page (3-13).
[7] Gholikhani, Morteza and Hatami, Shahabeddin. (2016).
Lateral behavior of the cold-rolled steel shear walls with
steel plate cover using finite element method Journal of
Modeling in Engineering, Vol. 13, No. 40, page (129-
150).
[8] Shayanfar, Mohsen Ali. Raissi Dehkordi, Morteza,
Rezaian, Alireza and Gohar Rokhi, Ali. (2018) Evaluation
of steel shear wall based on plastic design based on
performance. Journal of Modeling in Engineering. Vol.
15, No. 51, page (40-40).
[9] Sharbatdar, Mohammad Kazem. Khosrowabadi,
Mohammad.(2019). Evaluation the adequacy of codes for
seismic design of shear walls with steel plate with
geometric and physical variables Journal of Modeling in
Engineering, Vol. 16, No. 52,page (24-24).
[10] Tabesh pour, Mohammad Reza. (2018) Nonlinear
analysis of structures. Edition 3. City Published: Fadak
Isatis- Iran. page (1-340).
[11] Taghinezhad, Ramin, (2017) Seismic design and
rehabilitation of structures based on performance level
with SAP2000 and ETABSE pushover analysis. Edition 5.
City Published: Academic Books- Iran.page (1-388).
[12] ( 2006) Seismic Design Code for Buildings. Ministry of
Interior: Taipei, Taiwan.
[13] Xinzheng, Lu.Xiao, Lu. Guan, H. Zhang, W.and Lieping,
Ye. (2013). Earthquake-induced collapse simulation of a
super-tall mega-braced frame-core tube building. Journal
of Constructional Steel Research. Vol. 82,page (59–71).
[14] Yeganeh Keyvani, Forough. Tahghighi, Hossien and
Roshanai, Ahmad (2017) Seismic analysis of wicker cable
bridges using dynamictime history and nonlinear static
methods. 9th National Civil Engineering Congress.
[15] Next Generation Attenuation of Ground Motions (Nga)
Project (2006). http://Peer. Berkeley. Edu\nga\(Accessed
10 October 2006).
[16] Baker, JW.(2007).Plots of Identi_ed Velocity Pulses.
Department of Civil and Environmental Engineering.
Stanford University, Stanford, CA 94305, USA.
[17] ](2015). Code for designing buildings against earthquake-
Standard 2800-05. Edition 20. City Published: Building
and Housing Research Centre.
Recommended