ESE 471 – Energy Storage Systems
SECTION 6: BATTERY BANK SIZING PROCEDURES
K. Webb ESE 471
2
Batteries for Stationary Applications
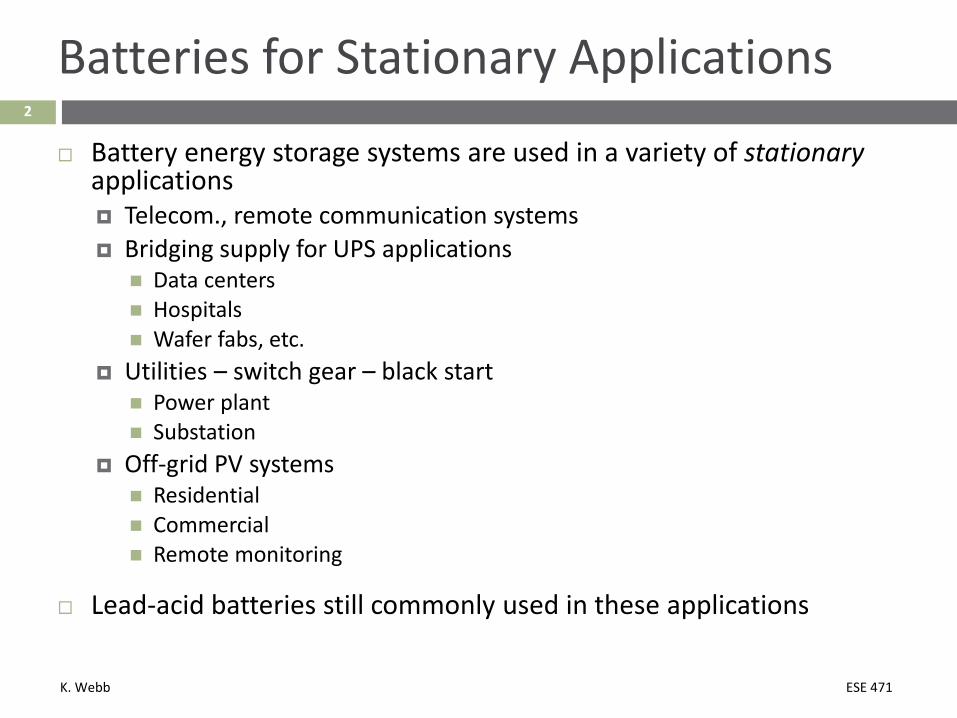
Battery energy storage systems are used in a variety of stationaryapplications Telecom., remote communication systems Bridging supply for UPS applications
Data centers Hospitals Wafer fabs, etc.
Utilities – switch gear – black start Power plant Substation
Off-grid PV systems Residential Commercial Remote monitoring
Lead-acid batteries still commonly used in these applications
K. Webb ESE 471
3
Autonomy
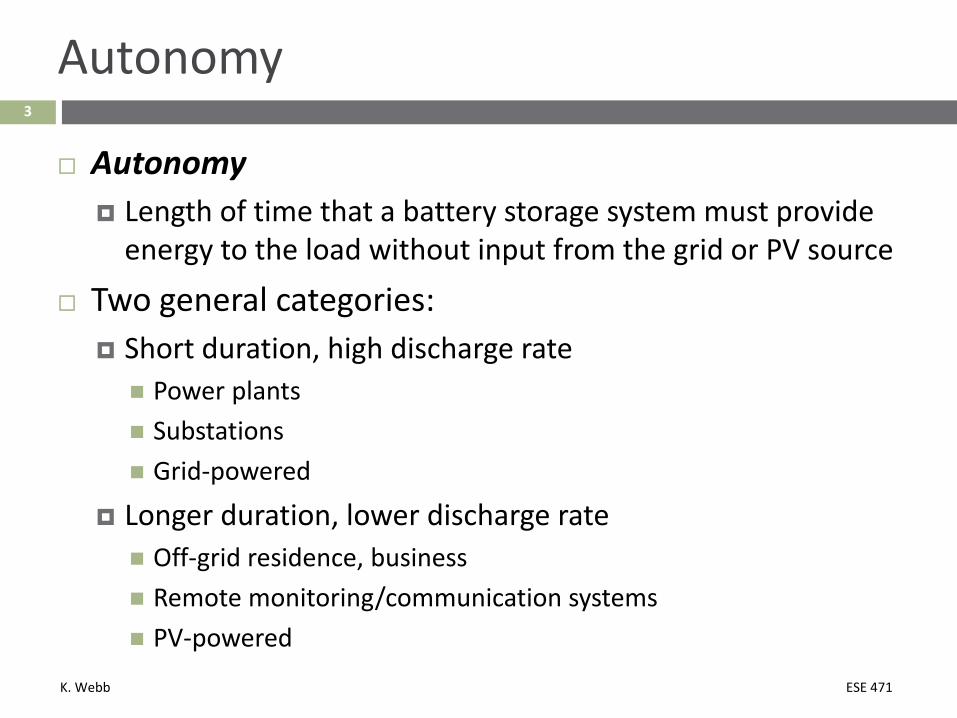
Autonomy Length of time that a battery storage system must provide
energy to the load without input from the grid or PV source
Two general categories: Short duration, high discharge rate Power plants Substations Grid-powered
Longer duration, lower discharge rate Off-grid residence, business Remote monitoring/communication systems PV-powered

K. Webb ESE 471
4
Battery Bank Sizing Standards
Two IEEE standards for sizing lead-acid battery banks for stationary applications
IEEE Std 485 IEEE Recommended Practice for Sizing Lead-Acid Batteries for
Stationary Applications Short duration, high discharge rate
IEEE Std 1013 IEEE Recommended Practice for Sizing Lead-Acid Batteries for
Stand-Alone Photovoltaic Systems Longer duration, lower discharge rate
We’ll look first at the common considerations for both standards before
K. Webb ESE 471
5
Basic Battery Sizing Approach
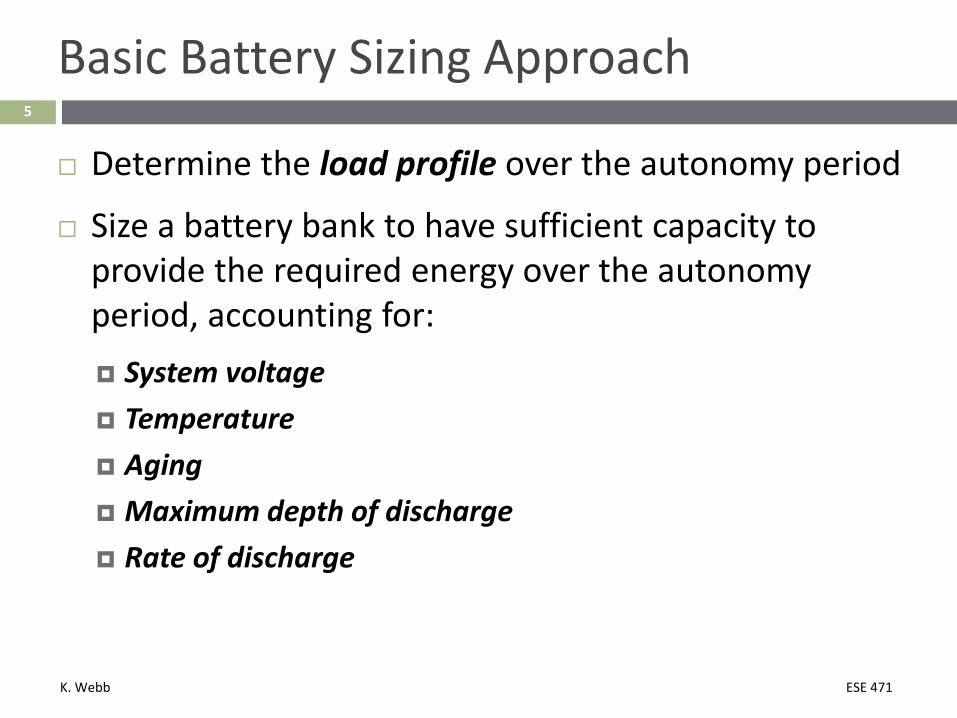
Determine the load profile over the autonomy period
Size a battery bank to have sufficient capacity to provide the required energy over the autonomy period, accounting for: System voltage Temperature Aging Maximum depth of discharge Rate of discharge

K. Webb ESE 471
Common Battery-Sizing Considerations6

K. Webb ESE 471
7
Duty Cycle
Tabulate and, possibly, plot system loads over the autonomy period Duty-cycle diagram (plot) often more useful for shorter
duration, higher current applications
For example, consider a 2-hr autonomy period with the following loads:
Load # Current (A) tstart (min) T (min)
1 5 0 120
2 30 15 10
3 10 25 75
4 40 100 10

K. Webb ESE 471
8
Duty-Cycle Diagram
Load # Current (A) tstart (min) T (min)
L1 5 0 120
L2 30 15 10
L3 10 25 75
L4 40 100 10

K. Webb ESE 471
9
Duty-Cycle Diagram
Total energy (actually, charge) required by the load over the autonomy period is the area under the curve Sizing procedures map the load profile to a battery capacity
capable of supplying the load

K. Webb ESE 471
10
Constant-Current vs. Constant-Power Loads
Typically easiest to deal with constant-current loads Convert constant-power loads to constant current
Approximate, because battery voltage decreases during discharge
Use a minimum voltage to provide a conservative estimate
𝐼𝐼 =𝑃𝑃
𝑉𝑉𝑚𝑚𝑚𝑚𝑚𝑚
𝑉𝑉𝑚𝑚𝑚𝑚𝑚𝑚 can be either the manufacturer’s recommended minimum voltage or 95% of the nominal voltage
K. Webb ESE 471
11
System Voltage
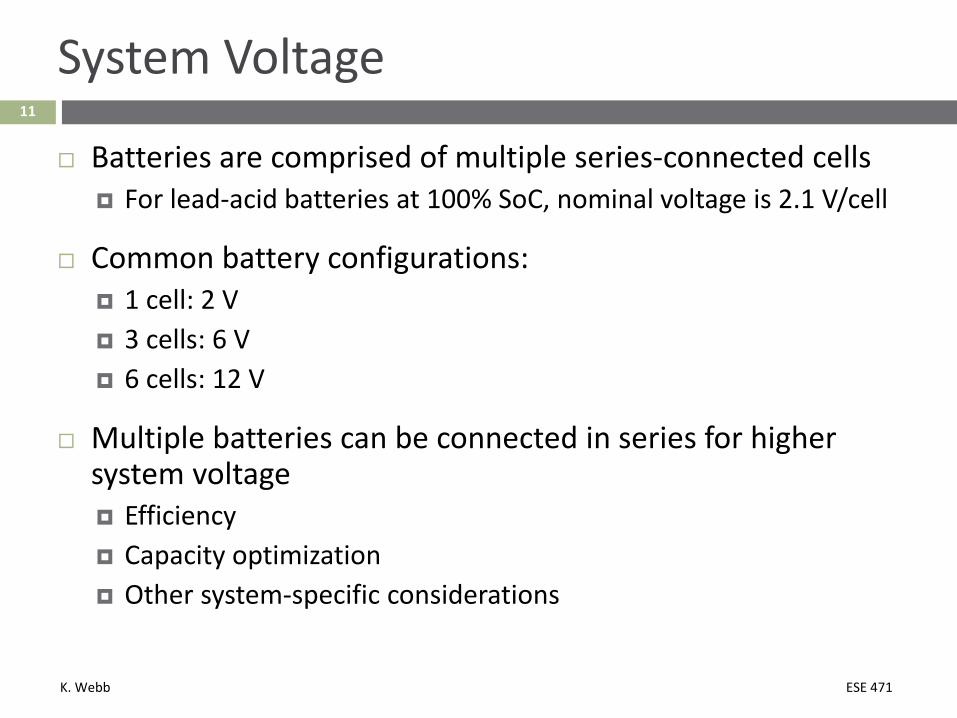
Batteries are comprised of multiple series-connected cells For lead-acid batteries at 100% SoC, nominal voltage is 2.1 V/cell
Common battery configurations: 1 cell: 2 V 3 cells: 6 V 6 cells: 12 V
Multiple batteries can be connected in series for higher system voltage Efficiency Capacity optimization Other system-specific considerations
K. Webb ESE 471
12
Operating Temperature
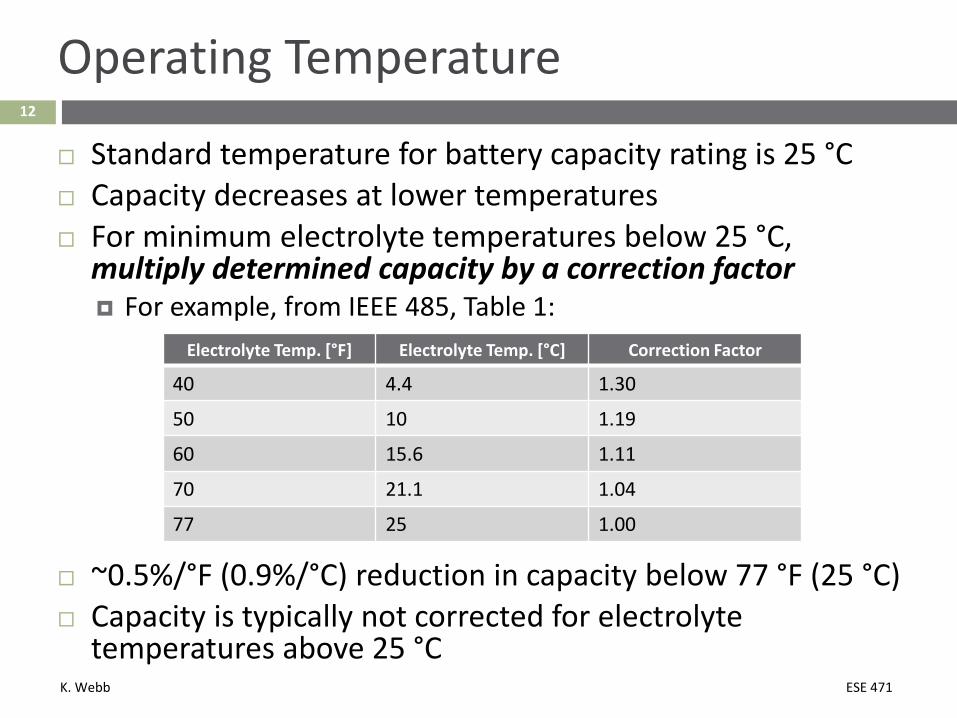
Standard temperature for battery capacity rating is 25 °C Capacity decreases at lower temperatures For minimum electrolyte temperatures below 25 °C,
multiply determined capacity by a correction factor For example, from IEEE 485, Table 1:
Electrolyte Temp. [°F] Electrolyte Temp. [°C] Correction Factor
40 4.4 1.30
50 10 1.19
60 15.6 1.11
70 21.1 1.04
77 25 1.00
~0.5%/°F (0.9%/°C) reduction in capacity below 77 °F (25 °C) Capacity is typically not corrected for electrolyte
temperatures above 25 °C
K. Webb ESE 471
13
Aging
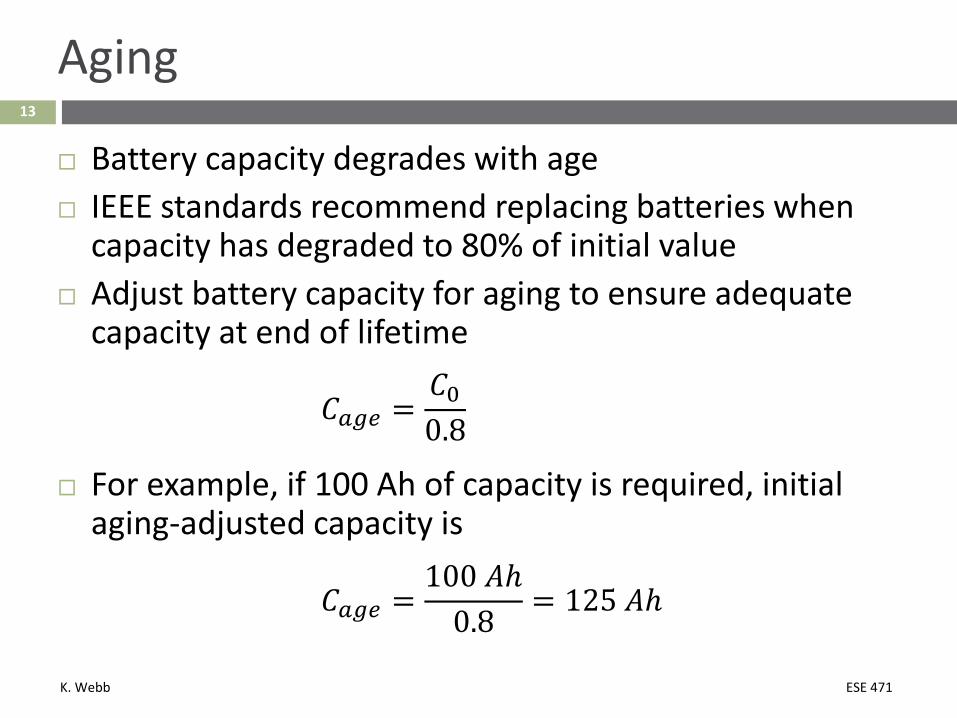
Battery capacity degrades with age IEEE standards recommend replacing batteries when
capacity has degraded to 80% of initial value Adjust battery capacity for aging to ensure adequate
capacity at end of lifetime
𝐶𝐶𝑎𝑎𝑎𝑎𝑎𝑎 =𝐶𝐶00.8
For example, if 100 Ah of capacity is required, initial aging-adjusted capacity is
𝐶𝐶𝑎𝑎𝑎𝑎𝑎𝑎 =100 𝐴𝐴𝐴
0.8= 125 𝐴𝐴𝐴

K. Webb ESE 471
14
Maximum Depth of Discharge
For many battery types (e.g. lead acid), lifetime is affected by maximum depth of discharge (DoD) Higher DoD shortens lifespan Tradeoff between lifespan and unutilized capacity
Calculated capacity must be adjusted to account for maximum DoD Divide required capacity by maximum DoD
𝐶𝐶𝐷𝐷𝐷𝐷𝐷𝐷 =𝐶𝐶0𝐷𝐷𝐷𝐷𝐷𝐷
For example, if 100 Ah is required, but DoD is limited to 60%, the required capacity is
𝐶𝐶𝐷𝐷𝐷𝐷𝐷𝐷 =100 𝐴𝐴𝐴
0.6 = 167 𝐴𝐴𝐴

K. Webb ESE 471
15
Battery Capacity vs. Rate of Discharge
Consider two different 10-hour duty cycle diagrams:
Equal energy requirements:𝐸𝐸1 = 20 𝐴𝐴 ⋅ 10 𝐴 = 200 𝐴𝐴𝐴𝐸𝐸2 = 50 𝐴𝐴 ⋅ 2 𝐴 + 50 𝐴𝐴 ⋅ 2 𝐴 = 200 𝐴𝐴𝐴
But, different required battery capacities: Battery capacity is a function of discharge rate As discharge rate increases
Losses increase Capacity decreases
K. Webb ESE 471
16
Battery Performance Curves
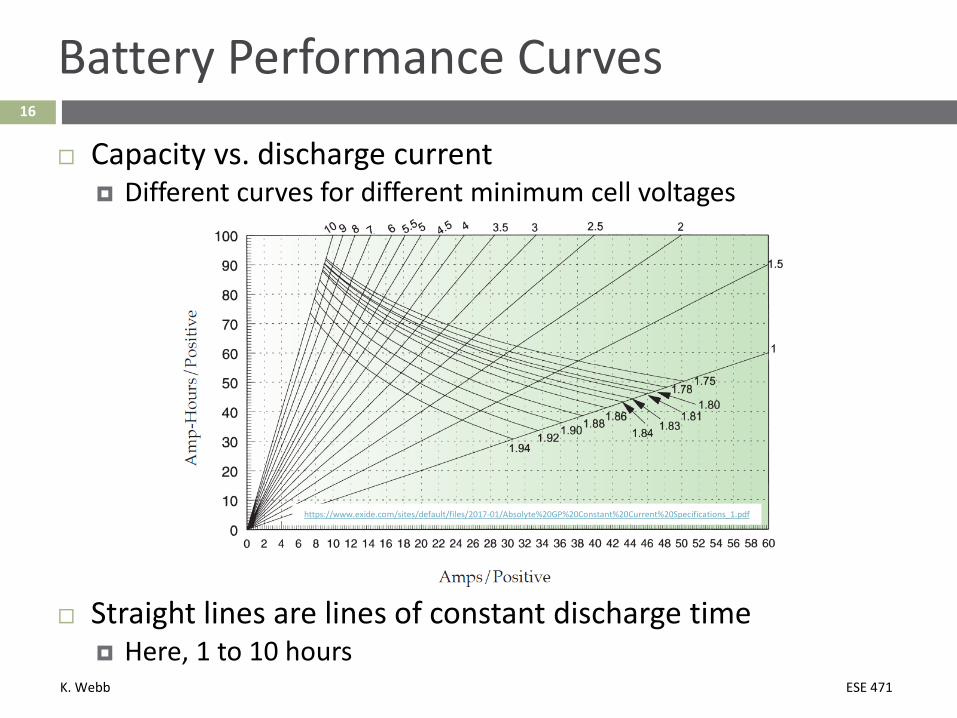
Capacity vs. discharge current Different curves for different minimum cell voltages
Straight lines are lines of constant discharge time Here, 1 to 10 hours
https://www.exide.com/sites/default/files/2017-01/Absolyte%20GP%20Constant%20Current%20Specifications_1.pdf

K. Webb ESE 471
17
Battery Performance Curves
Same cells, 1-60 minute discharge time:
Capacity decreases at higher discharge rates
https://www.exide.com/sites/default/files/2017-01/Absolyte%20GP%20Constant%20Current%20Specifications_1.pdf
K. Webb ESE 471
18
Battery Capacity vs. Rate of Discharge
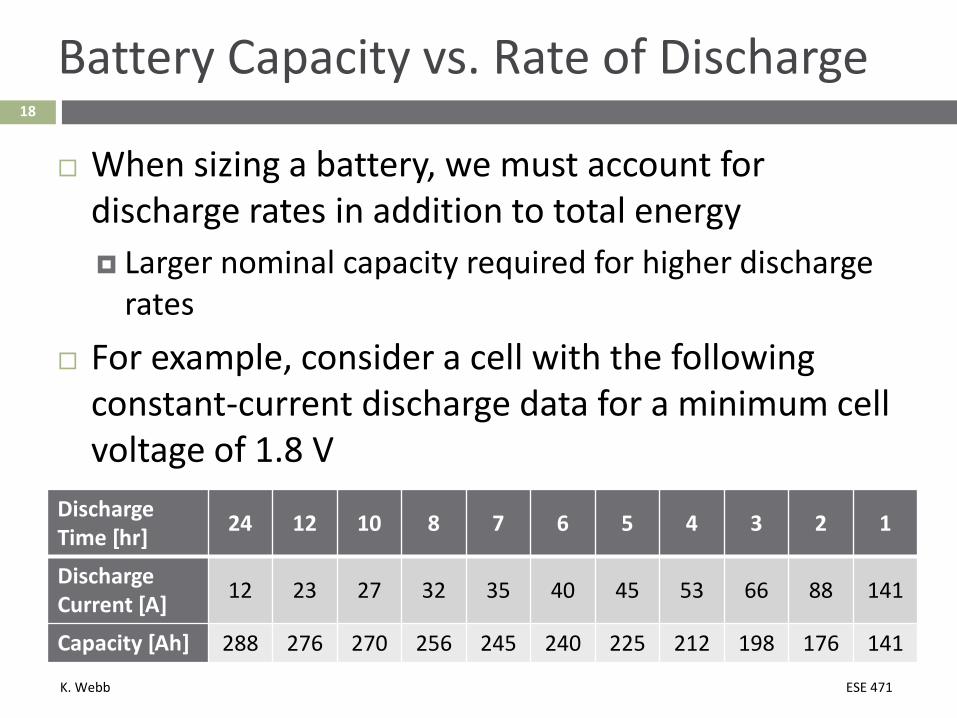
When sizing a battery, we must account for discharge rates in addition to total energy Larger nominal capacity required for higher discharge
rates For example, consider a cell with the following
constant-current discharge data for a minimum cell voltage of 1.8 V
Discharge Time [hr] 24 12 10 8 7 6 5 4 3 2 1
Discharge Current [A] 12 23 27 32 35 40 45 53 66 88 141
Capacity [Ah] 288 276 270 256 245 240 225 212 198 176 141
K. Webb ESE 471
19
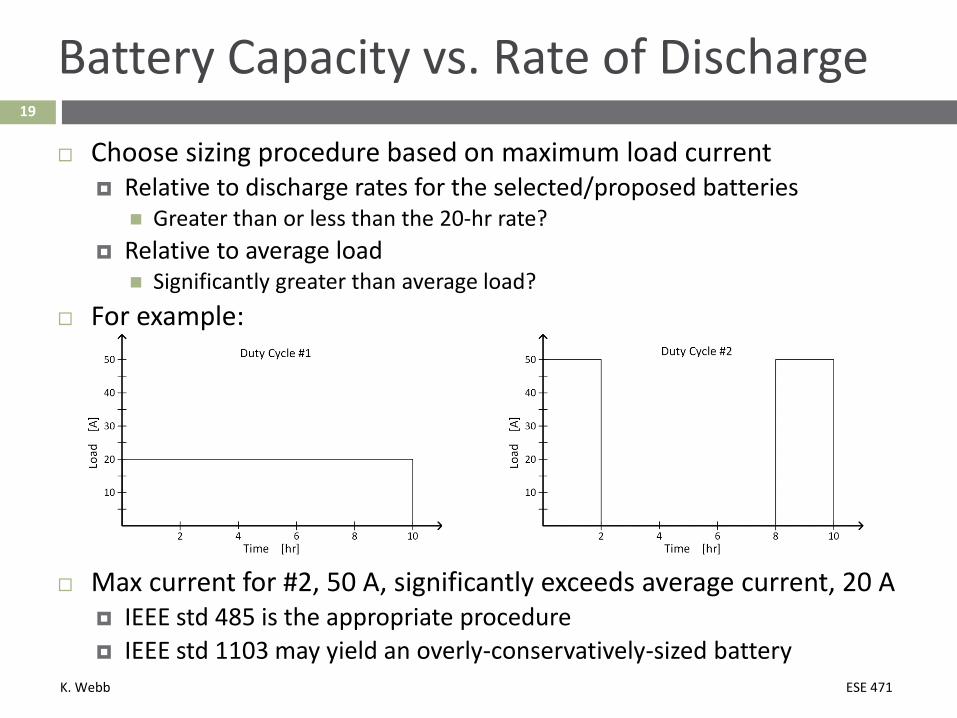
Battery Capacity vs. Rate of Discharge
Choose sizing procedure based on maximum load current Relative to discharge rates for the selected/proposed batteries
Greater than or less than the 20-hr rate? Relative to average load
Significantly greater than average load? For example:
Max current for #2, 50 A, significantly exceeds average current, 20 A IEEE std 485 is the appropriate procedure IEEE std 1103 may yield an overly-conservatively-sized battery
K. Webb ESE 471
20
Battery Capacity vs. Rate of Discharge
Two methods for accounting for reduced capacity at higher discharge rates: Capacity factor, 𝑘𝑘𝑡𝑡 Used in IEEE std 485
Functional hour rate Used in IEEE std 1013
Next, we’ll look at each of these procedures in depth

K. Webb ESE 471
IEEE Std 48521

K. Webb ESE 471
22
IEEE Std 485
IEEE std 485 battery sizing procedure Shorter-duration, higher-current applications Max current greater than 20-hr rate Max current much greater than average current
Common applications: Bridging supply for UPS applications Data centers Hospitals Wafer fabs, etc.
Utilities – switch gear – black start Power plant Substation
K. Webb ESE 471
23
IEEE Std 485 – Tabulate Loads
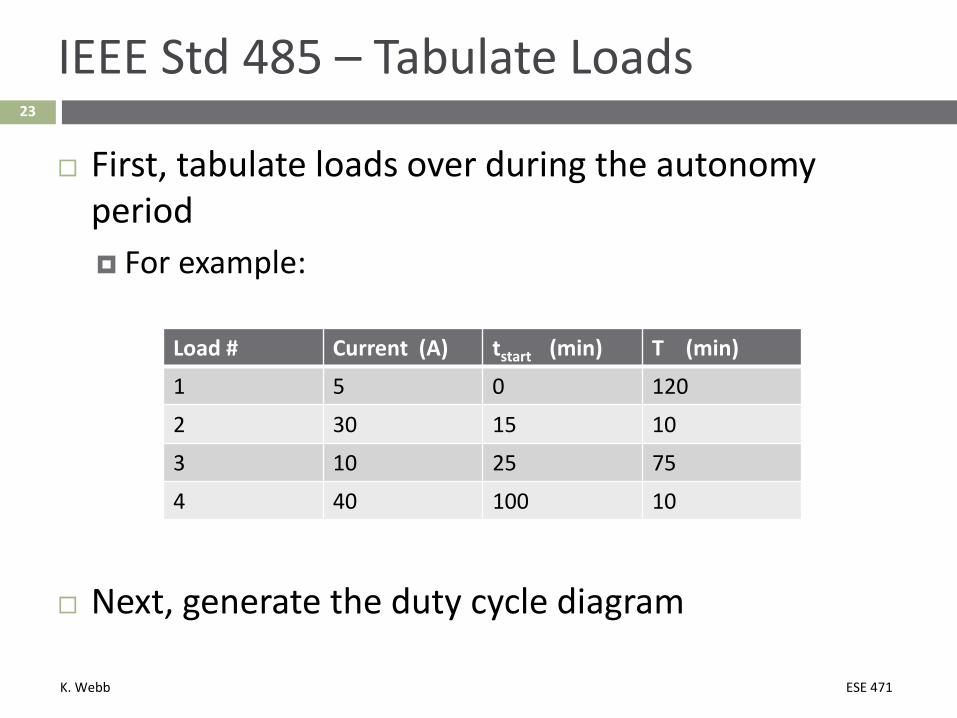
First, tabulate loads over during the autonomy period For example:
Load # Current (A) tstart (min) T (min)
1 5 0 120
2 30 15 10
3 10 25 75
4 40 100 10
Next, generate the duty cycle diagram

K. Webb ESE 471
24
IEEE Std 485 – Duty Cycle Diagram
Duty cycle diagram is divided into periods and sections
Period – a portion of the duty cycle with a constant load, 𝑃𝑃𝑚𝑚
Section – portion of the duty cycle from the beginning of the cycle to the end of each period, 𝑆𝑆𝑗𝑗
K. Webb ESE 471
25
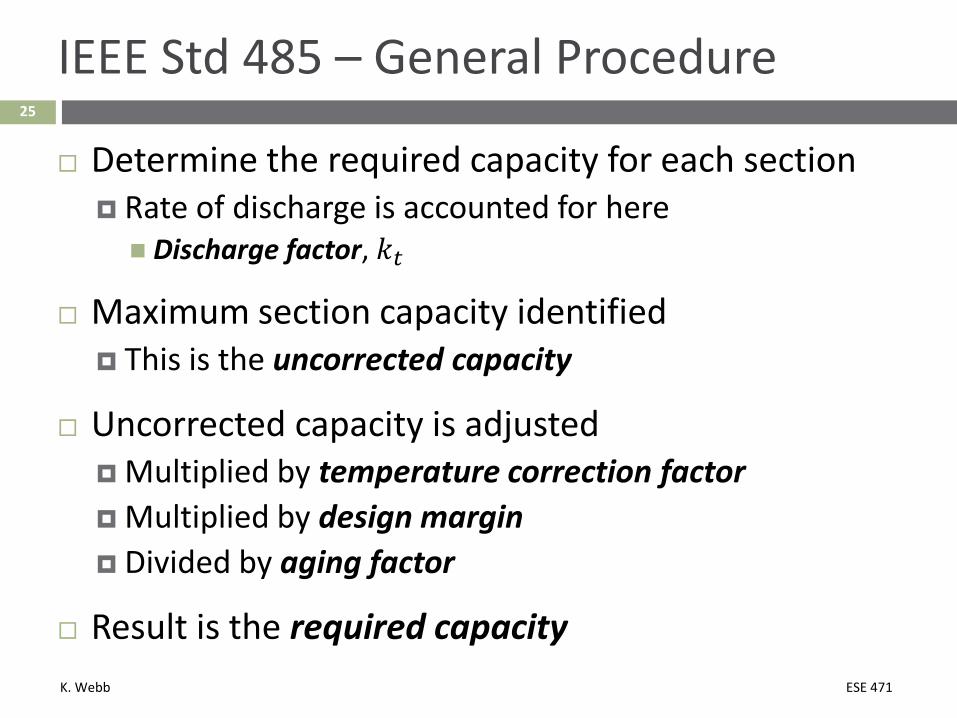
IEEE Std 485 – General Procedure
Determine the required capacity for each section Rate of discharge is accounted for here Discharge factor, 𝑘𝑘𝑡𝑡
Maximum section capacity identified This is the uncorrected capacity
Uncorrected capacity is adjusted Multiplied by temperature correction factor Multiplied by design margin Divided by aging factor
Result is the required capacity
K. Webb ESE 471
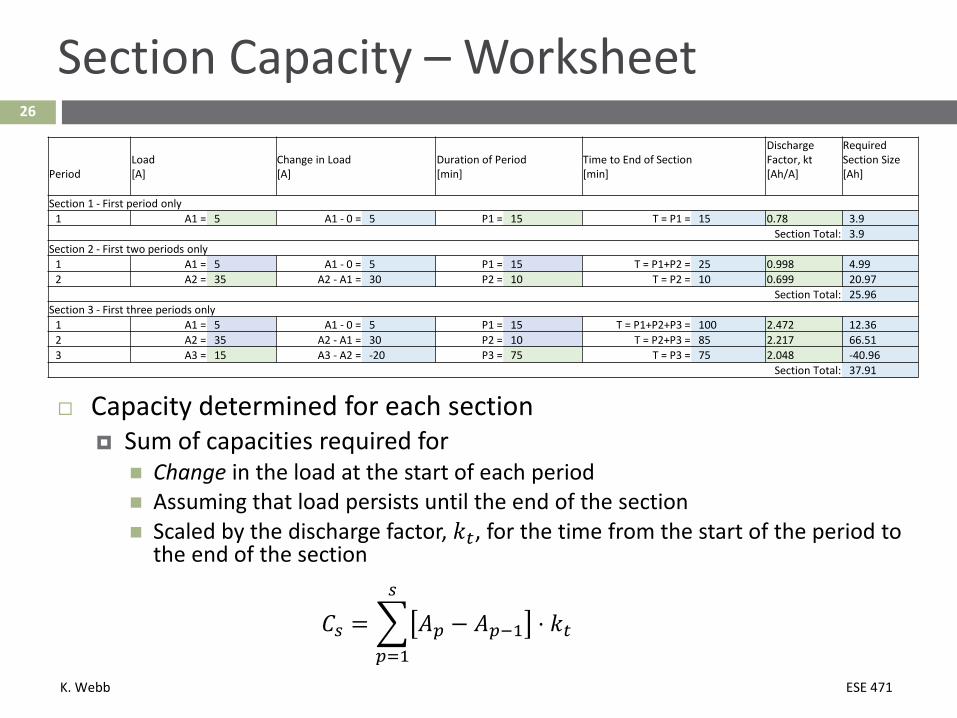
Capacity determined for each section Sum of capacities required for
Change in the load at the start of each period Assuming that load persists until the end of the section Scaled by the discharge factor, 𝑘𝑘𝑡𝑡, for the time from the start of the period to
the end of the section
𝐶𝐶𝑠𝑠 = �𝑝𝑝=1
𝑠𝑠
𝐴𝐴𝑝𝑝 − 𝐴𝐴𝑝𝑝−1 ⋅ 𝑘𝑘𝑡𝑡
26
Section Capacity – Worksheet
PeriodLoad[A]
Change in Load[A]
Duration of Period[min]
Time to End of Section[min]
Discharge Factor, kt[Ah/A]
Required Section Size[Ah]
Section 1 - First period only1 A1 = 5 A1 - 0 = 5 P1 = 15 T = P1 = 15 0.78 3.9
Section Total: 3.9Section 2 - First two periods only
1 A1 = 5 A1 - 0 = 5 P1 = 15 T = P1+P2 = 25 0.998 4.992 A2 = 35 A2 - A1 = 30 P2 = 10 T = P2 = 10 0.699 20.97
Section Total: 25.96Section 3 - First three periods only
1 A1 = 5 A1 - 0 = 5 P1 = 15 T = P1+P2+P3 = 100 2.472 12.362 A2 = 35 A2 - A1 = 30 P2 = 10 T = P2+P3 = 85 2.217 66.513 A3 = 15 A3 - A2 = -20 P3 = 75 T = P3 = 75 2.048 -40.96
Section Total: 37.91
K. Webb ESE 471https://www.exide.com/sites/default/files/2017-01/Absolyte%20GP%20Constant%20Current%20Specifications_1.pdf
27
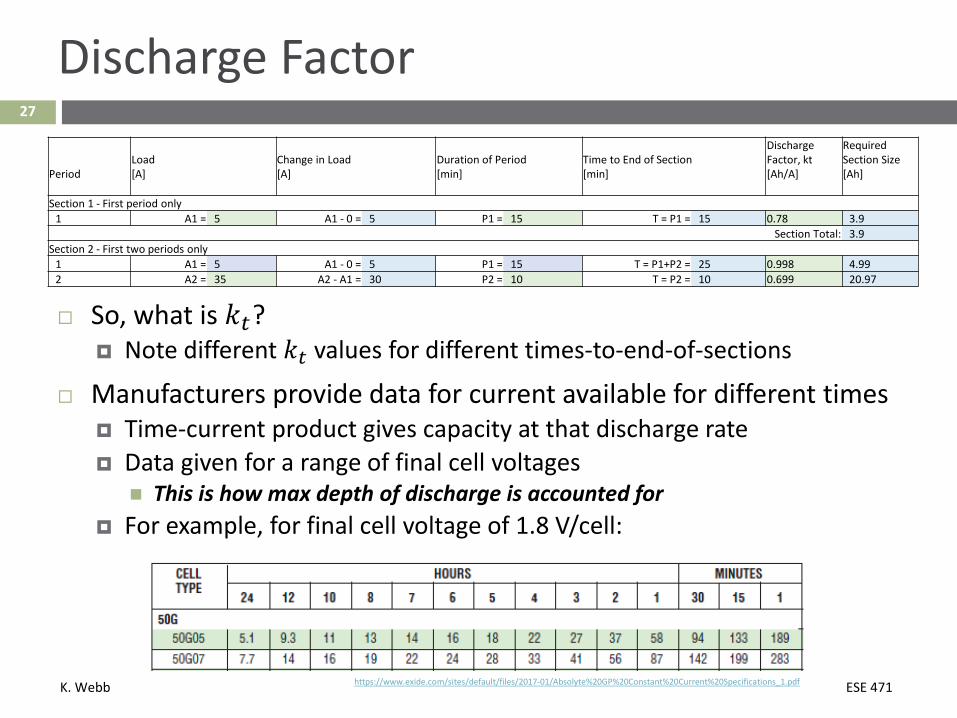
Discharge Factor
So, what is 𝑘𝑘𝑡𝑡? Note different 𝑘𝑘𝑡𝑡 values for different times-to-end-of-sections
Manufacturers provide data for current available for different times Time-current product gives capacity at that discharge rate Data given for a range of final cell voltages
This is how max depth of discharge is accounted for For example, for final cell voltage of 1.8 V/cell:
PeriodLoad[A]
Change in Load[A]
Duration of Period[min]
Time to End of Section[min]
Discharge Factor, kt[Ah/A]
Required Section Size[Ah]
Section 1 - First period only1 A1 = 5 A1 - 0 = 5 P1 = 15 T = P1 = 15 0.78 3.9
Section Total: 3.9Section 2 - First two periods only
1 A1 = 5 A1 - 0 = 5 P1 = 15 T = P1+P2 = 25 0.998 4.992 A2 = 35 A2 - A1 = 30 P2 = 10 T = P2 = 10 0.699 20.97

K. Webb ESE 471
28
Discharge Factor
Discharge factor, 𝑘𝑘𝑡𝑡, for time-to-end-of-section, 𝑇𝑇:
𝑘𝑘𝑡𝑡 =𝐶𝐶𝑚𝑚𝐷𝐷𝑚𝑚 [𝐴𝐴𝐴]𝐴𝐴𝑇𝑇 [𝐴𝐴]
𝐶𝐶𝑚𝑚𝐷𝐷𝑚𝑚: nominal capacity Typ. 8 or 20 hr capacity From manufacturer’s data Arbitrary – used as reference capacity for final sizing For example:
𝐶𝐶𝑚𝑚𝐷𝐷𝑚𝑚 = 50 𝐴𝐴𝐴 (8 hr) Calculated capacity requirement: 150 Ah Required number of cells: 3
𝐴𝐴𝑇𝑇: current available for time-to-end-of-section, 𝑇𝑇 From manufacturer’s data

K. Webb ESE 471
29
Discharge Factor
Consider the following battery data for discharge to 1.8 V/cell:
Let 𝐶𝐶𝑚𝑚𝐷𝐷𝑚𝑚 = 104 𝐴𝐴𝐴 (8 hr capacity) Discharge factor for 1 hr:
𝑘𝑘𝑡𝑡 =𝐶𝐶𝑚𝑚𝐷𝐷𝑚𝑚𝐴𝐴𝑇𝑇
=104 𝐴𝐴𝐴
58 𝐴𝐴 = 1.79 𝐴𝑟𝑟
That is, for 1-hr discharge, size for 1.79 hr using the 8 hr capacity as a reference
Accounts for capacity reduction at high current
Discharge factor for 15 min:
𝑘𝑘𝑡𝑡 =𝐶𝐶𝑚𝑚𝐷𝐷𝑚𝑚𝐴𝐴𝑇𝑇
=104 𝐴𝐴𝐴133 𝐴𝐴 = 0.782 𝐴𝑟𝑟
Linearly interpolate currents for intermediate discharge times
Hours MinutesDischarge time 24 12 10 8 7 6 5 4 3 2 1 30 15 1Discharge current [A] 5.1 9.3 11 13 14 16 18 22 27 37 58 94 133 189Capacity [Ah] 122 112 110 104 98 96 90 88 81 74 58 47 33.3 3.15

K. Webb ESE 471
30
Discharge Factor - ExampleHours Minutes
Discharge time 24 12 10 8 7 6 5 4 3 2 1 30 15 1Discharge current [A] 5.1 9.3 11 13 14 16 18 22 27 37 58 94 133 189Capacity [Ah] 122 112 110 104 98 96 90 88 81 74 58 47 33.3 3.15
Again, let 𝐶𝐶𝑚𝑚𝐷𝐷𝑚𝑚 = 104 𝐴𝐴𝐴 (8 hr capacity) Each battery can provide 13 A for 8 hr
Determine the # of batteries required to supply 100 A for 2 hr (200 Ah) Discharge factor:
𝑘𝑘𝑡𝑡 =𝐶𝐶𝑚𝑚𝐷𝐷𝑚𝑚𝐴𝐴𝑇𝑇
=104 𝐴𝐴𝐴
37 𝐴𝐴= 2.81 𝐴𝑟𝑟
Required capacity:𝐶𝐶 = 𝐴𝐴 ⋅ 𝑘𝑘𝑡𝑡 = 100 𝐴𝐴 ⋅ 2.81 𝐴𝑟𝑟 = 281 𝐴𝐴𝐴
Required number of batteries:
𝑁𝑁 =𝐶𝐶
𝐶𝐶𝑚𝑚𝐷𝐷𝑚𝑚=
281 𝐴𝐴𝐴104 𝐴𝐴𝐴
= 2.7 → 3
Note that failure to account for discharge rate would yield N = 2
K. Webb ESE 471
31
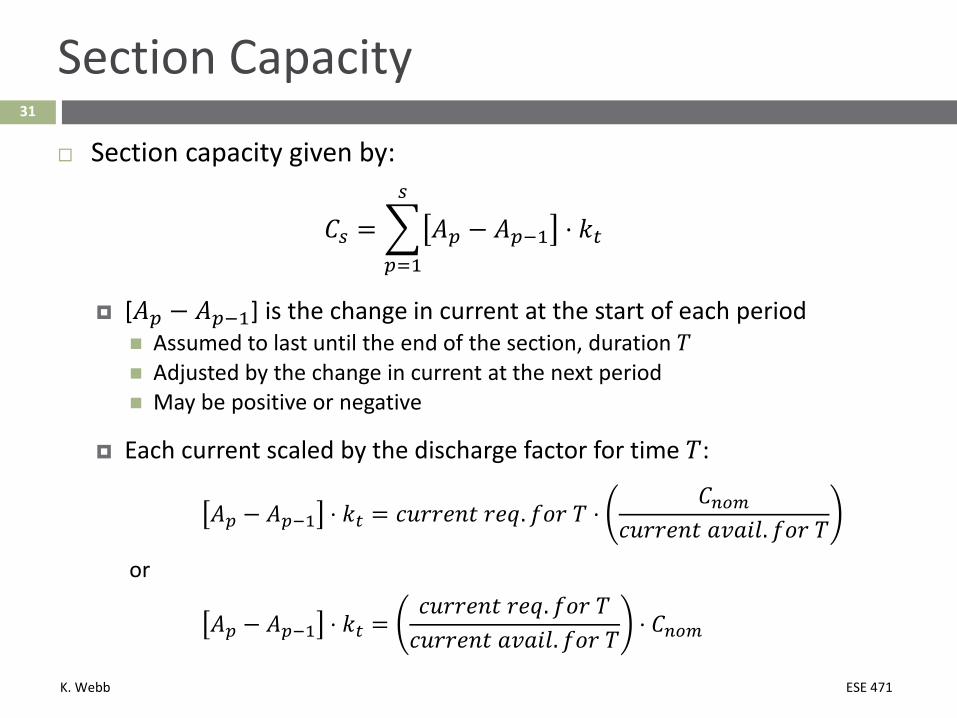
Section Capacity
Section capacity given by:
𝐶𝐶𝑠𝑠 = �𝑝𝑝=1
𝑠𝑠
𝐴𝐴𝑝𝑝 − 𝐴𝐴𝑝𝑝−1 ⋅ 𝑘𝑘𝑡𝑡
[𝐴𝐴𝑝𝑝 − 𝐴𝐴𝑝𝑝−1] is the change in current at the start of each period Assumed to last until the end of the section, duration 𝑇𝑇 Adjusted by the change in current at the next period May be positive or negative
Each current scaled by the discharge factor for time 𝑇𝑇:
𝐴𝐴𝑝𝑝 − 𝐴𝐴𝑝𝑝−1 ⋅ 𝑘𝑘𝑡𝑡 = 𝑐𝑐𝑐𝑐𝑟𝑟𝑟𝑟𝑐𝑐𝑐𝑐𝑐𝑐 𝑟𝑟𝑐𝑐𝑟𝑟. 𝑓𝑓𝐷𝐷𝑟𝑟 𝑇𝑇 ⋅𝐶𝐶𝑚𝑚𝐷𝐷𝑚𝑚
𝑐𝑐𝑐𝑐𝑟𝑟𝑟𝑟𝑐𝑐𝑐𝑐𝑐𝑐 𝑎𝑎𝑎𝑎𝑎𝑎𝑎𝑎𝑎𝑎. 𝑓𝑓𝐷𝐷𝑟𝑟 𝑇𝑇or
𝐴𝐴𝑝𝑝 − 𝐴𝐴𝑝𝑝−1 ⋅ 𝑘𝑘𝑡𝑡 =𝑐𝑐𝑐𝑐𝑟𝑟𝑟𝑟𝑐𝑐𝑐𝑐𝑐𝑐 𝑟𝑟𝑐𝑐𝑟𝑟. 𝑓𝑓𝐷𝐷𝑟𝑟 𝑇𝑇𝑐𝑐𝑐𝑐𝑟𝑟𝑟𝑟𝑐𝑐𝑐𝑐𝑐𝑐 𝑎𝑎𝑎𝑎𝑎𝑎𝑎𝑎𝑎𝑎. 𝑓𝑓𝐷𝐷𝑟𝑟 𝑇𝑇 ⋅ 𝐶𝐶𝑚𝑚𝐷𝐷𝑚𝑚

K. Webb ESE 471
Consider the third section: 𝑘𝑘𝑡𝑡 determined for each 𝑇𝑇 Change in load scaled by 𝑘𝑘𝑡𝑡 to give required capacity for each period within the section
Section capacity is the sum of the period capacities
32
Section Capacity – Worksheet
PeriodLoad[A]
Change in Load[A]
Duration of Period[min]
Time to End of Section[min]
Discharge Factor, kt[Ah/A]
Required Section Size[Ah]
Section 3 - First three periods only1 A1 = 5 A1 - 0 = 5 P1 = 15 T = P1+P2+P3 = 100 2.472 12.362 A2 = 35 A2 - A1 = 30 P2 = 10 T = P2+P3 = 85 2.217 66.513 A3 = 15 A3 - A2 = -20 P3 = 75 T = P3 = 75 2.048 -40.96
Section Total: 37.91

K. Webb ESE 471
33
Uncorrected Capacity
Uncorrected capacity is the largest total section capacity Plus capacity for any random loads
Capacity then adjusted for Temperature Design margin Aging
Result is the required capacity Number of cells required is determined from the required capacity and
the reference capacity
𝑁𝑁 =𝐶𝐶
𝐶𝐶𝑚𝑚𝐷𝐷𝑚𝑚
Note that DoD was accounted for by selecting capacity data for the appropriate final cell voltage
Maximum Section Size +
Random Section Size =
Uncorrected Size
61.445 0 61.445
Uncorrected Size x
Temperature Correction Factor x
Design Margin /
Aging Factor =
Required Capacity [Ah]
61.445 1.19 1.15 0.8 105.11

K. Webb ESE 471
IEEE Std 101334

K. Webb ESE 471
35
IEEE Std 1013
IEEE std 1013 battery sizing procedure Longer-duration, lower-current applications Max current less than 20-hr rate Max current not significantly greater than average
Typically for off-grid PV systems Residential Commercial Remote monitoring

K. Webb ESE 471
36
IEEE Std 1013 – General Procedure
Determine the required autonomy period Load determination
System voltage and allowable range Tabulate loads – daily or over the autonomy period Load profile (duty cycle) diagram
Calculate energy requirement (Ah) over the autonomy period Unadjusted capacity
Adjust capacity for Depth of discharge Aging Temperature Design margin Discharge rate
K. Webb ESE 471
37
Load Determination
Tabulate loads over autonomy period Current Start time and duration Momentary (e.g. motor starting) and running loads
Plot load profile where appropriate Are timing, duration, and coincidence of loads known? If not, determine worst-case scenarios
Determine: Maximum momentary current Maximum running current Total daily load (Ah/day) Maximum and minimum allowable system voltages
K. Webb ESE 471
38
Load Determination – Example
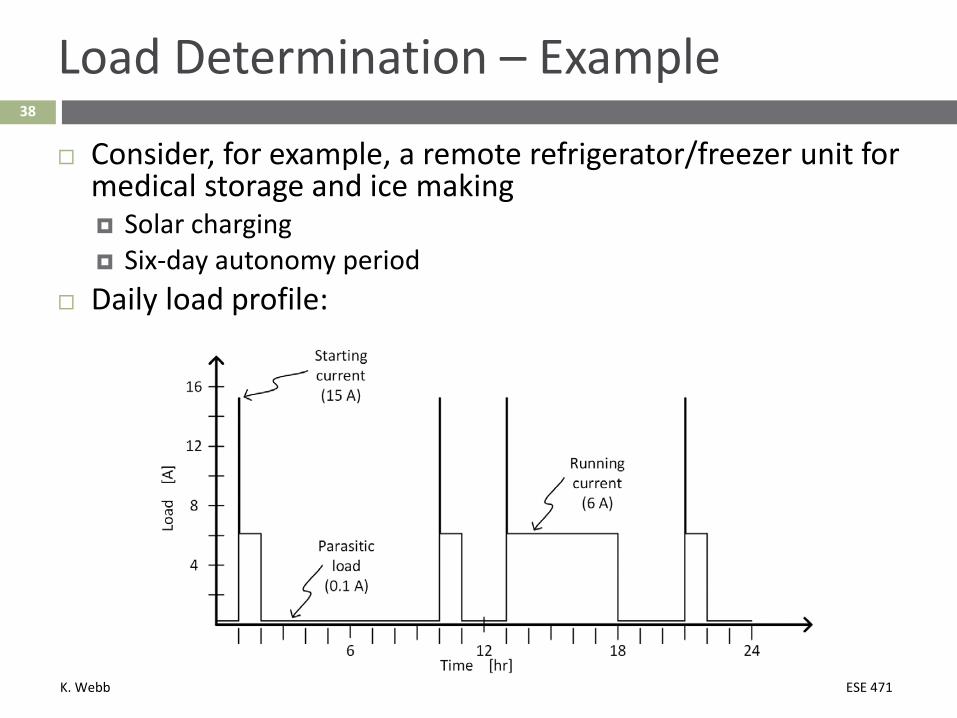
Consider, for example, a remote refrigerator/freezer unit for medical storage and ice making Solar charging Six-day autonomy period
Daily load profile:

K. Webb ESE 471
39
Load Determination – Example
Tabulate the load data, accounting for Running current Starting current Parasitic load current (e.g. control electronics, etc.)
DC load deviceVoltage window Momemtary
currents Running currents Occurances Duration Run Time Daily Load
Vmax [V] Vmin [V] [A] [A] [#/day] [hr/occurance] [hr/day] [Ah/day]Compressor(chill)
15 10.5 6 3 1 3 18
Compressor(ice making)
15 10.5 6 1 5 5 30
Compressor (starting)
15 10.5 15 4 0.0167 0.0667 1
Parasitic load(controls, etc.)
0.1 1 24 24 2.4
Total Daily Load [Ah/day] 51.4
Motor starting currents conservatively assigned durations of one-minute (0.0167 hr)

K. Webb ESE 471
40
Load Determination
Maximum momentary current (line 5a) Motor starting current may be much larger than running current Assumed duration is 1 min Used for total daily load calculation and max current
Maximum running current (line 5b) If load coincidence is unknown, determine worst case Used for total daily load calculation and max current
Maximum current (line 5c) Used when determining minimum system voltage when accounting for
voltage drops
5) Load Data Summarya) Maximum momentary current 15.1 Ab) Maximum running current 6.1 Ac) Maximum current 15.1 A Max lines 5a and 5bd) Total daily load 51.4 Ah/daye) Maximum system voltage 15 Vf) Minimum system voltage 10.5 V
K. Webb ESE 471
41
Load Determination
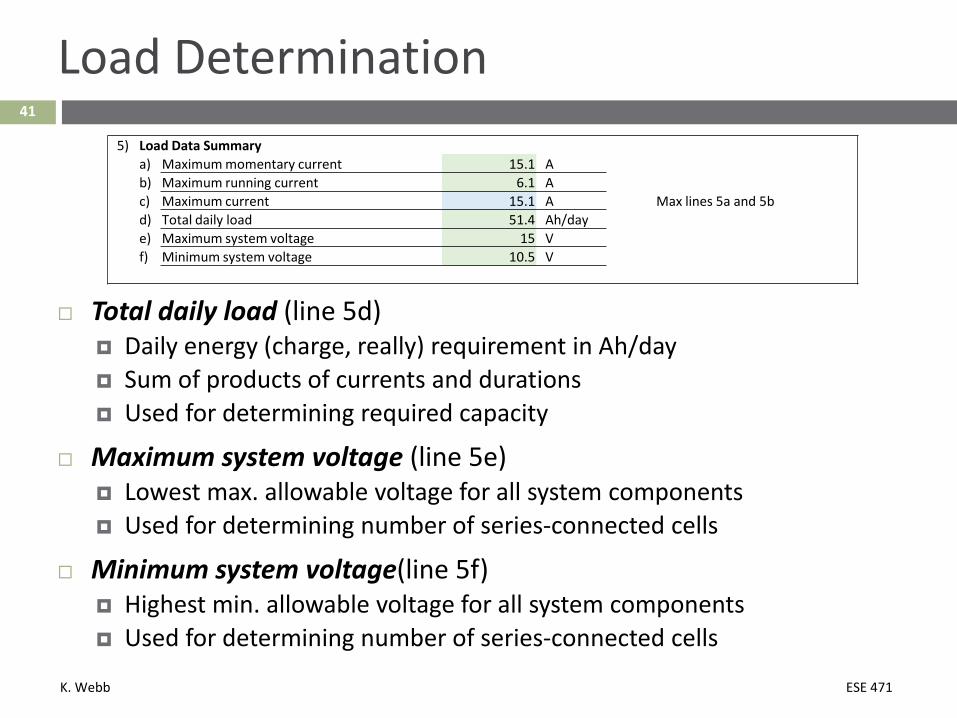
Total daily load (line 5d) Daily energy (charge, really) requirement in Ah/day Sum of products of currents and durations Used for determining required capacity
Maximum system voltage (line 5e) Lowest max. allowable voltage for all system components Used for determining number of series-connected cells
Minimum system voltage(line 5f) Highest min. allowable voltage for all system components Used for determining number of series-connected cells
5) Load Data Summarya) Maximum momentary current 15.1 Ab) Maximum running current 6.1 Ac) Maximum current 15.1 A Max lines 5a and 5bd) Total daily load 51.4 Ah/daye) Maximum system voltage 15 Vf) Minimum system voltage 10.5 V

K. Webb ESE 471
42
Battery Capacity
First, calculate the unadjusted capacity Product of total daily load and number of days of
autonomy
Next, adjust capacity for: Maximum depth of discharge Maximum daily depth of discharge Minimum operating temperature Design margin

K. Webb ESE 471
43
Battery Capacity
Unadjusted capacity (line 6a) Product of total daily load and number of days of autonomy Daily energy (charge, really) requirement in Ah/day
Maximum depth of discharge (MDoD, line 6b) From manufacturer’s data/recommendation Tradeoff between capacity and lifetime
Capacity adjusted for MDoD (line 6c) Unadjusted capacity divided by MDoD
6) Battery Capacitya) Unadjusted capacity 308 Ah line 5d * line 3b) Max DoD 80 %c) Capacity adjusted for MDoD 386 Ah line 6a/line 6bd) Max daily DoD 20 %e) Capacity adjusted for MDDoD 257 Ah line 5d/line 6df) …

K. Webb ESE 471
44
Battery Capacity
Maximum daily DoD (MDDoD, line 6d) From manufacturer’s data/recommendation
Capacity adjusted for MDDoD (line 6e) Total daily load divided by MDDoD
End of life (EoL) capacity (line 6f) Battery to be replace when capacity degrades to this percentage of
rated capacity Typically 80% for lead-acid batteries
Capacity adjusted for EoL (line 6g) Unadjusted capacity divided by EoL capacity
6) Battery Capacityc) … d) Max daily DoD 20 %e) Capacity adjusted for MDDoD 257 Ah line 5d/line 6df) End-of-life capacity 80 %g) Capacity adjusted for EoL 386 Ah line 6a/line 5fh) …

K. Webb ESE 471
45
Battery Capacity
Capacity adjusted for MDoD, MDDoD, or EoL (line 6h) Largest of the three adjusted capacities Satisfies all three requirements
Temperature correction factor (line 6j) Correction factor for minimum electrolyte temperatures below 25 °C Don’t compensate for temperature above 25 °C From manufacturer’s data (or IEEE std 485, Table 1) ~0.5%/°F (0.9%/°C) reduction in capacity below 77 °F (25 °C)
Capacity adjusted for temperature (line 6k) DoD/EoL-adjusted capacity multiplied by temperature correction factor
6) Battery Capacityg) … h) Capacity adjusted for DoD or EoL 386 Ah Max of lines 6c, 6e, and 6gi) Min. operating temperature 25 degCj) Temperature correction factor 1k) Capacity adjusted for temperature 386 Ah line 6h *line 6jl) …

K. Webb ESE 471
46
Battery Capacity
Design margin factor (line 6l) Allows for load uncertainty and growth Typically 10% – 25% (i.e. 1.1 – 1.25)
Capacity adjusted for design margin (line 6m) Temperature-corrected capacity multiplied by design margin
Functional hour rate (line 7) Used to account for discharge rate in final capacity determination A conservative ‘average’ discharge rate for the duty cycle Adjusted capacity divided by the maximum running current
6) Battery Capacityk) … l) Design margin factor 1.1m) Capacity adjusted for design margin 424 Ah line 6k * line 6l
7) Functional Hour Rate 70 hr line 6m/line 5b

K. Webb ESE 471
47
Functional Hour Rate
Functional hour rate Adjusted capacity divided by the max running current The discharge time at the max running current Used to account for capacity dependence on discharge rate An alternative to the discharge factor used in IEEE std 485
For example: Adjusted capacity: 424 Ah Maximum running current: 6.1 A
Functional hour rate = 𝐶𝐶𝑎𝑎𝑎𝑎𝑎𝑎𝐼𝐼𝑚𝑚𝑎𝑎𝑚𝑚
= 424 𝐴𝐴𝐴6.1 𝐴𝐴
= 70 𝐴𝑟𝑟
For final cell selection, use the capacity rating at the functional hour rate

K. Webb ESE 471
48
Voltage Window Adjustment
Controller low-voltage disconnect (LVD, line 8a) Voltage at which the charge controller is set to disconnect the battery from the load Voltage at the maximum DoD
Adjusted minimum voltage (line 8b) Larger of the LVD set point and the minimum allowable system voltage Used when determining number of series-connected cells
Controller full-charge voltage set point (line 8c) Voltage at which the charge controller stops charging the battery Voltage at full SoC
Adjusted maximum voltage (line 8d) Smaller of the controller full-charge set point and the maximum allowable system voltage Used when determining number of series-connected cells
8) Voltage Window Adjustmenta) Controller low-voltage disconnect 10.8 Vb) Adjusted minimum voltage 10.8 V Max of lines 5f and 8ac) Controller full-charge voltage set point 14.7 Vd) Adjusted maximum voltage 14.7 V Min of lines 5e and 8c
K. Webb ESE 471
49
Series-Connected Cells
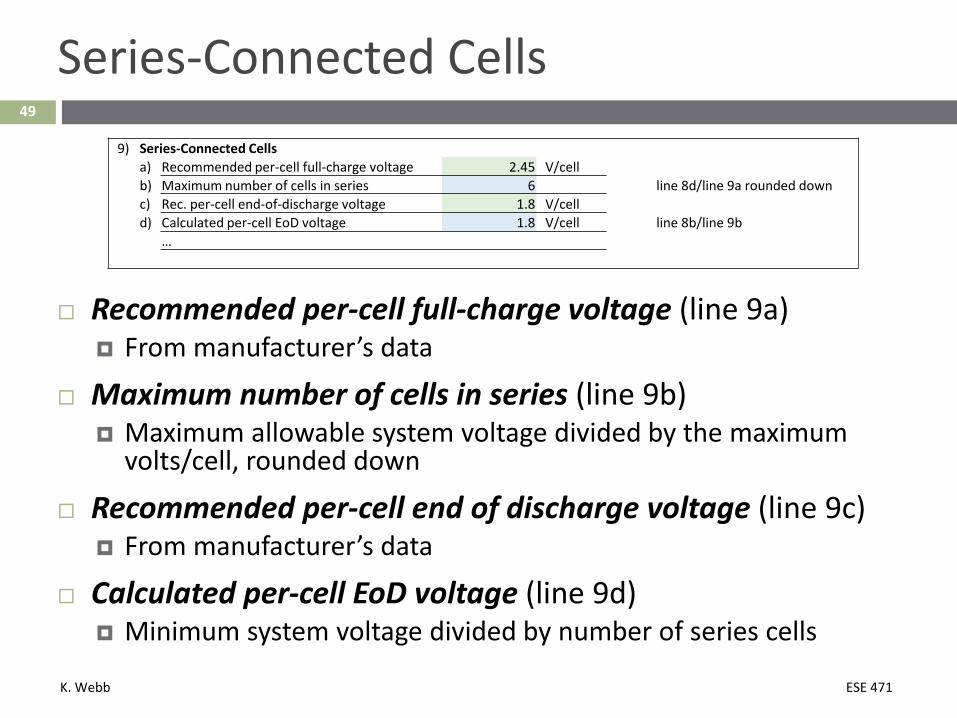
Recommended per-cell full-charge voltage (line 9a) From manufacturer’s data
Maximum number of cells in series (line 9b) Maximum allowable system voltage divided by the maximum
volts/cell, rounded down
Recommended per-cell end of discharge voltage (line 9c) From manufacturer’s data
Calculated per-cell EoD voltage (line 9d) Minimum system voltage divided by number of series cells
9) Series-Connected Cellsa) Recommended per-cell full-charge voltage 2.45 V/cellb) Maximum number of cells in series 6 line 8d/line 9a rounded downc) Rec. per-cell end-of-discharge voltage 1.8 V/celld) Calculated per-cell EoD voltage 1.8 V/cell line 8b/line 9b
…
K. Webb ESE 471
50
Series-Connected Cells
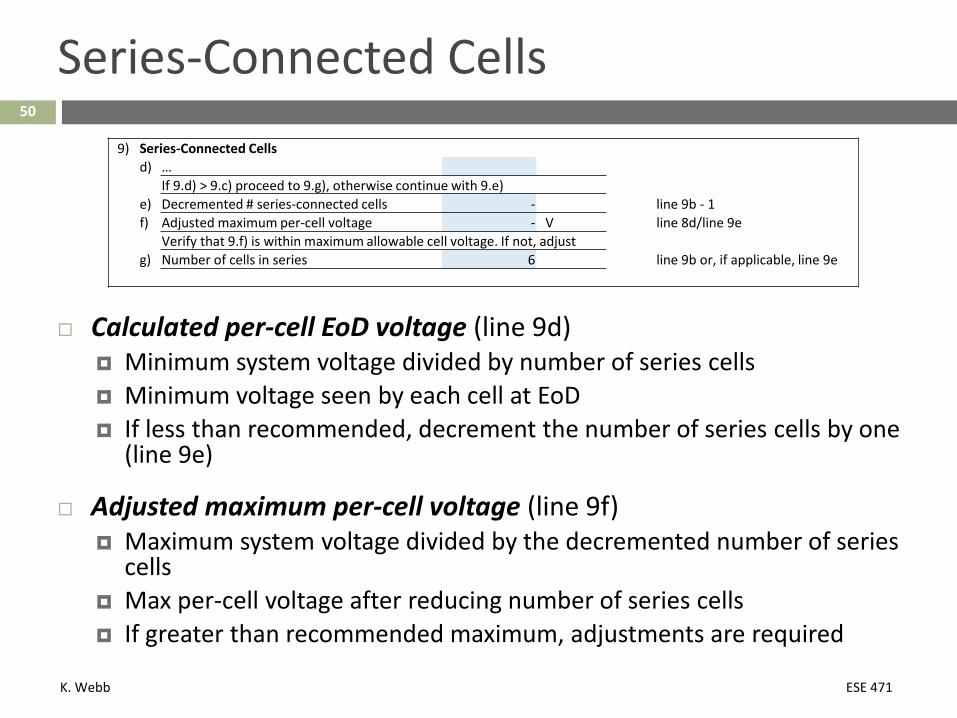
Calculated per-cell EoD voltage (line 9d) Minimum system voltage divided by number of series cells Minimum voltage seen by each cell at EoD If less than recommended, decrement the number of series cells by one
(line 9e)
Adjusted maximum per-cell voltage (line 9f) Maximum system voltage divided by the decremented number of series
cells Max per-cell voltage after reducing number of series cells If greater than recommended maximum, adjustments are required
9) Series-Connected Cellsd) …
If 9.d) > 9.c) proceed to 9.g), otherwise continue with 9.e)e) Decremented # series-connected cells - line 9b - 1f) Adjusted maximum per-cell voltage - V line 8d/line 9e
Verify that 9.f) is within maximum allowable cell voltage. If not, adjustg) Number of cells in series 6 line 9b or, if applicable, line 9e

K. Webb ESE 471
51
Series-Connected Cells
Minimum and maximum per-cell voltages must be within recommended range If not, iteration is required
Adjust some combination of the following: Number of series-connected cells Low-voltage disconnect set point Controller full-charge voltage set point
Number of cells in series (line 9g) The selected number of series cells
9) Series-Connected Cellsd) …
If 9.d) > 9.c) proceed to 9.g), otherwise continue with 9.e)e) Decremented # series-connected cells - line 9b - 1f) Adjusted maximum per-cell voltage - V line 8d/line 9e
Verify that 9.f) is within maximum allowable cell voltage. If not, adjustg) Number of cells in series 6 line 9b or, if applicable, line 9e
K. Webb ESE 471
52
Cell Selection and Capacity Determination
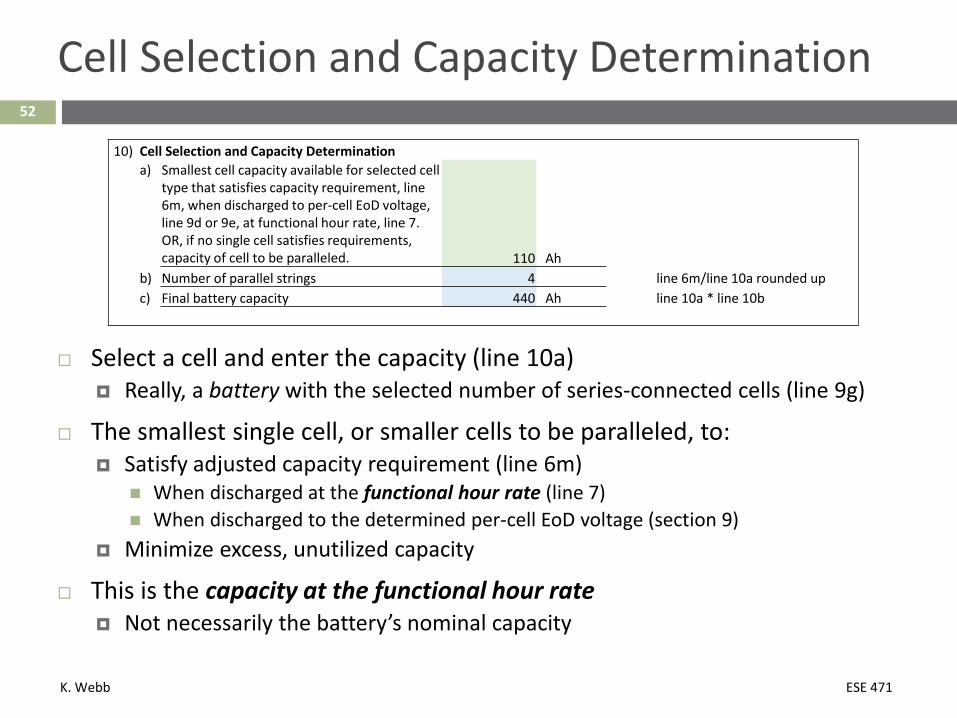
Select a cell and enter the capacity (line 10a) Really, a battery with the selected number of series-connected cells (line 9g)
The smallest single cell, or smaller cells to be paralleled, to: Satisfy adjusted capacity requirement (line 6m)
When discharged at the functional hour rate (line 7) When discharged to the determined per-cell EoD voltage (section 9)
Minimize excess, unutilized capacity
This is the capacity at the functional hour rate Not necessarily the battery’s nominal capacity
10) Cell Selection and Capacity Determinationa) Smallest cell capacity available for selected cell
type that satisfies capacity requirement, line 6m, when discharged to per-cell EoD voltage, line 9d or 9e, at functional hour rate, line 7. OR, if no single cell satisfies requirements, capacity of cell to be paralleled. 110 Ah
b) Number of parallel strings 4 line 6m/line 10a rounded upc) Final battery capacity 440 Ah line 10a * line 10b
K. Webb ESE 471
53
Cell Selection and Capacity Determination
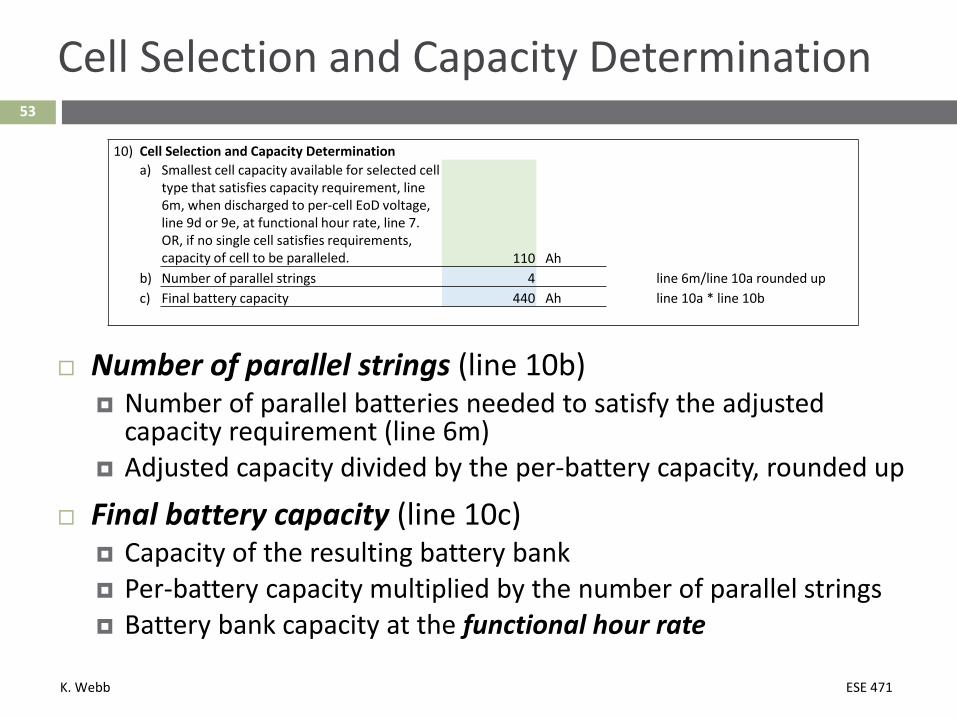
Number of parallel strings (line 10b) Number of parallel batteries needed to satisfy the adjusted
capacity requirement (line 6m) Adjusted capacity divided by the per-battery capacity, rounded up
Final battery capacity (line 10c) Capacity of the resulting battery bank Per-battery capacity multiplied by the number of parallel strings Battery bank capacity at the functional hour rate
10) Cell Selection and Capacity Determinationa) Smallest cell capacity available for selected cell
type that satisfies capacity requirement, line 6m, when discharged to per-cell EoD voltage, line 9d or 9e, at functional hour rate, line 7. OR, if no single cell satisfies requirements, capacity of cell to be paralleled. 110 Ah
b) Number of parallel strings 4 line 6m/line 10a rounded upc) Final battery capacity 440 Ah line 10a * line 10b
K. Webb ESE 471
54
Battery Bank Summary
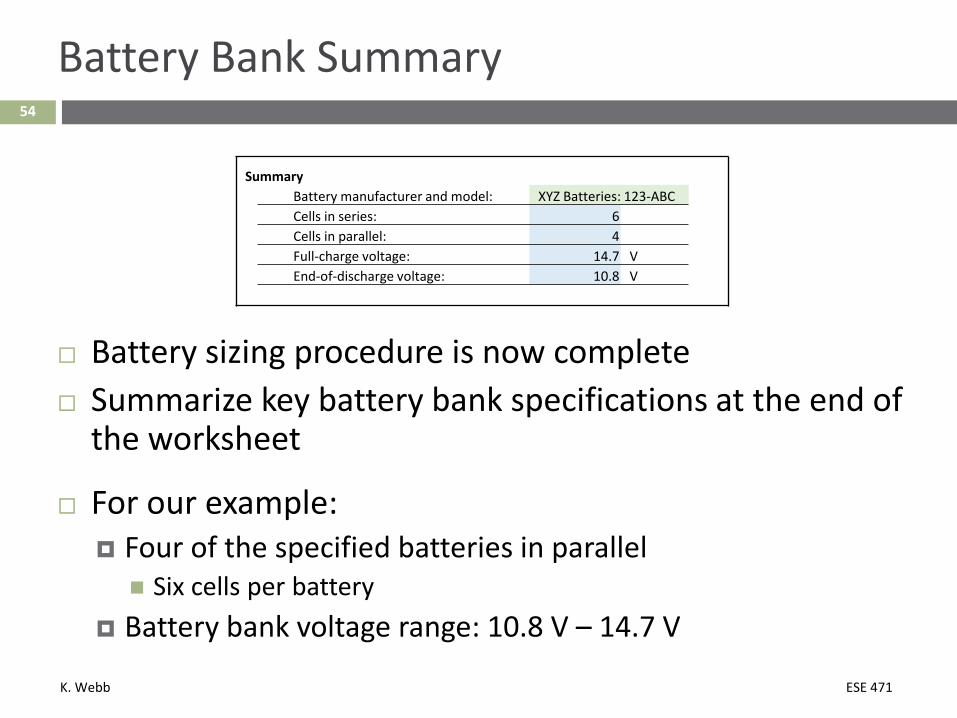
Battery sizing procedure is now complete Summarize key battery bank specifications at the end of
the worksheet
For our example: Four of the specified batteries in parallel Six cells per battery
Battery bank voltage range: 10.8 V – 14.7 V
SummaryBattery manufacturer and model: XYZ Batteries: 123-ABCCells in series: 6Cells in parallel: 4Full-charge voltage: 14.7 VEnd-of-discharge voltage: 10.8 V
Recommended