28
Seamless realtime analysis of frequency hopping with the R&S®FSWA new option has been added to the R&S®FSW high-end signal and spectrum analyzer for realtime applica-
tions. It measures the spectrum in a frequency band up to 160 MHz wide, and even detects signals with a
duration of only 1.87 μs with 100 % certainty and with accurate level. Infrequent and ultrashort events are
made visible thanks to spectrogram displays and persistence mode.
Realtime analysis – vital for measurements on frequency hopping systemsWireless communications systems that use frequency hop-ping have the advantage that their data transmission is less susceptible to interference and that diverse applications can share one frequency band. Cordless headsets and micro-phones, for example, operate very reliably in an extremely small space and in the same frequency band. Frequency hop-ping is also useful for tactical radios or radar applications in which, among other things, the influence of wanted inter-ference must be minimized. In order to analyze frequency agile systems of this type, it is essential that the signals are displayed accurately and without interruption. This is also
a prerequisite for being able to analyze brief interference effects such as those caused by frequency hops or digital cir-cuits and to examine frequency hopping algorithms. Realtime spectrum analysis is ideal for performing these tasks [1, 3, 4].
Realtime spectrum analysis up to 67 GHz with the R&S®FSWThe R&S®FSW-K160R 160 MHz realtime spectrum analyzer option turns the R&S®FSW high-end signal and spectrum ana-lyzer (Fig. 1) into a realtime analyzer. It digitizes a frequency band of up to 160 MHz and calculates up to 600 000 spectra per second (see Fig. 2). In order to achieve different resolution
Fig. 1: The R&S®FSW signal and spectrum analyzer, equipped with the R&S®FSW-K160R
option, analyzes almost 600 000 spectra per second in realtime and is twice as fast as
competitor products.
General purpose | Signal generation and analysis
bandwidths, the FFT length is adjustable between 32 and 16 384. With large resolution bandwidths, the R&S®FSW can detect signals up to a minimum duration of 1.87 µs with accurate level and at a probability of intercept (POI) of 100 %. The seamless spectra overlap by 67 % in the time domain so that the observer does not miss even the smallest of signals.
Because the human eye can only process up to 30 images per second, the analyzer combines several thousand spectra in one detector so that each peak is recognizable. However, this combining leads to loss of the extremely high time resolution. Other display modes, such as the persistence spectrum and the spectrogram, or the frequency mask trigger (FMT), solve this problem. The FMT can automatically evaluate all 600 000 spectra per second and respond to certain user-defined events, even if these are only a few nanoseconds long.
Persistence mode displays color-coded signal frequencyIn persistence mode, the analyzer seamlessly writes all spec-tra on top of each other in a diagram, color-coded according to their probability of occurrence. For example, it marks sig-nals that occur very frequently in red, and those that occur rarely in blue. If a signal no longer occurs, it disappears after the selected persistence time. This allows the user to
ParameterFFT length selectable between 32 and 16 384Realtime analysis bandwidth up to 160 MHzMinimum signal duration for 100 % POI 1.87 µsFFT rate max. 585 938 FFT/s
Fig. 2: The most important specifications of the R&S®FSW-K160R
160 MHz realtime spectrum analyzer option.
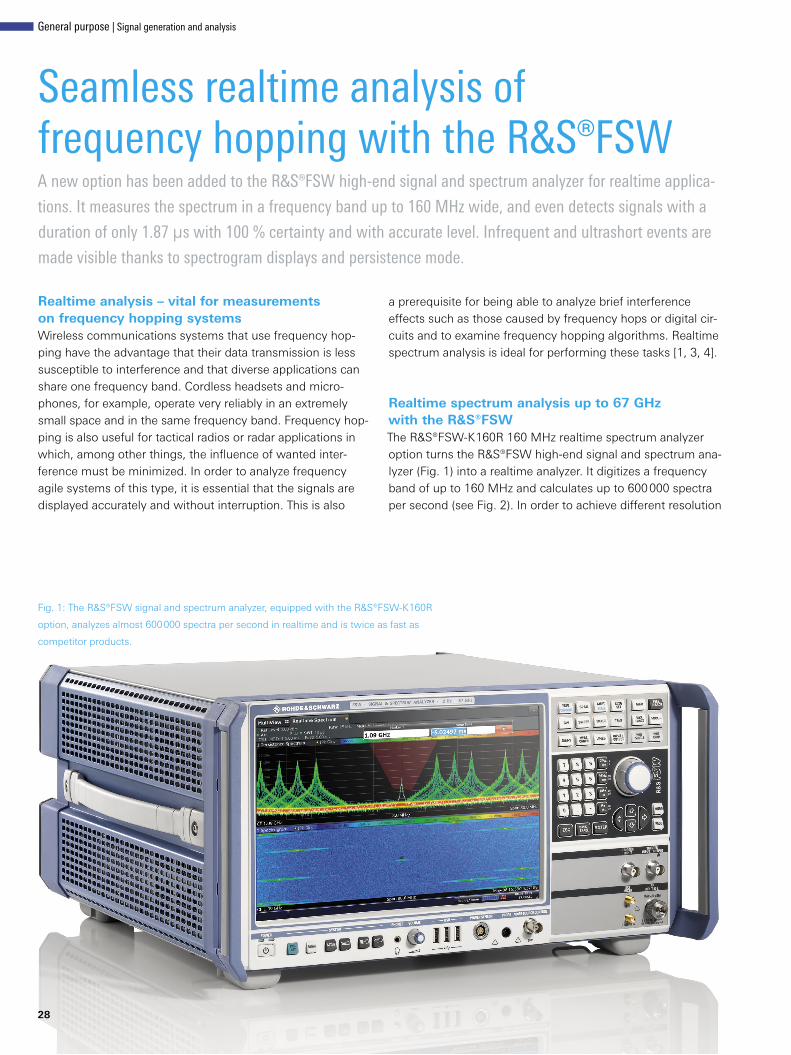
Fig. 3: WLAN and Bluetooth® share the ISM band at 2.4 GHz. Sometimes weak signals cannot be detected with a spectrum analyzer. They are hidden by
stronger signals (top). A weaker signal can only be detected in the persistence spectrum display (bottom).
NEWS 210/14 29
30
recognize even extremely short signals and see their ampli-tude and frequency. The persistence spectrum (Fig. 3) there-fore provides a good overview of the dynamics of frequency agile systems. Frequency hops occur, for example, in the industrial, scientific and medical (ISM) bands, where data rates are reduced by collisions between Bluetooth® signals and WLAN signals, for example. However, this display is not only an essential tool for analyzing wireless communications. It is also indispensable for measuring modern radar applica-tions, because these applications also use frequency hopping to minimize interference caused by atmospheric noise, other systems and hostile signals.
The persistence spectrum also displays signals that are hid-den beneath a stronger signal and cannot be detected with a conventional spectrum analyzer, as shown in the example in Fig. 3 with a Bluetooth® and a WLAN signal. These interferers are capable of reducing data transmission rates. In all of these applications, transients that occur during frequency hopping or due to digital signal processing can be transmitted, sig-nificantly disrupting other systems as well as the user’s own application. The ability to make transients visible in persis-tence mode is extremely useful for troubleshooting. A current example of this is the interaction between LTE signals in the 800 MHz band and short range devices.
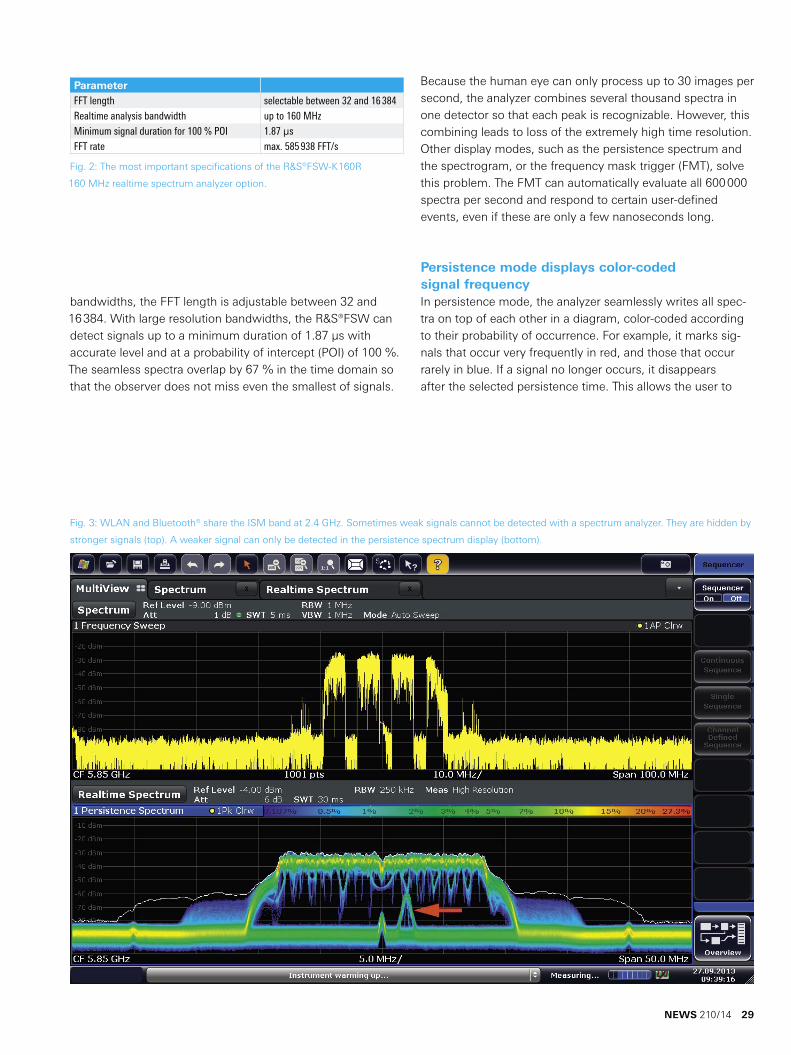
Fig. 4: The spectrogram shows the
hop sequence of the Bluetooth® sig-
nals, and the zoom function makes
it possible to perform a closer analy-
sis, particularly at the point where a
WLAN device is active.
General purpose | Signal generation and analysis
Spectrogram function seamlessly records signalsThe persistence spectrum helps users with new ways of ana-lyzing errors by displaying the dynamic behavior in the fre-quency domain. The spectrogram, however, shows errors in detail in the time domain. Each pixel of the spectrum is assigned a color that corresponds to the amplitude. This makes it possible to display each spectrum as a horizontal line. All spectral lines are continuously sequenced, seamlessly representing the time development in the frequency domain. In this mode, the R&S®FSW sequences up to 20 000 spectra per second and stores up to 100 000 spectra in a ring buffer. This lets users record the frequency domain seamlessly for up to five hours, depending on the update rate setting, and see at a glance when signals were transmitted, at which frequen-cies and with what power.
A closer analysis can be performed using markers, which the user can move over the frequency and time axes to mea-sure the time and frequency difference between events. The
spectrum of each individual line can be displayed in a sep-arate window. Since the R&S®FSW stores the I/Q data in a 400 Msample ring buffer in realtime mode, at a bandwidth of 160 MHz the most recently recorded data with a duration of approximately one second is available for a more accu-rate or repeated calculation. This makes it possible to zoom into scenarios of interest with a minimum time resolution of 30 ns. Collisions between different signals or extremely brief interferers can be analyzed in detail in this way, as shown in Fig. 4. Zooming into the area where two signals are simul-taneously active helps to analyze collisions and improve fre-quency agile systems.
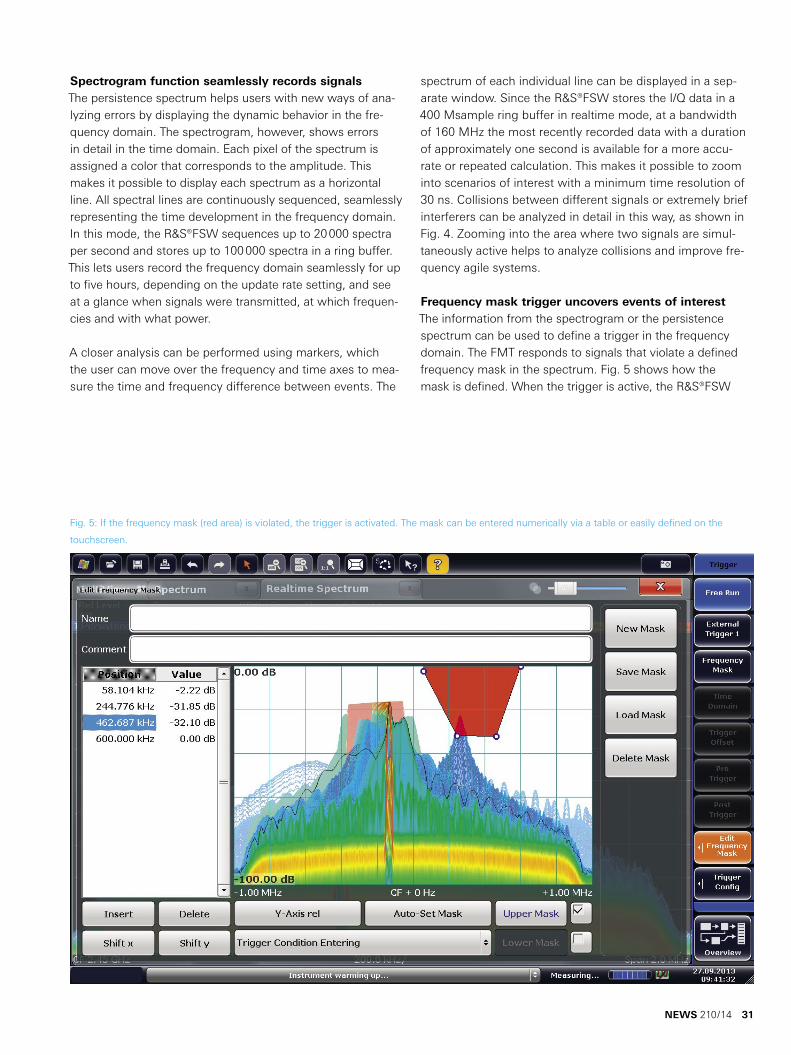
Frequency mask trigger uncovers events of interestThe information from the spectrogram or the persistence spectrum can be used to define a trigger in the frequency domain. The FMT responds to signals that violate a defined frequency mask in the spectrum. Fig. 5 shows how the mask is defined. When the trigger is active, the R&S®FSW
Fig. 5: If the frequency mask (red area) is violated, the trigger is activated. The mask can be entered numerically via a table or easily defined on the
touchscreen.
NEWS 210/14 31
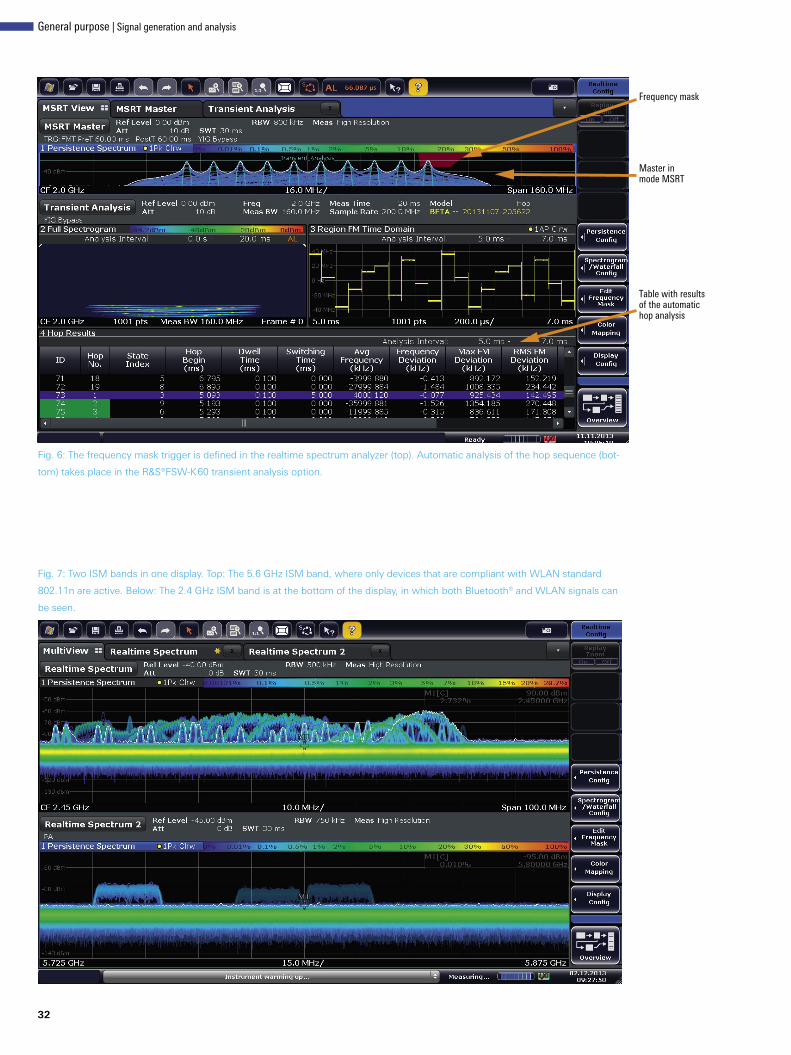
Frequency mask
Master in mode MSRT
Table with results of the automatic hop analysis
32
Fig. 7: Two ISM bands in one display. Top: The 5.6 GHz ISM band, where only devices that are compliant with WLAN standard
802.11n are active. Below: The 2.4 GHz ISM band is at the bottom of the display, in which both Bluetooth® and WLAN signals can
be seen.
Fig. 6: The frequency mask trigger is defined in the realtime spectrum analyzer (top). Automatic analysis of the hop sequence (bot-
tom) takes place in the R&S®FSW-K60 transient analysis option.
General purpose | Signal generation and analysis
References[1] Dr. Florian Ramian: Implementation of Real-Time Spectrum Analysis.
White Paper from Rohde & Schwarz (2013). Search term: 1EF77.[2] The new benchmark: R&S®FSW.
NEWS (2011), No. 204 (extra section in middle of magazine).[3] It detects everything: the R&S®FSVR real-time spectrum analyzer.
NEWS (2010) No. 202, pp. 14–17.[4] The world’s fastest EMI test receiver drastically reduces testing times.
NEWS (2012) No. 207, pp. 22–27.
compares each individual spectrum – 600 000 per second – with this frequency mask. If the mask is violated, it stores the data for further analysis. The user can define which time range before and after the event is to be recorded, and whether recording stops or analysis restarts when the trigger event occurs. This function makes it possible to detect brief interferers or only analyze signals of a certain frequency and amplitude. The user can concentrate on the signals of inter-est and does not have to evaluate large quantities of seam-lessly recorded data. The stored signals can, for example, be analyzed in detail in the spectrogram, processed on an exter-nal computer or examined on the R&S®FSW using other mea-surement applications.
MSRT combines realtime analysis with other applicationsThe multistandard realtime (MSRT) operating mode makes it possible to use the frequency mask trigger also in other mea-surement applications. In such cases, the realtime analyzer acts as master. The user sets the frequency mask and deter-mines the analysis bandwidth and the record length. When an event has activated the trigger, the data that has been acquired is made available to the other measurement appli-cations and analyzed by them. This is extremely useful if the signal that is being analyzed only occurs rarely and is there-fore difficult to record. Fig. 6 shows a typical application. In order to measure the hop sequence of a transmitter that is only occasionally active, it is advisable to use the frequency mask trigger in realtime mode in order to trigger at a certain frequency. Subsequently the data is examined in the tran-sient analysis (R&S®FSW-K60 option) and the hop sequence is automatically evaluated. This used to be a complicated task, since users were forced to record extremely long data sequences in the hope of capturing the transmitter’s active phase by chance. Now, however, this succeeds with the very first measurement.
Parallel display of different modes makes evaluation easierThe R&S®FSW-K160R measurement application is merely a software option for the R&S®FSW signal and spectrum ana-lyzer; only the R&S®FSW-B160 bandwidth extension is addi-tionally required. The R&S®FSW can still be operated as a con-ventional spectrum analyzer, and the different modes can be displayed simultaneously, as shown in Fig. 3. Users can sim-ply switch between these channels or display them in parallel. Applications such as the realtime measurement application can also be started multiple times. Seamless spectrum analy-sis is only possible in one window, but users can easily com-pare the frequency utilization of different bands in this way, as shown in the example in Fig. 7 with the ISM band at 2.4 GHz and 5.6 GHz.
SummaryThe R&S®FSW signal and spectrum analyzer [2], equipped with the R&S®FSW-K160R option, is the third realtime spec-trum analyzer from Rohde & Schwarz following the R&S®FSVR realtime analyzer [3] and the R&S®ESR EMI test receiver [4]. With almost 600 000 spectra per second, it is twice as fast as competitor products. With a probability of intercept of 100 %, it detects signals accurately up to a minimum duration of 1.87 µs and comes out on top in any comparison. Together with its outstanding RF characteristics and new modes such as MSRT (all controlled via its convenient user interface), it is a unique measuring instrument on the market.
Dr. Wolfgang Wendler
The app version of this article contains a video about R&S®FSW-K160R.
NEWS 210/14 33
Recommended


![Seamless Realtime Traffic Handover Policy for IEEE …netsys.kaist.ac.kr/publication/papers/Resources/[IC109].pdf · Seamless Realtime Traffic Handover Policy for IEEE 802.16m Mobile](https://img.dokumen.tips/doc/110x75/5ab3b9637f8b9ac66c8e91bd/seamless-realtime-traffic-handover-policy-for-ieee-ic109pdfseamless-realtime.jpg)