Review of Outcomes for clients of Higher Ground
Final report
17 February 2016 Prepared for: Higher Ground Drug Rehabilitation Trust
Review of Outcomes for clients of Higher Ground
Final report
17 February 2016 Prepared for: Higher Ground Drug Rehabilitation Trust Prepared by: Julian King & Brendan Stephenson Contract held by:
Julian King & Associates Limited PO Box 41-339 St Lukes, Auckland 1346 www.julianking.co.nz
3
Contents
Executive summary ................................................................ 5
1 Background ....................................................................... 7
Higher Ground residential programme .......................................... 7 Research programme .................................................................. 9 Study objectives and method ..................................................... 10
2 Results ............................................................................ 15
Client characteristics ................................................................. 15 ADOM and abstinence post-discharge ......................................... 20 PTSD scores ............................................................................ 26 DASS comparison scores ........................................................... 29 Maudsley physical health symptoms ........................................... 34 Client Assessment Inventory...................................................... 35 Spiritual Assessment ................................................................ 37 Discussion ............................................................................... 38
3 Return on Investment ..................................................... 42
ROI on Higher Ground client outcomes ........................................ 43 Discussion ............................................................................... 45
4 Evaluative conclusions .................................................... 46
Appendix A: Evidence for TCs – international context .......... 48
Intended outcomes of TCs ......................................................... 50 Effectiveness of TCs and adjunct therapies .................................. 51 TC duration ............................................................................. 52 Completion rates for TC programmes .......................................... 53 Abstinence post-exit from TC programmes .................................. 53 TC impacts on psychological symptoms ....................................... 54 Other outcomes ....................................................................... 54 Spontaneous remission ............................................................. 55 References cited in this report.................................................... 55
Appendix B – Data Analysis Tables ....................................... 63
Client characteristics ................................................................. 63 ADOM and abstinence post-discharge ......................................... 66 PTSD scores ............................................................................ 75 DASS comparison scores ........................................................... 76 Client Assessment Inventory (CAI) ............................................. 80 Maudsley physical health symptoms ........................................... 82 Spiritual Assessment ................................................................ 83
Fileref: 160217 Higher Ground Outcome Study - Final.docx Last saved: 16-Mar-16
4
Disclaimer: The information in this report is presented in good faith
using the information available to us at the time of preparation. It is
provided on the basis that the authors of the report are not liable to any
person or organisation for any damage or loss which may occur in relation
to taking or not taking action in respect of any information or advice
within this report.
Citation: Any content reproduced from this report should be cited as
follows:
King, J., Stephenson, B. (2016). Review of Outcomes for clients of Higher
Ground. Report prepared for Higher Ground Drug Rehabilitation Trust.
Auckland: Julian King & Associates Limited – a member of the Kinnect
Group.
Review of outcomes for clients of Higher Ground
5
Executive summary
This report presents data analysis and evaluation of clients’ treatment
outcomes from Higher Ground’s residential therapeutic community (TC)
programme.
The study includes 524 clients who entered Higher Ground between 1 July
2012 and 2 June 2015. These clients were 66% European, 27% Māori,
and three quarters of clients were aged in their 20s-30s. Primary drugs of
choice were methamphetamine (48%), alcohol (36%) and cannabis
(11%). Average length of stay was 84 days.
Higher Ground clients presented with histories of addiction which often
had significant negative associations with their physical and psychological
health, their relationships, work, accommodation and criminal behaviour.
By the time they exited the programme, clinically and statistically
significant improvements were seen across multiple indicators. Of
particular note:
Mean days of any substance use in the preceding 28 days reduced
from 14.1 on first presentation to 2.1 on discharge and were
sustained for 12 months among those followed up post discharge.
Abstinence rates increased from first presentation to admission,
from admission to post-discharge follow up, and were sustained for
12 months post discharge with approximately 80% of those
followed up remaining abstinent after completing the programme.
Mean post-traumatic stress disorder (PTSD) scores reduced from
43 on admission to 32 on discharge. Clients who had a high PTSD
score of 44 or more on entry experienced improvements such that
74% of these clients had PTSD scores below 44 on discharge.
The majority of clients on first presentation had Depression,
Anxiety and Stress (DASS) scores consistent with severe or
extremely severe depression, anxiety and stress. Clients’
emotional states on all three scores were within the normal to mild
range by discharge and remained in this range for those followed
up over the subsequent 12 months.
Responses to the Alcohol and Drug Outcome Measure (ADOM)
questionnaire suggested improvements across various indicators of
daily functioning (including physical health, psychological health,
conflict with friends or family, engagement in work, housing
difficulties, and criminal behaviour).
Similarly positive trends were indicated in Maudsley Addiction
Profile physical health risk symptoms, the Therapeutic Community
Review of outcomes for clients of Higher Ground
6
Client Assessment Inventory, and the Higher Power Relationship
Scale.
These positive trends were seen for all major client subgroups, were
stronger for clients who completed the programme than those who exited
before completing, and are broadly consistent with previous analysis of
Higher Ground outcome data (Raymont, 2012; Raymont, 2013; Raymont
et al., 2013; King, 2014).
The observed trends meet Bradford Hill Criteria for causal inference of
strength, consistency, temporality and coherence.
Overall these results, when benchmarked against performance standards
informed by literature, demonstrate that Higher Ground works effectively
with its clients and supports them to achieve successful outcomes with
the vast majority of those who complete the TC programme and engage
in aftercare.
Furthermore, scenario analysis of the economic value of Higher Ground’s
outcomes indicates that Higher Ground creates more value for society
than it consumes and is therefore worth funding on efficiency grounds.
Review of outcomes for clients of Higher Ground
7
1 Background
Higher Ground Drug Rehabilitation Trust engaged Julian King & Associates
to review service data on clients’ treatment outcomes from its residential
programmes. This report presents findings from the review.
Higher Ground residential programme
Higher Ground provides abstinence based treatment, within a 48-bed
Therapeutic Community (TC) for adult New Zealanders. Higher Ground’s
rehabilitation programmes are based on Narcotics Anonymous 12-step
recovery principles and other evidence-based therapies. The programmes
are based on the belief that spiritual dimensions of honesty, open
mindedness, willingness, faith, hope, respect and generosity are the
foundations of healing. Higher Ground emphasises that clients need to
take individual responsibility for their recovery.1
The TC programme duration is up to 18 weeks. Prior to entering the TC, a
pre-admission community team provides assessment, support and group
work to develop readiness for the intensive residential support of the
programme. After graduation from the TC, continuing care is provided
consisting of group and individual therapies, and supportive
accommodation while people re-adjust to life in the community (Raymont
et al., 2013).
The primary goal of the TC is to foster personal growth. This is
accomplished by changing an individual’s lifestyle through a community of
concerned people working together to help themselves and each other.
The TC represents a highly structured environment with defined
boundaries, both behavioural and ethical. It employs sanctions imposed
by the community as well as earned advancement of status and privileges
as part of the recovery and growth process. The TC has a series of
defined stages. Attainment of each stage recognises increased personal
awareness and growth demonstrated through behaviour, attitudes and
values.
Being part of something greater than oneself is an especially important
factor in facilitating positive growth. People in a TC are members, as in
any family setting (as distinct from patients, as in an institution).
Members play a significant role in managing the therapeutic community
and act as positive role models for others.
Members and staff act as facilitators, emphasising personal responsibility
for one’s own life and self-improvement. Staff support the members. Staff
ensure that for personal privacy and dignity, each client is addressed by
1 For more information see www.higherground.org.nz
Review of outcomes for clients of Higher Ground
8
their preferred name. There is a sharing of meaningful labour so that
there is a true investment in the community.
Peer pressure is often the catalyst that converts criticism and personal
insight into positive change. High expectations and high commitment from
both members and staff support this positive change. Insight into one’s
problems is gained through group and individual interaction. Learning
through experience, failing and succeeding, and experiencing the
consequences is considered an important influence toward achieving
lasting change.
The TC emphasises the integration of an individual within the community.
Progress is measured within the context of the community and against
the community’s expectations. It is this community, along with the
individual, that accomplishes the process of positive change in the
member. This transition is taken as an important measure of readiness to
move toward integration into the larger society.
TC programmes operate within a set of cardinal rules that apply to all
clients, staff and visitors. Any breaches of the following rules result in
discharge from the programmes: no drugs including alcohol; no gambling;
no sex; no violence, threats of violence or harassment; no stealing,
dishonesty or criminal activity; no leaving Higher Ground premises
without permission of staff; and no withholding of knowledge for any of
the above.
Within the TC setting, Higher Ground provides a range of evidence-based
therapies. Staff members are trained therapists who use group, individual
and family approaches including cognitive behaviour therapy (CBT),
dialectical behaviour therapy (DBT), motivational interviewing (MI),
psycho-education, relapse prevention and family/whānau therapy.
Additionally, moral reconation therapy (MRT) and trauma therapy have
recently been introduced in the context of the AOD Treatment Court.
There is also an extensive family education and therapy programme.
Higher Ground is culturally responsive – for example, there is a Māori
programme which uses Māori symbolism and rituals to explore issues
related to addiction (Raymont, 2013).
The TC programme is funded through contracts with the Waitemata
District Health Board, Waikato District Health Board, the Ministry of Health
and the AOD Treatment Court. Additionally, where a client is eligible for a
benefit from Work & Income, a portion of the benefit is paid directly to
Higher Ground as the client’s contribution toward the cost of their time in
the programme.

Review of outcomes for clients of Higher Ground
9
Research programme
In 2009 Higher Ground implemented a research and monitoring
programme to assess clients as they made their way through the
residential TC programme. The monitoring programme aims to provide
evidence of clients’ progress, assist with clinical management and identify
areas where the programme might be improved (Raymont, 2013).
Some changes have been made to the research programme over time,
including the introduction of the Alcohol and Drug Outcome Measure
(ADOM) in October 2011 (Raymont, 2012). More recently, a review of the
research programme made further recommendations for enhancements,
which were implemented in 2015 and will be included in future research.
Higher Ground administers standardised research tools at regular
intervals from pre-admission through to discharge (“in-treatment
research”) and up to 12 months post discharge (“post-treatment
research”). Table 1 summarises the research tools covered by this study
and the points in time they were administered in relation to each client’s
therapeutic journey, and further information on each tool is provided
below the table.
Table 1: Summary of research tools covered by this study
Alcohol and Drug Outcome Measure (ADOM): A brief outcome
questionnaire developed for New Zealand alcohol and drug services,
comprising 11 questions on substance use and 7 questions on lifestyle
change and wellbeing.
Maudsley Addiction Profile (MAP) – short form: A brief, multidimensional
instrument designed for assessing treatment outcomes for people with
AOD problems. Only the sections on physical health and personal/social
functioning are administered at Higher Ground. Use of the full MAP
In-treatment research Post-treatment research
Tool
Fir
st
presen
tati
on
Ad
mis
sio
n
42
days
90
days
12
6 d
ays/
dis
ch
arg
e
3 m
on
ths
6 m
on
ths
9 m
on
ths
12
mo
nth
s
ADOM * * * * * *
Maudsley (short-form) * * * * * * * * *
DASS 21 * * * * * * * * *
Client Assessment
Inventory * * * *
PTSD * *
Spiritual Assessment * * * * * *
Review of outcomes for clients of Higher Ground
10
instrument was discontinued with the introduction of ADOM in October
2011.
Depression, Anxiety and Stress Scale (DASS-21): A questionnaire with
three self-report scales which are used not for diagnostic purposes, but to
assess degrees of depression, anxiety and stress relative to normal
subjects.
Therapeutic Community Client Assessment Inventory (CAI): An
instrument developed from a comprehensive theory of TC treatment and
recovery, measuring client self-report of progress along 14 domains of
behaviour, attitude and cognitive change (Kressel & De Leon, 1997).
Post-Traumatic Stress Disorder (PTSD) scale (PCL-5): A 20-item self-
report measure that assesses (but does not diagnose) the 20 DSM-V
symptoms of PTSD.
Spiritual Assessment: Adapted from the Higher Power Relationship Scale,
the instrument used by Higher Ground comprises 17 self-rated items to
assess the strength of clients’ beliefs in a higher power, together with a
question on recent attendance at 12 Step meetings and recent sponsor
contact.
In addition to the research tools summarised above, Higher Ground
administered, on admission only, a Problem Gambling Severity Index and
Eating Attitudes Test. Additionally, a Staff Assessment Summary was
completed at 42 days, 90 days and at discharge providing a staff
evaluation of client progress.
Residents provide written informed consent to participate in the research
programme. Research data are entered into a secure database by a
research analyst who is independent from the programme delivery team.
Study objectives and method
This study builds on previous analysis of client outcome data (Raymont,
2012; Raymont, 2013; Raymont et al., 2013; King, 2014). Its purpose is
to investigate client recovery outcomes by analysing outcome data for all
clients who entered Higher Ground over the last three years.
Research method
The analysis covers a three year period and includes 524 clients who
entered Higher Ground between 1 July 2012 and 2 June 2015. Data was
provided in Microsoft Excel (with identifying details removed) in three
separate files as follows:
Review of outcomes for clients of Higher Ground
11
Research log (Demographic information, entry and exit dates, drug
of choice, exit type, highest qualification, Justice and AOD
Treatment Court clients, together with a sequential identifier for
linking purposes)
In-treatment research (assessment data from first presentation
through to discharge)
Post-treatment research (assessment data at 3, 6, 9 and 12-
month follow up).
These spreadsheets were merged and cleaned in Microsoft Excel and were
imported into SPSS for analysis.
Clients did not always have a measurement at every point in time. In
order to allow for the inclusion of data for clients with missing data, a
generalised linear mixed model was used (enabling the inclusion of all
clients with two or more measures) with the period between
measurements for each client defined as the number of days since referral
(modelled as a first-order autoregressive within-subject term). This
enabled a greater number of clients to be included in the analysis,
increasing statistical power, compared to a design that only includes those
who completed all questionnaires at all points in time.
A Scheffe post-hoc test was used to test for between-subject differences
for each category in any ordinal/nominal independent variables.
Supplemental statistical analysis included paired samples t-tests (for
significant changes in mean values between two time periods) and a
repeated measures ANOVA where it was necessary to test for changes in
mean values between groups over time.
Evaluation-specific methodology
Evaluation is the systematic determination of the quality, value or
importance of something (e.g., an initiative, programme, project,
organisation, etc), underpinned by analysis of evidence. Evaluation seeks
to determine how good something is, and whether it is good enough
(Davidson, 2005). Accordingly, the practice of evaluation requires
engagement with values. While scientific and social research aims to be
“as values-free as possible” (Gluckman, cited in Hubbard, 2012),
evaluation uses agreed definitions of quality, value or importance to make
sense of empirical evidence for a particular context – a process of
reasoning called probative inference (Scriven, 1995). In the process of
conducting an evaluation, research methods are used to underpin the
collection of robust evidence.
Sound evaluation requires an explicit basis for making evaluative
judgments. An evaluation framework should therefore specify a priori
(pre-determined) performance criteria and standards so that evaluative
Review of outcomes for clients of Higher Ground
12
judgments are made transparently and on an agreed basis (Scriven,
1995; Davidson, 2005). There is an extensive body of evaluation
literature underpinning the valuing process and the use of criteria and
standards to reach explicitly evaluative conclusions from empirical
evidence (e.g., Scriven, 1967, 1972; Eisner, 1976; Stake, 1975, 2000;
House & Howe, 1999; cited in Alkin, 2004).
Higher Ground criteria and standards
Performance criteria for this evaluation were developed with reference to
the literature and in consultation with Higher Ground service leaders. Due
to the nature of evidence on TCs, the performance criteria are evidence-
informed but also required the expert judgment of Higher Ground staff to
set standards appropriate to the specific Higher Ground TC context. These
standards were set prior to data analysis commencing.
A rapid review of the literature on TCs (Appendix A) identified a body of
evidence that TCs are effective, though there was less research seeking to
determine why and how they work (De Leon, 2000; Pearce & Pickard,
2012). ATCA (2002) noted that evidence-based practice has tended to
focus more on treatment content than on the TC itself.
Comparing results of different programmes is problematic because TCs
vary, treatment approaches vary, and the chronic and relapsing nature of
AOD dependence means individual recovery pathways vary (Bahr et al,
2012; De Leon, 2010; McKetin et al, 2010). There is a wide diversity of
TCs and not one “best” model. In a TC context, emergent evidence may
be informed by practice as much as practice is informed by evidence.
Four sets of performance criteria were identified in the literature and
agreed to be appropriate for evaluating the performance of Higher
Ground: completion rates, changes in substance use, psychological
symptoms, and consequential factors. The following paragraphs
summarise key international evidence on TC performance against these
criteria.
Completion rates: A review of international literature on TCs by
Vanderplasschen et al (2014) indicated that completion rates have varied
widely, between 9-75%, with midpoint completion rates around 30%
(Guydish et al, 1998; Nemes et al, 1999; Nuttbrock et al, 1998; McCusker
et al, 1997; McCusker et al, 1996; Coombs, 1981; Ravndal and Vaglum,
1998; Ogborne and Melotte, 1977). These studies predominantly covered
12-month TC programmes but included a few 3 and 6 month programmes
as well as some that were longer than 12 months. Completion rates were
higher in the short-term programmes.
Changes in substance use behaviour: Abstinence rates at 3-6 months
post-discharge follow up have been found to vary widely between 16-
Review of outcomes for clients of Higher Ground
13
85%, with midpoint abstinence rates of around 70% (Nuttbrock et al,
1998; Martin et al, 1999; Nielsen et al, 1996; Greenwood et al, 2001;
McCusker et al, 1995; Hartmann et al, 1997; cited in Vanderplasschen et
al., 2014). Abstinence rates at 12 month follow up have ranged from 25-
73%, with midpoint abstinence rates around 50% (Sullivan et al, 2007;
Greenwood et al, 2001; Bale et al, 1980; Coombs, 1981; McCusker et al,
1995; cited in Vanderplasschen et al., 2014).
Positive outcomes following treatment are related to the length of time in
treatment (Bell et al, 1996; De Leon, 2010; Inciardi et al, 2004; Welsh,
2007; Welsh & McGrain, 2008) and to successfully completing the goals of
all TC programme stages (Coombs, 1981; Toumbourou, Hamilton &
Fallon, 1998; cited in De Leon, 2000).
Psychological symptoms: A number of studies have found that TCs are
effective in reducing psychological symptoms including depression,
anxiety and stress, among others (Prendergast et al, 2004; Guydish et al,
1999; French et al, 1999; Nuttbrock et al, 1998; cited in Vanderplasschen
et al, 2014). However, the range of assessment tools used in these
studies did not offer directly comparable or transferrable benchmarks for
Higher Ground. Studies of other interventions that included DASS scores
generally showed mean scores in the normal to moderate range following
treatment (Blatch, 2013; Crawford and Henry, 2003; Lovibond and
Lovibond, 1995; Nicholas et al, 2008; all cited in Blatch et al, 2013).
Consequential factors: Patterson et al (2015) noted that a wide range of
‘consequential factors’ are commonly associated with substance use (e.g.,
physical and mental health, criminality, employment status, social
conflict, quality of life, and morbidity), and effective substance use
programmes should also address these factors. However, there is no
consensus on which outcomes should be measured or how they should be
measured. A wide range of psychometric tools are in use for tracking
many of these outcomes, and this is a factor limiting comparability of
results across studies.
Bearing in mind the nature of the existing evidence base, and the need to
tailor performance criteria to the Higher Ground TC context, the following
performance criteria (Table 2) were developed in consultation with Higher
Ground service leaders. They have been used as a guide to evaluative
judgments in this report. These criteria were also used in a previous study
of outcomes for methamphetamine users (King, 2014).

Review of outcomes for clients of Higher Ground
14
Table 2: Performance criteria for Higher Ground outcomes
Higher Ground recovery outcomes will be judged as…
If the following criteria are met…
Highly effective 55% of clients complete the programme (i.e., are either discharged with staff approval or transfer to another programme)
40% of clients with high PTSD scores on admission show clinically significant shifts at discharge
40% of clients with severe or extremely severe DASS scores on admission show clinically significant shifts at discharge
75% of those who can be followed up are not using any substance at 3 months, and 50% are not using
at 12 months.
Effective 45% of clients complete the programme
30% of clients with high PTSD scores on admission show clinically significant shifts at discharge
30% of clients with severe or extremely severe
DASS scores on admission show clinically significant shifts at discharge
50% of those who can be followed up are not using any substance at 3 months, and 25% are not using at 12 months.
Developing effectiveness 35% of clients complete the programme
20% of clients with high PTSD scores on admission show clinically significant shifts at discharge
20% of clients with severe or extremely severe DASS scores on admission show clinically significant shifts at discharge.
Acceptable 25% of clients complete the programme
10% of clients with high PTSD scores on admission show clinically significant shifts at discharge
10% of clients with severe or extremely severe DASS scores on admission show clinically significant shifts at discharge.
Ineffective None of the above criteria are met.

Review of outcomes for clients of Higher Ground
15
2 Results
524 clients were admitted to Higher Ground between 1 July 2012 and 2
June 2015. Collectively, the clients who have used Higher Ground’s TC in
the past three years show clinically relevant and statistically significant
improvements across multiple indicators. This section presents key
findings. Additional detail is provided in the data tables in Appendix B.
Client characteristics
Residents were 57.1% male, 42.4% female, 0.6% transgender. This is
broadly consistent with previous research at Higher Ground (Raymont,
2013). The vast majority of residents in the past three years gave their
ethnicity as either European (65.5%) or Māori (27.3%) (Figure 1).
Figure 1: Ethnicity of Higher Ground clients (July 2012 – June 2015)
Analysis of ethnicity data over a longer time period, including historical
data back to the commencement of the research programme in 2009,
shows that the primary ethnicities of Higher Ground residents were
consistently European and Māori, but that the proportion of Māori has
increased from 20% in 2009 to 27% in 2015 (Figure 2). This may be
connected to the success of Higher Ground’s Māori Programme, as
documented in a review by Waight (2012).
65.5%
27.3%
4.4% 2.9%
European Māori Pacific Other

Review of outcomes for clients of Higher Ground
16
Figure 2: Ethnicity of Higher Ground clients (2009-15)
Nearly three quarters of residents were aged in their 20s (39%) or 30s
(34%) (Figure 3). The mean age of residents was 34 years (Table 9,
Appendix B). This is broadly consistent with previous research (Raymont,
2013).
Figure 3: Age group of Higher Ground clients (July 2012 – June 2015)
The primary drugs of choice over the past three years, nominated by 95%
of residents collectively, were methamphetamine (48%), alcohol (36%)
and cannabis (11%) (Figure 4).
1.5%
39.1%
33.6%
19.7%
5.0%
1.1%
Teens 20s 30s 40s 50s 60+

Review of outcomes for clients of Higher Ground
17
Figure 4: Primary drug of Choice (July 2012 – June 2015)
Comparison of drugs of choice over a longer time period shows that
methamphetamine and alcohol have consistently been the primary
substances used by people who enter Higher Ground (Figure 5). However,
the proportion of residents whose primary drug of choice was
methamphetamine has increased over time from 42% in 2009 to 60% in
2015.
Figure 5: Primary drug of Choice (2009-15)
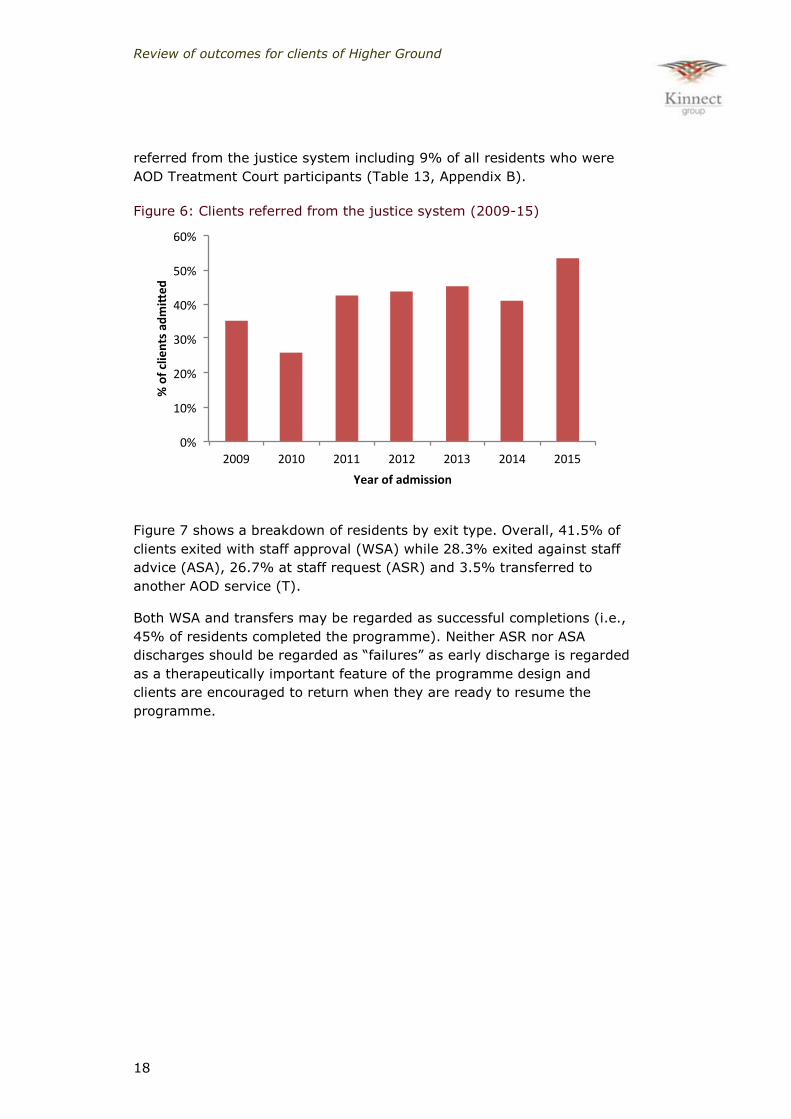
The proportion of Higher Ground residents who were referred by the
justice system (courts, probation or prison) has increased over time, with
some fluctuation (e.g., 35% in 2009 versus 53% in 2015) (Figure 6).
Over the past three years, 46% of Higher Ground residents have been
48.2%
36.3%
10.7%
3.3% 1.5%
Methamphetamine
Alcohol
Cannabis
Opiates
Other
Review of outcomes for clients of Higher Ground
18
referred from the justice system including 9% of all residents who were
AOD Treatment Court participants (Table 13, Appendix B).
Figure 6: Clients referred from the justice system (2009-15)
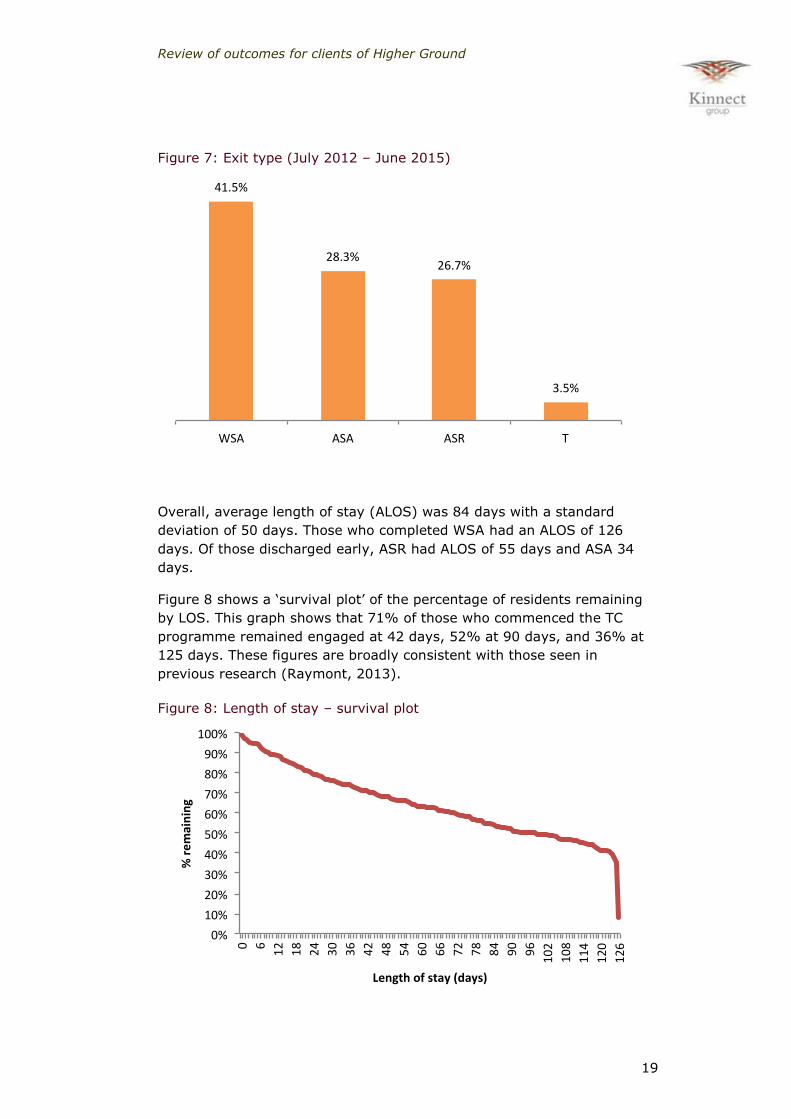
Figure 7 shows a breakdown of residents by exit type. Overall, 41.5% of
clients exited with staff approval (WSA) while 28.3% exited against staff
advice (ASA), 26.7% at staff request (ASR) and 3.5% transferred to
another AOD service (T).
Both WSA and transfers may be regarded as successful completions (i.e.,
45% of residents completed the programme). Neither ASR nor ASA
discharges should be regarded as “failures” as early discharge is regarded
as a therapeutically important feature of the programme design and
clients are encouraged to return when they are ready to resume the
programme.
Review of outcomes for clients of Higher Ground
19
Figure 7: Exit type (July 2012 – June 2015)
Overall, average length of stay (ALOS) was 84 days with a standard
deviation of 50 days. Those who completed WSA had an ALOS of 126
days. Of those discharged early, ASR had ALOS of 55 days and ASA 34
days.
Figure 8 shows a ‘survival plot’ of the percentage of residents remaining
by LOS. This graph shows that 71% of those who commenced the TC
programme remained engaged at 42 days, 52% at 90 days, and 36% at
125 days. These figures are broadly consistent with those seen in
previous research (Raymont, 2013).
Figure 8: Length of stay – survival plot
41.5%
28.3%26.7%
3.5%
WSA ASA ASR T
0%
10%
20%
30%
40%
50%
60%
70%
80%
90%
100%
0
6
12
18
24
30
36
42
48
54
60
66
72
78
84
90
96
102
108
114
120
126
%remaining
Lengthofstay(days)
Review of outcomes for clients of Higher Ground
20
ADOM and abstinence post-discharge
The alcohol and drug outcome measure (ADOM) is a brief outcome
measure relevant to New Zealand AOD services. The questionnaire is
designed for clients and clinicians to complete together and includes 11
questions on substance use and 7 questions on lifestyle change and
wellbeing (Te Pou, 2009). Higher Ground administered the ADOM
questionnaire on first presentation, admission, and follow up.
ADOM data overall indicates that Higher Ground residents presented with
histories of addiction which often had significant negative associations
with their physical and psychological health, their relationships, work,
accommodation and criminal behaviour. By the time people exited the
programme, data indicates substantial improvements across all ADOM
indicators, as observed in previous research (Raymont, 2013).
Figure 9 shows mean days of substance use in the last 28 days for the top
three primary drugs of choice. By the time people enter the TC
programme, the impacts of preadmission work are already evident with a
decrease in substance use between first presentation and admission.
Follow up at 3, 6, 9 and 12 months shows that among those clients who
participated in the follow up research, rates of substance use remained
low compared to rates at first presentation and admission.
When interpreting these results it is important to note that four-fifths of
clients who participate in follow up research are people who completed
the TC programme and were discharged with staff approval (WSA). These
clients had greater success rates in general as well as being more likely to
engage in continuing care. These results indicate that when people
complete the TC programme and engage in continuing care, the
programme is effective.
Overall, clients reported substance use in 14.1/28 days on first
presentation, 5.9/28 on admission, 2.1/28 on 3 month follow up, 2.7 at 6
months, 2.2 at 9 months and 2.1 at 12 months (Table 17, Appendix B).
The changes over time are statistically significant (p<0.001).2
2 Statistical analysis using a generalised linear model provides 99.9% confidence that mean days of substance use reduced across the six time points overall.

Review of outcomes for clients of Higher Ground
21
Figure 9: ADOM – Mean days of any substance use in last 28 days
Comparing subgroups, statistically significant differences were found
between WSA and other exit types (Figure 10) and between Justice and
non-Justice referred clients (with the latter having lower rates of
substance use at every time point as shown in Table 18, Appendix B).
Figure 10: ADOM – Mean days of any substance use in last 28 days by
exit type
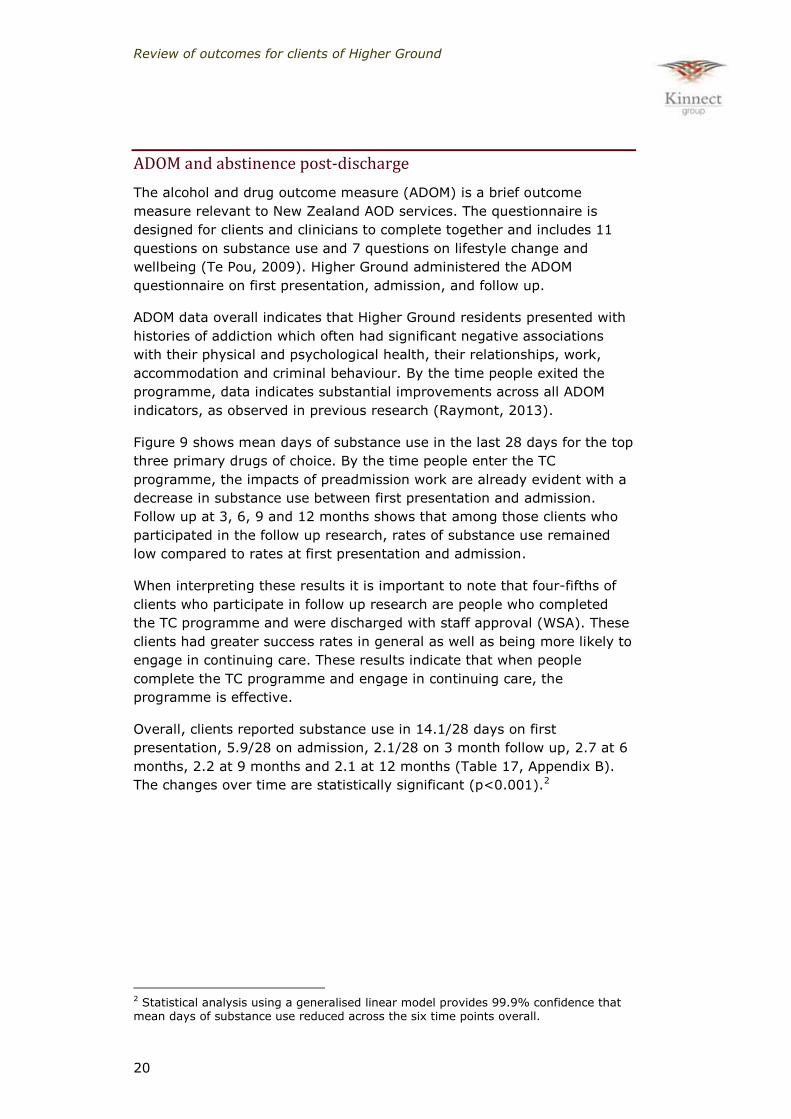
Figure 11 compares rates of abstinence from any substance (i.e., the
percentage of respondents who indicated zero days of substance use in
the past 28 days for all substances in the ADOM questionnaire). Rates of
abstinence improved markedly from first presentation to admission, and
from admission to post-discharge follow up. The increase in abstinence is
sustained for 12 months post discharge.
Review of outcomes for clients of Higher Ground
22
Figure 11: ADOM – Abstinence from any substances in last 28 days
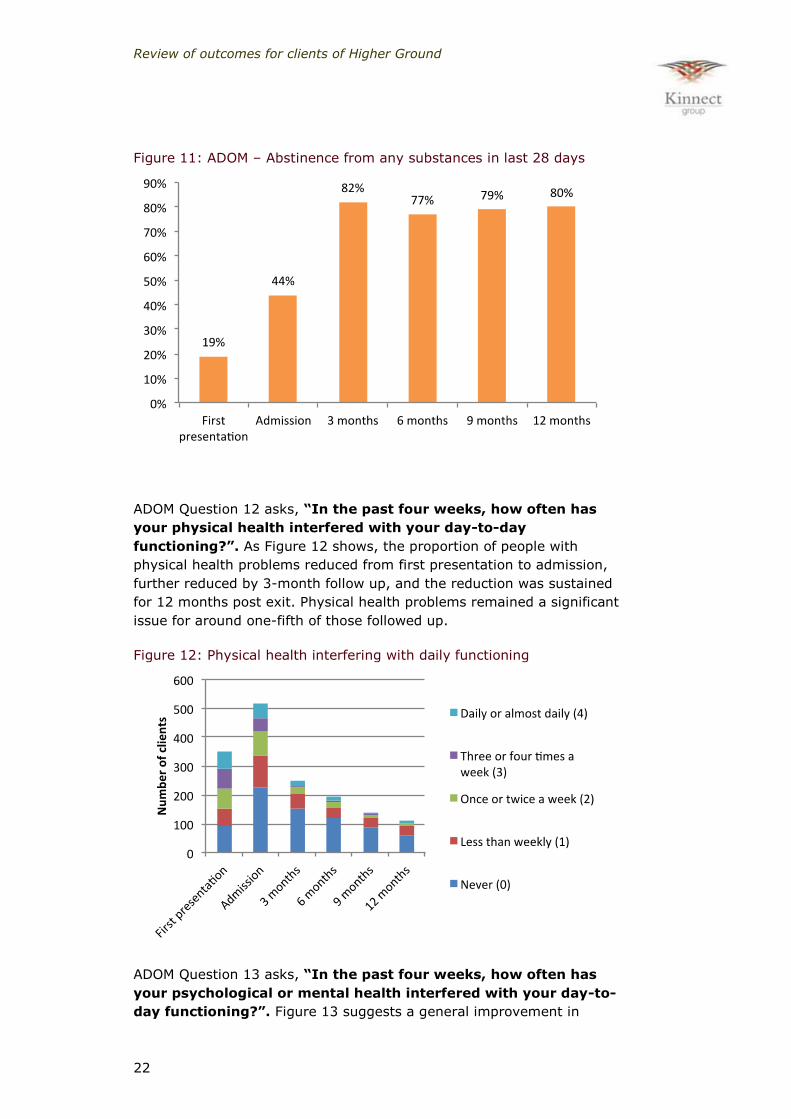
ADOM Question 12 asks, “In the past four weeks, how often has
your physical health interfered with your day-to-day
functioning?”. As Figure 12 shows, the proportion of people with
physical health problems reduced from first presentation to admission,
further reduced by 3-month follow up, and the reduction was sustained
for 12 months post exit. Physical health problems remained a significant
issue for around one-fifth of those followed up.
Figure 12: Physical health interfering with daily functioning
ADOM Question 13 asks, “In the past four weeks, how often has
your psychological or mental health interfered with your day-to-
day functioning?”. Figure 13 suggests a general improvement in

Review of outcomes for clients of Higher Ground
23
psychological/ mental health which was sustained in the 12 months post
exit. Psychological or mental health issues remained significant for around
one-fifth of those followed up.
Figure 13: Psychological health interfering with daily functioning
ADOM Question 14 asks, “In the past four weeks, how often has
your alcohol or drug use led to conflict with friends or family
members?”. This question was only asked where people indicated that
they had relapsed, i.e., used alcohol or drugs in the past four weeks.
Figure 14 indicates that conflict over AOD use was a significant issue for
many prior to entering Higher Ground, but where subsequent use had
occurred, this not led to conflict for the vast majority of clients followed
up after exiting Higher Ground.
Figure 14: Conflict with friends or family related to AOD use
Review of outcomes for clients of Higher Ground
24
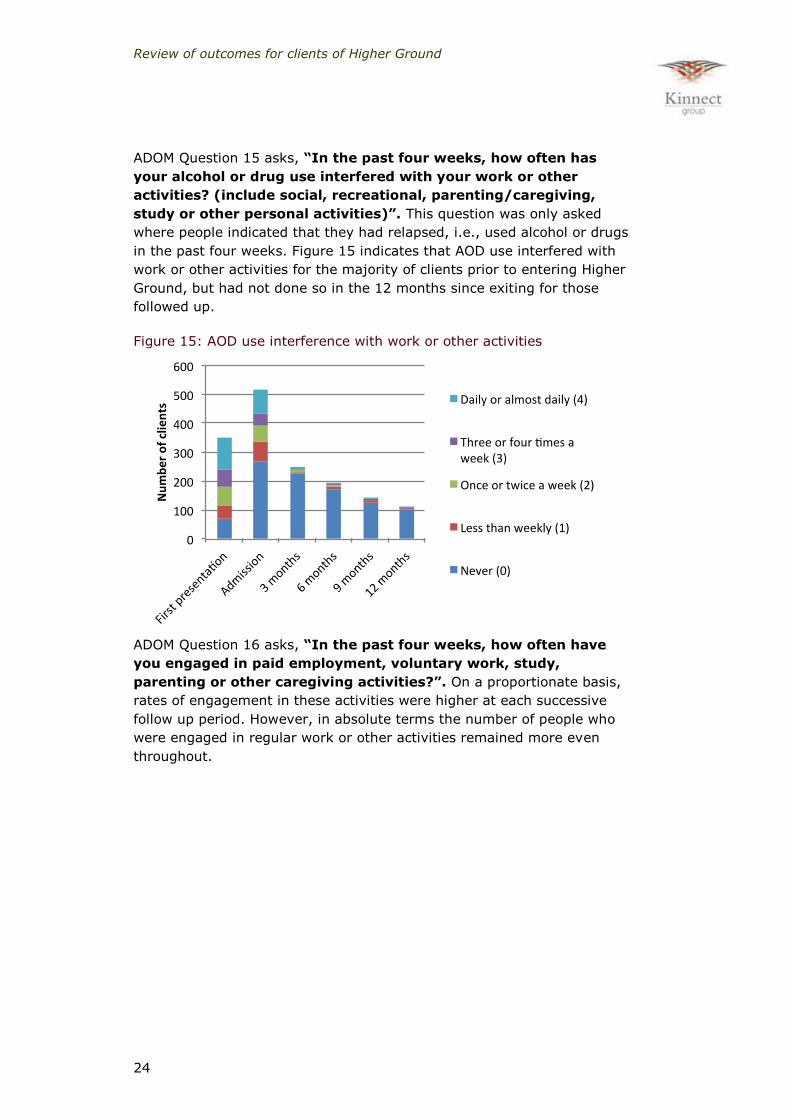
ADOM Question 15 asks, “In the past four weeks, how often has
your alcohol or drug use interfered with your work or other
activities? (include social, recreational, parenting/caregiving,
study or other personal activities)”. This question was only asked
where people indicated that they had relapsed, i.e., used alcohol or drugs
in the past four weeks. Figure 15 indicates that AOD use interfered with
work or other activities for the majority of clients prior to entering Higher
Ground, but had not done so in the 12 months since exiting for those
followed up.
Figure 15: AOD use interference with work or other activities
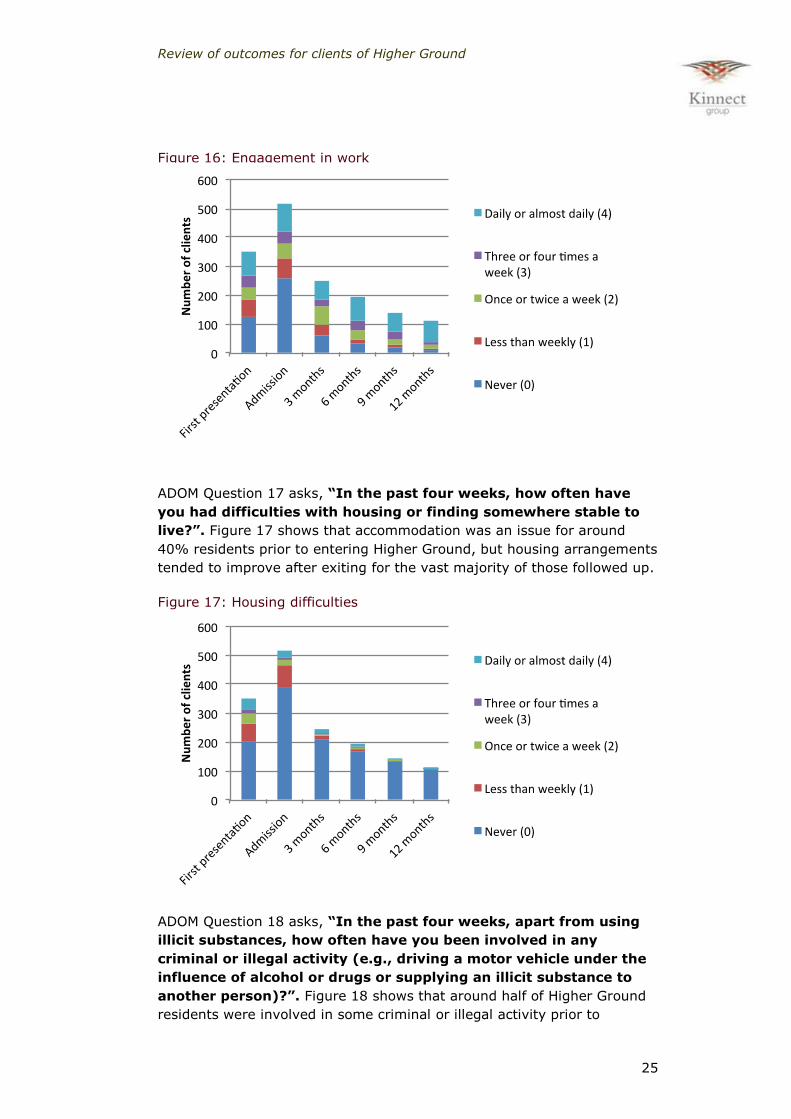
ADOM Question 16 asks, “In the past four weeks, how often have
you engaged in paid employment, voluntary work, study,
parenting or other caregiving activities?”. On a proportionate basis,
rates of engagement in these activities were higher at each successive
follow up period. However, in absolute terms the number of people who
were engaged in regular work or other activities remained more even
throughout.
Review of outcomes for clients of Higher Ground
25
Figure 16: Engagement in work
ADOM Question 17 asks, “In the past four weeks, how often have
you had difficulties with housing or finding somewhere stable to
live?”. Figure 17 shows that accommodation was an issue for around
40% residents prior to entering Higher Ground, but housing arrangements
tended to improve after exiting for the vast majority of those followed up.
Figure 17: Housing difficulties
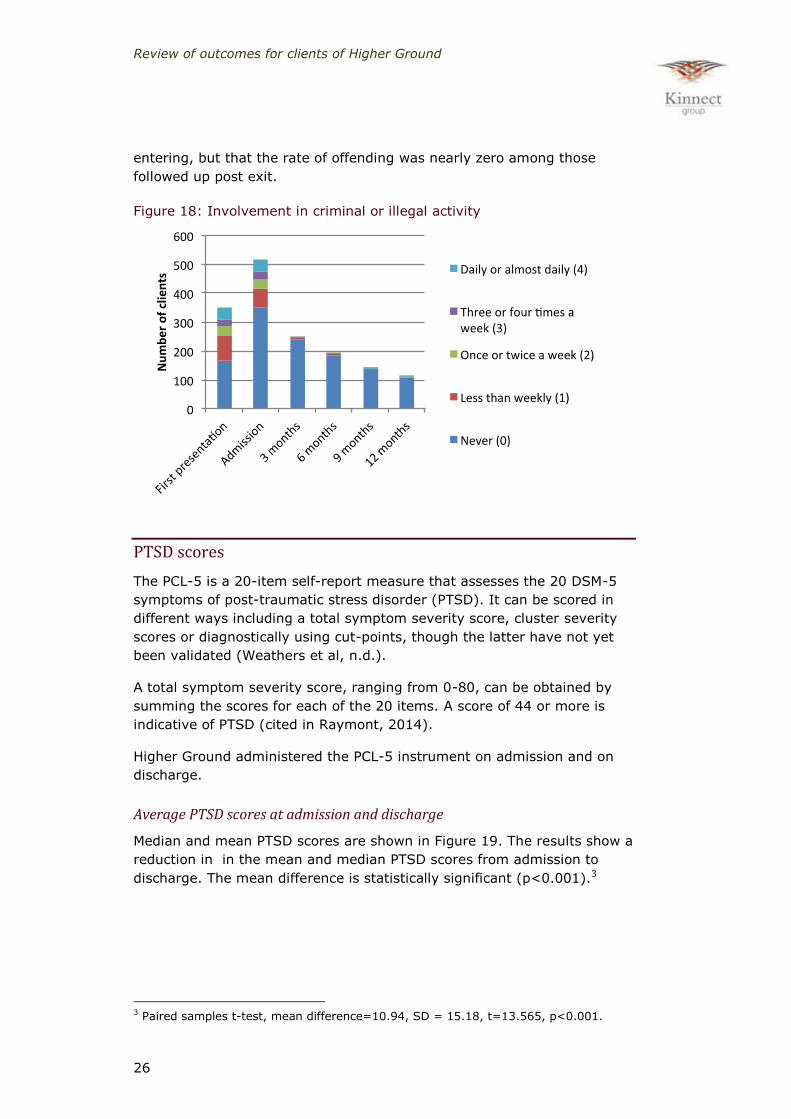
ADOM Question 18 asks, “In the past four weeks, apart from using
illicit substances, how often have you been involved in any
criminal or illegal activity (e.g., driving a motor vehicle under the
influence of alcohol or drugs or supplying an illicit substance to
another person)?”. Figure 18 shows that around half of Higher Ground
residents were involved in some criminal or illegal activity prior to
Review of outcomes for clients of Higher Ground
26
entering, but that the rate of offending was nearly zero among those
followed up post exit.
Figure 18: Involvement in criminal or illegal activity
PTSD scores
The PCL-5 is a 20-item self-report measure that assesses the 20 DSM-5
symptoms of post-traumatic stress disorder (PTSD). It can be scored in
different ways including a total symptom severity score, cluster severity
scores or diagnostically using cut-points, though the latter have not yet
been validated (Weathers et al, n.d.).
A total symptom severity score, ranging from 0-80, can be obtained by
summing the scores for each of the 20 items. A score of 44 or more is
indicative of PTSD (cited in Raymont, 2014).
Higher Ground administered the PCL-5 instrument on admission and on
discharge.
Average PTSD scores at admission and discharge
Median and mean PTSD scores are shown in Figure 19. The results show a
reduction in in the mean and median PTSD scores from admission to
discharge. The mean difference is statistically significant (p<0.001).3
3 Paired samples t-test, mean difference=10.94, SD = 15.18, t=13.565, p<0.001.

Review of outcomes for clients of Higher Ground
27
Figure 19: Mean and median PTSD scores, admission and discharge
Change in PTSD score
Figure 20 shows individual changes in clients’ PTSD scores between
admission and discharge. Evidence for the PCL for DSM-IV suggested that
a 5-10 point change represented a reliable change (i.e., change not due
to chance; indicating that a client has responded to treatment) and a 10-
20 point change represents clinically significant change (Weathers et al,
n.d.).
Overall, 51% of clients showed a clinically significant improvement and a
further 16% showed a reliable improvement in their PTSD scores below
the threshold of clinical significance. The remaining 33% were
predominantly minor changes as well as a few scores that worsened.
It is important to note that the available data may under-represent the
full improvement for Higher Ground residents as it only shows the shift in
PTSD score from admission to discharge. Pre-admission intervention
means PTSD scores may have already undergone some reduction before
the admission assessments are done. Moreover, PTSD symptoms may
continue to decrease with continuing care. Recent changes to the research
programme include administering the PTSD tool at 6-month follow up,
and this additional data will be available to include in future analysis.
42.82 42
31.87
28
Mean Median
Admission
Discharge
Review of outcomes for clients of Higher Ground
28
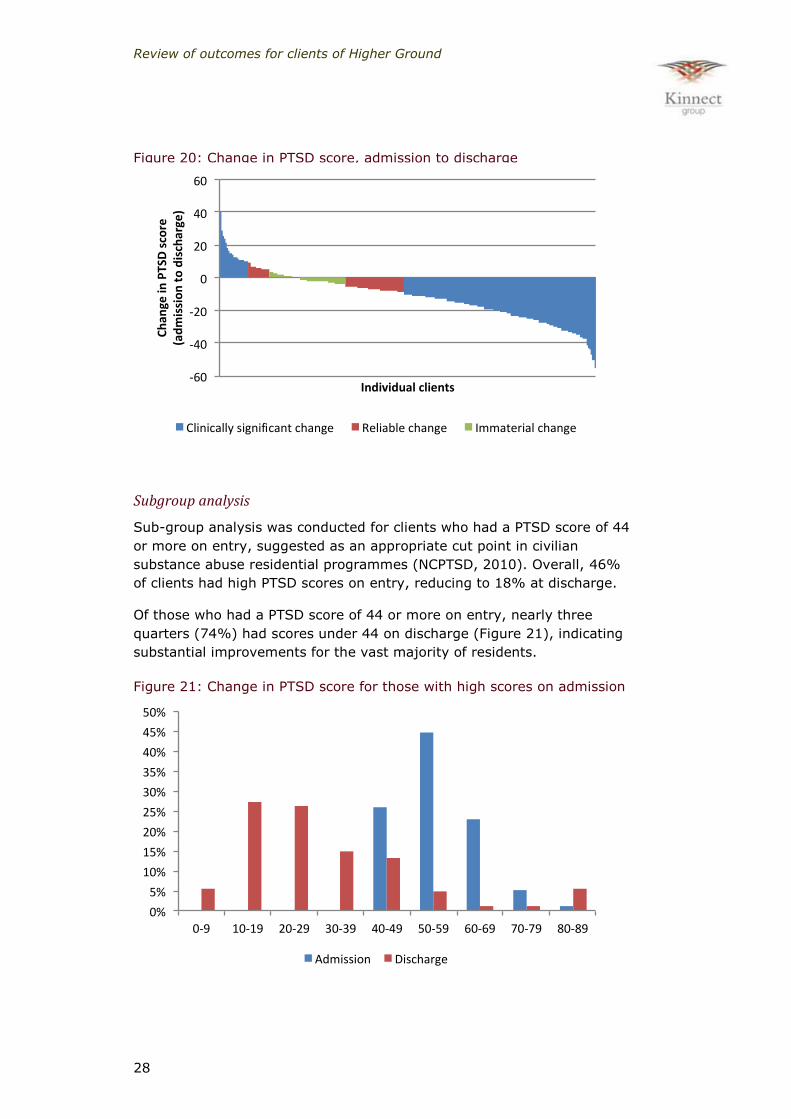
Figure 20: Change in PTSD score, admission to discharge
Subgroup analysis
Sub-group analysis was conducted for clients who had a PTSD score of 44
or more on entry, suggested as an appropriate cut point in civilian
substance abuse residential programmes (NCPTSD, 2010). Overall, 46%
of clients had high PTSD scores on entry, reducing to 18% at discharge.
Of those who had a PTSD score of 44 or more on entry, nearly three
quarters (74%) had scores under 44 on discharge (Figure 21), indicating
substantial improvements for the vast majority of residents.
Figure 21: Change in PTSD score for those with high scores on admission
-60
-40
-20
0
20
40
60
Chan
geinPTSDscore
(admissiontodischarge)
Individualclients
Clinicallysignificantchange Reliablechange Immaterialchange
0%
5%
10%
15%
20%
25%
30%
35%
40%
45%
50%
0-9 10-19 20-29 30-39 40-49 50-59 60-69 70-79 80-89
Admission Discharge

Review of outcomes for clients of Higher Ground
29
Figure 22 shows the proportion of clients with a PTSD score of 44 or more
in subgroups with significant numbers of clients. The main finding is that
improvements in PTSD scores are seen across all major subgroups. Some
differences between subgroups are also apparent. In particular, those who
exited WSA experienced significantly greater reductions than those who
exited ASA,4 and non-Justice referred clients experienced significantly
greater reductions than Justice referred clients.5 Further detail is available
in Table 35, Appendix B.
Figure 22: Subgroup analysis – percentage of clients with PTSD score 44+
DASS comparison scores
The Depression, Anxiety and Stress Scale (DASS-21) is a 21 item
questionnaire which includes three self-report scales to measure the
negative emotional states of depression, anxiety and stress. Scores for
each emotional state are calculated by summing the relevant item scores.
Scores are interpreted using the cut-points set out in Table 2 (ACPDMH,
n.d).
Table 3: Cut-points for DASS scale
Depression Anxiety Stress
Normal 0-9 0-7 0-14
Mild 10-13 8-9 15-18
Moderate 14-20 10-14 19-25
Severe 21-27 15-19 26-33
Extremely severe 28+ 20+ 34+
Source: Lovibond & Lovibond, 1995, cited in ACPDMH, n.d.
4 Repeated measures ANOVA, F(4,349)=7.965, p<0.001). Scheffe post-hoc test
showed WSA decreased significantly more than ASA (p<0.001). No other exit types were significantly different. 5 Repeated measures ANOVA, F(1,352)=11.121, p=0.001.
Review of outcomes for clients of Higher Ground
30
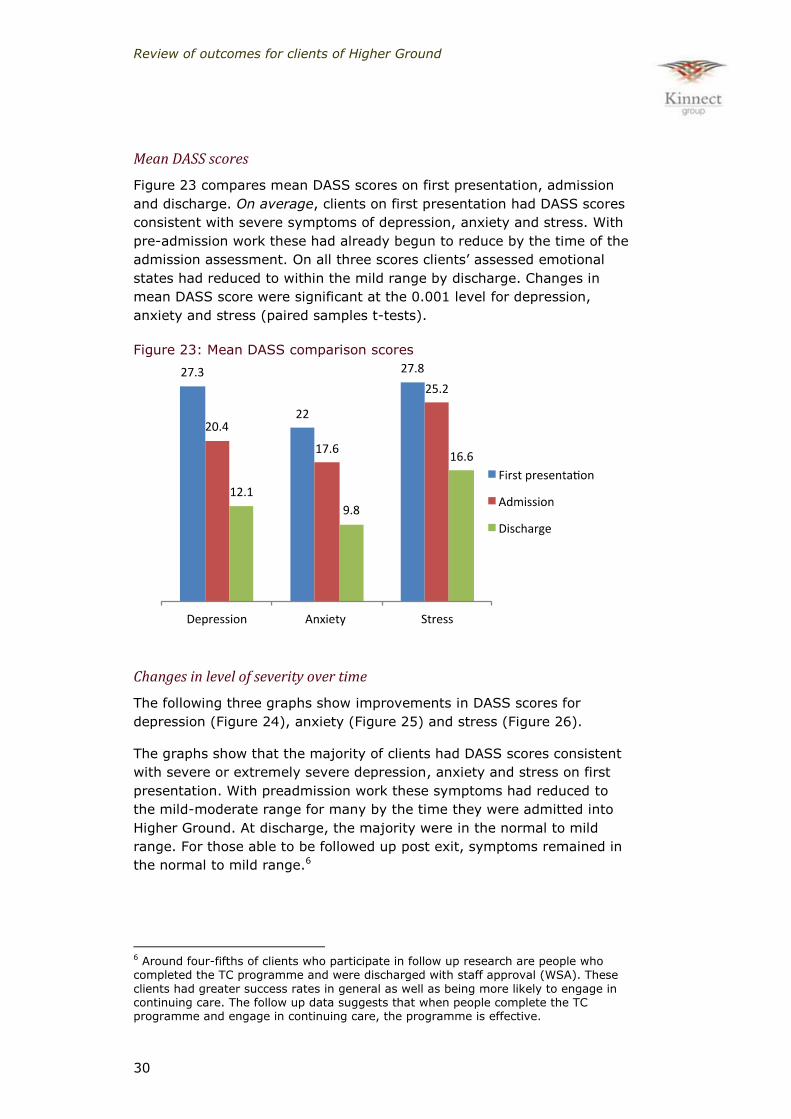
Mean DASS scores
Figure 23 compares mean DASS scores on first presentation, admission
and discharge. On average, clients on first presentation had DASS scores
consistent with severe symptoms of depression, anxiety and stress. With
pre-admission work these had already begun to reduce by the time of the
admission assessment. On all three scores clients’ assessed emotional
states had reduced to within the mild range by discharge. Changes in
mean DASS score were significant at the 0.001 level for depression,
anxiety and stress (paired samples t-tests).
Figure 23: Mean DASS comparison scores
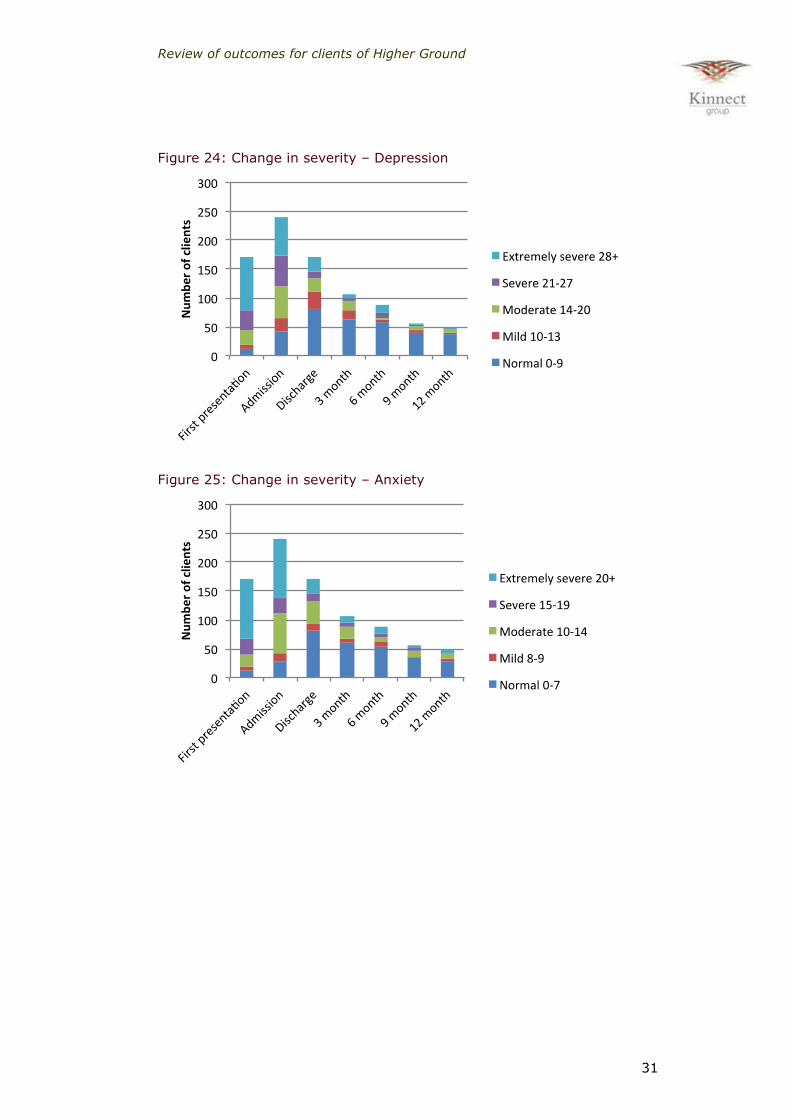
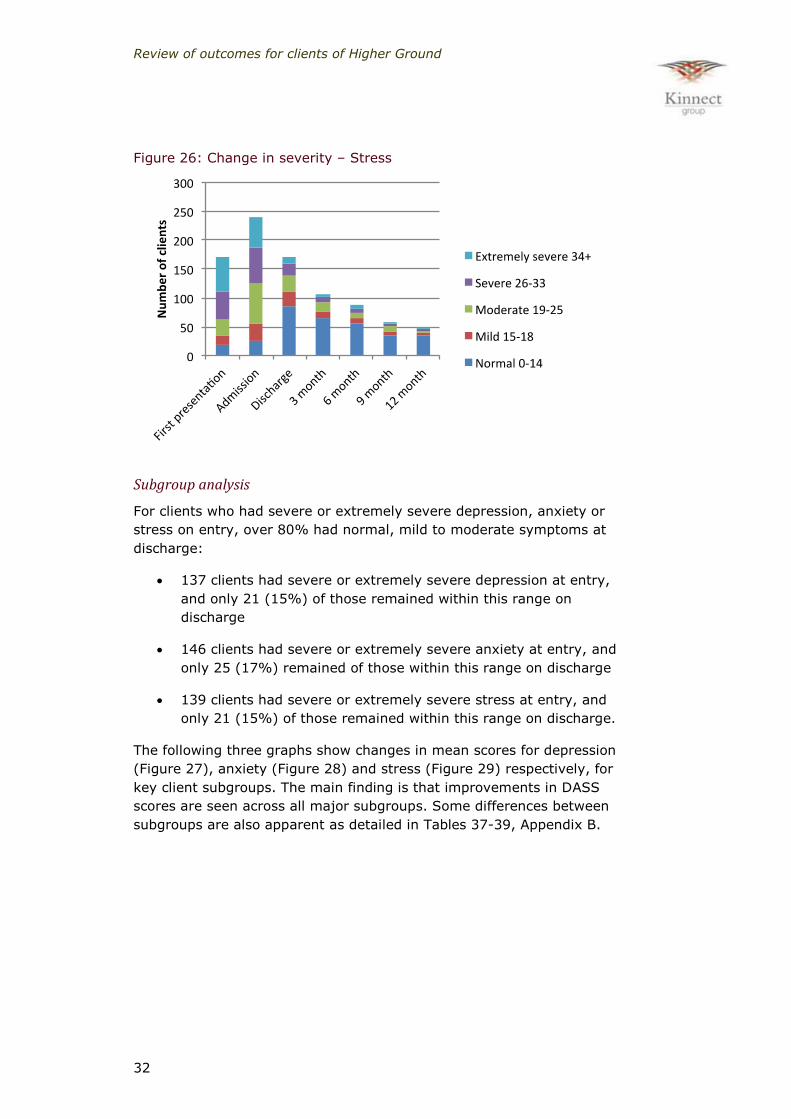
Changes in level of severity over time
The following three graphs show improvements in DASS scores for
depression (Figure 24), anxiety (Figure 25) and stress (Figure 26).
The graphs show that the majority of clients had DASS scores consistent
with severe or extremely severe depression, anxiety and stress on first
presentation. With preadmission work these symptoms had reduced to
the mild-moderate range for many by the time they were admitted into
Higher Ground. At discharge, the majority were in the normal to mild
range. For those able to be followed up post exit, symptoms remained in
the normal to mild range.6
6 Around four-fifths of clients who participate in follow up research are people who completed the TC programme and were discharged with staff approval (WSA). These
clients had greater success rates in general as well as being more likely to engage in continuing care. The follow up data suggests that when people complete the TC programme and engage in continuing care, the programme is effective.
Review of outcomes for clients of Higher Ground
31
Figure 24: Change in severity – Depression
Figure 25: Change in severity – Anxiety
Review of outcomes for clients of Higher Ground
32
Figure 26: Change in severity – Stress
Subgroup analysis
For clients who had severe or extremely severe depression, anxiety or
stress on entry, over 80% had normal, mild to moderate symptoms at
discharge:
137 clients had severe or extremely severe depression at entry,
and only 21 (15%) of those remained within this range on
discharge
146 clients had severe or extremely severe anxiety at entry, and
only 25 (17%) remained of those within this range on discharge
139 clients had severe or extremely severe stress at entry, and
only 21 (15%) of those remained within this range on discharge.
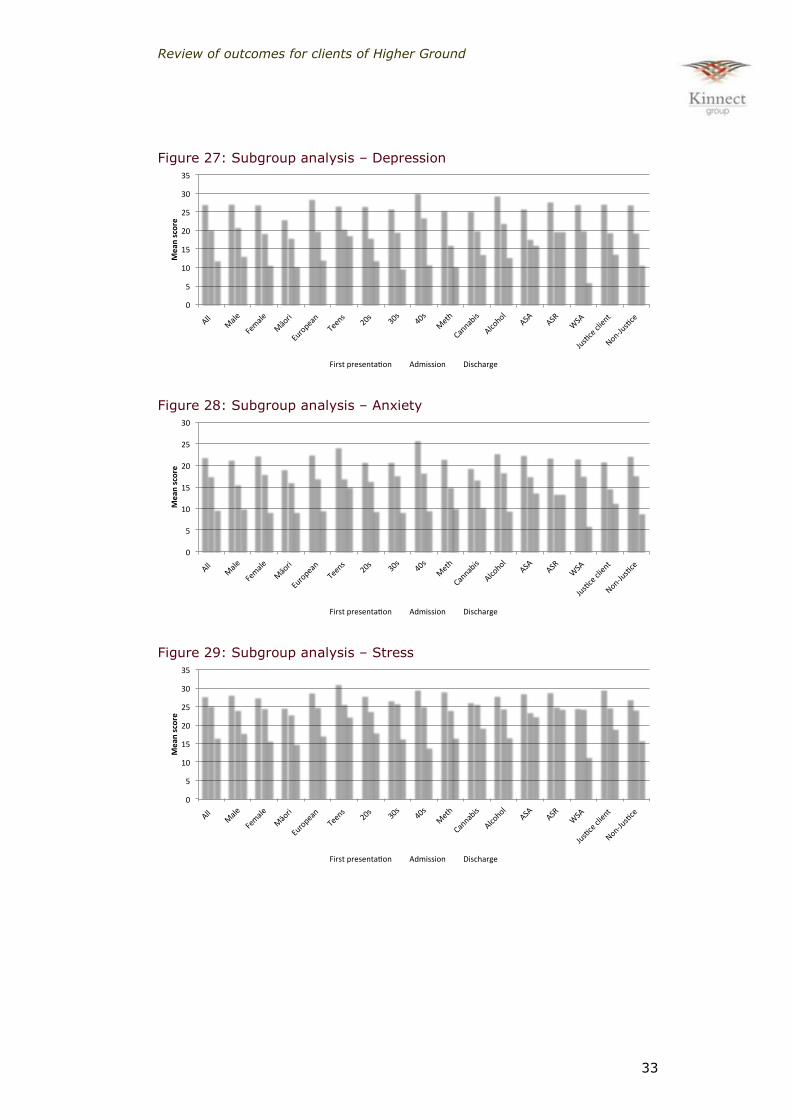
The following three graphs show changes in mean scores for depression
(Figure 27), anxiety (Figure 28) and stress (Figure 29) respectively, for
key client subgroups. The main finding is that improvements in DASS
scores are seen across all major subgroups. Some differences between
subgroups are also apparent as detailed in Tables 37-39, Appendix B.
Review of outcomes for clients of Higher Ground
33
Figure 27: Subgroup analysis – Depression
Figure 28: Subgroup analysis – Anxiety
Figure 29: Subgroup analysis – Stress
0
5
10
15
20
25
30
35
All
Male
Female
Māori
European
Teens
20s
30s
40s
Meth
Cannabis
Alcohol
ASA
ASR
WSA
Jusceclient
Non-Jusce
Mean
score
Firstpresenta on Admission Discharge
0
5
10
15
20
25
30
All
Male
Female
Māori
European
Teens
20s
30s
40s
Meth
Cannabis
Alcohol
ASA
ASR
WSA
Jusceclient
Non-Jusce
Mean
score
Firstpresenta on Admission Discharge
0
5
10
15
20
25
30
35
All
Male
Female
Māori
European
Teens
20s
30s
40s
Meth
Cannabis
Alcohol
ASA
ASR
WSA
Jusceclient
Non-Jusce
Mean
score
Firstpresenta on Admission Discharge

Review of outcomes for clients of Higher Ground
34
Maudsley physical health symptoms
The Maudsley Addiction Profile (MAP) – short form, is a brief,
multidimensional instrument designed for assessing treatment outcomes
for people with AOD problems.
The ‘health risk symptoms’ section of the MAP tool consists of 12 items as
shown in Table 4. In line with analysis conducted previously (Raymont,
2013) scores were totalled for each individual (for a maximum score of
48) and a mean score was calculated for preadmission, admission and
quarterly follow up periods.
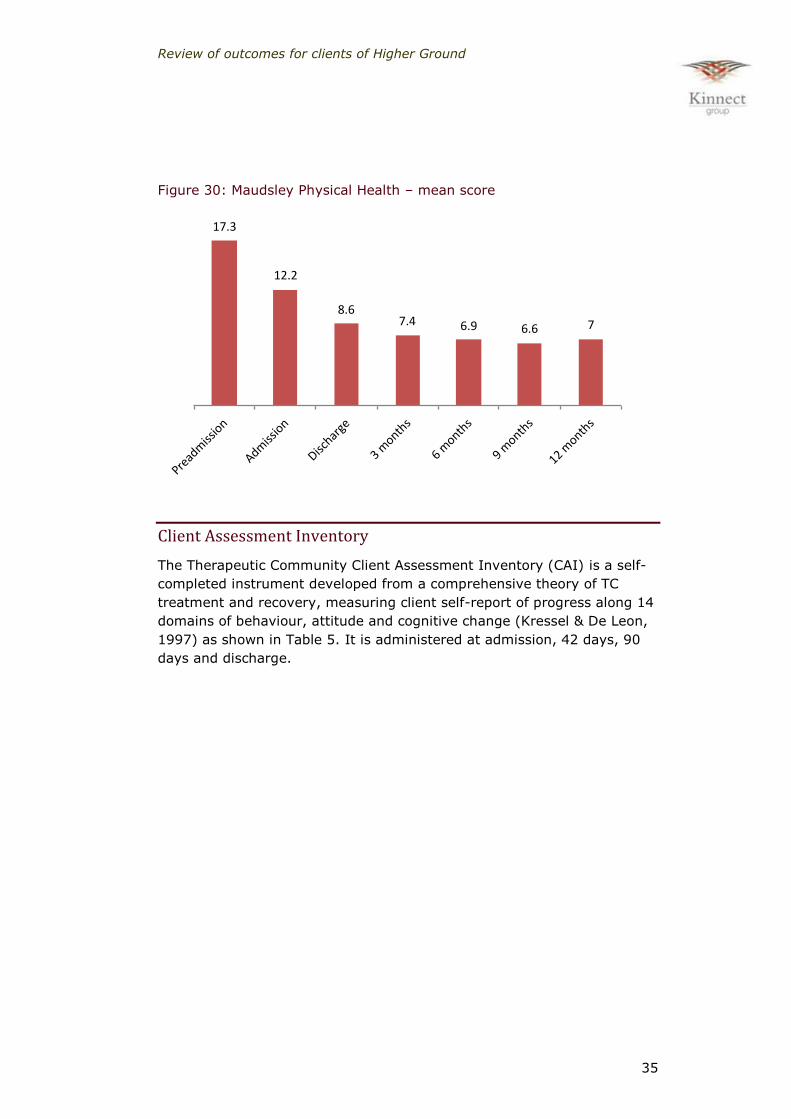
Figure 30 shows the reduction in physical health symptoms between
preadmission and admission, admission and discharge, and the
subsequent levelling off around a mean score of 7. This pattern is broadly
coherent with the improvement seen in the ADOM physical health
question discussed earlier.
Table 4: Maudsley Addiction Profile – Health Risk Symptoms section
Review of outcomes for clients of Higher Ground
35
Figure 30: Maudsley Physical Health – mean score
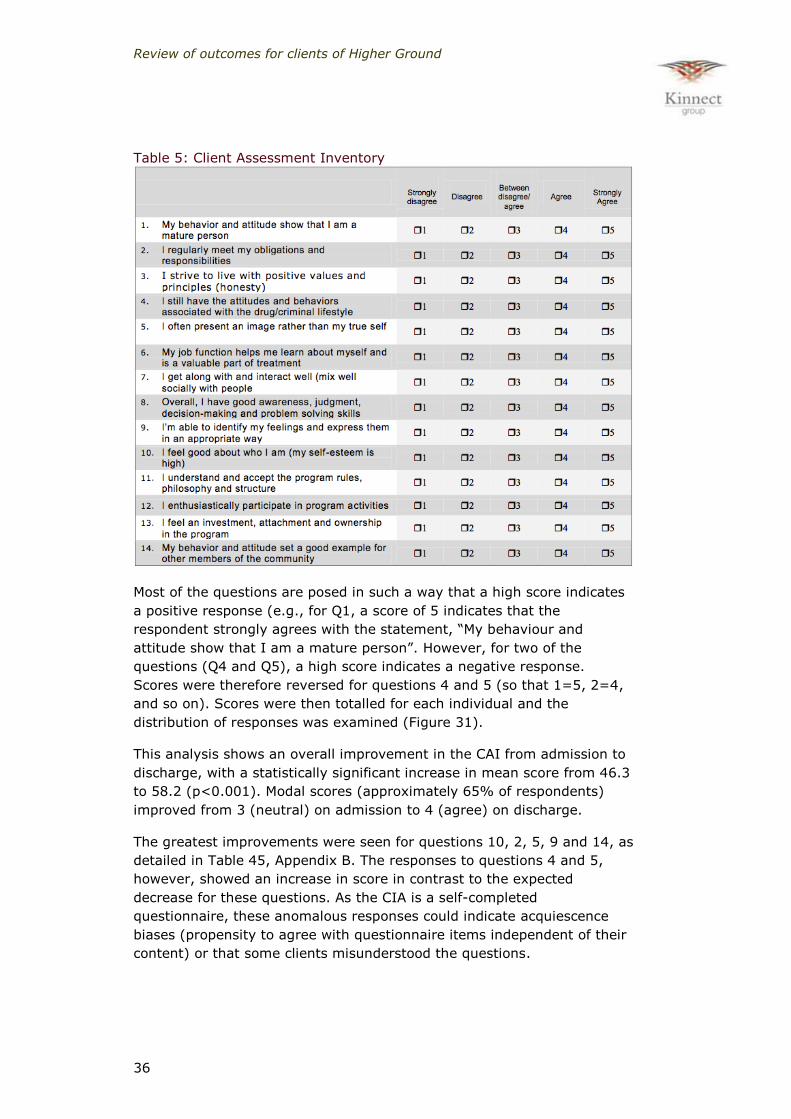
Client Assessment Inventory
The Therapeutic Community Client Assessment Inventory (CAI) is a self-
completed instrument developed from a comprehensive theory of TC
treatment and recovery, measuring client self-report of progress along 14
domains of behaviour, attitude and cognitive change (Kressel & De Leon,
1997) as shown in Table 5. It is administered at admission, 42 days, 90
days and discharge.
17.3
12.2
8.67.4 6.9 6.6 7
Preadmission
Admission
Discharge
3months
6months
9months
12months
Review of outcomes for clients of Higher Ground
36
Table 5: Client Assessment Inventory
Most of the questions are posed in such a way that a high score indicates
a positive response (e.g., for Q1, a score of 5 indicates that the
respondent strongly agrees with the statement, “My behaviour and
attitude show that I am a mature person”. However, for two of the
questions (Q4 and Q5), a high score indicates a negative response.
Scores were therefore reversed for questions 4 and 5 (so that 1=5, 2=4,
and so on). Scores were then totalled for each individual and the
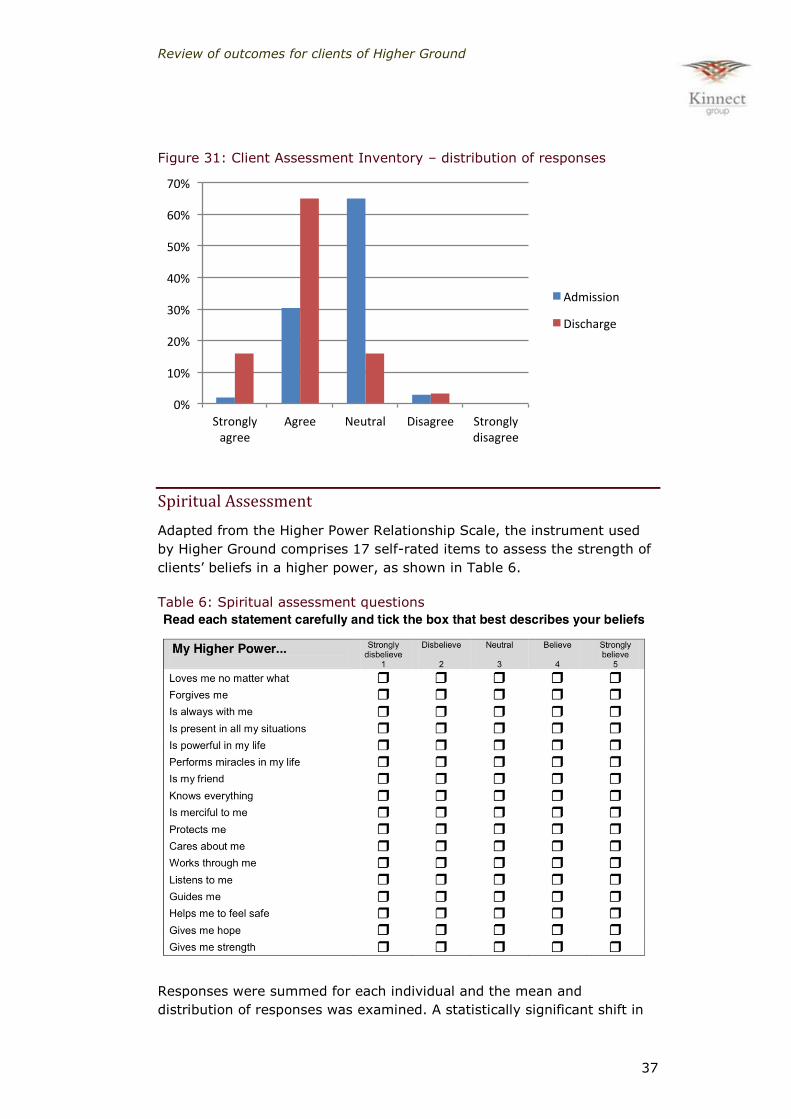
distribution of responses was examined (Figure 31).
This analysis shows an overall improvement in the CAI from admission to
discharge, with a statistically significant increase in mean score from 46.3
to 58.2 (p<0.001). Modal scores (approximately 65% of respondents)
improved from 3 (neutral) on admission to 4 (agree) on discharge.
The greatest improvements were seen for questions 10, 2, 5, 9 and 14, as
detailed in Table 45, Appendix B. The responses to questions 4 and 5,
however, showed an increase in score in contrast to the expected
decrease for these questions. As the CIA is a self-completed
questionnaire, these anomalous responses could indicate acquiescence
biases (propensity to agree with questionnaire items independent of their
content) or that some clients misunderstood the questions.
Review of outcomes for clients of Higher Ground
37
Figure 31: Client Assessment Inventory – distribution of responses
Spiritual Assessment
Adapted from the Higher Power Relationship Scale, the instrument used
by Higher Ground comprises 17 self-rated items to assess the strength of
clients’ beliefs in a higher power, as shown in Table 6.
Table 6: Spiritual assessment questions
Responses were summed for each individual and the mean and
distribution of responses was examined. A statistically significant shift in
0%
10%
20%
30%
40%
50%
60%
70%
Stronglyagree
Agree Neutral Disagree Stronglydisagree
Admission
Discharge
Review of outcomes for clients of Higher Ground
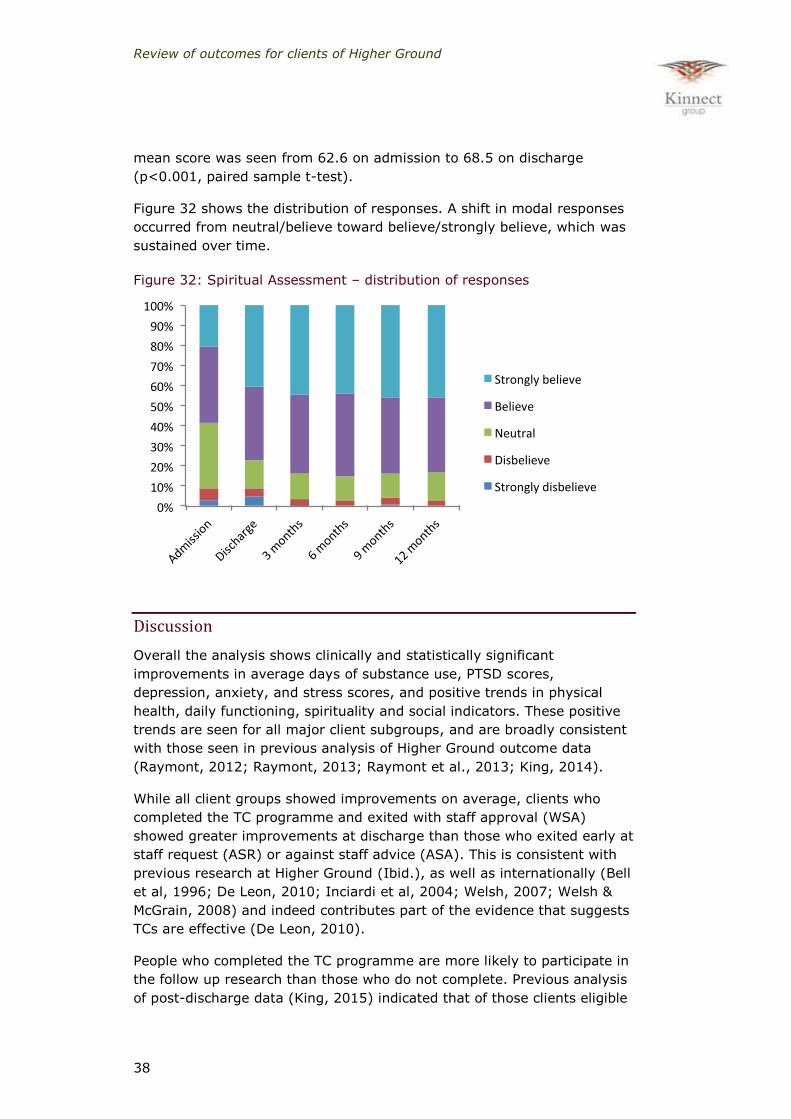
38
mean score was seen from 62.6 on admission to 68.5 on discharge
(p<0.001, paired sample t-test).
Figure 32 shows the distribution of responses. A shift in modal responses
occurred from neutral/believe toward believe/strongly believe, which was
sustained over time.
Figure 32: Spiritual Assessment – distribution of responses
Discussion
Overall the analysis shows clinically and statistically significant
improvements in average days of substance use, PTSD scores,
depression, anxiety, and stress scores, and positive trends in physical
health, daily functioning, spirituality and social indicators. These positive
trends are seen for all major client subgroups, and are broadly consistent
with those seen in previous analysis of Higher Ground outcome data
(Raymont, 2012; Raymont, 2013; Raymont et al., 2013; King, 2014).
While all client groups showed improvements on average, clients who
completed the TC programme and exited with staff approval (WSA)
showed greater improvements at discharge than those who exited early at
staff request (ASR) or against staff advice (ASA). This is consistent with
previous research at Higher Ground (Ibid.), as well as internationally (Bell
et al, 1996; De Leon, 2010; Inciardi et al, 2004; Welsh, 2007; Welsh &
McGrain, 2008) and indeed contributes part of the evidence that suggests
TCs are effective (De Leon, 2010).
People who completed the TC programme are more likely to participate in
the follow up research than those who do not complete. Previous analysis
of post-discharge data (King, 2015) indicated that of those clients eligible
0%
10%
20%
30%
40%
50%
60%
70%
80%
90%
100%
Admission
Discharge
3months
6months
9months
12months
Stronglybelieve
Believe
Neutral
Disbelieve
Stronglydisbelieve
Review of outcomes for clients of Higher Ground
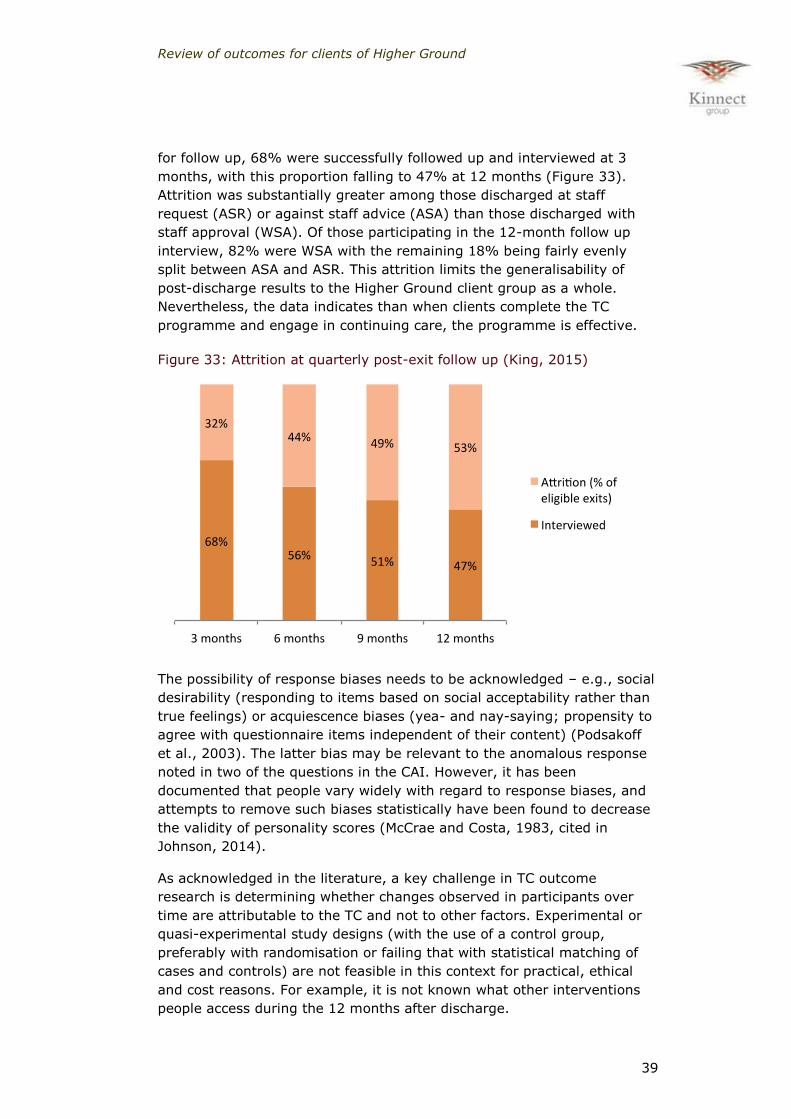
39
for follow up, 68% were successfully followed up and interviewed at 3
months, with this proportion falling to 47% at 12 months (Figure 33).
Attrition was substantially greater among those discharged at staff
request (ASR) or against staff advice (ASA) than those discharged with
staff approval (WSA). Of those participating in the 12-month follow up
interview, 82% were WSA with the remaining 18% being fairly evenly
split between ASA and ASR. This attrition limits the generalisability of
post-discharge results to the Higher Ground client group as a whole.
Nevertheless, the data indicates than when clients complete the TC
programme and engage in continuing care, the programme is effective.
Figure 33: Attrition at quarterly post-exit follow up (King, 2015)
The possibility of response biases needs to be acknowledged – e.g., social
desirability (responding to items based on social acceptability rather than
true feelings) or acquiescence biases (yea- and nay-saying; propensity to
agree with questionnaire items independent of their content) (Podsakoff
et al., 2003). The latter bias may be relevant to the anomalous response
noted in two of the questions in the CAI. However, it has been
documented that people vary widely with regard to response biases, and
attempts to remove such biases statistically have been found to decrease
the validity of personality scores (McCrae and Costa, 1983, cited in
Johnson, 2014).
As acknowledged in the literature, a key challenge in TC outcome
research is determining whether changes observed in participants over
time are attributable to the TC and not to other factors. Experimental or
quasi-experimental study designs (with the use of a control group,
preferably with randomisation or failing that with statistical matching of
cases and controls) are not feasible in this context for practical, ethical
and cost reasons. For example, it is not known what other interventions
people access during the 12 months after discharge.

Review of outcomes for clients of Higher Ground
40
The design of this research therefore limits the conclusions that can be
drawn about causality. Although the participants of the Higher Ground TC
programme have shown significant and lasting improvements over time,
factors other than the intervention could conceivably explain these
improvements. Examples include:
Regression to the mean or ceiling effects (people with high scores
at pre-test are statistically likely to move toward more moderate
scores at post-test with or without treatment, not necessarily
indicating recovery).
History (e.g., interventions prior to entering Higher Ground, such
as crisis or detox services, may also contribute to outcomes).
Maturation (effects related to natural changes that people might
experience with the passage of time; some people may experience
spontaneous remission even if they do not receive treatment).
The Bradford Hill Criteria for causal inference7 offer a set of nine
viewpoints for assessing a possible causal relationship between an
incidence and a consequence, five of which are relevant here. These
viewpoints cannot provide indisputable evidence to support a causal
inference but provide a framework for weighing the evidence for or
against a possible interpretation of cause and effect. The Bradford Hill
Criteria have been used extensively in epidemiology. De Leon (2010) has
argued that the totality of research on TCs is consistent with these
causation criteria.
The following table sets out the five relevant criteria and summarises their
use in making causal inferences from the data presented above.
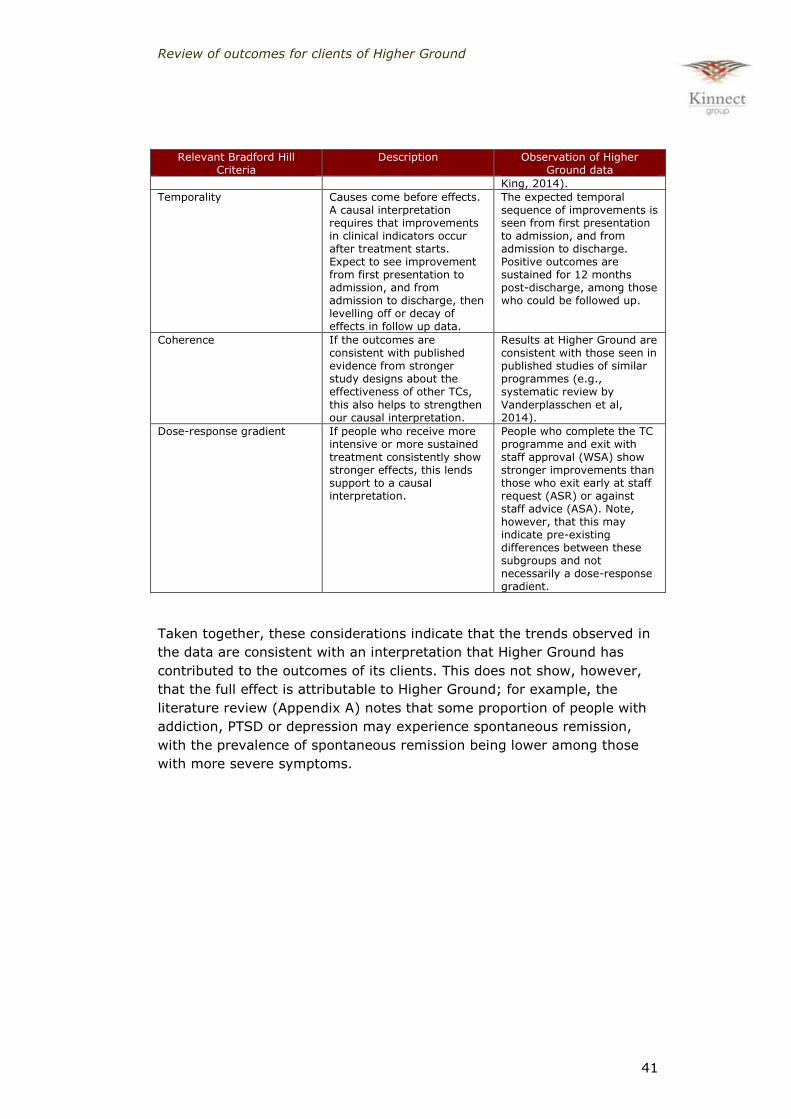
Table 7: Bradford Hill Criteria Relevant Bradford Hill
Criteria Description Observation of Higher
Ground data
Strength Association does not prove causation. However, large
clinically significant improvements, in combination with other viewpoints, can lend support to a causal interpretation.
Clinically and statistically significant positive shifts are
seen in days of AOD use, and mean PTSD, depression, anxiety, and stress scores, as well as clear positive trends in physical health, daily functioning, and social indicators.
Consistency Similar results across multiple cohorts/years lends support to a causal interpretation.
Positive shifts are seen across multiple indicators and across all major client subgroups. The results are also broadly consistent with those seen in previous research at Higher Ground for earlier cohorts of clients (Raymont, 2012; Raymont, 2013; Raymont et al., 2013;
7 See: http://www.who.int/bulletin/volumes/83/10/792.pdf
Review of outcomes for clients of Higher Ground
41
Relevant Bradford Hill Criteria
Description Observation of Higher Ground data
King, 2014).
Temporality Causes come before effects. A causal interpretation requires that improvements in clinical indicators occur after treatment starts. Expect to see improvement from first presentation to admission, and from admission to discharge, then levelling off or decay of effects in follow up data.
The expected temporal sequence of improvements is seen from first presentation to admission, and from admission to discharge. Positive outcomes are sustained for 12 months post-discharge, among those who could be followed up.
Coherence If the outcomes are consistent with published evidence from stronger study designs about the effectiveness of other TCs,
this also helps to strengthen our causal interpretation.
Results at Higher Ground are consistent with those seen in published studies of similar programmes (e.g., systematic review by
Vanderplasschen et al, 2014).
Dose-response gradient If people who receive more intensive or more sustained treatment consistently show stronger effects, this lends support to a causal interpretation.
People who complete the TC programme and exit with staff approval (WSA) show stronger improvements than those who exit early at staff request (ASR) or against staff advice (ASA). Note, however, that this may indicate pre-existing differences between these subgroups and not necessarily a dose-response gradient.
Taken together, these considerations indicate that the trends observed in
the data are consistent with an interpretation that Higher Ground has
contributed to the outcomes of its clients. This does not show, however,
that the full effect is attributable to Higher Ground; for example, the
literature review (Appendix A) notes that some proportion of people with
addiction, PTSD or depression may experience spontaneous remission,
with the prevalence of spontaneous remission being lower among those
with more severe symptoms.

Review of outcomes for clients of Higher Ground
42
3 Return on Investment
Few studies have been conducted on the cost-effectiveness of TC
programmes. Yates (2010) undertook a literature search and analysis of
cost-related studies which compared the expenditure and benefits of
residential and non-residential treatments for addiction. Most studies
supported the view that treatment interventions save society money
overall. Most also recognised that the population seen by drug-free TCs
was “more damaged” than those presenting to other modalities, but few
studies weighted their findings for this difference.
The following analysis explores the potential return on investment (ROI)
associated with outcomes for clients of Higher Ground, based on the
results of the outcome study. It should be regarded as an exploratory
scenario analysis and not a definitive valuation.
A key challenge in estimating ROI from Higher Ground’s TC programme is
that the financial investment in the programme is relatively
straightforward to quantify, whereas the outcomes are more difficult to
value in monetary terms. Examples of outcomes with potential
monetisable value include:
Public and private economic benefits (e.g., people who recover
from AOD addiction are able to participate more meaningfully in
employment, training and education, and this contributes to
improving economic productivity as well as their own incomes).
Reduced costs to taxpayers (e.g., those who successfully complete
the programme and remain abstinent or minimise AOD related
harm may consume fewer health care resources, less Police time,
etc).
Wider benefits for society (e.g., reduced AOD dependency may
lead to reduced social costs related to crime, drug production, road
crashes, etc).
Reduced burden of AOD-related harm on society, and increased
productivity, cannot directly be attributed to Higher Ground using
available data but can be estimated through scenario analysis.
For example, a 2009 study by BERL Economics estimated the burden of
AOD-related harm. In 2005/06, the total burden of harmful AOD use in
New Zealand had estimated social costs of $6,525 million per annum.
Based on 513,000 harmful alcohol users, 27,000 other drug users and
127,000 joint alcohol and other drug users, the study estimated that
harmful drug use cost approximately $9,783 per user, with over 70% of
these impacts ($6,848) being tangible resource costs (productive

Review of outcomes for clients of Higher Ground
43
resources diverted due to harmful AOD use such as lost output, crime
costs, drug production, health care costs and road crashes).
Using estimates from international research, the study suggested that
somewhere in the order of 50% of the social costs of harmful drug use
may be avoidable at a population level with the implementation of
appropriate public policies and behaviour changes.
Based on the estimates from the BERL study, people who minimise harm
from AOD use for one year might, on average, avoid tangible societal
costs of $5,067 (50% of total tangible costs per person per year, CPI
adjusted to Q4, 2014).
A review of the BERL study (Crampton & Burgess 2009) argued that the
BERL study over-states the costs of AOD related harm, finding
“substantial flaws in BERL’s method”.
On the other hand, this average figure may under-estimate the social
costs associated with Higher Ground clients, bearing in mind that people
using Higher Ground are coming from the high-acuity end of harmful AOD
use when they enter the programme.
In the absence of better economic data, the 80/20 rule provides a
defensible basis for estimating the value of avoidable AOD related harm
among Higher Ground clients. The 80/20 rule (or Pareto principle) states
that roughly 80% of effects come from 20% of causes. In New Zealand
and internationally, studies have shown that 20% of offenders are
responsible for 80% of offending (Ministry of Justice, 2013). Similarly,
roughly 20% of health care users in the United States consume 80% of
resources (Krugman & Wells, 2006).
If 20% of AOD users are responsible for 80% of the avoidable tangible
societal costs of AOD-related harm, and if Higher Ground clients are
representative of that 20% of AOD users prior to entering treatment, then
each participant who minimises harm from AOD use might, on average,
avoid tangible societal costs of around $20,000 per year.
ROI on Higher Ground client outcomes
Based on ADOM data for substance use, physical and psychological
health, relationships, accommodation, work and criminal offending, the
vast majority of clients who participated in follow up research were
minimising harm from AOD use and sustained this for 12 months post
discharge.
As noted earlier, around four-fifths of those followed up at 12 months
were those who completed the programme with staff approval (WSA). If
the results are generally representative of all WSAs, then approximately
Review of outcomes for clients of Higher Ground
44
200 clients may have been able to sustain a lifestyle free from AOD-
related harm since leaving Higher Ground over the past three years.
The estimated benefits associated with these 200 clients total $4 million
in one year (200 x $20,000). If these benefits are extrapolated over ten
years, allowing for an assumed 20% attrition per annum and a discount
rate of 5%, then total benefits to society over ten years from these clients
would be in the realm of $15 million.
The programme is funded at an average bed day rate of $148. On this
basis, total programme costs for all 524 clients over the past three years
are estimated at $6.6 million (44,522 bed-days at $148).
When total costs are compared to the estimated benefits of $15 million
over ten years, the TC programme creates value of around $2 for every
$1 spent in the programme. This equates to a return on investment (ROI)
of 9% per annum.
Under these parameters, the benefits from the first two years of post
discharge outcomes would be more than sufficient to ‘pay back’ the costs
of the programme.
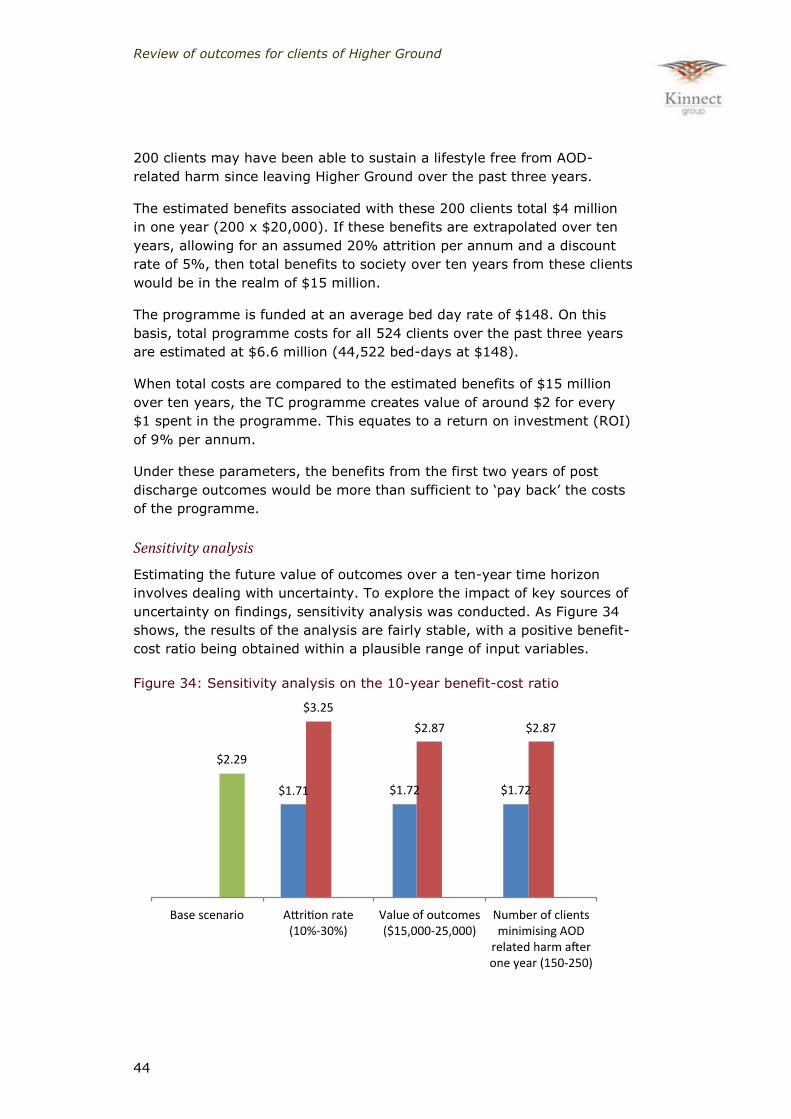
Sensitivity analysis
Estimating the future value of outcomes over a ten-year time horizon
involves dealing with uncertainty. To explore the impact of key sources of
uncertainty on findings, sensitivity analysis was conducted. As Figure 34
shows, the results of the analysis are fairly stable, with a positive benefit-
cost ratio being obtained within a plausible range of input variables.
Figure 34: Sensitivity analysis on the 10-year benefit-cost ratio
Review of outcomes for clients of Higher Ground
45
Sensitivity analysis also explored the threshold of each variable that
would return a benefit-cost ratio of zero (i.e., the break-even point). The
benefits of the programme balance the costs if: the assumed attrition rate
is increased to 56% per annum after the end of the first year post-
discharge; or the value of outcomes is reduced to $9,000 per person per
year; or if 89 clients (the actual number of participants in 12-month
follow up research who indicated they had not used any substance in the
preceding 28 days) minimise AOD-related harm after one year post
discharge.
Discussion
This scenario analysis suggests that the Higher Ground programme
creates more value for society than it consumes. This indicates that the
service is worth funding on efficiency grounds.
It is important not to lose sight of the real value of Higher Ground:
Transformations in the lives of people with addiction issues, their families
and associated benefits to the wider community. Money is simply a
convenient way of representing real value.
Available evidence from outcome monitoring data indicates that Higher
Ground not only returns a positive ROI but is also valuable in other ways.
It is effective in meeting identified needs and achieving outcomes with its
clients, and reducing health inequalities. Results also indicate the
programme has cultural and spiritual value.
On all of these dimensions, results indicate the programme is worthwhile
and valuable.
Review of outcomes for clients of Higher Ground
46
4 Evaluative conclusions
Overall, clients of Higher Ground over the past three years have
experienced clinically relevant and statistically significant recovery from
AOD use and associated reductions in assessed symptoms of PTSD,
depression, anxiety and stress. Associated with these changes, people
have also experienced subjective improvements in physical health, daily
functioning, work, housing, relationships and spirituality.
The observed changes were sustained for 12 months post discharge. The
outcomes meet Bradford Hill Criteria for causal inference of strength,
consistency, temporality, and coherence.
When evaluated against the agreed performance criteria (Table 2), the
outcomes at discharge and post-discharge meet most of the criteria for
“highly effective” and all of the criteria for “effective”, as follows.
Programme completion
Overall, 41.5% of clients completed the programme with staff approval
(WSA) and 3.5% transferred to another service. Therefore 45% of clients
are regarded as having completed the TC programme. This meets the
threshold for “effective” but is below the threshold for “highly effective”.
Clinically significant shifts in PTSD and DASS scores between admission and
discharge
Clients who had a high PTSD score of 44 or more on entry experienced
improvements to the extent that 74% had PTSD scores of under 44 on
discharge.
Clients who had severe or extremely severe depression scores
experienced improvements to the extent that 85% had moved into the
normal-mild-moderate range on discharge.
Clients who had severe or extremely severe anxiety scores experienced
improvements to the extent that 83% had moved into the normal-mild-
moderate range on discharge.
Clients who had severe or extremely severe stress scores experienced
improvements to the extent that 85% had moved into the normal-mild-
moderate range on discharge.
These results exceed the criteria for “highly effective”. Furthermore, the
shift from admission to discharge may under-represent the full extent of
changes achieved, as DASS scores were higher at first presentation than
admission, and lower at 12-month follow up than at discharge.
Review of outcomes for clients of Higher Ground
47
Abstinence at 3 and 12 months post discharge
Of those clients who were able to be followed up at 3 and 12 months,
82% and 80% respectively had been abstinent from any AOD use in the
preceding 28 days. This exceeds the criteria for “highly effective”.
Conclusion
Overall these results, when benchmarked against agreed criteria informed
by international literature, indicate that Higher Ground is effective in
working with its clients.
Furthermore, scenario analysis indicates that Higher Ground creates more
value for society than it consumes and is therefore worth funding on
efficiency grounds.

Review of outcomes for clients of Higher Ground
48
Appendix A: Evidence for TCs – international context
A rapid review of the literature on therapeutic communities (TCs)
indicates that while there is good evidence that TCs work, little research
has been conducted to establish why and how they work (De Leon, 2000;
Pearce & Pickard, 2012).
Moreover, comparing results of different programmes is problematic
because TCs vary, treatment approaches vary, and the chronic and
relapsing nature of MA dependence means individual recovery pathways
vary (Bahr et al, 2012; De Leon, 2010; McKetin et al, 2010). There is a
wide diversity of TCs and not one “best” model. In a TC context,
emergent evidence may be informed by practice as much as practice is
informed by evidence.
ATCA (2002) notes that evidence-based practice has tended to focus
more on treatment content than on the TC itself. Evidence-based practice
has been defined as “conscientious, explicit and judicious use of current
best evidence in making decisions about individual patients” (Sackett et al
1996, cited in ATCA, 2002) and as an approach that “takes account of
evidence at a population level as well as encompassing interventions
concerned with the organisation and delivery of health care” (Silagy &
Haines 1998, cited in ATCA, 2002).
A central tenet of evidence-based practice is that research evidence is a
component of the decision making process, but is not the only
component. Other aspects (clinical expertise, patient preference, needs,
priorities and resources) are also important considerations (ATCA, 2002).
In order to identify “best” evidence, and use it judiciously, it is important
to critically appraise research evidence, including quality (the methods
used to minimise bias in study design), relevance (outcome measures
used and applicability of results to other treatments, settings and
patients) and strength (the magnitude, precision and reproducibility of the
intervention effect (National Health and Medical Research Council, 1999,
cited in ATCA, 2002).
Randomised controlled trials (RCTs), conducted with observers, treating
personnel and participants blind to their group allocation, are widely
considered to be the best way of achieving adequate control of bias.
However, in the case of the TC approach to the treatment of illicit drug
use, RCTs are problematic and the use of double-blind methods
impossible, particularly for comparisons with other treatment approaches.
The use of random allocation is becoming more common to investigate
particular aspects of the TC approach, or the effect of different adjunct
treatments. Most evidence on the efficacy and effectiveness of therapeutic
communities has come from follow-up studies such as the Drug Abuse
Review of outcomes for clients of Higher Ground
49
Treatment Outcome Study (DATOS) in the USA and the National
Treatment Outcome Research Study (NTORS) in the UK (ATCA, 2002).
The literature highlights a number of methodological challenges that
affect outcome measurements and definitive statements on the
effectiveness of TCs (e.g., Bahr et al, 2012; De Leon, 2010; Rawlings,
1998; Smith et al, 2006; Welsh and Zajac, 2004; and, more generally,
Ioadannis, 2005). Key examples of methodological challenges include:
Difficulty isolating the effect of the TC from other factors (i.e., was
it the TC that caused change or something else?)
The problem of defining successful outcomes
Problems of finding matched controls
Self selection and attrition biases
High drop out rates
Problems of contacting ex-prisoners for follow up
Behavioural outcomes and tools measured to use them vary widely
across studies (e.g., definitions of recidivism vary)
Generalisability of findings across different measures, sites and
contexts is questionable
Problems with assessing self-reported drug use and other data
Examination of the effect of programme components in isolation
rather than the interaction of the multiple components that
comprise a TC
Poor accounting for variations in treatment dosage as well as
relationships between inmate characteristics, treatment processes,
and outcomes in evaluations of TCs
Potential bias in results from not including drop outs or treatment
failures in evaluation of results (De Leon, 2010; Rawlings, 1998;
Welsh, 2007; Wormith et al., 2007; Vanderplasschen et al., 2013).
In a 2006 Cochrane8 review, Smith et al (p.2) concluded, “There is little
evidence that TCs offer significant benefits in comparison with other
residential treatment, or that one type of TC is better than another”.
On the other hand, De Leon (2010), notes that the sheer number of
outcome studies and “striking congruence” of their findings provide a
8 The Cochrane Collaboration is an independent, non-profit NGO that conducts systematic reviews of well-conducted RCTs of healthcare interventions. These reviews are published in the Cochrane Library, a key resource in evidence-based medicine.

Review of outcomes for clients of Higher Ground
50
compelling argument for the efficacy of the drug-free TC. De Leon (2010)
argues that the totality of research is consistent with causality criteria of:
i) strength of association; ii) dose-response relationship; iii) consistency
of association; iv) temporally correct association; v) specificity of
experimental evidence; and iv) coherence with existing knowledge.9
A recent review of the evidence for effectiveness of TCs, including 16
experimental studies conducted in North America and 14 observational
studies conducted in Europe found that there is some evidence for
effectiveness of TC treatment in terms of reduced substance use and
criminal activity, while some studies also showed positive effects on
employment, social functioning and general mental health
(Vanderplasschen et al, 2014).
Intended outcomes of TCs
Although an explicit intervention logic for TCs was not found in the
literature, rich descriptions of the intended functioning and rationale for
TCs is expressed in books such as De Leon (2010) and the following
progression of outcomes is implicit in the TC design and the existing body
of research:
Early ‘process’ changes – for example:
Learning how the TC works; establishing some trusting
relationships with staff/peers
Participation in the TC/other programme and acceptance of its
norms
Personal growth and development – for example:
Acceptance of responsibility for self, drug use, related behaviours,
problems and solutions
Acquisition of interpersonal skills and pro-social behaviours and
attitudes
Setting an example for other residents
Growth in job roles and responsibilities (e.g., starting to facilitate
groups)
Elevated self-esteem
Improved psychological functioning, attitudes and behaviour – for
example:
9 In this study we have used the Bradford Hill Criteria to inform causal inference in the analysis of Higher Ground data. http://www.who.int/bulletin/volumes/83/10/792.pdf

Review of outcomes for clients of Higher Ground
51
Increased cognitive skills, emotional skills, insights into life
problems and ability to reflect on and regulate one’s own impulses,
behaviours and attitudes
Behaviour becoming more consistent with the values of right living
(e.g., honesty, self-reliance, responsible concern, community
responsibility, work ethic)
Improved psychological wellbeing (e.g., reductions in dysphoria,
anxiety, depression, hostility/anger, etc)
Longer-term outcomes – for example:
Remaining drug and alcohol free, and firmly committed to the
recovery process
Taking up education/training/work
Reduced offending.
Underpinning these outcomes is the principle of change as a complex,
multi-dimensional, non-linear process, involving the whole person (De
Leon, 2000).
Effectiveness of TCs and adjunct therapies
The Higher Ground residential programme incorporates evidence-based
models and practices that are supported by the literature.
Effective entry and induction into a TC involves structured and clear
communication with new residents to ensure they learn the policies and
procedures of the TC, programme philosophy and general stage plan;
establish some trusting relationships in the community; and become
oriented to the recovery process (De Leon, 2000).
Comprehensive assessment and treatment planning covers a range of
relevant social, cultural, substance use, treatment, medical, familial and
personal factors; is agreed in writing with the TC resident; identifies (and
tracks) goals, is reviewed periodically, and links residents to appropriate
aftercare and support (Ibid).
Daily structured routine is identified as an important feature of TCs
(Goethals et al, 2011). Structured activities of the community facilitate
learning self-structure for the individual, and in time management,
planning, setting and meeting goals, and in general accountability (De
Leon, 2000).
Evidence indicates that psychosocial approaches including cognitive
behaviour therapy (CBT), structured relapse prevention and contingency
Review of outcomes for clients of Higher Ground
52
management are among the most effective treatments for
methamphetamine abuse and dependence (BJA, n.d.; Lee et al, 2007;
Rawson et al, 2002) and for other addictions in TC contexts (Bahr et al,
2012; Friedman et al, 2006; McMurran, 2006).
Using a combination of interventions, such as motivational interviewing
techniques in conjunction with CBT interventions seems to be more
effective than interventions applied individually (Lee et al, 2007).
A meta-analysis of the effects of interventions for substance use disorders
found that “the average patient undergoing psychosocial interventions
achieves acute outcomes better than approximately 67% of the patients
in control conditions” (Dutra et al., 2008).
Similarly, treatments together with 12-step programmes (e.g., Alcoholics
Anonymous, Narcotics Anonymous) are found to have additive effects
(Fiorentine et al, 2000; McMurran, 2006). These programmes are based
on a set of guiding principles outlining a course of action for recovery
from addiction and other behavioural problems. Work with alcohol and
cocaine-dependent people indicated that involvement in 12-step self-help
groups, both attending meetings and engaging in 12-step activities, was
associated with reduced substance use and improved outcomes (Donovan
& Wells, 2007).
The Matrix Model, which incorporates cognitive behavioral therapy,
positive reinforcement, family involvement, 12-step programs,
motivational interviews, and urine testing, has been shown to decrease
MA and other drug use as well as improve psychosocial functioning and
mental health when compared to various, more traditional counselling
approaches (BJA, n.d.).
Effective exit from the TC is influenced by specific interventions before
and after the exit event itself. The re-entry stage of the TC includes
specific strategies to prepare residents for the transition. Following exit,
aftercare services are an essential component of the TC model (De Leon,
2000; Goethals et al, 2011).
TC duration
According to the TC literature, there is no single ideal duration of
treatment. Individual needs vary; not all residents need the same length
of time to achieve TC treatment goals. The optimal length of time for full
programme involvement must be consistent with TC goals of recovery and
its developmental view of the change process. How long the individual
must be involved in the programme depends on their phase of recovery,
although a minimum period of intensive involvement is required to assure
internalisation of the TC teachings (De Leon, 2000).

Review of outcomes for clients of Higher Ground
53
TC theory asserts that duration of treatment is critically correlated with
internalised learning. If individual changes are not internalised, recovery
is incomplete. Premature dropout from treatment and relapse are more
likely (De Leon, 2000).
Those who complete the planned duration of treatment reveal the best
outcomes (e.g., Anglin & Hser, 1990; De Leon, 1984; De Leon, Jainchil &
Wexler, 1982; Hubbard et al, 1997; Simpson, 1979; cited in De Leon,
2000).
Completion rates for TC programmes
Positive outcomes following treatment relate to successfully completing
the goals of all TC programme stages, not simply meeting the planned
duration of treatment (Coombs, 1981; Toumbourou, Hamilton & Fallon,
1998; cited in De Leon, 2000).
A review of international literature on TCs by Vanderplasschen et al
(2014) indicates that completion rates have varied between 9-75%, with
midpoint completion rates around 30% (Guydish et al, 1998; Nemes et al,
1999; Nuttbrock et al, 1998; McCusker et al, 1997; McCusker et al, 1996;
Coombs, 1981; Ravndal and Vaglum, 1998; Ogborne and Melotte, 1977).
These studies predominantly covered 12-month TC programmes but
included a few 3 and 6 month programmes as well as some that were
longer than 12 months. Completion rates were highest in the short-term
programmes. The two highest completion rates (56% and 75%) were for
3-month TCs (McCusker et al, 1996; Coombs, 1981).
Abstinence post-exit from TC programmes
A recent evaluation of the Salvation Army’s Bridge Programme by the
University of Otago (Patterson et al, 2015) notes that treatment outcomes
in AOD programmes are measured primarily in terms of changes in
substance use behaviour, including reduction or cessation of that
behaviour. Examples of outcome measures include days of use per
month, days abstinent, days of non-hazardous use, substance use
severity, and biological markers of substance use (Ibid).
TC literature reviewed by Vanderplasschen et al (2014) indicates
abstinence rates of between 16-85% at 3-6 months follow up, with
midpoint abstinence rates of around 70% (Nuttbrock et al, 1998; Martin
et al, 1999; Nielsen et al, 1996; Greenwood et al, 2001; McCusker et al,
1995; Hartmann et al, 1997).
Review of outcomes for clients of Higher Ground
54
At 12 months follow up, abstinence rates ranged from 25-73%, with
midpoint abstinence rates around 50% (Sullivan et al, 2007; Greenwood
et al, 2001; Bale et al, 1980; Coombs, 1981; McCusker et al, 1995).
In general, the longer individuals remain in treatment, the more likely
their recovery and rehabilitative goals are achieved (Bell et al, 1996; De
Leon, 2010; Inciardi et al, 2004; Welsh, 2007; Welsh & McGrain, 2008).
This implies that abstinence rates following completion of shorter
programme durations might be expected to lie at the lower end of the
range.
TC impacts on psychological symptoms
A number of studies have found that TCs are effective in reducing
psychological symptoms including depression, anxiety and stress, among
others (Prendergast et al, 2004; Guydish et al, 1999; French et al, 1999;
Nuttbrock et al, 1998; all cited in Vanderplasschen et al, 2014). However,
the range of assessment tools used in these studies did not offer directly
comparable or transferrable benchmarks for Higher Ground.
Studies of other interventions that included DASS scores generally
showed mean DASS scores in the normal to moderate range following
treatment, with midpoints in the high-normal to low-mild range (Blatch,
2013; Crawford and Henry, 2003; Lovibond and Lovibond, 1995; Nicholas
et al, 2008; all cited in Blatch et al, 2013).
A meta-analysis by Van Dam et al. (2012) looked at relative effectiveness
of treatments for PTSD. Many of the studies reviewed were not controlled
trials. Only a few RCTs were included and none of these used the PCL. No
rates for the relative success of treatments vs controls are reported,
though the overall finding was that treatment for PTSD is better than
‘treatment-as-usual’.
Other outcomes
Patterson et al (2015) note that a wide range of ‘consequential factors’
are commonly associated with substance use (e.g., physical and mental
health, criminality, employment status, social conflict, quality of life, and
morbidity), and effective substance use programmes should also address
these factors. However, there is no consensus on which outcomes should
be measured or how they should be measured. A wide range of
psychometric tools are in use for tracking many of these outcomes, and
this is a factor limiting comparability of results across studies.
Review of outcomes for clients of Higher Ground
55
Spontaneous remission
Problematic AOD use is a remitting-relapsing disorder. Therefore it is
important to measure outcomes at several points in time, including post-
treatment follow up (Patterson et al, 2015).
Even in the absence of treatment, some people may experience remission
from substance dependency. Understanding rates of spontaneous
remission helps to understand what changes might have occurred in the
TC population if they had not been involved in the TC.
A quantitative review of substance abuse literature estimated the general
prevalence of spontaneous remission from alcohol, tobacco and other
drugs at 26.2% in follow ups averaging five years, with a range of 4%-
56% depending on follow up period and the definition of spontaneous
remission employed (Walters, 2000).
Rates of spontaneous recovery from PTSD vary across studies and appear
to be affected by contextual factors such as the study population and the
nature and number of traumatic events experienced. A longitudinal,
observational study found 52% of those observed (aged 14-24)
experienced a natural recovery during 34-50 month follow up (Perkonigg
et al., 2005). Another found that prevalence of PTSD symptoms reduced
from 30% to 11% when measured 1 month and 20 months after an
earthquake in Turkey (Karamustafalioglu, 2006).
Rates of spontaneous recovery for depression are also context-dependent.
A meta analysis of spontaneous recovery from depression among control
groups (waitlist and observational cohort studies) across 19 studies
describing remission at up to 2 years follow up showed that 23% of cases
of untreated depression remitted within 3 months and 32% within 6
months. Overall, the review suggested that 53% of untreated major
depression would remit spontaneously in a given year (Whiteford et al.,
2013). Remission rates may depend upon severity, with lower rates of
spontaneous remission for more severe depression. None of the studies
reviewed used the DASS scale.
References cited in this report
Alkin, M.C. (2004). Evaluation Roots: Tracing Theorists’ Views and
Influences. Sage: Thousand Oaks.
Australian Centre for Post-Traumatic Mental Health (n.d.). Depression
Anxiety and Stress Scale. University of Melbourne.
Australiasian Therapeutic Communities Association (ATCA). (2002).
Towards Better Practice in Therapeutic Communities. Australasian
Therapeutic Communities Association: NSW. Retrieved 14 April 2014 from
Review of outcomes for clients of Higher Ground
56
http://www.atca.com.au/wp-content/uploads/2012/07/Towards-Better-
Practice-in-Therapeutic-Communities.pdf
Australiasian Therapeutic Communities Association (ATCA). (2012).
Therapeutic Community Model of Treatment.
http://www.atca.com.au/wp-content/uploads/2012/07/Therapeutic-
Community-Model-of-Treatment.pdf
Bahr, S., Masters, A., Taylor, B., (2012). What Works in Substance Abuse
Treatment Programs for Offenders? The Prison Journal. 92(2) 155-174.
Bale, R.N., VanStone, W.W., Kuldau, J.M., Engelsing, T.M., Elashoff, R.M.,
ZarconeV.P.(1980), ‘Therapeutic communities vs. methadone-
maintenance — prospective controlled study of narcotic addiction
treatment — design and one year follow-up’, Archives of General
Psychiatry 37, pp. 179–193.10
Bell, D.C., Richard, A.J., & Feltz, L.C. (1996). Mediators of Drug
Treatment Outcomes. Addictive Behaviors, 21, 597-613.
BERL Economics. 2009. Costs of Harmful Alcohol and Other Drug Use.
Report to the Ministry of Health and ACC.
Blatch, L.M., (2013). Intervention for Amphetamine-type Stimulant (ATS)
Use in the Therapeutic Community. PhD Thesis, University of New South
Wales.
Blatch, L.M., Copeland, J., Howard, J. (2013). Group Intervention for
Ampetamine-Type Stimulant (ATS) Use (GIATS). EFTC Conference,
Prague, September 2013.
Bureau of Justice Assistance. (n.d.). What have we learned from
evaluations of methamphetamine programs/strategies? Accessed online
at: https://www.bja.gov/evaluation/program-substance-
abuse/meth2.htm
Campbell, D., Stanley, J., (1963). Experimental and quasi-experimental
designs for research. Chicago: Rand-McNally
Cook, T.D., & Campbell, D.T., (1979). Quasi-experimentation: Design and
analysis issues for field settings. Boston: Houghton Mifflin.
Coombs, R. H. (1981), ‘Back on the streets: therapeutic communities’
impact upon drug users’, American Journal of Drug and Alcohol Abuse 8,
pp. 185–201.12
Crampton E, Burgess M. 2009. The Price of Everything, The Value of
Nothing: A (Truly) External Review of BERL’s Study of Harmful Alcohol
10 Works cited in Vanderplasschen et al (2014) included in this bibliography have not been sourced directly.
Review of outcomes for clients of Higher Ground
57
and Drug Use. Working Paper 10/2009. Department of Economics and
Finance, College of Business and Economics, University of Canterbury.
Crawford, J.R. & Henry, J.D. (2003). The Depression Anxiety Stress
Scales (DASS): Normative data and latent structure in a large non-clinical
sample. British Journal of Clinical Psychology, 42(2), 111-31.
Davidson, EJ. 2005. Evaluation Methodology Basics: The nuts and bolts of
sound evaluation. Thousand Oaks: Sage.
De Leon G (2000). The Therapeutic Community: Theory, Model, and
Method. New York: The Springer Publishing Company.
De Leon, G. (2010). Is the Therapeutic Community an Evidence-based
Treatment? What the Evidence Says. International Journal of Therapeutic
Communities, 31, 104-128.
Deering, D., Robinson, G., Wheeler, A., et al. (2009). Preliminary work
towards validating a draft outcome measure for use in the alcohol and
drug sector. Auckland: Te Pou.
Donovan, D.M., Wells, E.A., (2007). ‘Tweaking 12-step’: the potential role
of 12-step self-help group involvement in methamphetamine recovery.
Addiction, 102 (Suppl. 1).
Dutra, L., Stathopoulou, G., Basden, S.L., Leyro, T.M., Powers, M.B. &
Otto, M.W. (2008). A Meta-Analytic Review of Psychosocial Interventions
for Substance Use Disorders. Am J of Psychiatry, 165, 179-187.
Fiorentine, R., Hillhouse, M.P., (2000). Drug treatment and 12-step
program participation: The additive effects of integrated recovery
activities. Journal of Substance Abuse Treatment. 18(1).
French, M. T., Sacks, S., De Leon, G., Staines, G. and McKendrick, K.
(1999), ‘Modified therapeutic community for mentally ill chemical
abusers: outcomes and costs’, Evaluation and The Health Professions 22,
pp. 60–85.11
Greenwood, G.L.,Woods, W.J., Guydish, J.andBein, E. (2001), ‘Relapse
outcomes in a randomized trial of residential and day drug abuse
treatment’, Journal of Substance Abuse Treatment 20, pp. 15–23. 13
Guydish, J., Sorensen, J. L., Chan, M., Werdegar, D., Bostrom, A. and
Acampora, A. (1999), ‘A randomized trial comparing day and residential
drug abuse treatment: 18-month outcomes’, Journal of Consulting and
Clinical Psychology 67, pp. 428–434. 13
11 Works cited in Vanderplasschen et al (2014) included in this bibliography have not been sourced directly.
Review of outcomes for clients of Higher Ground
58
Guydish, J., Werdegar, D., Clark, W., Sorensen, J. L. and Acampora, A.
(1998), ‘Drug abuse day treatment: a randomised clinical trial comparing
day and residential treatment programs’, Journal of Consulting and
Clinical Psychology 66, pp. 280–289. 13
Hartmann, D. J., Wolk, J. L., Johnston, J. S. and Colyer, C. J. (1997),
‘Recidivism and substance abuse outcomes in a prison-based therapeutic
community’, Federal Probation 61, pp. 18–25. 12
Hubbard, A. (2012, December 1). Of a scientific persuasion. Dominion
Post. Retrieved from http://www.stuff.co.nz/dominion- post/capital-
life/8023559/Of-a-scientific- persuasion
Inciardi, J.A., Martin, S.S., Butzin, C.A. (2004). Five-Year Outcomes of
Therapeutic Community Treatment of Drug-Involved Offenders after
Release from Prison. Crime & Delinquency 50:88.
Johnson, John. A. (2014). Acquiescence and Social Desirability:
Psychometric Bogeymen. Psychology Today.
https://www.psychologytoday.com/blog/cui-bono/201404/acquiescence-
and-social-desirability-psychometric-bogeymen
Karamustafalioglu, O. K., Zohar, J., Guveli, M., Gal, G., Bakim, B.,
Fostick, L., Karamustafalioglu, N., & Sasson, Y. (2006). Natural course of
posttraumatic stress disorder: A 20-month prospective study of Turk- ish
earthquake survivors. Journal of Clinical Psychiatry, 67(6), 882– 889.
King, J., (2014). Review of Outcomes for Clients who use
Methamphetamine. Report prepared for Higher Ground Drug
Rehabilitation Trust. Auckland: Julian King & Associates Limited – a
member of the Kinnect Group.
King, J., (2015). Review of Outcome Monitoring at Higher Ground. Report
prepared for Higher Ground Drug Rehabilitation Trust. Auckland: Julian
King & Associates Limited – a member of the Kinnect Group.
Lee, N., Johns, L., Jenkinson, R., Johnston, J., Connolly, K., Hall, K. &
Cash, R. (2007). Clinical Treatment Guidelines for Alcohol and Drug
Clinicians. No 14: Methamphetamine dependence and treatment. Fitzroy,
Victoria: Turning Point Alcohol and Drug Centre Inc
Lovibond, S.H., & Lovibond, P.F. (1995). Manual for the Depression
Anxiety Stress Scales. (2nd Ed). Sydney: Psychology Foundation.
McCusker, J., Bigelow, C., Frost, R., et al. (1997a), ‘The effects of planned
duration of residential drug abuse treatment on recovery and HIV risk
behaviour’, American Journal of Public Health 87, pp. 1637–1644. 14
12 Works cited in Vanderplasschen et al (2014) included in this bibliography have not been sourced directly.
Review of outcomes for clients of Higher Ground
59
McCusker, J., Stoddard, A., Frost, R. and Zorn, M. (1996), ‘Planned
versus actual duration of drug abuse treatment. Reconciling observational
and experimental evidence’, Journal of Nervous and Mental Disease 184,
pp. 482–489. 14
McCusker, J., Vickers-Lahti, M., Stoddard, A., et al. (1995), ‘The
effectiveness of alternative planned durations of residential drug abuse
treatment’, American Journal of Public Health 85, pp. 1426–1429. 13
McKetin, R., Naiman, J., Baker, A.L., et al. (2012). Evaluating the impact
of community-based treatment options on methamphetamine use:
findings from the Methamphetamine Treatment Evaluation Study
(MATES). Addiction. 05/2012; 107(11).
McKetin, R., Ross, J., Naiman, J., et al. (2009). Treatment outcomes for
methamphetamine use: Finding from the methamphetamine treatment
study (MATES). Drug and Alcohol Review 10/2009; 28(S1);A76
McKetin, R., Sutherland, R., Ross, J., et al. (2010). Methamphetamine
treatment evaluation study (MATES): Three-year outcomes from the
Sydney site. Technical Report 312. NSW: National Alcohol and Drug
Research Centre.
National Centre for PTSD (2010). Using the PTSD Checklist (PCL). US
Department of Veterans Affairs. http://www.rogerpeele.com/PCL-
handout%20(1).pdf
Nemes, S., Wish, E. D. and Messina, N. (1999), ‘Comparing the impact of
standard and abbreviated treatment in a therapeutic community. Findings
from the district of Columbia treatment initiative experiment’, Journal of
Substance Abuse Treatment 17, pp. 339–347. 15
Nicholas, M., Asghari, A., Blyth, F. (2008). What do the numbers mean?
Normative data in chronic pain measures. Pain, 134(0), 158-73.
Nielsen, A. L., Scarpitti, F. R. and Inciardi, J. A. (1996), ‘Integrating the
therapeutic community and work release for drug-involved offenders: the
Crest program’, Journal of Substance Abuse Treatment 13, pp. 349–358.
15
Nuttbrock, L. A., Rahav, M., Rivera, J. J., Ng-Mak, D. S. and Link, B. G.
(1998), ‘Outcomes of homeless mentally ill chemical abusers in
community residences and a therapeutic community’, Psychiatric Services
49, pp. 68–76. 15
13 Works cited in Vanderplasschen et al (2014) included in this bibliography have not been sourced directly.
Review of outcomes for clients of Higher Ground
60
Ogborne, A. C. and Melotte, C. (1977), ‘An evaluation of a therapeutic
community for former drug users’, British Journal of Addiction 72, pp. 75–
82. 15
Patterson, T., Macleod, E., Egan, R., Cameron, C., Hobbs, L., Gross, J.
(2015). An evaluation of the effectiveness of the Salvation Army’s Bridge
Programme Model of Treatment. July 2015.
Perkonigg, A., Pfister, H., Stein, M.B. Hofler, M., Leib, R., Maercker, A. &
Wittchen, H-U. (2005). Longitudinal Course of Posttraumatic Stress
Disorder and Posttraumatic Stress Disorder symptoms in a Community
Sample of Adolescents and Young Adults. American Journal of Psychiatry,
162, 1320-1327.
Podsakoff, P.M., MacKenzie, S.B., Lee, J-Y. & Podsakoff, N.P. (2003).
Common Method Biases in Behavioral Research: A Critical Review of the
Literature and Recommended Remedies. Journal of Applied Psychology,
88(5), 879-903.
Prendergast, M. L., Hall, E. A., Wexler, H. K., Melnick, G. and Cao, Y.
(2004), ‘Amity prison-based therapeutic community: 5-year outcomes’,
Prison Journal 84, pp. 36–60. 14
Ravndal, E. and Vaglum, P. (1998), ‘Psychopathology, treatment
completion and 5 years outcome: a prospective study of drug abusers’,
Journal of Substance Abuse Treatment 15, pp. 135–142. 16
Rawlings, B. (1998). Research on Therapeutic Communities in Prisons: A
Review of the Literature. Produced for the Prison service,
http://www.dldocs.stir.ac.uk/documents/rawlings.pdf
Rawson, R.A., Gonzales, R., Brethen, P. (2002). Treatment of
methamphetamine use disorders: an update. Journal of Substance Abuse
Treatment. 23(2).
Rawson, R.A., Marinelli-Casey, P.M., Anglin, M.D., et al. (2004). A multi-
site comparison of psychosocial approaches for the treatment of
methamphetamine dependence. The Methamphetamine Treatment
Project. Addiction. 99(6).
Raymont, A. (2012). Higher Ground Evaluation: Section II – quantitative
data. Report for Higher Ground Drug Rehabilitation Trust. Auckland:
Awhina Research, Waitemata District Health Board.
Raymont, A. (2013). Higher Ground Evaluation 2013: Project I –
community member tests; quantitative findings. Report for Higher Ground
Drug Rehabilitation Trust. Auckland: Marinal Services Limited.
14 Works cited in Vanderplasschen et al (2014) included in this bibliography have not been sourced directly.
Review of outcomes for clients of Higher Ground
61
Raymont, A., Howard, F., Parsonage, P., Dow, J. (2013). Higher Ground
Evaluation: Summary of Findings. Report for Higher Ground Drug
Rehabilitation Trust. Auckland: Awhina Research, Waitemata District
Health Board.
Ruwward, J., Schrieken B, Schrijver, M, Broeksteeg, J., Dekker, J.,
Vermeulen, H. & Lange, A. (2009). Standardized Web-Based Cognitive
Behavioural Therapy of Mild to Moderate Depression: A Randomized
Controlled Trial with a Long-Term Follow-Up. Cognitive Behaviour
Therapy, 38(4), 206-221.
Scriven, M. (1995). The Logic of Evaluation and Evaluation Practice. New
Directions for Evaluation, 68, pp.49-70.
Smith, L.A., Gates, S., Foxcroft, D., (2006). Therapeutic communities for
substance related disorder (Review). Cochrane Database of Systematic
Reviews 2006, Issue 1.
Sullivan, C. J., McKendrick, K., Sacks, S. and Banks, S. (2007), ‘Modified
therapeutic community treatment for offenders with MICA disorders:
substance use outcomes’, American Journal of Drug and Alcohol Abuse
33, pp. 823–832. 15
Te Pou. (2009). Alcohol and Drug Outcome Measure (ADOM). 30 October
2009. Auckland: Te Pou.
Te Pou. (n.d). Summary: Alcohol and drug outcome measure (ADOM).
Auckland: Te Pou.
Van Dam, D., Vedel, E., Ehring, T., Emmelkamp, P.M.G. (2012).
Psychological treatments for concurrent posttraumatic stress disorder and
substance used disorder: A systematic review. Clinical Psychology Review,
32, 202-214.
Vanderplasschen, W., Colpaert, K., Autrique, M., Rapp, R.C., Pearce, S.,
Brekaert, E., & Vandevelde, S. (2013). Therapeutic Communities for
Addictions: A Review of their Effectiveness from a Recovery-Oriented
Perspective. The Scientific World Journal, 2013, 22 pages. doi:
10.1155/2013/427817
Vanderplasschen, W., Vandevelde, S., and Broekart, E., (2014).
Therapeutic communities for treating addictions in Europe – evidence,
current practices and future challenges. European Monitoring Centre for
Drugs and Drug Addiction.
15 Works cited in Vanderplasschen et al (2014) included in this bibliography have not been sourced directly.
Review of outcomes for clients of Higher Ground
62
Waight, S. (2012). Higher Ground Evaluation – Section IV: Report on the
Māori Programme. Report for Higher Ground Drug Rehabilitation Trust.
Auckland: Awhina Research, Waitemata District Health Board.
Walters, G.D. (2000). Spontaneous Remission form Alcohol, Tobacco, and
Other Drug Abuse: Seeking Quantitative Answers to Qualitative
Questions. The American Journal of Drug and Alcohol Abuse, 26, 443-460.
Weathers, F.W., Litz, B.T., Keane, T.M., (n.d.). PTSD Checklist for DSM-5
(PCL-5). National Center for PTSD. Accessed online at:
http://www.ptsd.va.gov/professional/assessment/adult-sr/ptsd-
checklist.asp
Welsh, W., Zajac, G. (2004). A Census of Prison-Based Drug Treatment
Programs: Implications for Programming, Policy, and Evaluation. Crime &
Delinquency. Vol 50, 108-133.
Welsh, W.N. (2007). A Multisite Evaluation of Prison-Based Therapeutic
Community Drug Treatment. Criminal Justice and Behavior, 34, 1481-
1498.
Welsh, W.N., & McGrain, P.N. (2008). Predictors of therapeutic
engagement in prison-based drug treatment. Drug and Alcohol
Dependence, 96, 271-280.
Whiteford, H.A., Harris, M.G., McKeon, G., Baxter, A., Pennell, C.,
Barendregt, J.J. & Wang, J. (2013). Estimating remission from untreated
major depression: a systematic review and meta-analysis. Psychological
Medicine, 43(8). 1569-1585.
Yates, R. (2010). Recovery We Can Afford: An analysis of a sample of
comparative, cost-based studies. International Journal of Therapeutic
Communities, 31, 2, Summer 2010.
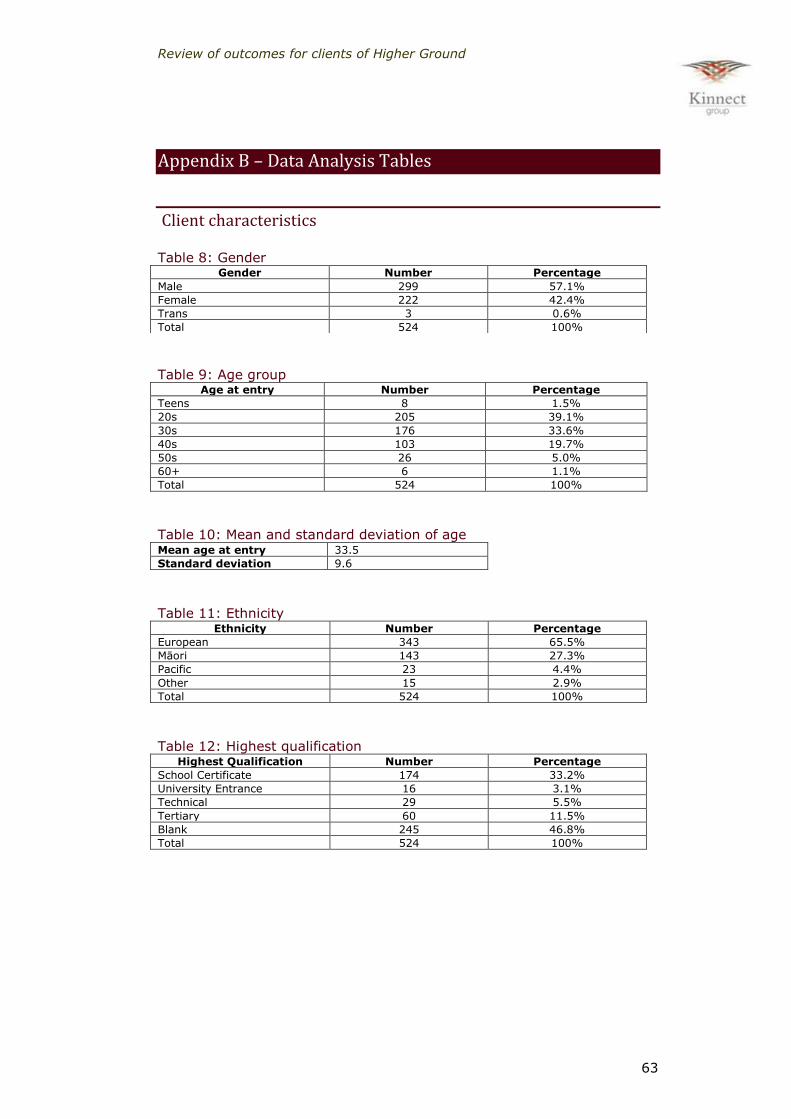
Review of outcomes for clients of Higher Ground
63
Appendix B – Data Analysis Tables
Client characteristics
Table 8: Gender
Table 9: Age group Age at entry Number Percentage
Teens 8 1.5%
20s 205 39.1%
30s 176 33.6%
40s 103 19.7%
50s 26 5.0%
60+ 6 1.1%
Total 524 100%
Table 10: Mean and standard deviation of age Mean age at entry 33.5
Standard deviation 9.6
Table 11: Ethnicity Ethnicity Number Percentage
European 343 65.5%
Māori 143 27.3%
Pacific 23 4.4%
Other 15 2.9%
Total 524 100%
Table 12: Highest qualification Highest Qualification Number Percentage
School Certificate 174 33.2%
University Entrance 16 3.1%
Technical 29 5.5%
Tertiary 60 11.5%
Blank 245 46.8%
Total 524 100%
Gender Number Percentage
Male 299 57.1%
Female 222 42.4%
Trans 3 0.6%
Total 524 100%

Review of outcomes for clients of Higher Ground
64
Table 13: Justice-referred and AOD Treatment Court clients Group Justice client AOD Treatment Court
client
All 240 48
Male 166 40
Female 72 7
Māori 73 23
Pacific 17 5
European 142 17
Other 8 3
Teens 6 0
20s 115 28
30s 73 15
40s 36 5
50s 9 0
60+ 1 0
Table 14: Drug of Choice Group Meth Can Alc Opi Benz Other Blank
All 252 56 190 17 0 8 1
Male 144 35 105 9 5 1
Female 105 21 85 8 3
Māori 67 16 52 5 2 1
Pacific 14 4 5
European 165 32 129 11 6
Other 6 4 4 1
Teens 4 6 2 1 0
20s 126 30 48 4 3
30s 85 15 62 7 2
40s 35 5 51 3 3 1
50s 2 0 22 1 0
60+ 0 0 5 1 0
Table 15: Counts by discharge type Group WSA ASA ASR T
All 202 138 130 17
Male 106 79 89 8
Female 94 59 41 9
Māori 54 36 41 3
Pacific 4 5 10 2
European 140 93 75 11
Other 4 4 4 1
Teens 3 3 4 3
20s 72 54 64 5
30s 70 38 44 3
40s 42 34 18 2
50s 12 6 0 4
60+ 3 3 0 0
Justice client 83 52 81 6
AODTC client 15 7 21 1
Non-Justice client 119 86 49 11
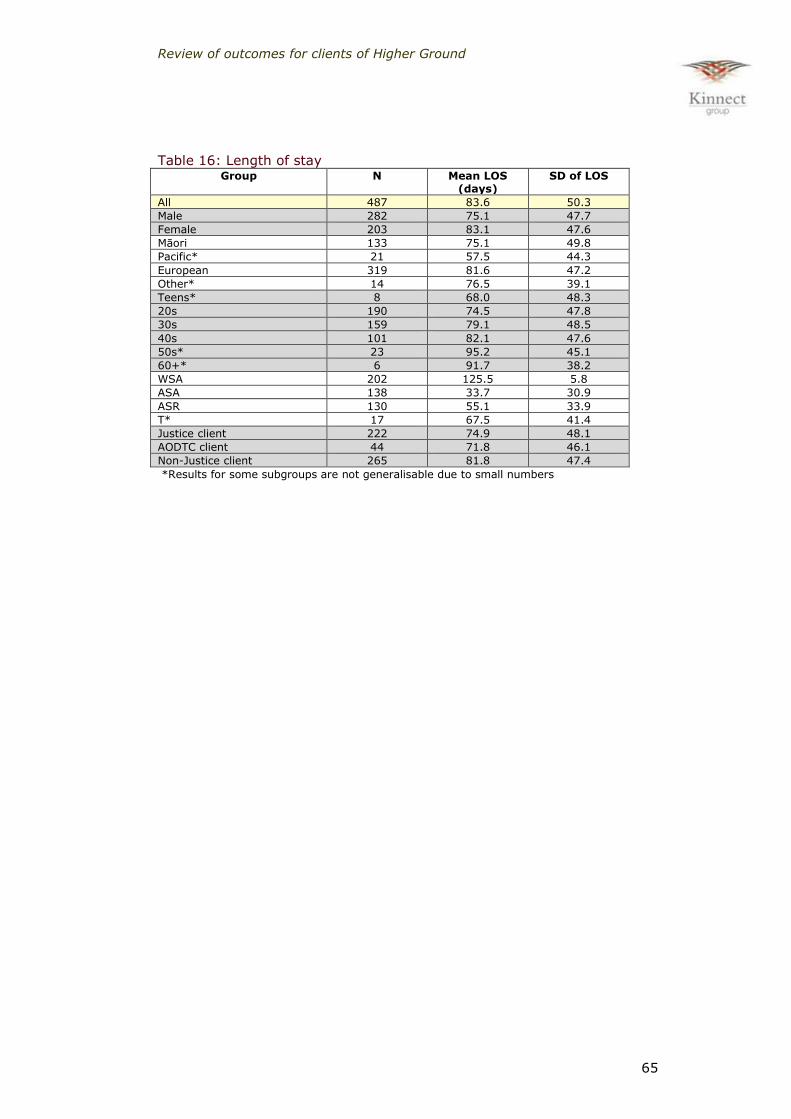
Review of outcomes for clients of Higher Ground
65
Table 16: Length of stay Group N Mean LOS
(days) SD of LOS
All 487 83.6 50.3
Male 282 75.1 47.7
Female 203 83.1 47.6
Māori 133 75.1 49.8
Pacific* 21 57.5 44.3
European 319 81.6 47.2
Other* 14 76.5 39.1
Teens* 8 68.0 48.3
20s 190 74.5 47.8
30s 159 79.1 48.5
40s 101 82.1 47.6
50s* 23 95.2 45.1
60+* 6 91.7 38.2
WSA 202 125.5 5.8
ASA 138 33.7 30.9
ASR 130 55.1 33.9
T* 17 67.5 41.4
Justice client 222 74.9 48.1
AODTC client 44 71.8 46.1
Non-Justice client 265 81.8 47.4
*Results for some subgroups are not generalisable due to small numbers
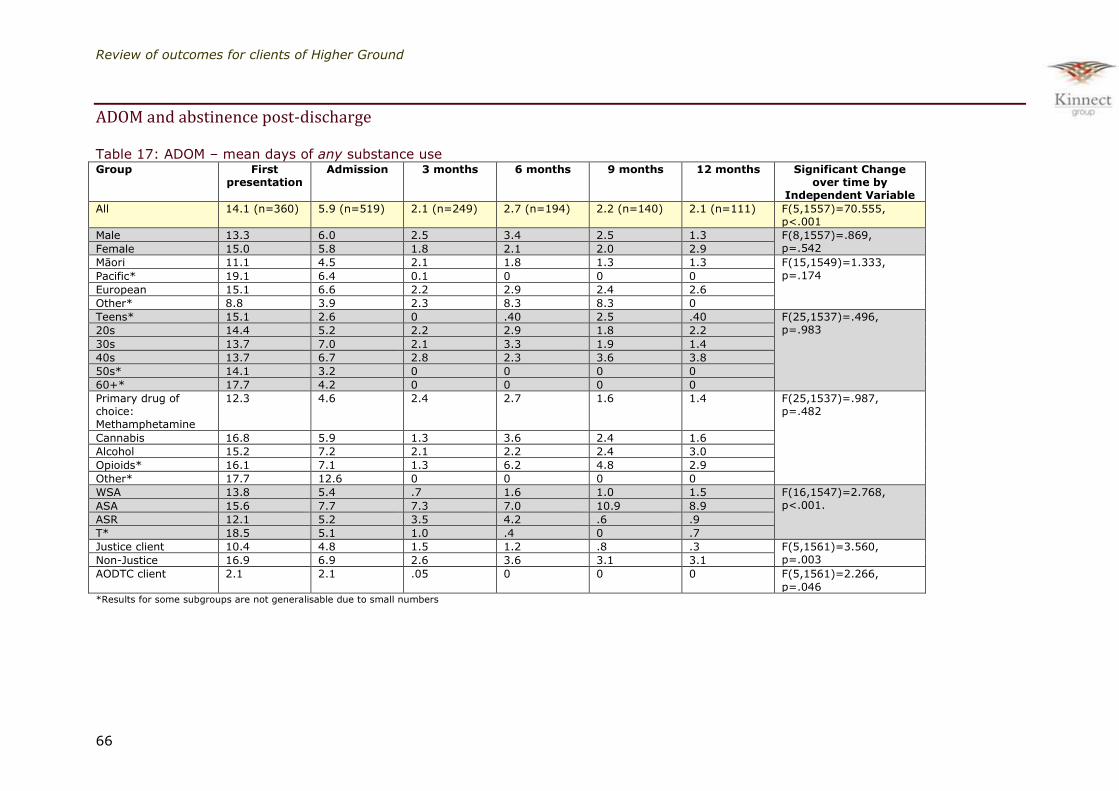
Review of outcomes for clients of Higher Ground
66
ADOM and abstinence post-discharge
Table 17: ADOM – mean days of any substance use Group First
presentation
Admission
3 months
6 months
9 months
12 months
Significant Change over time by
Independent Variable
All 14.1 (n=360) 5.9 (n=519) 2.1 (n=249) 2.7 (n=194) 2.2 (n=140) 2.1 (n=111) F(5,1557)=70.555, p<.001
Male 13.3 6.0 2.5 3.4 2.5 1.3 F(8,1557)=.869, p=.542 Female 15.0 5.8 1.8 2.1 2.0 2.9
Māori 11.1 4.5 2.1 1.8 1.3 1.3 F(15,1549)=1.333,
p=.174 Pacific* 19.1 6.4 0.1 0 0 0
European 15.1 6.6 2.2 2.9 2.4 2.6
Other* 8.8 3.9 2.3 8.3 8.3 0
Teens* 15.1 2.6 0 .40 2.5 .40 F(25,1537)=.496, p=.983 20s 14.4 5.2 2.2 2.9 1.8 2.2
30s 13.7 7.0 2.1 3.3 1.9 1.4
40s 13.7 6.7 2.8 2.3 3.6 3.8
50s* 14.1 3.2 0 0 0 0
60+* 17.7 4.2 0 0 0 0
Primary drug of choice: Methamphetamine
12.3 4.6 2.4 2.7 1.6 1.4 F(25,1537)=.987, p=.482
Cannabis 16.8 5.9 1.3 3.6 2.4 1.6
Alcohol 15.2 7.2 2.1 2.2 2.4 3.0
Opioids* 16.1 7.1 1.3 6.2 4.8 2.9
Other* 17.7 12.6 0 0 0 0
WSA 13.8 5.4 .7 1.6 1.0 1.5 F(16,1547)=2.768, p<.001. ASA 15.6 7.7 7.3 7.0 10.9 8.9
ASR 12.1 5.2 3.5 4.2 .6 .9
T* 18.5 5.1 1.0 .4 0 .7
Justice client 10.4 4.8 1.5 1.2 .8 .3 F(5,1561)=3.560, p=.003 Non-Justice 16.9 6.9 2.6 3.6 3.1 3.1
AODTC client 2.1 2.1 .05 0 0 0 F(5,1561)=2.266,
p=.046 *Results for some subgroups are not generalisable due to small numbers
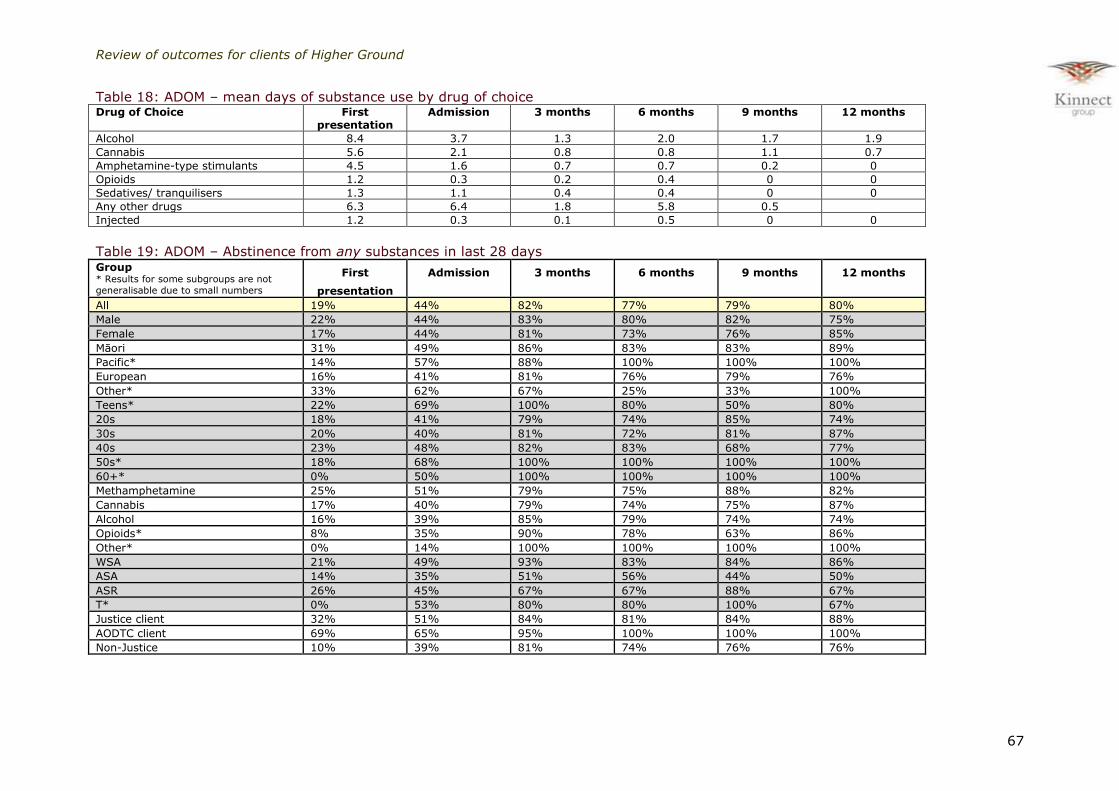
Review of outcomes for clients of Higher Ground
67
Table 18: ADOM – mean days of substance use by drug of choice Drug of Choice First
presentation Admission 3 months 6 months 9 months 12 months
Alcohol 8.4 3.7 1.3 2.0 1.7 1.9
Cannabis 5.6 2.1 0.8 0.8 1.1 0.7
Amphetamine-type stimulants 4.5 1.6 0.7 0.7 0.2 0
Opioids 1.2 0.3 0.2 0.4 0 0
Sedatives/ tranquilisers 1.3 1.1 0.4 0.4 0 0
Any other drugs 6.3 6.4 1.8 5.8 0.5
Injected 1.2 0.3 0.1 0.5 0 0
Table 19: ADOM – Abstinence from any substances in last 28 days Group * Results for some subgroups are not
generalisable due to small numbers
First
presentation
Admission 3 months 6 months 9 months 12 months
All 19% 44% 82% 77% 79% 80%
Male 22% 44% 83% 80% 82% 75%
Female 17% 44% 81% 73% 76% 85%
Māori 31% 49% 86% 83% 83% 89%
Pacific* 14% 57% 88% 100% 100% 100%
European 16% 41% 81% 76% 79% 76%
Other* 33% 62% 67% 25% 33% 100%
Teens* 22% 69% 100% 80% 50% 80%
20s 18% 41% 79% 74% 85% 74%
30s 20% 40% 81% 72% 81% 87%
40s 23% 48% 82% 83% 68% 77%
50s* 18% 68% 100% 100% 100% 100%
60+* 0% 50% 100% 100% 100% 100%
Methamphetamine 25% 51% 79% 75% 88% 82%
Cannabis 17% 40% 79% 74% 75% 87%
Alcohol 16% 39% 85% 79% 74% 74%
Opioids* 8% 35% 90% 78% 63% 86%
Other* 0% 14% 100% 100% 100% 100%
WSA 21% 49% 93% 83% 84% 86%
ASA 14% 35% 51% 56% 44% 50%
ASR 26% 45% 67% 67% 88% 67%
T* 0% 53% 80% 80% 100% 67%
Justice client 32% 51% 84% 81% 84% 88%
AODTC client 69% 65% 95% 100% 100% 100%
Non-Justice 10% 39% 81% 74% 76% 76%

Review of outcomes for clients of Higher Ground
68
Table 20: ADOM Q12 – Physical health – mean score Group *Results for some
subgroups are not generalisable
due to small numbers
First presentation
Admission 3 months 6 months 9 months 12 months
All 1.8 1.2 .7 .7 .6 .7
Male 1.6 1.1 .6 .6 .6 .8
Female 2.1 1.3 .9 .8 .6 .6
Māori 1.7 1.0 .7 .7 .4 .9
Pacific* 2.1 .9 .6 .5 .5 .5
European 1.9 1.3 .7 .7 .6 .7
Other* 2.0 .5 1.0 1.8 2.0 1.0
Teens* 1.9 1.0 .6 .6 .8 .6
20s 1.9 1.1 .6 .7 .6 .5
30s 1.7 1.3 .7 .6 .4 .6
40s 1.9 1.3 .9 1.0 1.0 1.2
50s* 1.8 1.0 1.1 .3 .3 2.5
60+* 2.5 1.0 .3 .5 .0 .0
Methamphetamine 1.8 1.1 .7 .7 .6 .4
Cannabis 1.3 .9 .7 .6 .7 .9
Alcohol 2.1 1.4 .7 .8 .6 1.0
Opiates* 1.7 2.3 1.1 .7 .8 .7
Other* 2.6 2.3 1.0 1.3 .0 .0
WSA 1.7 1.2 .6 .7 .6 .8
ASA 2.0 1.3 1.3 1.1 .7 .6
ASR 1.8 1.1 .8 .7 .7 .3
T* 2.5 1.1 .3 .4 .3 .0
Justice client 1.5 .9 .6 .4 .6 .5
AODTC client .4 .3 .4 .3 .4 .7
Non-Justice 2.1 1.4 .8 .9 .6 .9
Table 21: ADOM Q12 – Physical health – distribution of scores Frequency of occurrence First
presentation Admission 3 months 6 months 9 months 12 months
N 353 519 248 194 140 111
Never (0) 26.6% 44.1% 61.3% 62.4% 62.9% 55.9%
Less than weekly (1) 16.7% 21.0% 20.2% 19.1% 22.1% 29.7%
Once or twice a week (2) 20.1% 15.6% 9.7% 8.8% 9.3% 8.1%
3-4 times a week (3) 19.0% 8.9% 2.8% 3.6% 2.1% 0.0%
Daily or almost daily (4) 17.6% 10.4% 6.0% 6.2% 3.6% 6.3%
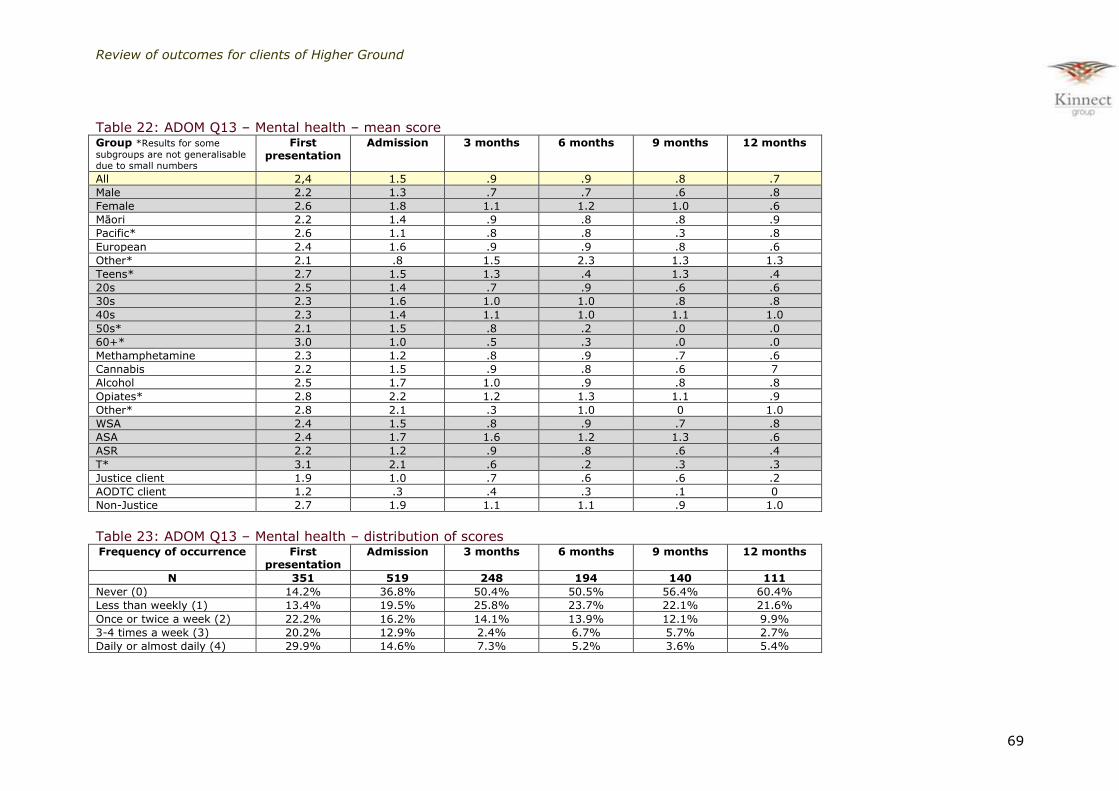
Review of outcomes for clients of Higher Ground
69
Table 22: ADOM Q13 – Mental health – mean score Group *Results for some
subgroups are not generalisable due to small numbers
First presentation
Admission 3 months 6 months 9 months 12 months
All 2,4 1.5 .9 .9 .8 .7
Male 2.2 1.3 .7 .7 .6 .8
Female 2.6 1.8 1.1 1.2 1.0 .6
Māori 2.2 1.4 .9 .8 .8 .9
Pacific* 2.6 1.1 .8 .8 .3 .8
European 2.4 1.6 .9 .9 .8 .6
Other* 2.1 .8 1.5 2.3 1.3 1.3
Teens* 2.7 1.5 1.3 .4 1.3 .4
20s 2.5 1.4 .7 .9 .6 .6
30s 2.3 1.6 1.0 1.0 .8 .8
40s 2.3 1.4 1.1 1.0 1.1 1.0
50s* 2.1 1.5 .8 .2 .0 .0
60+* 3.0 1.0 .5 .3 .0 .0
Methamphetamine 2.3 1.2 .8 .9 .7 .6
Cannabis 2.2 1.5 .9 .8 .6 7
Alcohol 2.5 1.7 1.0 .9 .8 .8
Opiates* 2.8 2.2 1.2 1.3 1.1 .9
Other* 2.8 2.1 .3 1.0 0 1.0
WSA 2.4 1.5 .8 .9 .7 .8
ASA 2.4 1.7 1.6 1.2 1.3 .6
ASR 2.2 1.2 .9 .8 .6 .4
T* 3.1 2.1 .6 .2 .3 .3
Justice client 1.9 1.0 .7 .6 .6 .2
AODTC client 1.2 .3 .4 .3 .1 0
Non-Justice 2.7 1.9 1.1 1.1 .9 1.0
Table 23: ADOM Q13 – Mental health – distribution of scores Frequency of occurrence First
presentation Admission 3 months 6 months 9 months 12 months
N 351 519 248 194 140 111
Never (0) 14.2% 36.8% 50.4% 50.5% 56.4% 60.4%
Less than weekly (1) 13.4% 19.5% 25.8% 23.7% 22.1% 21.6%
Once or twice a week (2) 22.2% 16.2% 14.1% 13.9% 12.1% 9.9%
3-4 times a week (3) 20.2% 12.9% 2.4% 6.7% 5.7% 2.7%
Daily or almost daily (4) 29.9% 14.6% 7.3% 5.2% 3.6% 5.4%
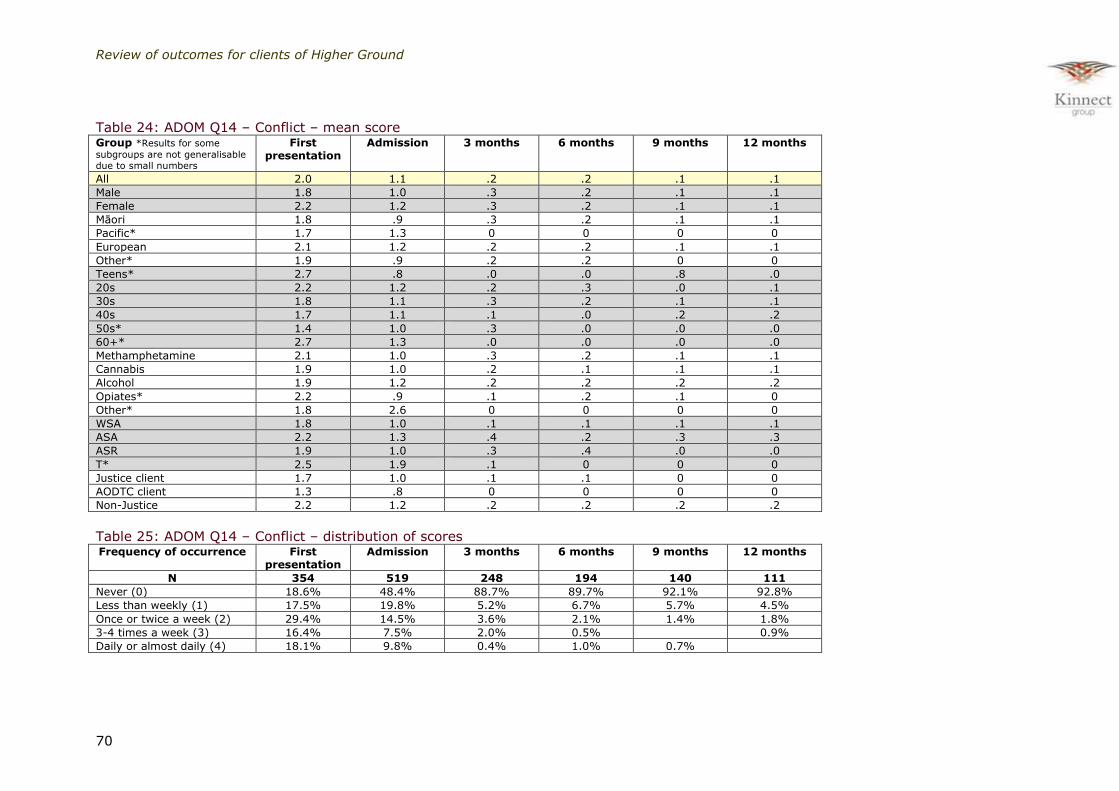
Review of outcomes for clients of Higher Ground
70
Table 24: ADOM Q14 – Conflict – mean score Group *Results for some
subgroups are not generalisable due to small numbers
First presentation
Admission 3 months 6 months 9 months 12 months
All 2.0 1.1 .2 .2 .1 .1
Male 1.8 1.0 .3 .2 .1 .1
Female 2.2 1.2 .3 .2 .1 .1
Māori 1.8 .9 .3 .2 .1 .1
Pacific* 1.7 1.3 0 0 0 0
European 2.1 1.2 .2 .2 .1 .1
Other* 1.9 .9 .2 .2 0 0
Teens* 2.7 .8 .0 .0 .8 .0
20s 2.2 1.2 .2 .3 .0 .1
30s 1.8 1.1 .3 .2 .1 .1
40s 1.7 1.1 .1 .0 .2 .2
50s* 1.4 1.0 .3 .0 .0 .0
60+* 2.7 1.3 .0 .0 .0 .0
Methamphetamine 2.1 1.0 .3 .2 .1 .1
Cannabis 1.9 1.0 .2 .1 .1 .1
Alcohol 1.9 1.2 .2 .2 .2 .2
Opiates* 2.2 .9 .1 .2 .1 0
Other* 1.8 2.6 0 0 0 0
WSA 1.8 1.0 .1 .1 .1 .1
ASA 2.2 1.3 .4 .2 .3 .3
ASR 1.9 1.0 .3 .4 .0 .0
T* 2.5 1.9 .1 0 0 0
Justice client 1.7 1.0 .1 .1 0 0
AODTC client 1.3 .8 0 0 0 0
Non-Justice 2.2 1.2 .2 .2 .2 .2
Table 25: ADOM Q14 – Conflict – distribution of scores Frequency of occurrence First
presentation Admission 3 months 6 months 9 months 12 months
N 354 519 248 194 140 111
Never (0) 18.6% 48.4% 88.7% 89.7% 92.1% 92.8%
Less than weekly (1) 17.5% 19.8% 5.2% 6.7% 5.7% 4.5%
Once or twice a week (2) 29.4% 14.5% 3.6% 2.1% 1.4% 1.8%
3-4 times a week (3) 16.4% 7.5% 2.0% 0.5% 0.9%
Daily or almost daily (4) 18.1% 9.8% 0.4% 1.0% 0.7%

Review of outcomes for clients of Higher Ground
71
Table 26: ADOM Q15 – Interfered – mean score Group *Results for some
subgroups are not generalisable due to small numbers
First presentation
Admission 3 months 6 months 9 months 12 months
All 2.3 1.2 .2 .3 .2 .2
Male 2.1 1.2 .2 .2 .2 .3
Female 2.5 1.2 .3 .3 .2 .1
Māori 2.1 1.0 .3 .2 .1 .3
Pacific* 1.6 1.5 0 0 0 0
European 2.4 1.3 .2 .2 .2 .2
Other* 2.2 1.0 .7 1.8 1.7 0
Teens* 2.1 .3 0 0 .3 0
20s 2.4 1.3 .2 .2 .1 .2
30s 2.1 1.2 .3 .4 .2 .1
40s 2.3 1.3 .2 .2 .3 .5
50s* 2.3 1.0 .3 0 0 0
60+* 2.8 1.7 0 0 0 0
Methamphetamine 2.2 1.1 .3 .3 .1 .1
Cannabis 2.1 1.0 0 .1 .2 .1
Alcohol 2.4 1.4 .2 .2 .2 .4
Opiates* 4.0 1.8 .4 .9 .8 .1
Other* 2.3 2.3 0 0 0 0
WSA 2.3 1.1 .1 .2 .1 .2
ASA 2.3 1.4 .8 .6 .5 .6
ASR 2.1 1.2 .2 .2 0 0
T* 2.8 1.4 0 0 0 0
Justice client 1.9 1.1 .1 .1 .1 0
AODTC client 2.3 1.3 .2 .3 .2 .2
Non-Justice 2.5 1.1 .3 .4 .2 .3
Table 27: ADOM Q15 – Interfered – distribution of scores Frequency of occurrence First
presentation Admission 3 months 6 months 9 months 12 months
N 353 519 248 194 140 111
Never (0) 20.1% 51.6% 90.7% 88.7% 90.7% 91.9%
Less than weekly (1) 13.0% 13.7% 2.0% 3.6% 5.7% 3.6%
Once or twice a week (2) 17.8% 10.6% 4.0% 3.1% 0.7% 0.0%
3-4 times a week (3) 17.6% 7.7% 0.8% 2.1% 1.4% 0.9%
Daily or almost daily (4) 31.4% 16.4% 2.4% 2.6% 1.4% 3.6%
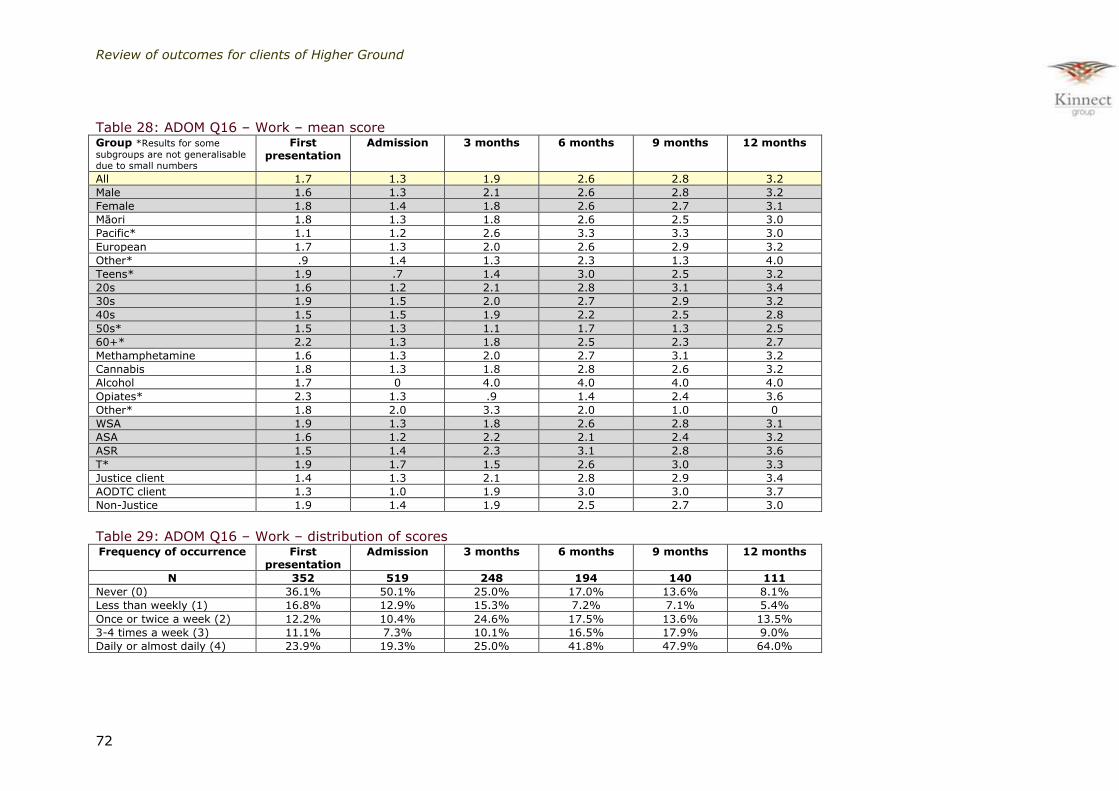
Review of outcomes for clients of Higher Ground
72
Table 28: ADOM Q16 – Work – mean score Group *Results for some
subgroups are not generalisable due to small numbers
First presentation
Admission 3 months 6 months 9 months 12 months
All 1.7 1.3 1.9 2.6 2.8 3.2
Male 1.6 1.3 2.1 2.6 2.8 3.2
Female 1.8 1.4 1.8 2.6 2.7 3.1
Māori 1.8 1.3 1.8 2.6 2.5 3.0
Pacific* 1.1 1.2 2.6 3.3 3.3 3.0
European 1.7 1.3 2.0 2.6 2.9 3.2
Other* .9 1.4 1.3 2.3 1.3 4.0
Teens* 1.9 .7 1.4 3.0 2.5 3.2
20s 1.6 1.2 2.1 2.8 3.1 3.4
30s 1.9 1.5 2.0 2.7 2.9 3.2
40s 1.5 1.5 1.9 2.2 2.5 2.8
50s* 1.5 1.3 1.1 1.7 1.3 2.5
60+* 2.2 1.3 1.8 2.5 2.3 2.7
Methamphetamine 1.6 1.3 2.0 2.7 3.1 3.2
Cannabis 1.8 1.3 1.8 2.8 2.6 3.2
Alcohol 1.7 0 4.0 4.0 4.0 4.0
Opiates* 2.3 1.3 .9 1.4 2.4 3.6
Other* 1.8 2.0 3.3 2.0 1.0 0
WSA 1.9 1.3 1.8 2.6 2.8 3.1
ASA 1.6 1.2 2.2 2.1 2.4 3.2
ASR 1.5 1.4 2.3 3.1 2.8 3.6
T* 1.9 1.7 1.5 2.6 3.0 3.3
Justice client 1.4 1.3 2.1 2.8 2.9 3.4
AODTC client 1.3 1.0 1.9 3.0 3.0 3.7
Non-Justice 1.9 1.4 1.9 2.5 2.7 3.0
Table 29: ADOM Q16 – Work – distribution of scores Frequency of occurrence First
presentation Admission 3 months 6 months 9 months 12 months
N 352 519 248 194 140 111
Never (0) 36.1% 50.1% 25.0% 17.0% 13.6% 8.1%
Less than weekly (1) 16.8% 12.9% 15.3% 7.2% 7.1% 5.4%
Once or twice a week (2) 12.2% 10.4% 24.6% 17.5% 13.6% 13.5%
3-4 times a week (3) 11.1% 7.3% 10.1% 16.5% 17.9% 9.0%
Daily or almost daily (4) 23.9% 19.3% 25.0% 41.8% 47.9% 64.0%
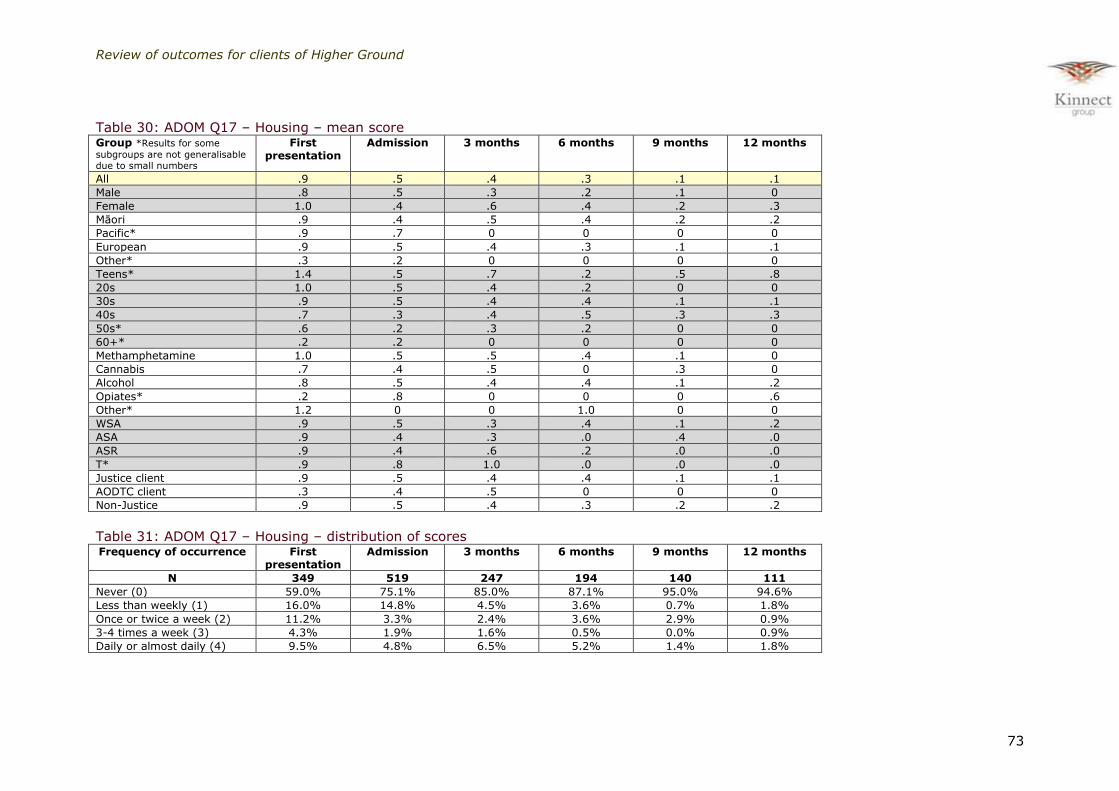
Review of outcomes for clients of Higher Ground
73
Table 30: ADOM Q17 – Housing – mean score Group *Results for some
subgroups are not generalisable due to small numbers
First presentation
Admission 3 months 6 months 9 months 12 months
All .9 .5 .4 .3 .1 .1
Male .8 .5 .3 .2 .1 0
Female 1.0 .4 .6 .4 .2 .3
Māori .9 .4 .5 .4 .2 .2
Pacific* .9 .7 0 0 0 0
European .9 .5 .4 .3 .1 .1
Other* .3 .2 0 0 0 0
Teens* 1.4 .5 .7 .2 .5 .8
20s 1.0 .5 .4 .2 0 0
30s .9 .5 .4 .4 .1 .1
40s .7 .3 .4 .5 .3 .3
50s* .6 .2 .3 .2 0 0
60+* .2 .2 0 0 0 0
Methamphetamine 1.0 .5 .5 .4 .1 0
Cannabis .7 .4 .5 0 .3 0
Alcohol .8 .5 .4 .4 .1 .2
Opiates* .2 .8 0 0 0 .6
Other* 1.2 0 0 1.0 0 0
WSA .9 .5 .3 .4 .1 .2
ASA .9 .4 .3 .0 .4 .0
ASR .9 .4 .6 .2 .0 .0
T* .9 .8 1.0 .0 .0 .0
Justice client .9 .5 .4 .4 .1 .1
AODTC client .3 .4 .5 0 0 0
Non-Justice .9 .5 .4 .3 .2 .2
Table 31: ADOM Q17 – Housing – distribution of scores Frequency of occurrence First
presentation Admission 3 months 6 months 9 months 12 months
N 349 519 247 194 140 111
Never (0) 59.0% 75.1% 85.0% 87.1% 95.0% 94.6%
Less than weekly (1) 16.0% 14.8% 4.5% 3.6% 0.7% 1.8%
Once or twice a week (2) 11.2% 3.3% 2.4% 3.6% 2.9% 0.9%
3-4 times a week (3) 4.3% 1.9% 1.6% 0.5% 0.0% 0.9%
Daily or almost daily (4) 9.5% 4.8% 6.5% 5.2% 1.4% 1.8%

Review of outcomes for clients of Higher Ground
74
Table 32: ADOM Q18 – Crime – mean score Group *Results for some
subgroups are not generalisable due to small numbers
First presentation
Admission 3 months 6 months 9 months 12 months
All 1.1 .7 .1 .1 .1 .1
Male 1.1 .8 .1 .1 0 .1
Female 1.1 .6 .1 .1 .1 .1
Māori 1.0 .6 .1 .1 .1 0
Pacific* .7 .8 .1 0 0 0
European 1.2 .8 0 .1 .1 .1
Other* .4 .5 .1 0 0 0
Teens* 1.2 .1 .0 .0 .0 .0
20s 1.4 .9 .1 .1 .1 .1
30s .9 .7 .0 .1 .0 .0
40s 1.0 .6 .0 .0 .0 .1
50s* .8 .5 .2 .0 .0 .0
60+* .5 .5 .0 .0 .0 .0
Methamphetamine 1.5 .8 .1 .1 .1 .1
Cannabis .8 .8 0 0 0 0
Alcohol .7 .6 0 .1 0 0
Opiates* .6 .8 0 .4 .1 0
Other* 1.8 1.6 0 0 0 0
WSA 1.0 .6 0 .1 0 0
ASA 1.2 .9 .2 .2 .4 .5
ASR 1.3 .8 0 .1 0 0
T* .9 .6 0 0 0 0
Justice client 1.2 .8 .1 0 0 0
AODTC client .7 .8 .1 0 0 0
Non-Justice 1.0 .7 .1 .1 .1 .1
Table 33: ADOM Q18 – Crime – distribution of scores Frequency of occurrence First
presentation Admission 3 months 6 months 9 months 12 months
N 352 519 248 193 140 111
Never (0) 47.4% 67.6% 96.4% 95.3% 97.1% 97.3%
Less than weekly (1) 24.4% 12.7% 2.4% 3.1% 1.4% 0.9%
Once or twice a week (2) 9.9% 6.4% 0.4% 0.5% 0.7% 0.9%
3-4 times a week (3) 6.0% 4.8% 0.4% 0.0% 0.0% 0.0%
Daily or almost daily (4) 12.2% 8.5% 0.4% 1.0% 0.7% 0.9%

Review of outcomes for clients of Higher Ground
75
PTSD scores
Table 34: PTSD scores at admission and discharge PTSD score Admission Discharge
N 521 354
Mean 42.82 31.87
SD 15.34 13.33
Median 42 28
Mean Difference=10.94(SD=15.18), t=13.565, p<.001
Table 35: Clients with PTSD score of 44 or higher Group Admission Discharge Within-subject
change1 by Independent
Variable
All 240 (46%) 64 (18%)
Male+ 129 (50%) 36 (18%) F(2,351)=3.766, p=.024. Males had significantly greater drop.
Female+ 111 (44%) 28 (18%)
Māori 62 (43%) 13 (14%)
F(3,350)=.179, p=.911
Pacific* 9 (39%) 4 (40%)
European 164 (48%) 46 (19%)
Other* 5 (39%) 1 (13%)
Teens* 10 (77%) 6 (55%)
F(5,348)=.784, p=.562
20s 97 (46%) 28 (20%)
30s 78 (46%) 16 (15%)
40s 42 (43%) 12 (16%)
50s* 11 (44%) 2 (11%)
60 and over* 2 (33%) 0
Methamphetamine 102 (41%) 19 (12%)
F(5,348)=3.320, p=.200
Cannabis 30 (54%) 16 (37%)
Alcohol 94 (50%) 28 (20%)
Opioids* 9 (53%) 1 (7%)
Other* 5 (63%) 0
WSA+ 93 (46%) 13 (7%) F(4,349)=7.965, p<.001. Scheffe Post-hoc test showed WSA decreased significantly more than ASA (p<.001). No other groups were significantly different.
ASA+ 70 (51%) 25 (35%)
ASR 56 (43%) 22 (30%)
T* 10 (59%) 4 (50%)
Justice client+ 85 (36%) 26 (17%) F(1,352)=11.121, p=.001. Non-
Justice had significantly greater drop than Justice
Non-Justice+ 155 (55%) 38 (19%)
AODTC client 10 (22%) 2 (9%) F(1.352)=.095, p=.758
1Repeated measures ANOVA +Statistically significant differences between subgroups
*Results for some subgroups are not generalisable due to small numbers
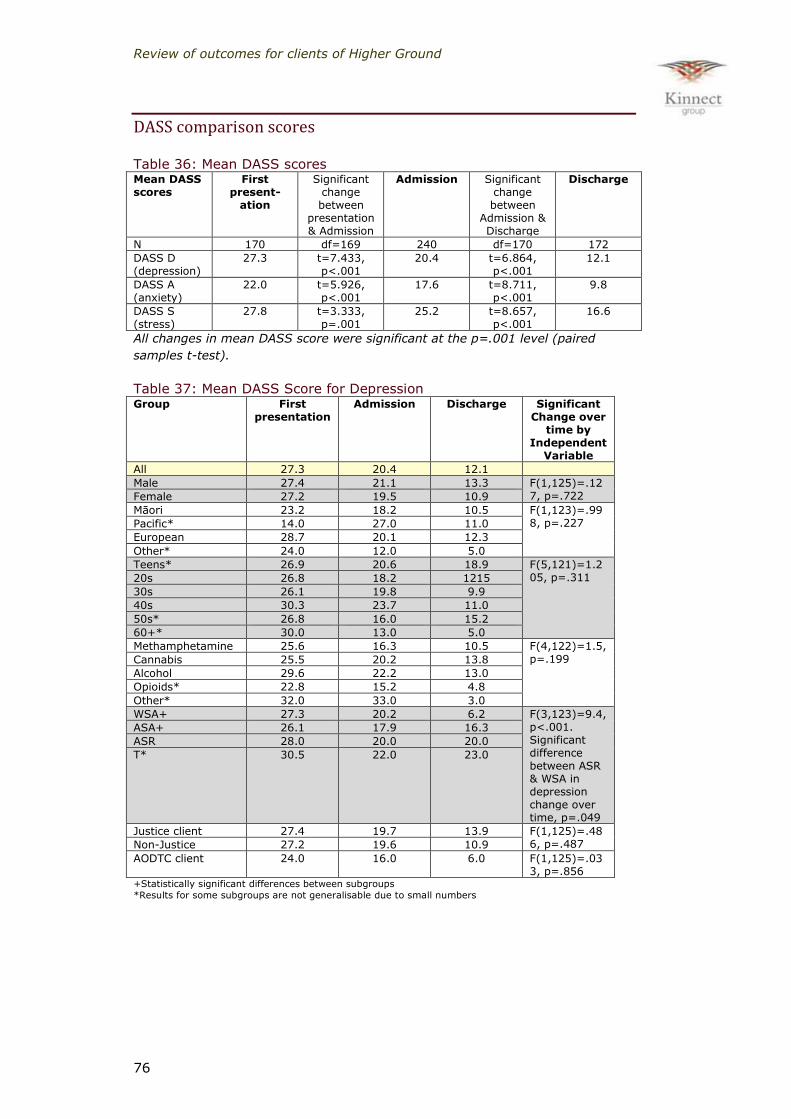
Review of outcomes for clients of Higher Ground
76
DASS comparison scores
Table 36: Mean DASS scores Mean DASS scores
First present-
ation
Significant change between
presentation & Admission
Admission
Significant change between
Admission & Discharge
Discharge
N 170 df=169 240 df=170 172
DASS D (depression)
27.3 t=7.433, p<.001
20.4 t=6.864, p<.001
12.1
DASS A (anxiety)
22.0 t=5.926, p<.001
17.6 t=8.711, p<.001
9.8
DASS S (stress)
27.8 t=3.333, p=.001
25.2 t=8.657, p<.001
16.6
All changes in mean DASS score were significant at the p=.001 level (paired
samples t-test).
Table 37: Mean DASS Score for Depression Group First
presentation Admission Discharge Significant
Change over time by
Independent Variable
All 27.3 20.4 12.1
Male 27.4 21.1 13.3 F(1,125)=.127, p=.722 Female 27.2 19.5 10.9
Māori 23.2 18.2 10.5 F(1,123)=.998, p=.227 Pacific* 14.0 27.0 11.0
European 28.7 20.1 12.3
Other* 24.0 12.0 5.0
Teens* 26.9 20.6 18.9 F(5,121)=1.205, p=.311 20s 26.8 18.2 1215
30s 26.1 19.8 9.9
40s 30.3 23.7 11.0
50s* 26.8 16.0 15.2
60+* 30.0 13.0 5.0
Methamphetamine 25.6 16.3 10.5 F(4,122)=1.5, p=.199 Cannabis 25.5 20.2 13.8
Alcohol 29.6 22.2 13.0
Opioids* 22.8 15.2 4.8
Other* 32.0 33.0 3.0
WSA+ 27.3 20.2 6.2 F(3,123)=9.4, p<.001. Significant difference between ASR & WSA in depression change over time, p=.049
ASA+ 26.1 17.9 16.3
ASR 28.0 20.0 20.0
T* 30.5 22.0 23.0
Justice client 27.4 19.7 13.9 F(1,125)=.486, p=.487 Non-Justice 27.2 19.6 10.9
AODTC client 24.0 16.0 6.0 F(1,125)=.033, p=.856
+Statistically significant differences between subgroups
*Results for some subgroups are not generalisable due to small numbers
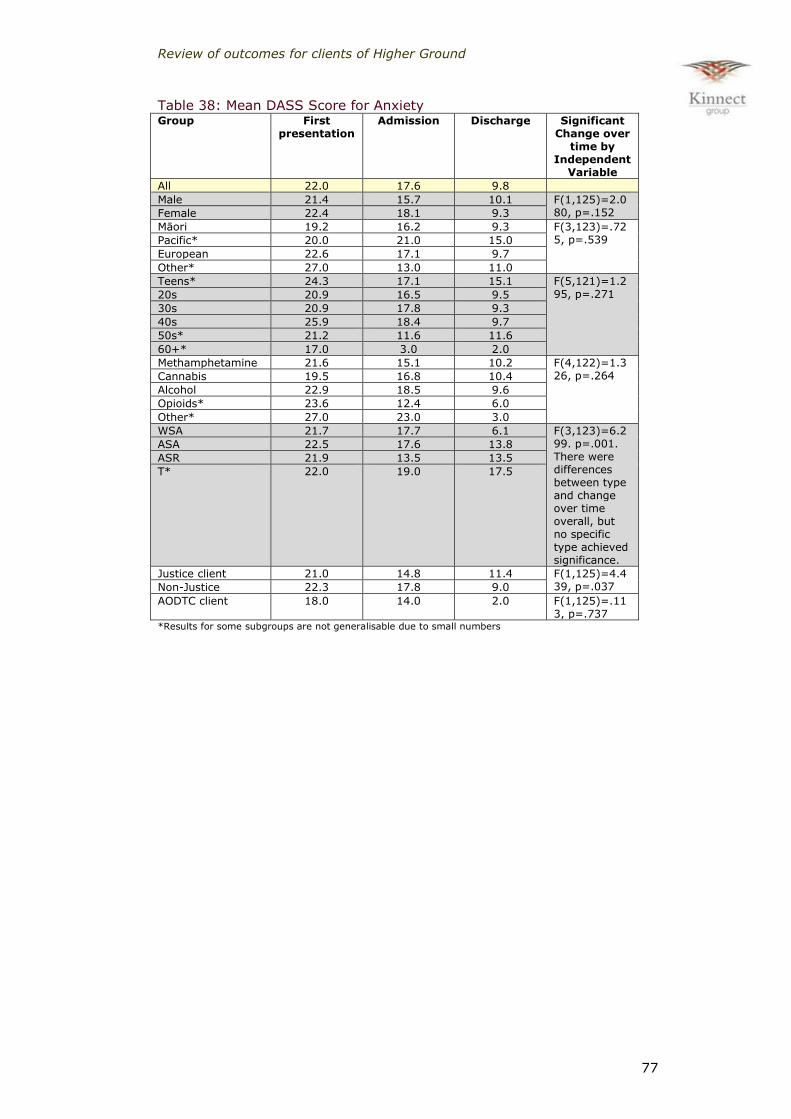
Review of outcomes for clients of Higher Ground
77
Table 38: Mean DASS Score for Anxiety Group First
presentation
Admission
Discharge
Significant Change over
time by Independent
Variable
All 22.0 17.6 9.8
Male 21.4 15.7 10.1 F(1,125)=2.080, p=.152 Female 22.4 18.1 9.3
Māori 19.2 16.2 9.3 F(3,123)=.725, p=.539 Pacific* 20.0 21.0 15.0
European 22.6 17.1 9.7
Other* 27.0 13.0 11.0
Teens* 24.3 17.1 15.1 F(5,121)=1.295, p=.271 20s 20.9 16.5 9.5
30s 20.9 17.8 9.3
40s 25.9 18.4 9.7
50s* 21.2 11.6 11.6
60+* 17.0 3.0 2.0
Methamphetamine 21.6 15.1 10.2 F(4,122)=1.326, p=.264 Cannabis 19.5 16.8 10.4
Alcohol 22.9 18.5 9.6
Opioids* 23.6 12.4 6.0
Other* 27.0 23.0 3.0
WSA 21.7 17.7 6.1 F(3,123)=6.299. p=.001. There were differences between type and change over time overall, but no specific type achieved significance.
ASA 22.5 17.6 13.8
ASR 21.9 13.5 13.5
T* 22.0 19.0 17.5
Justice client 21.0 14.8 11.4 F(1,125)=4.439, p=.037 Non-Justice 22.3 17.8 9.0
AODTC client 18.0 14.0 2.0 F(1,125)=.113, p=.737
*Results for some subgroups are not generalisable due to small numbers
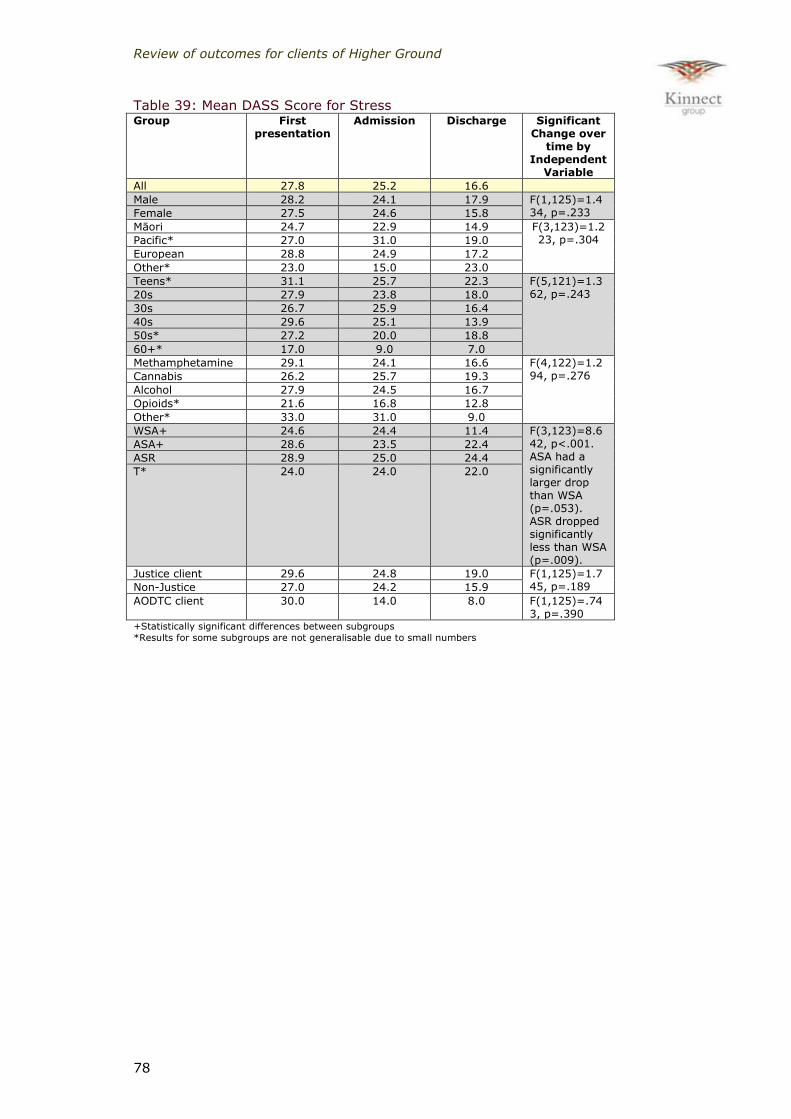
Review of outcomes for clients of Higher Ground
78
Table 39: Mean DASS Score for Stress Group First
presentation
Admission
Discharge
Significant Change over
time by Independent
Variable
All 27.8 25.2 16.6
Male 28.2 24.1 17.9 F(1,125)=1.434, p=.233 Female 27.5 24.6 15.8
Māori 24.7 22.9 14.9 F(3,123)=1.223, p=.304 Pacific* 27.0 31.0 19.0
European 28.8 24.9 17.2
Other* 23.0 15.0 23.0
Teens* 31.1 25.7 22.3 F(5,121)=1.362, p=.243 20s 27.9 23.8 18.0
30s 26.7 25.9 16.4
40s 29.6 25.1 13.9
50s* 27.2 20.0 18.8
60+* 17.0 9.0 7.0
Methamphetamine 29.1 24.1 16.6 F(4,122)=1.294, p=.276 Cannabis 26.2 25.7 19.3
Alcohol 27.9 24.5 16.7
Opioids* 21.6 16.8 12.8
Other* 33.0 31.0 9.0
WSA+ 24.6 24.4 11.4 F(3,123)=8.642, p<.001. ASA had a significantly larger drop than WSA (p=.053). ASR dropped significantly less than WSA (p=.009).
ASA+ 28.6 23.5 22.4
ASR 28.9 25.0 24.4
T* 24.0 24.0 22.0
Justice client 29.6 24.8 19.0 F(1,125)=1.745, p=.189 Non-Justice 27.0 24.2 15.9
AODTC client 30.0 14.0 8.0 F(1,125)=.743, p=.390
+Statistically significant differences between subgroups
*Results for some subgroups are not generalisable due to small numbers

Review of outcomes for clients of Higher Ground
79
Table 40: Distribution of depression scores Severity First
presentation Admission Discharge
3 month
6 month
9 month
12 month
Extremely severe 28+ 91 (54%) 66 (17%) 26 (15%) 8 (8%) 12 (14%) 2 (4%) 1 (2%) Severe 21-27 35 (21%) 53 (22%) 11 (6%) 4 (4%) 10 (12%) 2 (4%) 1 (2%) Moderate 14-20 25 (15%) 57 (24%) 25 (25%) 17 (16%) 3 (3%) 6 (11%) 7 (15%) Mild 10-13 8 (5%) 23 (10%) 29 (17%) 15 (14%) 4 (5%) 6 (11%) 2 (4%) Normal 0-9 11 (7%) 41 (17%) 81 (47%) 63 (59%) 58 (67%) 39 (71%) 37 (77%)
Table 41: Distribution of anxiety scores First
presentation Admission Discharge 3 month 6 month 9 month 12 month
Extremely severe 20+ 103 (61%) 101 (42%) 26 (15%) 13 (12%) 11 (13%) 4 (7%) 5 (10%)
Severe 15-19 27 (16%) 27 (11%) 13 (8%) 5 (5%) 6 (7%) 6 (11%) 2 (4%)
Moderate 10-14 20 (12%) 69 (29%) 40 (23%) 21 (20%) 8 (9%) 11 (20%) 9 (19%)
Mild 8-9 7 (4%) 14 (6%) 12 (7%) 7 (7%) 8 (9%) 1 (2%) 3 (6%)
Normal 0-7 13 (8%) 29 (12%) 81 (47%) 61 (57%) 54 (62%) 34 (61%) 29 (60%)
Table 42: Distribution of stress scores First
presentation Admission Discharge 3 month 6 month 9 month 12 month
Extremely severe 34+ 58 (34%) 52 (22%) 12 (7%) 4 (4%) 5 (6%) 1 (2%) 1 (2%)
Severe 26-33 49 (29%) 63 (26%) 22 (13%) 11 (10%) 8 (9%) 4 (7%) 5 (10%)
Moderate 19-25 27 (16%) 70 (29%) 26 (15%) 16 (7%) 10 (12%) 9 (16%) 3 (6%)
Mild 15-18 18 (11%) 29 (12%) 26 (15%) 12 (5%) 9 (10%) 6 (11%) 4 (8%)
Normal 0-14 18 (11%) 26 (11%) 86 (50%) 64 (60%) 55 (63%) 36 (64%) 35 (73%)
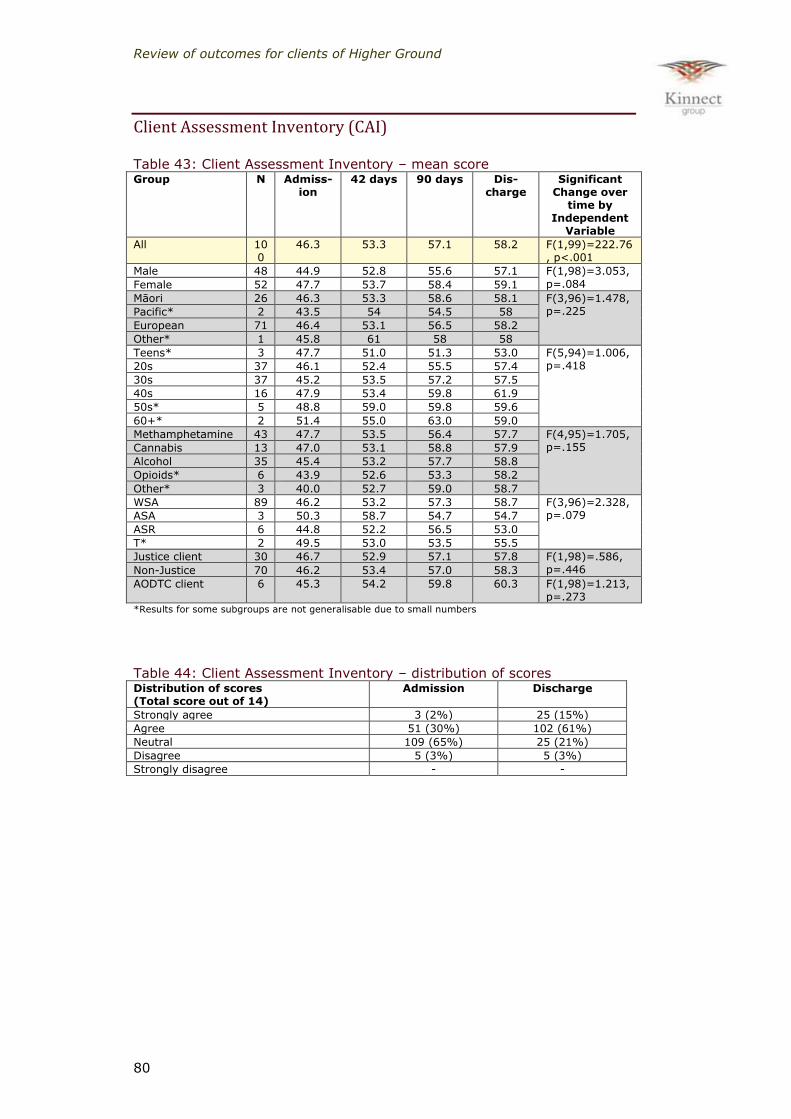
Review of outcomes for clients of Higher Ground
80
Client Assessment Inventory (CAI)
Table 43: Client Assessment Inventory – mean score Group N Admiss-
ion
42 days 90 days Dis-charge
Significant Change over
time by Independent
Variable
All 100
46.3 53.3 57.1 58.2 F(1,99)=222.76, p<.001
Male 48 44.9 52.8 55.6 57.1 F(1,98)=3.053,
p=.084 Female 52 47.7 53.7 58.4 59.1
Māori 26 46.3 53.3 58.6 58.1 F(3,96)=1.478, p=.225 Pacific* 2 43.5 54 54.5 58
European 71 46.4 53.1 56.5 58.2
Other* 1 45.8 61 58 58
Teens* 3 47.7 51.0 51.3 53.0 F(5,94)=1.006, p=.418 20s 37 46.1 52.4 55.5 57.4
30s 37 45.2 53.5 57.2 57.5
40s 16 47.9 53.4 59.8 61.9
50s* 5 48.8 59.0 59.8 59.6
60+* 2 51.4 55.0 63.0 59.0
Methamphetamine 43 47.7 53.5 56.4 57.7 F(4,95)=1.705, p=.155 Cannabis 13 47.0 53.1 58.8 57.9
Alcohol 35 45.4 53.2 57.7 58.8
Opioids* 6 43.9 52.6 53.3 58.2
Other* 3 40.0 52.7 59.0 58.7
WSA 89 46.2 53.2 57.3 58.7 F(3,96)=2.328, p=.079 ASA 3 50.3 58.7 54.7 54.7
ASR 6 44.8 52.2 56.5 53.0
T* 2 49.5 53.0 53.5 55.5
Justice client 30 46.7 52.9 57.1 57.8 F(1,98)=.586, p=.446 Non-Justice 70 46.2 53.4 57.0 58.3
AODTC client 6 45.3 54.2 59.8 60.3 F(1,98)=1.213, p=.273
*Results for some subgroups are not generalisable due to small numbers
Table 44: Client Assessment Inventory – distribution of scores Distribution of scores (Total score out of 14)
Admission Discharge
Strongly agree 3 (2%) 25 (15%)
Agree 51 (30%) 102 (61%)
Neutral 109 (65%) 25 (21%)
Disagree 5 (3%) 5 (3%)
Strongly disagree - -

Review of outcomes for clients of Higher Ground
81
Table 45: Client Assessment Inventory – analysis by question % of clients who answered ‘agree’ or ‘strongly agree’ Admission Discharge
1. My behaviour and attitude show that I am a mature person 46% 67%
2. I regularly meet my obligations and responsibilities 42% 77%
3. I strive to live with positive values and principles (honesty) 61% 82%
4. I still have the attitudes and behaviours associated with the drug/criminal lifestyle 29% 59%
5. I often present an image rather than my true self 18% 53%
6. My job function helps me learn about myself and is a valuable part of treatment 40% 70%
7. I get along with and interact well (mix well socially with people) 60% 75%
8. Overall, I have good awareness, judgment, decision-making and problem solving skills 55% 70%
9. I’m able to identify my feelings and express them in an appropriate way 25% 58%
10. I feel good about who I am (my self-esteem is high) 12% 49%
11. I understand and accept the program rules, philosophy and structure 86% 77%
12. I enthusiastically participate in program activities 61% 80%
13. I feel an investment, attachment and ownership in the program 64% 73%
14. My behaviour and attitude set a good example for other members of the community 35% 66%
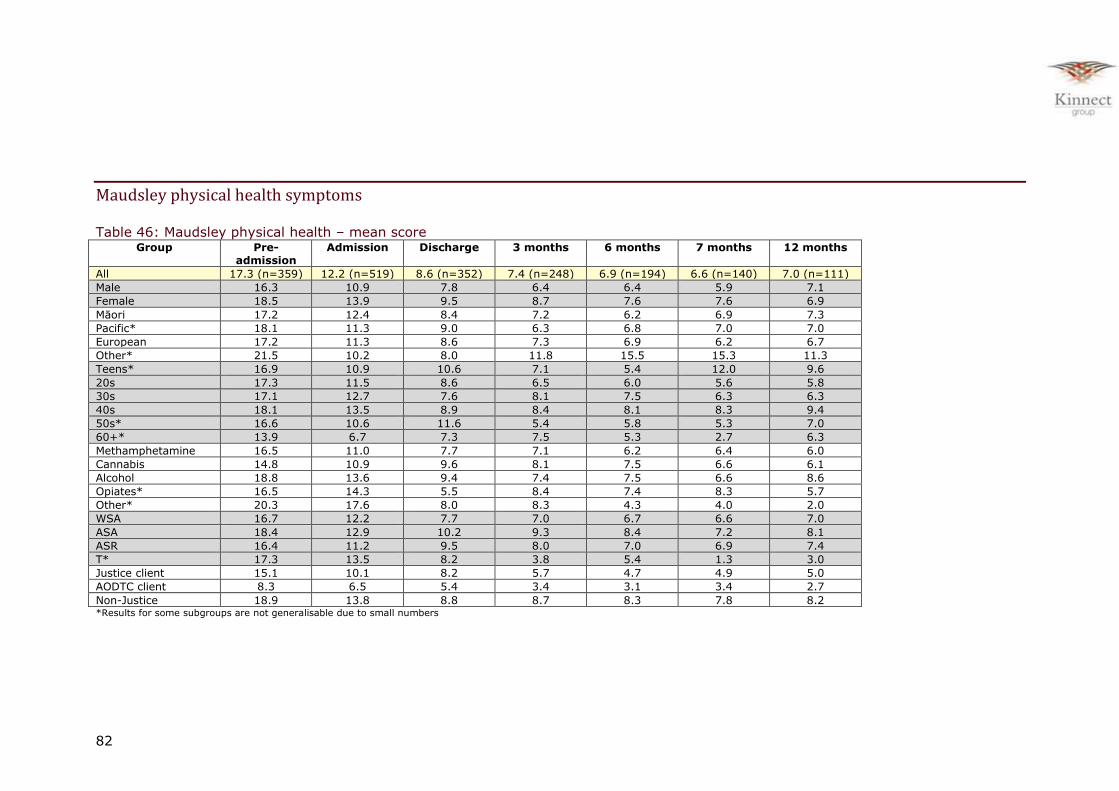
82
Maudsley physical health symptoms
Table 46: Maudsley physical health – mean score Group Pre-
admission Admission Discharge
3 months
6 months 7 months
12 months
All 17.3 (n=359) 12.2 (n=519) 8.6 (n=352) 7.4 (n=248) 6.9 (n=194) 6.6 (n=140) 7.0 (n=111)
Male 16.3 10.9 7.8 6.4 6.4 5.9 7.1
Female 18.5 13.9 9.5 8.7 7.6 7.6 6.9
Māori 17.2 12.4 8.4 7.2 6.2 6.9 7.3
Pacific* 18.1 11.3 9.0 6.3 6.8 7.0 7.0
European 17.2 11.3 8.6 7.3 6.9 6.2 6.7
Other* 21.5 10.2 8.0 11.8 15.5 15.3 11.3
Teens* 16.9 10.9 10.6 7.1 5.4 12.0 9.6
20s 17.3 11.5 8.6 6.5 6.0 5.6 5.8
30s 17.1 12.7 7.6 8.1 7.5 6.3 6.3
40s 18.1 13.5 8.9 8.4 8.1 8.3 9.4
50s* 16.6 10.6 11.6 5.4 5.8 5.3 7.0
60+* 13.9 6.7 7.3 7.5 5.3 2.7 6.3
Methamphetamine 16.5 11.0 7.7 7.1 6.2 6.4 6.0
Cannabis 14.8 10.9 9.6 8.1 7.5 6.6 6.1
Alcohol 18.8 13.6 9.4 7.4 7.5 6.6 8.6
Opiates* 16.5 14.3 5.5 8.4 7.4 8.3 5.7
Other* 20.3 17.6 8.0 8.3 4.3 4.0 2.0
WSA 16.7 12.2 7.7 7.0 6.7 6.6 7.0
ASA 18.4 12.9 10.2 9.3 8.4 7.2 8.1
ASR 16.4 11.2 9.5 8.0 7.0 6.9 7.4
T* 17.3 13.5 8.2 3.8 5.4 1.3 3.0
Justice client 15.1 10.1 8.2 5.7 4.7 4.9 5.0
AODTC client 8.3 6.5 5.4 3.4 3.1 3.4 2.7
Non-Justice 18.9 13.8 8.8 8.7 8.3 7.8 8.2 *Results for some subgroups are not generalisable due to small numbers
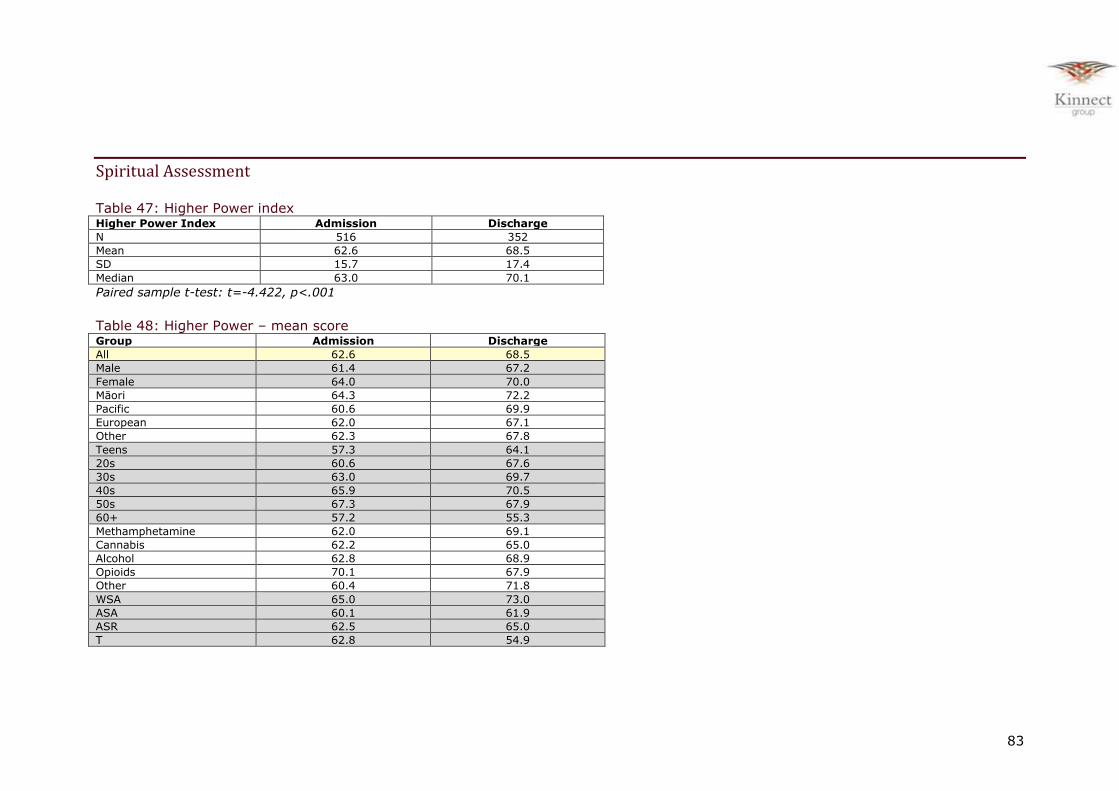
83
Spiritual Assessment
Table 47: Higher Power index Higher Power Index Admission Discharge
N 516 352
Mean 62.6 68.5
SD 15.7 17.4
Median 63.0 70.1
Paired sample t-test: t=-4.422, p<.001
Table 48: Higher Power – mean score Group Admission Discharge
All 62.6 68.5
Male 61.4 67.2
Female 64.0 70.0
Māori 64.3 72.2
Pacific 60.6 69.9
European 62.0 67.1
Other 62.3 67.8
Teens 57.3 64.1
20s 60.6 67.6
30s 63.0 69.7
40s 65.9 70.5
50s 67.3 67.9
60+ 57.2 55.3
Methamphetamine 62.0 69.1
Cannabis 62.2 65.0
Alcohol 62.8 68.9
Opioids 70.1 67.9
Other 60.4 71.8
WSA 65.0 73.0
ASA 60.1 61.9
ASR 62.5 65.0
T 62.8 54.9

84
Justice client 61.5 68.3
AODTC client 64.4 70.8
Non-Justice 63.5 68.6
Table 49: Higher Power – distribution of scores Response Admission Discharge 3 month 6 month 9 month 12-month follow
up
Strongly disbelieve 14 (3%) 16 (5%) 1 (0.4%) 0 2 (1%) 0
Disbelieve 29 (6%) 13 (4%) 7 (3%) 5 (3%) 4 (3%) 3 (3%)
Neutral 169 (33%) 49 (14%) 33 (13%) 23 (12%) 17 (12%) 15 (14%)
Believe 197 (38%) 131 (37%) 97 (39%) 81 (42%) 53 (38%) 42 (38%)
Strongly believe 107 (21%) 143 (41%) 108 (44%) 84 (44%) 64 (46%) 51 (46%)
Recommended