PROTEOMICS: GROUP 7
Aaron Simo, Antolino Venegas, & Daniel Weisman

Project 1
• To compare the standards of constant concentration gels:– Determine the best predictive models for each
gel concentration and then do a comparative analysis.
– Extrapolate the lightest molecular weight able to be captured for each concentration.
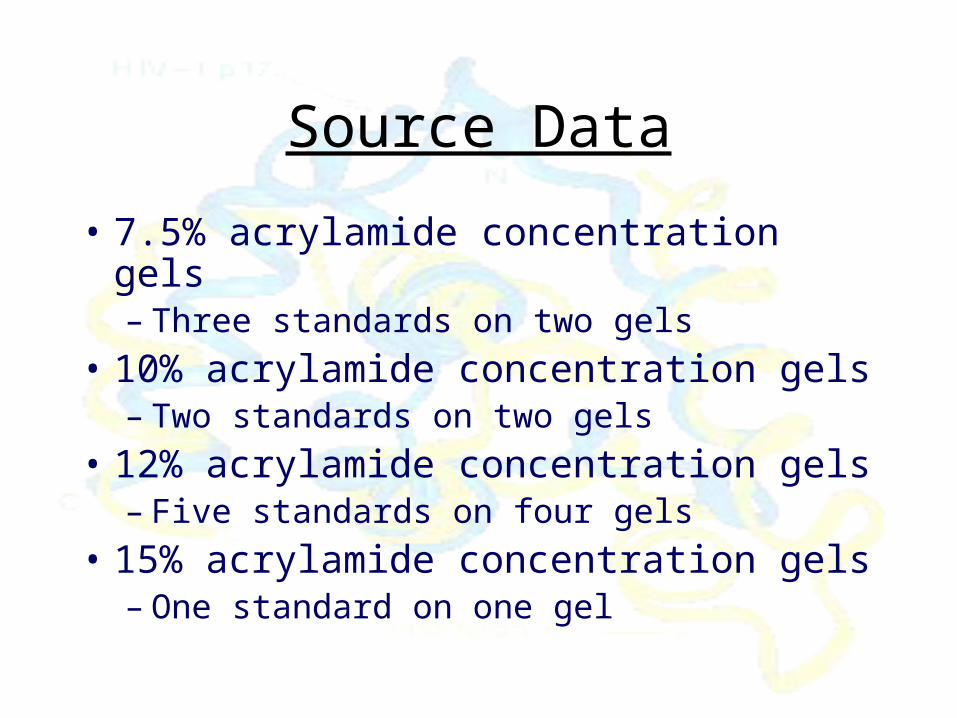
Source Data
• 7.5% acrylamide concentration gels– Three standards on two gels
• 10% acrylamide concentration gels– Two standards on two gels
• 12% acrylamide concentration gels– Five standards on four gels
• 15% acrylamide concentration gels– One standard on one gel

Gel Sample

Methods
• Cut & paste the scanned gels from the protein start point.
• Measure each protein band’s centimeters traveled and find the relative mobility by dividing the centimeters traveled by the dyefront.
• Plot relative mobility against the Log of the molecular weight and add trend lines.
• Find the R2 adjusted for the trend lines as an indicator of the best fitting models.

Methods (Continued)
• Using Minitab, construct the confidence intervals for the best fitting trend lines.
• Using Minitab, extrapolate the lightest molecular weight that can be captured by each gel according to each gel’s model with the tightest confidence interval.

Decisions
• Skewed gel columns were rotated, sometimes individually, to align with the Photoshop rulers.
• Band measurements were weighted to higher saturation.– A higher saturation is indicative of a higher
protein count, and we wanted the measurements to be representative of the median of the protein’s population.

Decisions (Continued)
• Only the first standard column per gel was used so that there would be equal amounts of data per gel concentration for accurate comparisons.– Unequal number of data would lead to great differences in
degrees of freedom and make the concentrations not comparable.
• The best models were determined by the smallest confidence intervals.– A model’s predictive value is determined by the confidence
interval, so the model with the tightest confidence interval would represent the model with the greatest predictive value.
Decisions (Continued)
• Extrapolation for the lightest molecular weight was done using the models with the tightest confidence intervals.

Discovery
• We discovered an abnormally large difference between the relative mobility of the 12% Sea Urchin Gels and the 12% Frog Gels.
• Because specific gel concentrations have generally correlative relative mobility, we plotted each set of relative mobility standards against the molecular weight and found that the 12% Frog Gel Set is most likely mislabeled and truly a gel concentration around 15%.

Relative Mobility vs. Log (Mw)
4.2000
4.4000
4.6000
4.8000
5.0000
5.2000
5.4000
0.0000 0.1000 0.2000 0.3000 0.4000 0.5000 0.6000 0.7000 0.8000 0.9000 1.0000
Relative Mobility
Lo
g (
Mw
)
7.5% Male Lane 3
7.5% Male Lane 8
7.5% Female
10% Sea Urchin
10% Sea Urchiin Rep.
12% Sea Urchin
12% Sea Urchin Rep.
12% Frog Male
12% Frog Female Lane 3
12% Female Lane 8
15% Frog

Conclusions
• The 12% concentration frog sample is most likely not truly 12%, but a higher concentration somewhere in the vicinity of 15%.
• For differentiation of the heaviest proteins, a 10% acrylamide concentration provides the tightest confidence intervals, but for lighter proteins a 12% or higher is best.

Gel Concentration Confidence Intervals
0.0000
0.0100
0.0200
0.0300
0.0400
0.0500
0.0600
1 2 3 4 5 6 7
Con
fid
en
ce I
nte
rval
7.5% Gel Intervals
10% Gel Intervals
12% Sea Urchin Gel Intervals
12% Frog Gel Intervals

Conclusions (Continued)
• Gel concentration lower limits for molecular weight:– 7.5% limits at 45,500 daltons– 10% limits at 44,400 daltons– 12% Sea Urchin limits at 25,100 daltons– 12% Frog limits at 19,900 daltons– 15% limits at 14,200 daltons

Lower Limits for Molecular Weight
0
5000
10000
15000
20000
25000
30000
35000
40000
45000
50000
Mo
lecu
lar
Wei
gh
t
7.5% Limit
10% Limit
12% Sea Urchin Limit
12% Frog Limit
15% Limit

Conclusions (Continued)
• The high correlation suggests the possibility of using the exact same model for all gels of the same concentration and specific models for specific Log of the molecular weights.

Relative Mobility vs. Log (Mw)
4.2000
4.4000
4.6000
4.8000
5.0000
5.2000
5.4000
0.0000 0.1000 0.2000 0.3000 0.4000 0.5000 0.6000 0.7000 0.8000 0.9000 1.0000
Relative Mobility
Lo
g (
Mw
)
7.5% Male Lane 3
7.5% Male Lane 8
7.5% Female
10% Sea Urchin
10% Sea Urchiin Rep.
12% Sea Urchin
12% Sea Urchin Rep.
12% Frog Male
12% Frog Female Lane 3
12% Female Lane 8
15% Frog
Recommended