What explains total diversity in a community?
Keystone species can influence diversity
Equilibrium theory of island biogeography
Disturbance
Productivity
Productivity
amount of sunlight turned into primary producers
(plants, algae, etc), often estimated using biomass
of primary producers
Many empirical studies have found a hump-shaped
relationship between the productivity of a system
and the number of species in that system
Productivity
Num
ber
of sp
ecie
s
Biomass
Productivity vs Species richness
Biomass
Spec
ies
rich
nes
s
Habitat heterogeneity: the
relationship between species
richness and biomass varies
among microhabitats
Productivity and Biodiversity
Habitat heterogeneity: the
relationship between species
richness and biomass varies
among microhabitats
Competition
Productivity and Biodiversity
Num
ber
of sp
ecie
s
Biomass
Increase in
productivity
allows for
coexistence
of more
species
Competition
begins to
remove less
competitive
species

What explains total diversity in a community?
Keystone species can influence diversity
Equilibrium theory of island biogeography
Disturbance
Productivity
Habitat heterogeneity
Habitat heterogeneity and Biodiversity
Ecosystems with more heterogeneous habitats have
more potential niches, allowing the coexistence of more
species.
Habitat heterogeneityNum
ber
of sp
ecie
s
Habitat heterogeneity and Biodiversity
Foliage height
diversity
Bird
sp
ecie
s
div
ers
ity
-MacArtur and MacArthur (1961)
found that the bird diversity of a
habitat increased with the
complexity of the habitat’s
vegetation
-Similar relationships have been
demonstrated in other taxa
What explains total diversity in a community?
Keystone species can influence diversity
Equilibrium theory of island biogeography
Disturbance
Productivity
Habitat heterogeneity
Is biodiversity important for ecosystem structure and function?
Do ecosystems with high species diversity “function”
better?
Are ecosystems with high species diversity more
stable?
Species richness
Eco
syst
em funct
ion
Species richness
Eco
syst
em funct
ion
Species richness
Eco
syst
em funct
ion
Species richness
Eco
syst
em funct
ion
No relationship More diversity is more stable
Redundancy Idiosyncratic
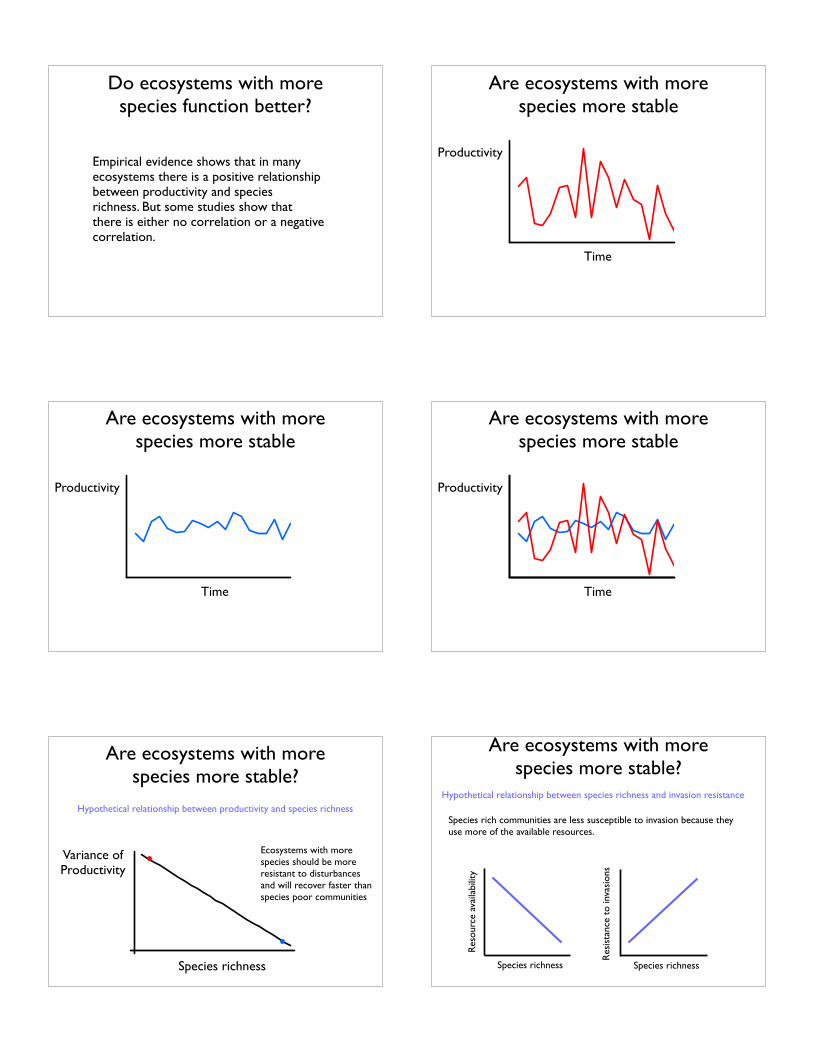
Do ecosystems with more species function better?
Empirical evidence shows that in many ecosystems there is a positive relationship between productivity and species richness. But some studies show that there is either no correlation or a negative correlation.
Are ecosystems with more species more stable
Time
Productivity
Are ecosystems with more species more stable
Time
Productivity
Are ecosystems with more species more stable
Time
Productivity
Are ecosystems with more species more stable?
Species richness
Variance of Productivity
Ecosystems with more species should be more resistant to disturbances and will recover faster than species poor communities
Hypothetical relationship between productivity and species richness
Are ecosystems with more species more stable?
Species richness
Res
ourc
e av
aila
bili
ty
Species richness
Res
ista
nce
to inv
asio
ns
Hypothetical relationship between species richness and invasion resistance
Species rich communities are less susceptible to invasion because theyuse more of the available resources.
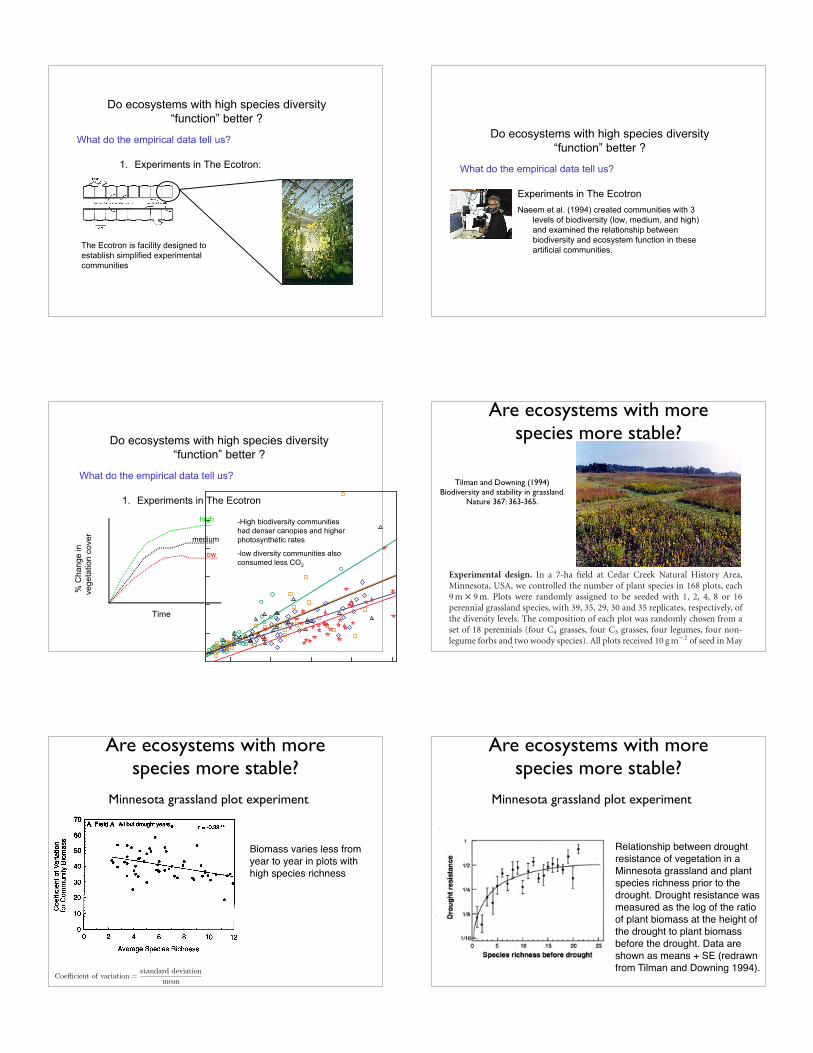
Do ecosystems with high species diversity
“function” better ?
What do the empirical data tell us?
1. Experiments in The Ecotron:
The Ecotron is facility designed to
establish simplified experimental
communities
Do ecosystems with high species diversity
“function” better ?
What do the empirical data tell us?
1. Experiments in The Ecotron
Naeem et al. (1994) created communities with 3
levels of biodiversity (low, medium, and high)
and examined the relationship between
biodiversity and ecosystem function in these
artificial communities.
Do ecosystems with high species diversity
“function” better ?
What do the empirical data tell us?
1. Experiments in The Ecotron
low
medium
high
Time
% C
ha
ng
e in
ve
ge
tatio
n c
ove
r
-High biodiversity communities
had denser canopies and higher
photosynthetic rates
-low diversity communities also
consumed less CO2
Are ecosystems with more species more stable?
Tilman and Downing (1994) Biodiversity and stability in grassland.
Nature 367: 363-365.
©!2006!Nature Publishing Group!
!
four years before imposition of drought, more diverse plots hadgreater temporal stability25. In combination, these two studiesindicate that there might be short-term variability in effects ofdiversity on ecosystem stability but that, in the long term, higherplant diversity causes greater ecosystem stability.Our results support the predictions of competition theory that
greater diversity leads to greater ecosystem stability and lower speciesstability8,19,22.This theory predicts that greater ecosystem stability athigher diversity can result from increasingly negative covariance inthe abundances of competing species at higher diversity19,22 (covari-ance effect), from the manner in which temporal variance in speciesabundances scales with abundance19,22,26,27 (statistical averaging orportfolio effect), and/or from the manner in which species abun-dances scale with diversity19,22 (overyielding effect; greater ecosystemtotal biomass at higher diversity).The covariance effect requires that total covariance (temporal
covariance in abundances for each pair of species, summed acrossall possible pairs of species) decline as diversity increases. However,regression showed no dependence of total covariance for 2001–05 onspecies number (F1, 161 ¼ 0.83, P ¼ 0.36). Our results thus do notsupport the covariance effect, a conclusion also reached in an earlieranalysis of non-experimental data22. The portfolio effect22,26 requirestemporal variance, s2, in the abundance of a species to scale with itsbiomass, m, as s 2 ¼ c 1m
z, with 1 , z , 2, which it did, withz ¼ 1.60. This supports the role of the portfolio effect in stabilizinghigher-diversity plots. In multiple regression, summed varianceswere a declining function of species number (F 1, 160 ¼ 15.7,P , 0.0001) and an increasing function of total biomass(F1, 160 ¼ 127, P , 0.0001), which also supports the portfolio effect.The overyielding effect requires22 that total plot biomass, B, increasewith diversity, which it did each year of the experiment. For 2001–05,plots containing 16 species had, on average, 180%more biomass thanmonocultures. In total, these analyses strongly indicate that greaterecosystem stability at higher diversity resulted from portfolio andoveryielding effects.Rapidly increasing human population and consumption, and
concomitant demand for food and energy, are making societyincreasingly dependent on services provided by remaining naturaland managed ecosystems28,29. Biodiversity experiments have shownthat greater numbers of plant species lead to a greater productionof biomass1–6. Our results show that the long-term stability of an
ecosystem service—the annual production of biomass and thus ofpotential biofuels and livestock fodder1–6—also depends on bio-diversity. Biodiversity can therefore be an important element forthe reliable and sustainable provisioning of ecosystem services.
METHODSExperimental design. In a 7-ha field at Cedar Creek Natural History Area,Minnesota, USA, we controlled the number of plant species in 168 plots, each9m £ 9m. Plots were randomly assigned to be seeded with 1, 2, 4, 8 or 16perennial grassland species, with 39, 35, 29, 30 and 35 replicates, respectively, ofthe diversity levels. The composition of each plot was randomly chosen from aset of 18 perennials (four C4 grasses, four C3 grasses, four legumes, four non-legume forbs and two woody species). All plots received 10 gm22 of seed in May1994 and 5 gm22 in May 1995, with seed mass divided equally between species.Treatments were maintained by weeding three or four times each year. Weedswere removed while still small, with care being taken to minimize any disturb-ance. Plots were burned annually in spring before growth began. Five woodymonocultures are not included in analyses because burning effectively elimi-nated woody species from multispecies plots. Plots were annually sampled inmid-August for aboveground living plant biomass by clipping, drying andweighing four parallel and evenly spaced 0.1m £ 3.0m vegetation strips perplot from 1996 to 1999 and four 0.1m £ 6.0m strips per plot from 2000 to 2005.Different locations were clipped each year. Biomass from one strip per plot wassorted to species from 2001 to 2005. The Shannon diversity index, H 0 , usedabundances of each species, planted or weedy, in each plot by means of estimatesof percentage cover for 1996–2000 (four 0.5m2 subplots per plot) and sortedbiomass for 2001–2005. See ref. 4 for further details.Sampling effort. To eliminate potential bias from different sampling efforts forthe first four in comparison with the last six years, for each of the last six yearstwo clipped strips per plot were randomly chosen for an analysis of ecosystemstability. The full data gave similarly significant and positive effects of diversityon all three measures of ecosystem stability.Detrending and other analyses. Detrending was done, for each plot, by meansof linear regression of annually measured plot biomass on the logarithm of yearand used all ten years of plot data. The logarithm of year provided a generallybetter fit than year; both gave similar results. The standard deviation, jd, ofresiduals for each regression measures detrended variation. The detrendedtemporal stability, Sd, of a plot was Sd ¼ m/jd. Each plot had a single detrendedstability value for the ten-year period. In contrast, when data were divided intoshorter intervals that did not require detrending, there were multiple values of S,calculated as S ¼ m/j, per plot. We divided the data either into two subsets, eachfive years in duration (1996–2000 and 2001–05) or into five subsets, each twoyears in duration (1996–97, 1998–99, 2000–01, 2002–03 and 2004–05). Thesetemporal sequences of S values for each plot were analysed with the use ofrepeated-measures MANOVA.
Received 20 December 2005; accepted 23 March 2006.
1. Naeem, S., Hakenson, K., Lawton, J. H., Crawley, M. J. & Thompson, L. J.Biodiversity and plant productivity in a model assemblage of plant species.Oikos 76, 259–-264 (1996).
2. Tilman, D., Wedin, D. & Knops, J. Productivity and sustainability influenced bybiodiversity in grassland ecosystems. Nature 379, 718–-720 (1996).
3. Hector, A. et al. Plant diversity and productivity experiments in Europeangrasslands. Science 286, 1123–-1127 (1999).
4. Tilman, D. et al. Diversity and productivity in a long-term grasslandexperiment. Science 294, 843–-845 (2001).
5. Hector, A., Bazeley-White, E., Loreau, M., Otway, S. & Schmid, B. Overyieldingin grassland communities: Testing the sampling effect hypothesis withreplicated biodiversity experiments. Ecol. Lett. 5, 502–-511 (2002).
6. Hooper, D. U. et al. Effects of biodiversity on ecosystem functioning: aconsensus of current knowledge. Ecol. Monogr. 75, 3–-35 (2005).
7. Elton, C. S. The Ecology of Invasions by Animals and Plants (Methuen, London,1958).
8. May, R. M. Stability and Complexity in Model Ecosystems (Princeton Univ. Press,Princeton, 1973).
9. McNaughton, S. J. Stability and diversity of ecological communities. Nature274, 251–-253 (1978).
10. Tilman, D. & Downing, J. A. Biodiversity and stability in grasslands. Nature 367,363–-365 (1994).
11. Tilman, D. Biodiversity: Population versus ecosystem stability. Ecology 77,350–-363 (1996).
12. Huston, M. A. Hidden treatments in ecological experiments: Re-evaluating theecosystem function of biodiversity. Oecologia 110, 449–-460 (1997).
13. Pfisterer, A. B. & Schmid, B. Diversity-dependent production can decrease thestability of ecosystem functioning. Nature 416, 84–-86 (2002).
Figure 3 | Effects of plant diversity on the relationship between meanbiomass and its temporal standard deviation. Each point shows the meanbiomass of a plot and its temporal standard deviation based on the fiveannual samples collected from 2001 to 2005. Data for each species-numbertreatment were fitted by a separate regression line. Data were not detrended.The results show that high-diversity treatments have lower temporalstandard deviations (lower risks) for a given mean biomass (return).
NATURE|Vol 441|1 June 2006 LETTERS
631
Are ecosystems with more species more stable?
Biomass varies less from
year to year in plots with
high species richness
Minnesota grassland plot experiment
Coefficient of variation =standard deviation
mean
Are ecosystems with more species more stable?
Minnesota grassland plot experiment
Relationship between drought
resistance of vegetation in a
Minnesota grassland and plant
species richness prior to the
drought. Drought resistance was
measured as the log of the ratio
of plant biomass at the height of
the drought to plant biomass
before the drought. Data are
shown as means + SE (redrawn
from Tilman and Downing 1994).
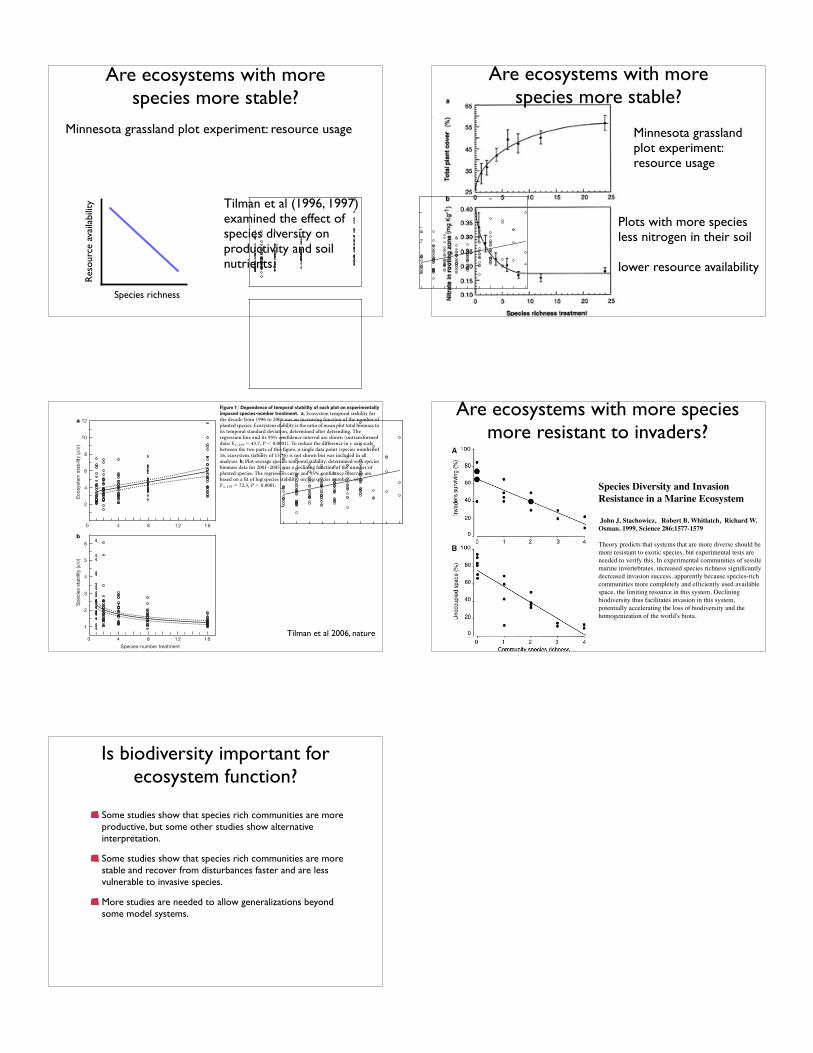
Are ecosystems with more species more stable?
Minnesota grassland plot experiment: resource usage
Species richness
Res
ourc
e av
aila
bili
ty Tilman et al (1996, 1997) examined the effect of species diversity on productivity and soil nutrients.
Are ecosystems with more species more stable?
Minnesota grasslandplot experiment: resource usage
Plots with more species less nitrogen in their soil
lower resource availability
©!2006!Nature Publishing Group!
!
(F 1, 155 ¼ 16.5, P , 0.0001), stability had a weak tendency toincrease through time (F4, 152 ¼ 2.24, P ¼ 0.067) and there was nospecies-number £ time interaction (F4, 152 ¼ 0.60, P ¼ 0.66). Simi-lar repeated-measures MANOVAs, of both two-year and five-yearstabilities, that used realized species number as the independentvariable yielded similar results. The greater ecosystem stability ofhigher-diversity plots resulted from their having lower temporalstandard deviations, for a given mean plot biomass, than plots withlower diversity (Fig. 3). In total, on average across the decadeof measurement, ecosystem stability was significantly positivelydependent on plant diversity, and this result was robust with respectto data detrending and the intervals over which stability wasdetermined.In contrast to ecosystem stability, stabilities of individual species
(log transformed), determinedwith ourfive-year recordof abundancesof each species planted in each plot, were a declining function of thenumber of planted species (F1, 988 ¼ 134.3, P , 0.0001) and, simi-larly, of effective species number, eH
0
(F1, 988 ¼ 83.6, P , 0.0001).We also calculated the average, for each plot, of the species stabilitiesof all species planted in the plot, and found that the plot-average
species stability (log transformed) was a declining function ofplanted species number (F1, 159 ¼ 63.5, P , 0.0001; Fig. 1b) and ofeH
0
(F 1, 159 ¼ 57.1, P , 0.0001). Species stabilities were notdetrended, but results were similar if detrended.We used stepwise regression to evaluate the influence of root mass,
functional group composition (presence or absence of C3 grasses, C4
grasses, legumes or non-legume forbs), weedy species biomass, initialsoil fertility (initial total soil nitrogen) and species number onecosystem stability. In both forward addition and backward elimi-nation analyses, the same three variables were retained, with ten-yeardetrended ecosystem stability remaining positively dependent onspecies number (F1, 159 ¼ 16.2, P , 0.0001) and also being positivelydependent on root mass (F1, 159 ¼ 23.0, P , 0.0001) but negativelydependent on the presence of legumes (F1, 159 ¼ 4.42, P ¼ 0.037).The positive effect of root mass probably occurred because roots arethe perenniating structure of these herbaceous perennial species, andhigher root mass should provide a larger store of nutrients andenergy to buffer growth in response to environmental variation.Weedy biomass had no significant (P . 0.05) effects on stability andwas neither added nor retained in the forward or backward stepwiseregressions, respectively. Similarly, in repeated measures analysesusing two-year or five-year ecosystem stabilities, weed biomass hadno significant effects (P . 0.1) but ecosystem stability remained anincreasing function of numbers of species planted (P , 0.001). Thisindicates that any disturbance that might have been associated withdifferences between treatments inweeding intensity did not influenceresults. Diversity did affect invading weedy species. After cessation ofweeding in subplots, total numbers of plant species and total biomassincreased more at lower diversity than at higher diversity24.The strength and consistency of the long-term stabilizing effects of
diversity on ecosystem productivity that we observed contrast withmixed effects observed when a short-term drought was imposed on abiodiversity experiment13. In that study, the proportion of above-ground plant biomass lost after an 8-week drought was independentof diversity13, indicating, by a metric analogous to ours, no effect ofdiversity on short-term proportional resistance stability. Becausemore diverse plots had greater biomass, the absolute biomass loss wasgreater at greater diversity, which was interpreted as showing lowerabsolute resistance stability at higher diversity13. However, during the
Figure 1 | Dependence of temporal stability of each plot on experimentallyimposed species-number treatment. a, Ecosystem temporal stability forthe decade from 1996 to 2005 was an increasing function of the number ofplanted species. Ecosystem stability is the ratio of mean plot total biomass toits temporal standard deviation, determined after detrending. Theregression line and its 95% confidence interval are shown (untransformeddata: F1, 159 ¼ 43.7, P , 0.0001). To reduce the difference in y axis scalebetween the two parts of this figure, a single data point (species number of16, ecosystem stability of 15.76) is not shown but was included in allanalyses. b, Plot-average species temporal stability, determined with speciesbiomass data for 2001–2005, was a declining function of the number ofplanted species. The regression curve and 95% confidence intervals arebased on a fit of log(species stability) on log(species number), withF1, 159 ¼ 72.3, P , 0.0001.
Figure 2 | Dependence of ecosystem temporal stability from 1996 to 2005on realized species number. All species, whether planted or weedy, wereranked by proportional abundance in the sorted 0.6m2 clipped strip of 2005.Proportional abundances were summed, in order from the most abundantspecies, to determine the realized species number, which is the number ofmore abundant species comprising 90%of the total aboveground biomass ofa plot. Ecosystem stability was also significantly dependent on realizedspecies number determined with cutoffs of 75% (P , 0.0001) and 99%(P ¼ 0.002). As in Fig. 1a, one data point (realized species number of 7.2,ecosystem stability of 15.76) is not shown but was included in all analyses.
LETTERS NATURE|Vol 441|1 June 2006
630
Tilman et al 2006, nature
Are ecosystems with more species more resistant to invaders?
Species Diversity and Invasion
Resistance in a Marine Ecosystem
John J. Stachowicz, Robert B. Whitlatch, Richard W.
Osman. 1999. Science 286:1577-1579
Theory predicts that systems that are more diverse should be
more resistant to exotic species, but experimental tests are
needed to verify this. In experimental communities of sessile
marine invertebrates, increased species richness significantly
decreased invasion success, apparently because species-rich
communities more completely and efficiently used available
space, the limiting resource in this system. Declining
biodiversity thus facilitates invasion in this system,
potentially accelerating the loss of biodiversity and the
homogenization of the world's biota.
Is biodiversity important for ecosystem function?
Some studies show that species rich communities are more productive, but some other studies show alternative interpretation.
Some studies show that species rich communities are more stable and recover from disturbances faster and are less vulnerable to invasive species.
More studies are needed to allow generalizations beyond some model systems.
Recommended