Embed Size (px)
Citation preview

Journal of Animal Ecology
2006
75
274ndash287
copy 2006 The AuthorsJournal compilation copy 2006 British Ecological Society
Blackwell Publishing Ltd
Evaluating the performance of species richness estimators sensitivity to sample grain size
JOAQUIacuteN HORTALdagger PAULO A V BORGESdagger and CLARA GASPARdaggerDagger
Departamento de Biodiversidad y Biologiacutea Evolutiva Museo Nacional de Ciencias Naturales (CSIC) CJoseacute Gutieacuterrez Abascal 2 Madrid 28006 Spain
dagger
Departamento de Ciecircncias Agraacuterias CITAA Universidade dos Accedilores Campus de Angra Terra-Chatilde Angra do Heroiacutesmo 9701 851 Terceira (Accedilores) Portugal and
Dagger
BIOME Group Department of Animal and Plant Sciences University of Sheffield Sheffield S10 2TN UK
Summary
1
Fifteen species richness estimators (three asymptotic based on species accumulationcurves 11 nonparametric and one based in the speciesndasharea relationship) were comparedby examining their performance in estimating the total species richness of epigeanarthropods in the Azorean Laurisilva forests Data obtained with standardizedsampling of 78 transects in natural forest remnants of five islands were aggregatedin seven different grains (ie ways of defining a single sample) islands natural areastransects pairs of traps traps database records and individuals to assess the effect ofusing different sampling units on species richness estimations
2
Estimated species richness scores depended both on the estimator considered and onthe grain size used to aggregate data However several estimators (ACE Chao1 Jackknife1and 2 and Bootstrap) were precise in spite of grain variations Weibull and several recentestimators [proposed by Rosenzweig
et al
(
Conservation Biology
2003
17
864ndash874)and Ugland
et al
(
Journal of Animal Ecology
2003
72
888ndash897)] performed poorly
3
Estimations developed using the smaller grain sizes (pair of traps traps records andindividuals) presented similar scores in a number of estimators (the above-mentionedplus ICE Chao2 MichaelisndashMenten Negative Exponential and Clench) The estimationsfrom those four sample sizes were also highly correlated
4
Contrary to other studies we conclude that most species richness estimators may beuseful in biodiversity studies Owing to their inherent formulas several nonparametricand asymptotic estimators present insensitivity to differences in the way the samples areaggregated Thus they could be used to compare species richness scores obtained fromdifferent sampling strategies Our results also point out that species richness estimationscoming from small grain sizes can be directly compared and other estimators could givemore precise results in those cases We propose a decision framework based on ourresults and on the literature to assess which estimator should be used to compare speciesrichness scores of different sites depending on the grain size of the original data and ofthe kind of data available (species occurrence or abundance data)
Key-words
Azores epigean arthropods grain size sampling effort species richnessestimation
Journal of Animal Ecology
(2006)
75
274ndash287doi 101111j1365-2656200601048x
Introduction
Species richness is the most commonly used biodiversityindicator (see Gaston 1996 for a review) for conservation
(eg Margules Nicholls amp Pressey 1988 Conroy ampNoon 1996 Kerr 1997 van Jaarsveld
et al
1998)ecological research (eg Tilman Wedin amp Knops 1996Naeem
et al
1996 Brown
et al
2001) and macroecology(eg Currie 1991 Gaston 2000 Whittaker Willis ampField 2001) However complete inventories of the faunaat a given place for a specific community or geograph-ical area are often exceedingly hard to get In additionbiodiversity data suffer from heterogeneity in sampling
Correspondence Joaquiacuten Hortal Departamento de Biodi-versidad y Biologiacutea Evolutiva Museo Nacional de CienciasNaturales (CSIC) CJoseacute Gutieacuterrez Abascal 2 Madrid28006 Spain E-mail jhortalmncncsices
275
Effect of grain size on species richness estimators
copy 2006 The AuthorsJournal compilation copy 2006 British Ecological Society
Journal of Animal Ecology
75
274ndash287
strategies andor sample size Moreover it is well knownthat differences in the characteristics of biologicalassemblages produce differences in sampling effec-tiveness Thus when the same sampling effort withstandardized techniques is carried out in differentareas andor community types sampling success maynot be always the same leading to important biases inthe total species richness inventoried at each site
Owing to this studies involving comparisons ofspecies richness among different areas sites or com-munities need to use extrapolation or rarefaction tech-niques to lsquostandardizersquo richness data (see Palmer 19901991 Baltanaacutes 1992 Soberoacuten amp Llorente 1993 Colwellamp Coddington 1994 Walther
et al
1995 Walther ampMorand 1998 Gotelli amp Colwell 2001 Walther ampMartin 2001 Walther amp Moore 2005) There aremany methodologies currently in use for this task fromwhich four main groups can be distinguished
1
Nonparametric estimators
use the species-abundanceandor occurrence relationships throughout the sam-ples to estimate total number of species using a previ-ously formulated nonparametric model (see eg Chaoamp Bunge 2002 Soslashrensen Coddington amp Scharff 2002Chiarucci
et al
2003 Rosenzweig
et al
2003 ShenChao amp Lin 2003)
2
Fitting species-abundance distributions
whereparametric models are adjusted to the distribution ofthe relative abundances of the species and are then usedto extrapolate the number of still unknown species(May 1975 Pielou 1975 1977 see also Colwell ampCoddington 1994) These kinds of methods presentseveral still unsolved problems of methodology andperformance (Walther amp Morand 1998 see alsoColwell amp Coddington 1994 for the former and Palmer1990 1991 for the latter) so they are less used for spe-cies richness estimation and have not been included inour study
3
Species accumulation curves
where the parametersof several asymptotic equations are adjusted to describethe relationship between sampling effort and samplingsuccess (ie the number of species added to the check-list by each sample) Total richness is extrapolated asthe number of species that would be found with ahypothetical infinite sampling effort (see eg LamasRobbins amp Harvey 1991 Soberoacuten amp Llorente 1993Medelliacuten amp Soberoacuten 1999 Hortal Garcia-Pereira ampGarciacutea-Barros 2004 Jimeacutenez-Valverde amp Lobo 2005)This allows estimation of the richness of a heterogeneousterritory (such as the Azorean native forests used here)as long as sampling is representative of it (Colwell Maoamp Chang 2004 R Colwell personal communication)
4
Speciesndasharea curves
where the number of species inseveral patches of different areas (either nested or not)is used to extrapolate the number of species in otherpatches of known area or in a whole region via a fittedparametric model that relates area and species richness(see Palmer amp White 1994 Flather 1996 He amp Legendre1996 Scheiner
et al
2000 Ugland Gray amp Ellingsen2003 Koellner Hersperger amp Wohlgemuth 2004)
These curves are usually nonasymptotic so total rich-ness cannot be obtained by extrapolating area to theinfinite (such as in species accumulation curves) butonly by extrapolating the number of species that couldbe expected to be found at a given area size
Most times species accumulation and speciesndashareacurves are confounded (see eg the debate in Scheiner2003 2004 and Gray Ugland amp Lambshead 20042005) For clarity we consider species accumulationcurves those where the area of each sample unit is notused to build the curve whereas speciesndasharea curvesinclude the area of each sample unit (eg a forestremnant see below) in the formulation of the curve (seeColwell
et al
2004)To date numerous assessments on the performance
of several of these estimators under different conditionsandor sample sizes have been carried out (eg Chazdon
et al
1998 Keating
et al
1998 Peterson amp Slade 1998Walther amp Morand 1998 Chiarucci Maccherini amp DeDominicis 2001 Walther amp Martin 2001 Brose 2002Longino Coddington amp Colwell 2002 Borges amp Brown2003 Brose Martinez amp Williams 2003 Chiarucci
et al
2003 Melo
et al
2003 Brose amp Martinez 2004 OrsquoHara2005 Jimeacutenez-Valverde
et al
2006 see review at Waltheramp Moore 2005) These works seek for the most ade-quate estimator that is the one with less
estimation bias
(deviation from the true richness value) and higher
precision
(ie the lesser random error) thus producing thehigher
accuracy
(the combination of bias and precision)(see Walther amp Moore 2005 for a review)
The idea behind such extensive evaluation work isto find estimators that could be used to compare spe-cies richness scores from different sites with reliabilityChazdon
et al
(1998) defined three features for an idealrichness estimator (1) independence of sample size(amount of sampling effort carried out) (2) insensitivityto unevenness in species distributions and (3) insensi-tivity to sample order The above-mentioned studiesused results from similar survey methods (thus similarsampling units) with different intensities andor sam-pling success to determine the adequacy of differentestimators However an assessment on how the differ-ent estimators perform when the units used to describesampling effort differ among the surveyed places is yetto be done Different sampling strategies are oftenused to assess species richness in natural areas or largeregions To compare richness values obtained fromdifferent survey strategies (which is often the case formacroecology studies) we need a measure with lowsensitivity to this source of variation independently ofits success in determining the real number of species ina given place The scores obtained with such an estimatorwould allow direct comparison of species richness betweensites surveyed with different sampling methodologiesas well as with unequal sampling efforts (providing thatthe sampling coverage is sufficiently large) Thus wecan add a fourth feature to those proposed by Chazdon
et al
(1998) for an ideal estimator (4) insensitivity toheterogeneity in the sample units used among studies
276
J Hortal P A V Borges amp C Gaspar
copy 2006 The AuthorsJournal compilation copy 2006 British Ecological Society
Journal of Animal Ecology
75
274ndash287
Following Whittaker
et al
(2001) recommendationshereafter we will use the term
grain size
(see Levins 1968)to define the sampling effort unit (eg traps transectscells in a geographical grid or landscape patches)
In this work we analyse the effect of variation ingrain size on species richness estimations We evaluatethe accuracy of the predictions obtained with many ofthe estimators presently available when different strat-egies are used to group the same dataset into differentgrains (ie sample units) To do this we have used datafrom standardized surveys of the arthropod epigeancommunity of native forests from the five majorAzorean islands in order to estimate the total numberof arthropod species that occurs in the Archipelago (ex-cluding small islands) using seven different grain sizes
Biological dataset
The dataset used for this work comes from a studyconducted in the Azorean archipelago (North Atlan-tic 37ndash40
deg
N 25ndash31
deg
W) which comprises nine mainislands and some small islets Aligned on a WNWndashESEaxis these islands extend for about 615 km acrossthe Mid-Atlantic Ridge which separates the westerngroup (Flores and Corvo) from the central (Faial PicoSatildeo Jorge Terceira and Graciosa) and the eastern(Satildeo Miguel and Santa Maria) groups All islandsare of relatively recent volcanic origin ranging from250 000 years
(Pico) to 8middot12 Ma
(Santa Maria)(Nunes 1999) The climate is temperate oceanic withhigh relative atmospheric humidity (reaching 95 inhigh altitude native semitropical evergreen laurelforest) as well as limited temperature fluctuationsthroughout the year The predominant native vegeta-tion is lsquoLaurisilvarsquo a humid evergreen broadleaf andmicrophyllous (hereafter short-leaf) laurel type forest
Dominant trees and shrubs include short-leaf
Juni-perus brevifolia
and
Erica azorica
(both endemics) andthe broadleaf species
Ilex perado
ssp
azorica
(endemic)
Laurus azorica
(native) and the shrub
Vaccinium cylin-draceum
(endemic) (Silva
et al
2005)On seven of the Azorean islands (excluding the smaller
and more disturbed Graciosa and Corvo) native vege-tation was surveyed within Natural Forest Reservesandor NATURA 2000 protected areas using stand-ardized sampling protocols (see Borges
et al
2005a2006) During the summers of 1999ndash2003 150 m
times
5 mtransects were randomly placed in each fragment ofnative protected forest Simulating a speciesndasharea rela-tionship of 0middot35 slope (a 10
times
increase in area implies theduplication in the number of species) transects wereset up using a logarithmic scale placing two transectsin 10 ha fragments four transects in 100 ha fragmentsand eight transects in 1000 ha fragments Thereforelarger reserves received higher sampling effort (Borges
et al
unpublished data) For the present study only fiveislands were covered those with at least two nativeprotected areas (see Table 1) and a total of 78 transectslocated within 17 forest remnants were selected
Along each transect 30 pitfall traps were set in theground at 5-m intervals for at least a 2-week period (seealso Borges
et al
2005a) Fifteen traps were half-filledwith a nonattractive solution with a small proportionof ethylene glycol and the other half with a generalattractive solution (Turquin) made of dark beer andsome preservatives (see Turquin 1973) Traps wereplaced alternately along each transect With such aprocedure it was expected not only to survey the rela-tive abundance (although biased by their mobility)of each species sampled (with nonattractive traps) butalso to capture the maximum number of species (withattractive traps)
Table 1 List of the studied 11 natural forest reserves one geological reserve () and five additional areas (dagger) with their name codeisland (PIC = Pico FLO = Flores SJG = Satildeo Jorge SMG = Satildeo Miguel TER = Terceira) number of available transects areaand altitude (minimum and maximum) When nature reserves correspond to different habitats area and altitude are given just fortheir laurisilva forest remnants
Name Code Island TransectsArea (ha)
Altitude (m)
1 Morro Alto e Pico da Seacute FLO-MA FLO 8 1558 300ndash9152 Caldeiras Funda e Rasa FLO-FR FLO 4 459 350ndash6003 Misteacuterio da Prainha PIC-MP PIC 8 643 425ndash8414 Lagoa do Caiado PIC-LC PIC 4 131 800ndash9395 Caveiro PIC-C PIC 4 199 850ndash9506 Pico Pinheirodagger SJG-P SJG 2 175 600ndash7807 Pico Frades ndash Topodagger SJG-T SJG 2 50 600ndash9428 Pico do Galhardodagger TER-GH TER 4 66 550ndash7009 Caldeira do Guilherme Monizdagger TER-GM TER 4 408 455ndash47010 Terra Bravadagger TER-TB TER 8 143 600ndash75011 Serra de Sta Barbara e M Negros TER-SB TER 12 1274 550ndash102512 Biscoito da Ferraria TER-BF TER 6 391 475ndash80813 Algar do Carvatildeo TER-AC TER 2 28 62914 Mateladagger TER-M TER 2 25 350ndash39315 Graminhais SMG-G SMG 2 27 850ndash92516 Atalhada SMG-A SMG 2 15 425ndash53017 Pico da Vara SMG-PV SMG 4 245 400ndash1103
277
Effect of grain size on species richness estimators
copy 2006 The AuthorsJournal compilation copy 2006 British Ecological Society
Journal of Animal Ecology
75
274ndash287
All Araneae Opiliones Pseudoscorpiones andinsects (excluding Collembola Diplura Diptera andHymenoptera) were first sorted into morphospecies bystudents under supervision of a trained taxonomist(PB) (see Oliver amp Beattie 1993 1996) Later the mor-phospecies were identified by one of us (PB) usingvoucher specimens already available
in situ
and allunknowns were sent to several taxonomists for speciesidentification (see Acknowledgements)
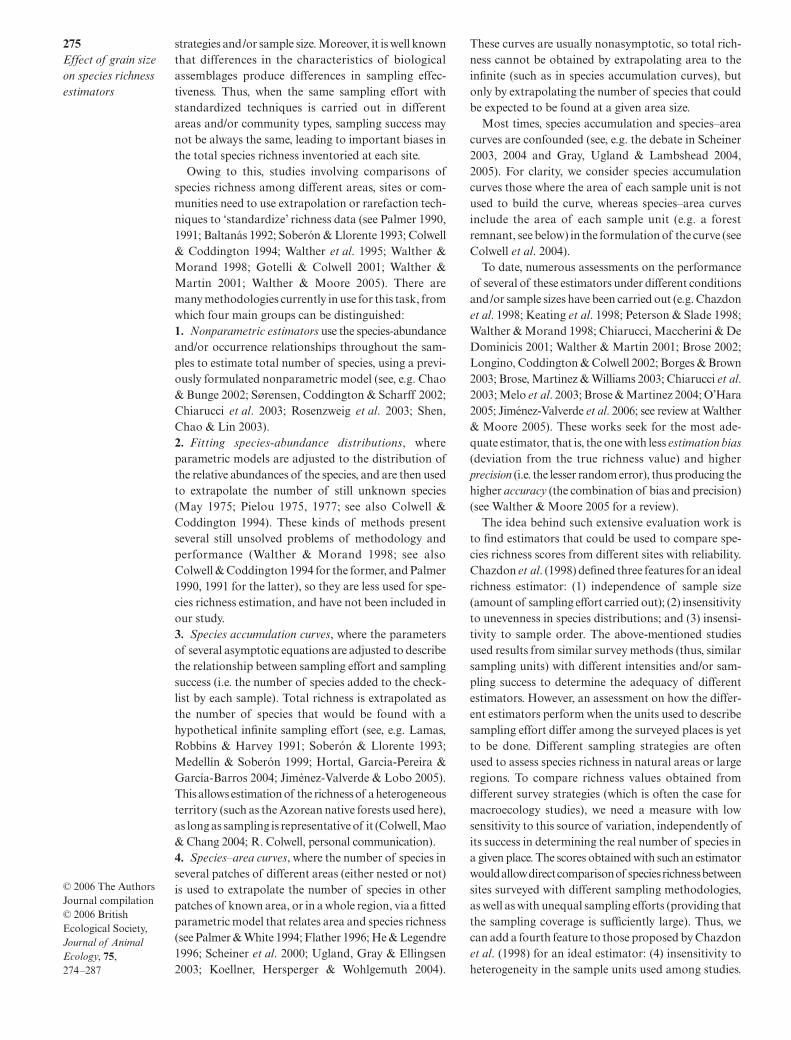
At the end of this survey a total of 22 815 individualspertaining to 205 epigean arthropod species (or mor-phospecies) were captured As there is no completechecklist available for the studied fauna we provide acomparison with an expert lsquoguesstimatersquo of the totalnumber of species According to his expertise in suchfauna one of us (PB) has arbitrarily extrapolatedthe total number of epigean species for each one of themain arthropod groups present in the natural forests ofthe five studied islands The recent checklist of theAzorean arthropods (Borges
et al
2005b) developedfrom an exhaustive survey of relevant literature andcollections was taken as a starting point To get alsquoguesstimatersquo for each group current numbers in such achecklist were taken into account but also the degreeof knowledge of each group at the Azores and PBrsquosexpertise Only native forest fauna was considered notcounting introduced species andor pasture dwellingspecies (see also Borges 1999) According to PBrsquosknowledge 306 species could be an approximate figurefor the total number of species present in such forests(see Table 2) Such a guesstimate should not be takenas the true number of arthropod epigean species inAzorean Laurisilva but only as a milestone to identifyabnormally biased richness estimations
Data grouping
To study how variations in grain size affect species rich-ness estimations we have grouped data into samplesusing seven different strategies
1
Islands
grouping all individuals captured in eachisland as a single sample (
n
= 5)
2
Natural areas
using all data from each forest remnantas a sample (
n
= 17)
3
Transects
comprising all the individuals capturedin each transect (
n
= 78)
4
Pairs of traps
(herein lsquo2Trapsrsquo) combining the dataof each pair of Turquin and ethylene pitfalls into asingle measure (eg traps 1 and 2 traps 3 and 4 hellip ofa given transect) assuming that they constitute anheterogeneous though complementary sample unit com-prising two different capture methods (see Discussionon heterogeneous sampling units at Jimeacutenez-Valverdeamp Lobo 2005) (
n
= 1116)
5
Traps
using each pitfall trap separately (
n
= 2232)
6
Database records
(herein lsquoRecordsrsquo) where all theindividuals of the same species present in a single trapgive rise to a single sample (eg if a trap contains twoindividuals of the same species a single sample is usedwith an abundance value of 2 if on the contrary thesetwo individuals pertain to two different species twodifferent samples occur each one with an abundancevalue of 1 see examples in Hortal Lobo amp Martiacuten-Piera2001 Lobo amp Martiacuten-Piera 2002 and Martiacuten-Piera ampLobo 2003) (
n
= 8666)
7
Individuals
where each individual captured producesa sample (
n
= 22815)Here it is important to point out that both Recordsand Individuals provide only incidence measures(although species abundance is directly included inIndividuals and indirectly in Records) Thus the per-formance of abundance-based estimators (see below)could be less reliable for these two grains
Species richness estimators
We compared the performance of 15 different speciesrichness estimators (see abbreviations and descriptionsin Table 3)
For Clench Negative Exponential and Weibullestimators species richness is calculated as the asymp-tote value of a function fitted to the smoothed speciesaccumulation curve provided by
S 7middot0 (100randomizations Colwell 2004) This ideal curve rep-resents an unbiased description of the sampling processwhere possible effects due to the order by which thesamples have been taken or listed are removed by ran-domizing their order of entrance in the curve We used
to fit each function to the data (see functionequations in Soberoacuten amp Llorente 1993 for Clench andNegative Exponential and Flather 1996 for Weibull)and then calculated the asymptote value from theso-obtained parameters (see a description of the pro-cess in Jimeacutenez-Valverde amp Hortal 2003 or Hortal
et al
2004) MichaelisndashMenten is a nonparametric formula-tion of the Clench one and is calculated in
asthe mean score after 100 randomizations (Colwell 2004)As it presents slight differences from the scores obtainedwith Clench we have included it in our analyses
Table 2 Guesstimate (expert extrapolation) of total speciesrichness of the epigean arthropod fauna of natural forestremnants in the five Azorean islands studied (Satildeo MiguelTerceira Pico Flores and Satildeo Jorge) Sobs is the number ofepigean species recorded during the survey
Group Sobs Estimate
Coleoptera 82 126Araneae 50 70Blattaria 1 1Chilopoda 6 7Dermaptera 2 3Diplopoda 12 20Hemiptera 45 70Opiliones 2 2Pseudoscorpiones 3 4Thysanura 2 3Total 205 306
278
J Hortal P A V Borges amp C Gaspar
copy 2006 The AuthorsJournal compilation copy 2006 British Ecological Society
Journal of Animal Ecology
75
274ndash287
Together with the former we evaluated another 10nonparametric estimators Seven are the lsquoclassicalrsquo esti-mators provided by the
S software ACE ICEChao1 Chao2 Jackknife1 Jackknife2 Bootstrap (seeTable 3 for references) and have been widely used andstudied (eg Chazdon
et al
1998 Brose
et al
2003Chiarucci
et al
2003) They are available in several pro-grams (eg
S
ndash Chao amp Shen 2003ndash05or
ndash Henderson amp Seaby2002) Here it is important to check for the estimatorformulas used by each program while several estima-tors have been updated these changes are not alwaysavailable (eg Chao1 bias-corrected formula is used bycurrent versions of
S and
but not by
) The other three (F3 F5and F6) are available in
2
software (Turner Leitneramp Rosenzweig 2000) but their adequacy has not yetbeen formally tested against other estimators exceptfor the paper where they were proposed (Rosenzweig
et al
2003) This is also the case for the only speciesndash
area-based estimator we test (Ugland) for which theonly application available is its primary source (Ugland
et al
2003)
Comparison among estimators performance
We estimated the total species richness scores for thefive studied islands using the 15 estimators and theseven different grain sizes (Table 4) The eight estima-tors included in the
S package (as well as thethree asymptotic ones see Table 3) were applied to allgrains being computing times negligible (on a PentiumCentrino 1middot7 GHz with 1middot25 GB RAM) except forRecords and Individuals (note that high computationtimes are due to the randomization process which isnot necessary to obtain the results of nonparametricestimators if a single estimate is needed R Colwellpersonal communication) Computing times for
2
were higher reaching 10 min in the case of 2Traps 15 minfor Traps and 140 min for Records being impossible to
Table 3 Characteristics of the species richness estimators used for this analysis
Abbrev Estimator Type Data Program Reference
Clench Estimation of MichaelisndashMenten function asymptote
As In SSTAT Clench (1979) in Soberoacuten amp Llorente (1993)
Exp Neg Estimation of Negative Exponential function asymptote
As In SSTAT Miller amp Wiegert (1989) in Soberoacuten amp Llorente (1993)
Weibull Estimation of Weibull function asymptote
As In SSTAT Brown amp Mayer (1988) in Flather (1996)
MM Nonparametric MichaelisndashMenten richness estimator
AsNP In S Raaijmakers (1987) in Colwell (2004)
ACE Abundance-based Coverage Estimator of species richness
NP Ab S Chao amp Lee (1992) Chao et al (2000) Chazdon et al (1998) in Colwell (2004)
ICE Incidence-based Coverage Estimator of species richness
NP In S Lee amp Chao (1994) Chao et al (2000) Chazdon et al (1998) in Colwell (2004)
Chao1 Abundance-based estimator of species richness
NP Ab S Chao (1984) in Colwell (2004)
Chao2 Incidence-based estimator of species richness
NP In S Chao (1984 1987) Colwell (2004)
Jackknife1 First-order Jackknife richness estimator
NP In S Burnham amp Overton (1978 1979) Heltshe amp Forrester (1983) in Colwell (2004)
Jackknife2 Second-order Jackknife richness estimator
NP In S Smith amp van Belle (1984) in Colwell (2004)
Bootstrap Bootstrap richness estimator NP In S Smith amp van Belle (1984) in Colwell (2004)
F3 Extrapolation nonparametric estimator 3
NP Ab 2 Rosenzweig et al (2003)
F5 Extrapolation nonparametric estimator 5
NP Ab 2 Rosenzweig et al (2003)
F6 Extrapolation nonparametric estimator 6
NP Ab 2 Rosenzweig et al (2003)
Ugland Sample based speciesndasharea curve SA Ab Ugland Ugland et al (2003)
Abbrev is the abbreviation used throughout this work Type refers to the kind of method used to estimate species richness As asymptote value of a fitted species accumulation curve NP estimation using a nonparametric model SA speciesndasharea curve see text for further details Data refer to the kind of data required for the estimation In incidence of the species in each sample Ab abundance of the species in each sample Program refers to the software used for computing (S 7middot0 ndash Colwell 2004 available at httppurloclcorgestimates STAT ndash any common statistical program in this case StatSoft 2001 2 3middot2 (beta) ndash Turner et al 2000 available at httpeebwebarizonaedudiversity Ugland ndash Ugland et al 2003 Excelreg spreadsheet available at httpfolkuionojohnsgmainhtm) See text for further explanations
279Effect of grain size on species richness estimators
copy 2006 The AuthorsJournal compilation copy 2006 British Ecological Society Journal of Animal Ecology 75 274ndash287
compute the matrix of Individuals For the speciesndasharea curve estimator (Ugland) the samples needed tobe partitioned into up to five different groups and dueto Excelreg limitations it was only possible to use up to240 samples Thus we could only apply it to two grainsizes (Natural Areas and Transects) allowing the useof the 17 Natural Areas or the 78 Transects partitionedinto the five groups (islands)
We evaluated the effect of variations in grain size onspecies richness estimation in two ways First weevaluated the sensitivity of the estimators to suchvariations in order to identify those with higher inde-pendence from grain To do this we used precision (iethe variability in the estimates obtained with differentgrains) and secondarily bias (ie the distance betweenthe estimates and the guesstimate of 306 species) (seeWalther amp Moore 2005) The best-performing estim-ators can be regarded as the most suitable to compareareas sampled with different grains Second we usedthe results from the more precise estimators to analysethe suitability of using different grain sizes for com-parable biodiversity studies We characterized the rela-tionships among the estimates obtained with differentgrains to determine which groups of grains presentedsimilar values when the same estimator is used This waywe identified which pairs or groups of grains producecomparable estimations
Five estimators (Ugland F3 F5 F6 and Weibull)performed clearly worse than the other 10 Uglandcould only be applied to two grain sizes showing lowprecision and both estimations seem unrealistic whencompared with the guesstimate (601middot1 species estimatesusing Natural Areas and 440middot9 using Transects seeTable 4) The same occurred with F3 F5 and F6 which
also showed low precision and extremely biased scoresin the greatest grain sizes (see Table 4 and Fig 1)Although the three were more precise and less biased atgrains smaller than Transect (which are at most timesdirectly comparable see Relationships among grainsizes below) their overall performance was worse thanthe other estimators While their ranges in these threeestimates are equal or higher than 30 (36middot71 for F356middot15 for F5 and 29middot44 for F6) almost all the otherestimators presented variations smaller than 5middot5 Theonly lsquoclassicalrsquo estimator with a similar performance isWeibull (with a range of 26middot17 in the estimates for2Traps Traps and Records) which also presents anerratic behaviour While the other estimators show amore or less constant pattern of diminishing estimatedscores as grain diminishes (see Fig 2) Weibull reachesan unrealistic top value when calculated using Indi-viduals (nearly 750 species see Table 4) This pattern isprobably due to the high effectiveness of this functionin adjusting to the smoothed species accumulationcurves (adjusted R2 scores always higher than 99middot99see also Jimeacutenez-Valverde et al 2006) Such lsquooverfit-tingrsquo to the different curves obtained with each grainmakes this estimator extremely dependent on grainsize Owing to their poor performance we haveexcluded these five estimators from the rest of theanalyses
All the other 10 estimators showed limited vari-ability with SDs always less than 60 species (c 20 ofthe guesstimate) (Table 4) In general most of themshowed a decreasing pattern producing higher estima-tions at the greater grains and similar estimated scoresat the four smaller grain sizes (2Traps Traps Recordsand Individuals) (Fig 2) The abundance-basedestimators ACE and Chao1 and to a lesser extentBootstrap showed a high precision with negligibleSDs (0middot23 2middot79 and 4middot80 respectively see Table 4)produced by the little variations due to data aggregation
Table 4 Species richness estimated for seven different grains by the 15 estimators analysed n refers to the number of grains thatcould be used for each estimator note that F3 F5 and F6 could not be used with Individuals and the Ugland estimator could onlybe applied to two grains (see text) SD is the SD of the different results obtained with each estimator Results according toS output (note that slight differences could appear between S and estimates A Chao personalcommunication) NtAr is Natural Areas Ind is Individuals Other abbreviations as in text and Table 3
Estimator n SD Islands NtAr Transects 2Traps Traps Records Ind
Clench 7 45middot82 343middot6 277middot5 248middot7 223middot9 223middot3 223middot7 218middot4Exp Neg 7 18middot59 238middot2 208middot2 197middot0 188middot7 188middot7 188middot8 187middot5Weibull 7 162middot81 244middot6 306middot0 319middot4 433middot4 412middot1 407middot3 744middot9MM 7 57middot69 333middot0 253middot5 212middot7 184middot5 183middot5 183middot1 174middot1ACE 7 0middot23 288middot3 288middot3 288middot3 288middot3 288middot3 289middot0 288middot3ICE 7 31middot99 372middot8 329middot6 299middot1 291middot9 288middot7 288middot7 288middot1Chao1 7 2middot79 298middot1 plusmn 34middot9 301middot8 plusmn 34middot9 301middot8 plusmn 34middot9 301middot8 plusmn 34middot9 301middot8 plusmn 34middot9 307middot2 plusmn 37middot7 304middot2 plusmn 34middot9Chao2 7 32middot35 379middot5 plusmn 48middot3 363middot0 plusmn 49middot3 361middot0 plusmn 53middot1 311middot2 plusmn 37middot7 311middot2 plusmn 37middot7 307middot2 plusmn 37middot7 304middot2 plusmn 34middot9Jackknife1 7 10middot08 293middot8 plusmn 22middot6 287middot8 plusmn 13middot8 282middot0 plusmn 11middot1 270middot9 plusmn 8middot3 271middot0 plusmn 8middot3 271middot0 plusmn 8middot1 268middot0 plusmn 7middot9Jackknife2 7 15middot24 345middot1 345middot6 339middot7 316middot9 316middot9 317middot0 311middot0Bootstrap 7 4middot80 244middot3 240middot6 237middot3 232middot9 232middot9 232middot9 231middot7F3 6 381middot23 1255middot3 631middot2 435middot5 297middot8 295middot1 261middot1F5 6 2053middot94 5514middot3 1776middot8 670middot3 334middot7 331middot6 278middot5F6 6 457middot98 1588middot9 618middot4 512middot3 422middot6 444middot6 415middot2Ugland 2 113middot29 601middot1 440middot9
280J Hortal P A V Borges amp C Gaspar
copy 2006 The AuthorsJournal compilation copy 2006 British Ecological Society Journal of Animal Ecology 75 274ndash287
in samples at each grain First- and second-orderJackknife estimators also showed great precision Tothe contrary incidence-based estimators ICE andChao2 and asymptotic estimators (Clench NegativeExponential and MichaelisndashMenten) showed con-sistently higher scores at greater grain sizes These threeasymptotic estimators as well as Bootstrap were alsonegatively biased performing even worse than theobserved number of species (Negative Exponential andMichaelisndashMenten estimators Fig 2) Again ACEand Chao1 showed the best performance with scoresvery close to the guesstimate throughout the differentgrains ICE Chao2 and the two Jackknife estimatorsperformed quite well in the smaller grains Althoughbeing cautious about our guesstimate all these non-parametric estimators seemed to present higher accu-racy in their estimations thus seeming a better optionthan asymptotic estimators and Bootstrap
The results of all 10 estimators were highly depend-ent on the level of sampling effort (sample coverage)providing lower richness scores when calculated from alower number of samples We calculated the predictionsof these estimators at four levels of sample coverage(30 50 70 and 100 of the samples) For each grainwe calculated the average species richness predictedafter 100 randomizations at each sample coveragelevel (eg the mean predictions for each of the 10 esti-mators at 23 (30) 39 (50) 55 (70) and 78 (100)samples of Transects or at 2600 4333 6066 and 8666samples of Records) Islands grain size was excludeddue to its low number of samples Then we calculatedthe mean and SD for each estimator and level of sample
coverage to account for the bias and precision of theirpredictions (Table 5) Although the abundance-basednonparametric estimators (ACE and Chao1) are moreprecise when we analyse the effect of sample coveragetheir advantage over the rest of the estimators dimin-ishes While their precision decreases at lower samplingintensities the variability of incidence-based and Jack-knife nonparametric estimators diminishes or remainsmore or less constant (see Table 5)
Species richness estimates were highly correlatedamong the smaller grains We compared the results ofthe 10 best-performing estimators (see before) at eachgrain size to determine which ones produced similarestimates (Fig 3) Islands was the most dissimilar grainonly significantly related to Natural Areas (PearsonR = 0middot850) and Transects (Pearson R = 0middot733) Theextremely high correlation (Pearson R = 1middot000) betweenTraps and 2Traps and between Records and Individualsis remarkable Interestingly both pairs of grains werealso highly correlated (Pearson R = 0middot996) Thus itseems equivalent to use any of these four grains at leastin the studied case In addition these were the grainswhere the scores obtained from nonparametric esti-mators were less biased (see Fig 2)
Discussion
Species richness is a central component of biodiversity(Gaston 1996 Gaston amp Blackburn 2000) As the
Fig 1 Variability in the species richness scores calculated by each estimator Square plots represent the mean boxes show the SDand whiskers provide the 95 confidence interval (1middot96SD) The left graph shows 14 of the studied estimators (note that Uglandis excluded) As F3 F5 and F6 could only be applied to six grain sizes (see text) lsquoIndividualsrsquo is excluded from the calculationsof this graph Owing to the high variability in these three estimators the other 11 are represented in the right graph using datafor the seven grain sizes Here the guesstimate (306 species) is represented by a discontinuous line and the observed richness (205species) as dots and lines (see text) Abbreviations as in text and Table 3
281Effect of grain size on species richness estimators
copy 2006 The AuthorsJournal compilation copy 2006 British Ecological Society Journal of Animal Ecology 75 274ndash287
real number of species is unknown after samplingcampaigns estimators are needed to provide a clearerpicture of species richness patterns To date manyestimators are available a number that increases as newapproaches to the analysis of the process of speciesaccumulation with sampling effort are developed (egColwell et al 2004) However the estimation of thetrue number of species in a given place or area seemsto be elusive Unfortunately when a nearly completechecklist is available (in simulations or extremely well-known areas) most times the actual richness figures
are not accurately estimated (eg Brose et al 2003Brose amp Martinez 2004) depending on the data and theestimator used (see Walther amp Morand 1998 Waltheramp Martin 2001) Despite this drawback such estima-tors could be also useful if they provide a good pictureof species richness patterns Hortal et al (2004) foundthat predictive models of the geographical distributionof species richness developed from Clench estimationswere more accurate and representative than the modelsdeveloped from observed scores due to the diminutionin the estimations of the bias due to unequal sampling
Fig 2 Performance of the 10 less variable estimators across grain sizes The discontinuous line shows the guesstimate and theobserved number of species is represented as dots and lines Abbreviations as in text and Tables 3 and 4
282J Hortal P A V Borges amp C Gaspar
copy 2006 The AuthorsJournal compilation copy 2006 British Ecological Society Journal of Animal Ecology 75 274ndash287
effort Here in addition to the accuracy in representingreal species richness score (that is virtually unknownsuch as present data) we stress the importance of theestimates being comparable as a criterion for theadequacy of estimators (see eg Palmer 1990 1991)For an estimator to be useful it should combineaccuracy in representing real species richness with thecapacity to give unbiased estimations of the differencesin species richness among areas andor grain sizes
With regard to estimator performance it is impor-tant to point out the poor results shown for these databy the new estimators proposed by Rosenzweig et al(2003) and Ugland et al (2003) as well as of Weibull(Flather 1996) Therefore and given our results the useof the estimators F3 F5 F6 Weibull and Ugland is cur-rently not advisable until their performance in futurecomparative analyses determine that they could beworth using in a number of cases Once these estimatorswere excluded the rest seem to perform more or lesswell However asymptotic estimators appear less desir-able they consistently underestimate species richnessa pattern well-documented in the literature (see eg
Lamas et al 1991 Soberoacuten amp Llorente 1993 Colwellamp Coddington 1994 Chazdon et al 1998 Gotelli ampColwell 2001 Walther amp Martin 2001 Melo et al2003 Brose amp Martinez 2004 Hortal et al 2004Walther amp Moore 2005 Jimeacutenez-Valverde et al 2006)Although the performance of nonparametric estima-tors has been always questionable (see eg Longinoet al 2002 Chiarucci et al 2003 Jimeacutenez-Valverde ampHortal 2003 OrsquoHara 2005) neither observed speciesrichness nor speciesndasharea curves or asymptotic estima-tors seem to perform better than most of these estimatorsTherefore we believe that they should be used in theabsence of complete inventories despite their drawbacksand potential inaccuracy
The estimations of the abundance-based Chao1and ACE nonparametric estimators were independentfrom the grain used to aggregate the samples This resultwas expected as both estimators are calculated fromthe species frequencies directly obtained from the totalpool of individuals (A Chao and R Colwell personalcommunication) Therefore abundance data remainthe same regardless of the grain size used to aggregatedata (except for Records a measure of incidence) soonly small variations due to data aggregation in samplesappear This property makes both abundance-basedestimators extremely useful to compare data comingfrom different grains as they depend on total speciesabundances they should be quite robust to variationsin grain size if sample coverage is sufficiently large (AChao personal communication) However differencesin the survey methodologies and sampling effort usedat the different sites (ie sampling bias sensu Walther ampMoore 2005) could also affect estimations so to com-pare surveys with different grain size data should becarefully examined to determine if they are comparableIt is also worth mentioning the low bias of both Chao1and ACE estimators in our study although this resultcannot be taken as a general rule (see Walther amp Moore2005) On the contrary although Bootstrap estimatesare also highly precise its clear underestimations ofspecies richness (also reported by Chiarucci et al 2003)prevent us from using it
Table 5 Mean and SD of the estimates of species richness at different sample coverage (30 50 70 and 100 of the samplesIslands was excluded from this analysis due to its low number of samples) for the 10 less variable estimators
samples
Mean species richness estimation SD
30 50 70 100 30 50 70 100
Clench 171middot80 200middot05 217middot12 235middot92 19middot99 21middot03 21middot47 23middot02Exp Neg 132middot50 158middot44 173middot96 193middot15 4middot66 5middot74 6middot46 8middot15MM 147middot16 168middot34 181middot50 198middot58 26middot89 28middot49 28middot82 29middot92ACE 184middot63 229middot71 255middot64 288middot44 14middot23 11middot44 8middot86 0middot25ICE 202middot18 243middot42 267middot79 297middot67 13middot55 12middot96 12middot83 16middot18Chao1 191middot77 230middot75 258middot34 303middot11 20middot13 13middot01 11middot27 2middot24Chao2 209middot27 243middot49 271middot47 326middot33 6middot13 3middot77 4middot85 27middot78Jackknife1 181middot27 219middot30 242middot98 275middot12 5middot24 2middot05 3middot79 7middot89Jackknife2 209middot99 247middot97 281middot97 324middot52 6middot77 6middot87 6middot17 14middot37Bootstrap 154middot37 187middot54 208middot08 234middot70 6middot97 1middot98 0middot64 3middot46
Fig 3 Relationships between grain sizes Cluster analysiswas developed using Unweighted Pair-Group Average aslinkage rule (see eg Sokal amp Rohlf 1995) and Spearmancorrelations (Table 6) as similarity measure Abbreviations asin text and Table 4
283Effect of grain size on species richness estimators
copy 2006 The AuthorsJournal compilation copy 2006 British Ecological Society Journal of Animal Ecology 75 274ndash287
Having said this it is important to take into accountother effects to determine if these two abundance-basedestimators are preferable Given that other estimatorshave been identified as being more accurate in previousanalyses they could be a better alternative if the data tobe compared have small variations in sample grainsizes Interestingly when the effect of sample coverageis studied the precision of abundance-based estimatorsACE and Chao1 diminishes at lower sampling intensi-ties whereas it remains constant or even increases forincidence-based and Jackknife nonparametric estima-tors (see Table 5) A higher precision of incidence-based estimators at low sampling intensities has beenpreviously reported (eg Chazdon et al 1998) so theyappear to be the best option when sampling effort hasbeen scarce In our study Jackknife and incidence-based estimators showed an erratic behaviour in thegreater grain sizes However when grain is maintainedconstant these four estimators (ICE Chao2 Jackknife1and Jackknife2) have been reported to be more accurateand less sensitive to other drawbacks such as samplecoverage patchiness of species distributions variabilityin the probability of capture and many others (seePalmer 1990 1991 Baltanaacutes 1992 Palmer amp White1994 Chazdon et al 1998 Chiarucci et al 2001Brose et al 2003 Brose amp Martinez 2004) Therefore abalance between sample grain (see below) and samplecoverage is needed to make the best choice of anestimator for specific datasets
With regard to the most-adequate grain size foraggregating samples it seems that any of the smallgrains (2Traps Traps Records and Individuals) hereconsidered could give an appropriate picture of thecommunity All these grains refer to data captured in asingle point or a reduced area Their high similaritycould be due either to the effectiveness of such pointdata to describe the studied fauna or to the fact thatthe arthropod community of a limited area is sampledequally by all of them Gotelli amp Colwell (2001) discussthe differences between using individuals or samples asa measurement of sampling intensity Given ourresults estimations made using individuals did not dif-fer so much from those obtained using small samplessuch as traps On the other hand greater grains includ-ing Transect seem not to be adequate to obtain un-biased species richness estimations that could be comparedamong different places andor grains As a conclusiondata referred to a point or a small area (a plot) seem tobe the most adequate to estimate species richness Wethus recommend that authors should record and makeavailable the abundance data for traps or similar unitsin biological databases and published papers Notcompiling the information available from biodiversitystudies in an extensive way but just for transects orlocal studies may result in the loss of useful informa-tion on biodiversity patterns
The performance of Records is particularly remark-able this is a measure that although seeming lessinformative performs as well as Individuals and Traps
Records is just an incidence measure that is a sampleof each time a species is recorded in a different placeday trap or by a different collector regardless of thenumber of individuals found In spite of this their per-formance in our study has been also good when usingabundance-based estimators (see above) Other studieshave demonstrated the utility of this measure to char-acterize sampling effort (Hortal et al 2001 Lobo ampMartiacuten-Piera 2002 Martiacuten-Piera amp Lobo 2003) andrecent works demonstrate its accuracy to describe theprocess of species accumulation from heterogeneousdata (JM Lobo unpublished results Romo Benito ampGarciacutea-Barros 2005) Thus we encourage the use of thismeasure to analyse data coming from heterogeneoussources such as studies made with different methodol-ogies or museum and collection data a still underes-timated but valuable reservoir of biodiversity data(see Petersen amp Meier 2003 Petersen Meier amp Larsen2003 Graham et al 2004 Suarez amp Tsutsui 2004)
Many times the information available for biodiver-sity meta-analyses comes from heterogeneous sourcesand different sampling methodologies and thus fromdifferent grains Given the here-presented grain-associatedperformance as well as the recommendations made byChazdon et al (1998) Brose et al (2003) and Brose ampMartinez (2004) among others we propose a decisionframework to determine which estimator should beused in each case (see Table 6) When all data pertain tocomparable grains (or small grains which we have seento provide similar estimates) ICE any of the two Jack-knives or Chao2 should be preferred The relativeperformance of these estimators is still under discussionas the results obtained to date are heterogeneous Forexample whereas Chazdon et al (1998) found a betterperformance of ICE and Chao2 at low sample cover-ages Brose et al (2003) found that the behaviour of thelatter is erratic and dependent on sample coverage andthat Jackknife estimators were the most accurate indetermining species richness We thus recommendfollowing the recommendations given in Chazdon et al(1998) as well as the decision paths provided by Broseet al (2003) and Brose amp Martinez (2004) to decidewhich estimator should be used when grains are similar
Table 6 Choice of the best species richnessrsquo estimator forbiodiversity meta-analyses depending on data characteristics(abundance or incidence) and studied grain sizes (lsquoComparablersquomeans similar grain sizes and lsquosmall grainsrsquo refer to data aboutTraps small groups of Traps Records or Individuals) Notethat the estimators recommended for abundance data whenusing lsquoComparable andor small grainsrsquo are of incidencetype
Abundance data
Incidence data
Comparable andor small grains
ICE Jackknife1 Jackknife2 Chao2
ICE Jackknife1 Jackknife2 Chao2
Noncomparable andor great grains
ACE or Chao1 Jackknife1 or Jackknife2
284J Hortal P A V Borges amp C Gaspar
copy 2006 The AuthorsJournal compilation copy 2006 British Ecological Society Journal of Animal Ecology 75 274ndash287
or comparable However when grains are heterogene-ous and specially when analysing data from largegrain sizes such as islands regions or forest remnantsall these estimators lose accuracy thus producing agrain-related effect in the estimated richness scoresBeing data on abundance available the precision ofACE andor Chao1 in our study make them the bestchoice However both estimators give a lower boundto species richness (OrsquoHara 2005) producing onlyconservative estimates Moreover abundance data arenot usually available as checklists from different landpatches andor regions are the only information avail-able (see eg the butterfly data of Ricketts et al 1999used by Rosenzweig et al 2003) In those cases whereincidence estimators are needed we recommend the useof any of the Jackknife estimators as both seem to beless affected by grain size than ICE and Chao1 Herethe decision framework provided by Brose et al (2003)and Brose amp Martinez (2004) could help to decidewhich Jackknife estimator best suits the available data
Concluding remarks
Chao1 and ACE estimators are highly precise withrespect to grain variations Abundance data will allowthe direct comparison of species richness scores esti-mated from different grains using these two estimatorsHowever they present several drawbacks so we pro-vide a framework to decide which estimator should bepreferred in each case within the six that performedbest in our study (ACE ICE Chao1 Chao2 Jackknife1and Jackknife2) Although it is desirable to obtain ageneral agreement on using a single measure to estimatespecies richness (to allow the comparison of differentworks) their performance varies between data and cases(see Walther amp Moore 2005) Thus we also recommendproviding the results of these six measures as a commonaddition to the results of biodiversity studies
With regard to the selection of grain size the smallergrains (from Pairs of Traps to Individuals which usu-ally may correspond to the real sample units applied inthe field) seem to produce the most precise and un-biased estimations Therefore we recommend use of thesegrains for biodiversity estimations It is also importantto remark on the good performance of Records(Martiacuten-Piera amp Lobo 2003) a measure that could beapplied to most of the primary biodiversity data withno information on sampling effort associated currentlystored in old collections and classic literature
Acknowledgements
The authors wish to thank Alberto Jimeacutenez ValverdeJorge M Lobo Pedro Cardoso Bruno A WaltherRobert Colwell Anne Chao and one anonymousreferee for their suggestions discussions and criticalreview and to Rafael Zardoya (Museo Nacional deCiencias Naturales) for his kind help to use a Mac com-puter for computing the Individuals curve We are also
indebted to all the taxonomists who helped identify themorphospecies H Enghoff F Ilharco V ManhertJ Ribes ARM Serrano and J Wunderlich and toJ Amaral A Arraiol E Barcelos P Cardoso PGonccedilalves S Jarroca C Melo F Pereira H Mas iGisbert A Rodrigues L Vieira and A Vitorino fortheir contribution to field andor laboratory workFunding for field data collecting was provided bylsquoDirecccedilatildeo Regional dos Recursos Florestaisrsquo (lsquoSecre-taria Regional da Agricultura e Pescasrsquo) through theProject lsquoReservas Florestais dos Accedilores Cartografia eInventariaccedilatildeo dos Artroacutepodes Endeacutemicos dos Accediloresrsquo(PROJ 1701-080203) This work was also supportedby Project ATLANTICO financed by European Com-munity program INTERREG III B JH was supportedby a Portuguese FCT (Fundaccedilatildeo para a Ciecircncia eTecnologia) grant (BPD208092004) and also by theFundacioacuten BBVA project lsquoYaacutemana ndash Disentildeo de unared de reservas para la proteccioacuten de la biodiversidaden Ameacuterica del Sur Austral utilizando modelos pre-dictivos de distribucioacuten con taxones hiperdiversosrsquothe Spanish MEC project CGL2004-0439BOS and theFCT Center CITAA CG was supported by a FCTgrant (BD110492002)
References
Baltanaacutes A (1992) On the use of some methods for theestimation of species richness Oikos 65 484ndash492
Borges PAV (1999) A list of arthropod species of sown andsemi-natural pastures of three Azorean islands (S MariaTerceira and Pico) with some conservation remarksAccediloreana 9 13ndash34
Borges PAV amp Brown VK (2003) Estimating speciesrichness of arthropods in Azorean pastures the adequacyof suction sampling and pitfall trapping Graellsia 59 7ndash24
Borges PAV Aguiar C Amaral J Amorim IR AndreacuteG Arraiol A Baz A Dinis F Enghoff H Gaspar CIlharco F Mahnert V Melo C Pereira F Quartau JARibeiro S Ribes J Serrano ARM Sousa AB StrassenRZ Vieira L Vieira V Vitorino A amp Wunderlich J(2005a) Ranking protected areas in the Azores using stand-ardized sampling of soil epigean arthropods Biodiversityand Conservation 14 2029ndash2060
Borges PAV Vieira V Dinis F Jarroca S Aguiar CAmaral J Aarvik L Ashmole P Ashmole MAmorim IR Andreacute G Argente MC Arraiol ACabrera A Diaz S Enghoff H Gaspar C GisbertHM Gonccedilalves P Lopes DH Melo C MendonccedilaEP Mota JA Oliveira O Oromiacute P Pereira F PomboDT Quartau JA Ribeiro SP Rodrigues AC SantosAMC Serrano ARM Simotildees AMA Soares AOSousa AB Vieira L Vitorino A amp Wunderlich J(2005b) List of the arthropods (Arthropoda) A List of theTerrestrial Fauna (Mollusca and Arthropoda) and Flora(Bryophyta Pteridophyta and Spermatophyta) from theAzores (eds PAV Borges R Cunha R Gabriel AF Mar-tins L Silva amp V Vieira) pp 163ndash221 Direcccedilatildeo Regionalde Ambiente and Universidade dos Accedilores Horta Angrado Heroiacutesmo and Ponta Delgada
Borges PAV Lobo JM Azevedo EB Gaspar C MeloC amp Nunes VL (2006) Invasibility and species richness ofisland endemic arthropods a general model of endemic vsexotic species Journal of Biogeography 33 169ndash187
285Effect of grain size on species richness estimators
copy 2006 The AuthorsJournal compilation copy 2006 British Ecological Society Journal of Animal Ecology 75 274ndash287
Brose U (2002) Estimating species richness of pitfall catchesby non-parametric estimators Pedobiologia 46 101ndash107
Brose U amp Martinez ND (2004) Estimating the richness ofspecies with variable mobility Oikos 105 292ndash300
Brose U Martinez ND amp Williams RJ (2003) Estimatingspecies richness sensitivity to sample coverage and insen-sitivity to spatial patterns Ecology 84 2364ndash2377
Brown JH Ernest SKM Parody JM amp Haskell JP(2001) Regulation of diversity maintenance of speciesrichness in changing environments Oecologia 126 321ndash332
Brown RF amp Mayer DG (1988) Representing cumulativegermination 2 The use of the Weibull function and otherempirically derived curves Annals of Botany 61 127ndash138
Burnham KP amp Overton WS (1979) Robust estimationof population size when capture probabilities vary amonganimals Ecology 60 927ndash236
Chao A (1984) Non-parametric estimation of the number ofclasses in a population Scandinavian Journal of Statistics11 265ndash270
Chao A (1987) Estimating the population size for capture-recapture data with unequal catchability Biometrics 43783ndash791
Chao A amp Bunge J (2002) Estimating the number of speciesin a stochastic abundance model Biometrics 58 531ndash539
Chao A amp Lee S-M (1992) Estimating the number ofclasses via sample coverage Journal of the AmericanStatistical Association 87 210ndash217
Chao A amp Shen T-J (2003ndash05) Program SPADE (SpeciesPrediction and Diversity Estimation) Program and UserrsquosGuide published at httpchaostatnthuedutw
Chao A Hwang W-H Chen Y-C amp Kuo C-Y (2000)Estimating the number of shared species in two communitiesStatistica Sinica 10 227ndash246
Chazdon RL Colwell RK Denslow JS amp GuariguataMR (1998) Statistical methods for estimating species rich-ness of woody regeneration in primary and secondary rainforests of NE Costa Rica Forest Biodiversity ResearchMonitoring and Modeling Conceptual Background and OldWorld Case Studies (eds F Dallmeier amp JA Comiskey)pp 285ndash309 Parthenon Publishing Paris
Chiarucci A Enright NJ Perry GLW Miller BP ampLamont BB (2003) Performance of nonparametricspecies richness estimators in a high diversity plant com-munity Diversity and Distributions 9 283ndash295
Chiarucci A Maccherini S amp De Dominicis V (2001)Evaluation and monitoring of the flora in a nature reserveby estimation methods Biological Conservation 101 305ndash314
Clench H (1979) How to make regional fists of butterfliessome thoughts Journal of the Lepidopteristsrsquo Society 33216ndash231
Colwell RK (2004) Estimates Statistical Estimation ofSpecies Richness and Shared Species from Samples Version7 Userrsquos Guide and application published at httppurloclcorgestimates Department of Ecology amp Evolu-tionary Biology University of Connecticut Storrs CT
Colwell RK amp Coddington JA (1994) Estimating ter-restrial biodiversity through extrapolation PhilosophicalTransactions of the Royal Society of London B 345 101ndash118
Colwell RK Mao CX amp Chang J (2004) Interpolatingextrapolating and comparing incidence-based speciesaccumulation curves Ecology 85 2717ndash2727
Conroy M amp Noon BR (1996) Mapping of species richnessfor conservation of biological diversity conceptual andmethodological issues Ecological Applications 6 763ndash773
Currie DJ (1991) Energy and large-scale patterns of animal-and plant-species richness The American Naturalist 13727ndash49
Flather CH (1996) Fitting species-accumulation functionsand assessing regional land use impacts on avian diversityJournal of Biogeography 23 155ndash168
Gaston KJ (1996) Species richness measure and measure-ment Biodiversity A Biology of Numbers and Difference(ed KJ Gaston) pp 77ndash113 Blackwell Science Oxford
Gaston KJ (2000) Global patterns in biodiversity Nature405 220ndash227
Gaston KJ amp Blackburn TM (2000) Pattern and Process inMacroecology Blackwell Science Oxford
Gotelli NJ amp Colwell RK (2001) Quantifying biodiversityprocedures and pitfalls in the measurement and comparisonof species richness Ecology Letters 4 379ndash391
Graham CH Ferrier S Huettman F Moritz C ampPeterson AT (2004) New developments in museum-basedinformatics and applications in biodiversity analysisTrends in Ecology and Evolution 19 497ndash503
Gray JS Ugland KI amp Lambshead J (2004) On speciesaccumulation and speciesndasharea curves Global Ecology andBiogeography 13 567ndash568
Gray JS Ugland KI amp Lambshead J (2005) Speciesaccumulation curves analysed by a class if null modelsdiscovered by Arrhenius Oikos 108 263ndash274
He F amp Legendre P (1996) On speciesndasharea relations TheAmerican Naturalist 148 719ndash737
Heltshe J amp Forrester NE (1983) Estimating species rich-ness using the jackknife procedure Biometrics 39 1ndash11
Henderson PA amp Seaby RMH (2002) Species Diversityand Richness V3middot0 Pisces Conservation Ltd LymingtonHants
Hortal J Lobo JM amp Martiacuten-Piera F (2001) Forecastinginsect species richness scores in poorly surveyed territoriesthe case of the Portuguese dung beetles (Col Scarabaeinae)Biodiversity and Conservation 10 1343ndash1367
Hortal J Garcia-Pereira P amp Garciacutea-Barros E (2004)Butterfly species richness in mainland Portugal predictivemodels of geographic distribution patterns Ecography 2768ndash82
van Jaarsveld AS Freitag S Chown SL Muller CKoch S Hull H Bellamy C Kruumlger M Endroumldy-Younga S Mansell MW amp Scholtz CH (1998)Biodiversity assessment and conservation strategies Science279 2106ndash2108
Jimeacutenez-Valverde A amp Hortal J (2003) Las curvas de acu-mulacioacuten de especies y la necesidad de evaluar la calidad delos inventarios bioloacutegicos Revista Ibeacuterica de Aracnologiacutea8 151ndash161
Jimeacutenez-Valverde A amp Lobo JM (2005) Determining acombined sampling procedure for a reliable estimation ofAraneidae and Thomisidae assemblages (ArachnidaAranaeae) Journal of Arachnology 33 33ndash42
Jimeacutenez-Valverde A Jimeacutenez Mendoza S Martiacuten Cano Jamp Munguira ML (2006) Comparing relative model fit ofseveral species accumulation functions to local Papilionoideaand Hesperoidea butterfly inventories of Mediterraneanhabitats Biodiversity and Conservation 15 in press
Keating KA Quinn JF Ivie MA amp Ivie L (1998)Estimating the effectiveness of further sampling in speciesinventories Ecological Applications 8 1239ndash1249
Kerr JT (1997) Species richness endemism and the choice ofareas for conservation Conservation Biology 11 1094ndash1100
Koellner T Hersperger AM amp Wohlgemuth T (2004)Rarefaction method for assessing plant species diversity ona regional scale Ecography 27 532ndash544
Lamas G Robbins RK amp Harvey DJ (1991) A preliminarysurvey of the butterfly fauna of Pakitza Parque Nacionaldel Manu Peru with an estimate of its species richnessPublicaciones del Museo de Historia Natural UniversidadNacional Mayor de San Marcos Serie a Zoologiacutea 40 1ndash19
286J Hortal P A V Borges amp C Gaspar
copy 2006 The AuthorsJournal compilation copy 2006 British Ecological Society Journal of Animal Ecology 75 274ndash287
Lee S-M amp Chao A (1994) Estimating population size viasample coverage for closed capture-recapture modelsBiometrics 50 88ndash97
Levins R (1968) Evolution in Changing EnvironmentsPrinceton University Press Princeton NJ
Lobo JM amp Martiacuten-Piera F (2002) Searching for a predic-tive model for species richness of Iberian dung beetle basedon spatial and environmental variables Conservation Biology16 158ndash173
Longino JT Coddington JA amp Colwell RR (2002) Theant fauna of a tropical rain forest estimating species richnessin three different ways Ecology 83 689ndash702
Margules CR Nicholls AO amp Pressey RL (1988) Select-ing networks of reserves to maximise biological diversityBiological Conservation 43 63ndash76
Martiacuten-Piera F amp Lobo JM (2003) Database records as asampling effort surrogate to predict spatial distribution ofinsects in either poorly or unevenly surveyed areas ActaEntomoloacutegica Ibeacuterica e Macaroneacutesica 1 23ndash35
May RM (1975) Patterns of species abundance and diver-sity Ecology and Evolution of Communities (eds ML Codyamp JM Diamond) pp 81ndash120 Harvard University PressHarvard MA
Medelliacuten RA amp Soberoacuten J (1999) Predictions of mammaldiversity on four land masses Conservation Biology 13143ndash149
Melo AS Pereira RAS Santos AJ Shepherd GJMachado G Medeiros HF amp Sawaya RJ (2003) Com-paring species richness among assemblages using sampleunits why not use extrapolation methods to standardizedifferent sample sizes Oikos 101 398ndash410
Miller RI amp Wiegert RG (1989) Documenting completenessspeciesndasharea relations and the species-abundance distribu-tion of a regional flora Ecology 70 16ndash22
Naeem S Haringkanson K Lawton JH Crawley MJ ampThompson LJ (1996) Biodiversity and plant productivityin a model assemblage of plant species Nature 368 734ndash737
Nunes JCC (1999) A Actividade Vulcacircnica na ilha do Pico doPlistoceacutenico Superior ao Holoceacutenico Mecanismo Eruptivo eHazard Vulcacircnico PhD Thesis Universidade dos Accedilores
OrsquoHara RB (2005) Species richness estimators how manyspecies can dance on the head of a pin Journal of AnimalEcology 74 375ndash386
Oliver I amp Beattie AJ (1993) A possible method for therapid assessment of biodiversity Conservation Biology 7562ndash568
Oliver I amp Beattie AJ (1996) Invertebrate morphospecies assurrogates for species a case study Conservation Biology10 99ndash109
Palmer MW (1990) The estimation of species richness byextrapolation Ecology 71 1195ndash1198
Palmer MW (1991) Estimating species richness the second-order Jackknife reconsidered Ecology 72 1512ndash1513
Palmer MW amp White PS (1994) Scale dependence and thespeciesndasharea relationship The American Naturalist 144717ndash740
Petersen FT amp Meier R (2003) Testing species-richness esti-mation methods on single-sample collection data using theDanish Diptera Biodiversity and Conservation 12 667ndash686
Petersen FT Meier R amp Larsen MN (2003) Testing spe-cies richness estimation methods using museum label dataon the Danish Asilidae Biodiversity and Conservation 12687ndash701
Peterson AT amp Slade NA (1998) Extrapolating inventoryresults into biodiversity estimates and the importance ofstopping rules Diversity and Distributions 4 95ndash105
Pielou EC (1975) Ecological Diversity Wiley InterscienceNew York
Pielou EC (1977) The Interpretation of Ecological DataJohn Wiley amp Sons New York
Raaijmakers JGW (1987) Statistical analysis of the Michaelis-Menten equation Biometrics 43 793ndash803
Ricketts TH Dinerstein E Olson DM Loucks CEichbaum W Kavanagh K Hedao P Hurley PCarney KM Abel R amp Walters S (1999) TerrestrialEcoregions of North America a Conservation AssessmentIsland Press Washington DC
Romo Benito H amp Garciacutea-Barros E (2005) Distribucioacuten eintensidad de los estudios fauniacutesticos sobre mariposasdiurnas en la Peniacutensula Ibeacuterica e Islas Baleares (LepidopteraPapilionoidea y Hesperoidea) Graellsia 61 37ndash50
Rosenzweig ML Turner WR Cox JG amp Ricketts TH(2003) Estimating diversity in unsampled habitats of abiogeographical province Conservation Biology 17 864ndash874
Scheiner SM (2003) Six types of speciesndasharea curves GlobalEcology and Biogeography 12 441ndash447
Scheiner SM (2004) A meacutelange of curves ndash further dialogueabout speciesndasharea relationships Global Ecology and Bio-geography 13 479ndash484
Scheiner SM Cox SB Willig MR Mittelbach GGOsenberg C amp Kaspari M (2000) Species richnessspeciesndasharea curves and Simpsonrsquos paradox EvolutionaryEcology Research 2 791ndash802
Shen T-J Chao A amp Lin C-F (2003) Predicting thenumber of new species in further taxonomic samplingEcology 84 798ndash804
Silva L Pinto N Press B Rumsey F Carine MHenderson S amp Sjoumlgren E (2005) Vascular plants(Pteridophyta and Spermatophyta) A List of the TerrestrialFauna (Mollusca and Arthropoda) and Flora (BryophytaPteridophyta and Spermatophyta) from the Azores (edsPAV Borges R Cunha R Gabriel AF Martins L Silvaamp V Vieira) pp 133ndash155 Direcccedilatildeo Regional de Ambienteand Universidade dos Accedilores Horta Angra do Heroiacutesmoand Ponta Delgada
Smith EP amp van Belle G (1984) Nonparametric estimationof species richness Biometrics 40 119ndash129
Soberoacuten J amp Llorente J (1993) The use of species accumulationfunctions for the prediction of species richness ConservationBiology 7 480ndash488
Sokal RR amp Rohlf FJ (1995) Biometry 3rd edn WHFreeman and Company New York
Soslashrensen LL Coddington JA amp Scharff N (2002)Inventorying and estimating subcanopy spider diversityusing semiquantitative sampling methods in an afromon-tane forest Environmental Entomology 31 319ndash330
StatSoft I (2001) STATISTICA (data analysis softwaresystem) StatSoft Inc Tulsa OK
Suarez AV amp Tsutsui ND (2004) The value of museumcollections for research and society Bioscience 54 66ndash74
Tilman D Wedin D amp Knops J (1996) Productivity andsustainability influenced by biodiversity in grasslandecosystems Nature 379 718ndash720
Turner WR Leitner W amp Rosenzweig ML (2000) Ws2mSoftware for the Measurement and Analysis of SpeciesDiversity Version 3middot2 (beta) Userrsquos Guide and applicationpublished at httpeebwebarizonaedudiversity3middot2 (beta)edn Department of Ecology amp Evolutionary BiologyUniversity of Arizona Tucson AZ
Turquin M-J (1973) Une biocenose cavernicole originalepour le Bugey Le puits de Rappe Commptes Rendus 96eCongresse Naturel Socieacutetegraves Savantes Toulouse 1971 Sciences3 pp 235ndash256
Ugland KI Gray JS amp Ellingsen KE (2003) The species-accumulation curve and estimation of species richnessJournal of Animal Ecology 72 888ndash897
Walther BA Cotgreave P Gregory RD Price RD ampClayton DH (1995) Sampling effort and parasite speciesrichness Parasitology Today 11 306ndash310
287Effect of grain size on species richness estimators
copy 2006 The AuthorsJournal compilation copy 2006 British Ecological Society Journal of Animal Ecology 75 274ndash287
Walther BA amp Martin J-L (2001) Species richness estimationof bird communities how to control for sampling effortIbis 143 413ndash419
Walther BA amp Moore JL (2005) The definitions of biasprecision and accuracy and their use in testing the per-formance of species richness estimators with a literaturereview of estimator performance Ecography 28 815ndash829
Walther BA amp Morand S (1998) Comparative performanceof species richness estimation methods Parasitology 116395ndash405
Whittaker RJ Willis KJ amp Field R (2001) Scale andspecies richness towards a general hierarchical theory ofspecies richness Journal of Biogeography 28 453ndash470
Received 13 May 2005 accepted 11 October 2005
275
Effect of grain size on species richness estimators
copy 2006 The AuthorsJournal compilation copy 2006 British Ecological Society
Journal of Animal Ecology
75
274ndash287
strategies andor sample size Moreover it is well knownthat differences in the characteristics of biologicalassemblages produce differences in sampling effec-tiveness Thus when the same sampling effort withstandardized techniques is carried out in differentareas andor community types sampling success maynot be always the same leading to important biases inthe total species richness inventoried at each site
Owing to this studies involving comparisons ofspecies richness among different areas sites or com-munities need to use extrapolation or rarefaction tech-niques to lsquostandardizersquo richness data (see Palmer 19901991 Baltanaacutes 1992 Soberoacuten amp Llorente 1993 Colwellamp Coddington 1994 Walther
et al
1995 Walther ampMorand 1998 Gotelli amp Colwell 2001 Walther ampMartin 2001 Walther amp Moore 2005) There aremany methodologies currently in use for this task fromwhich four main groups can be distinguished
1
Nonparametric estimators
use the species-abundanceandor occurrence relationships throughout the sam-ples to estimate total number of species using a previ-ously formulated nonparametric model (see eg Chaoamp Bunge 2002 Soslashrensen Coddington amp Scharff 2002Chiarucci
et al
2003 Rosenzweig
et al
2003 ShenChao amp Lin 2003)
2
Fitting species-abundance distributions
whereparametric models are adjusted to the distribution ofthe relative abundances of the species and are then usedto extrapolate the number of still unknown species(May 1975 Pielou 1975 1977 see also Colwell ampCoddington 1994) These kinds of methods presentseveral still unsolved problems of methodology andperformance (Walther amp Morand 1998 see alsoColwell amp Coddington 1994 for the former and Palmer1990 1991 for the latter) so they are less used for spe-cies richness estimation and have not been included inour study
3
Species accumulation curves
where the parametersof several asymptotic equations are adjusted to describethe relationship between sampling effort and samplingsuccess (ie the number of species added to the check-list by each sample) Total richness is extrapolated asthe number of species that would be found with ahypothetical infinite sampling effort (see eg LamasRobbins amp Harvey 1991 Soberoacuten amp Llorente 1993Medelliacuten amp Soberoacuten 1999 Hortal Garcia-Pereira ampGarciacutea-Barros 2004 Jimeacutenez-Valverde amp Lobo 2005)This allows estimation of the richness of a heterogeneousterritory (such as the Azorean native forests used here)as long as sampling is representative of it (Colwell Maoamp Chang 2004 R Colwell personal communication)
4
Speciesndasharea curves
where the number of species inseveral patches of different areas (either nested or not)is used to extrapolate the number of species in otherpatches of known area or in a whole region via a fittedparametric model that relates area and species richness(see Palmer amp White 1994 Flather 1996 He amp Legendre1996 Scheiner
et al
2000 Ugland Gray amp Ellingsen2003 Koellner Hersperger amp Wohlgemuth 2004)
These curves are usually nonasymptotic so total rich-ness cannot be obtained by extrapolating area to theinfinite (such as in species accumulation curves) butonly by extrapolating the number of species that couldbe expected to be found at a given area size
Most times species accumulation and speciesndashareacurves are confounded (see eg the debate in Scheiner2003 2004 and Gray Ugland amp Lambshead 20042005) For clarity we consider species accumulationcurves those where the area of each sample unit is notused to build the curve whereas speciesndasharea curvesinclude the area of each sample unit (eg a forestremnant see below) in the formulation of the curve (seeColwell
et al
2004)To date numerous assessments on the performance
of several of these estimators under different conditionsandor sample sizes have been carried out (eg Chazdon
et al
1998 Keating
et al
1998 Peterson amp Slade 1998Walther amp Morand 1998 Chiarucci Maccherini amp DeDominicis 2001 Walther amp Martin 2001 Brose 2002Longino Coddington amp Colwell 2002 Borges amp Brown2003 Brose Martinez amp Williams 2003 Chiarucci
et al
2003 Melo
et al
2003 Brose amp Martinez 2004 OrsquoHara2005 Jimeacutenez-Valverde
et al
2006 see review at Waltheramp Moore 2005) These works seek for the most ade-quate estimator that is the one with less
estimation bias
(deviation from the true richness value) and higher
precision
(ie the lesser random error) thus producing thehigher
accuracy
(the combination of bias and precision)(see Walther amp Moore 2005 for a review)
The idea behind such extensive evaluation work isto find estimators that could be used to compare spe-cies richness scores from different sites with reliabilityChazdon
et al
(1998) defined three features for an idealrichness estimator (1) independence of sample size(amount of sampling effort carried out) (2) insensitivityto unevenness in species distributions and (3) insensi-tivity to sample order The above-mentioned studiesused results from similar survey methods (thus similarsampling units) with different intensities andor sam-pling success to determine the adequacy of differentestimators However an assessment on how the differ-ent estimators perform when the units used to describesampling effort differ among the surveyed places is yetto be done Different sampling strategies are oftenused to assess species richness in natural areas or largeregions To compare richness values obtained fromdifferent survey strategies (which is often the case formacroecology studies) we need a measure with lowsensitivity to this source of variation independently ofits success in determining the real number of species ina given place The scores obtained with such an estimatorwould allow direct comparison of species richness betweensites surveyed with different sampling methodologiesas well as with unequal sampling efforts (providing thatthe sampling coverage is sufficiently large) Thus wecan add a fourth feature to those proposed by Chazdon
et al
(1998) for an ideal estimator (4) insensitivity toheterogeneity in the sample units used among studies
276
J Hortal P A V Borges amp C Gaspar
copy 2006 The AuthorsJournal compilation copy 2006 British Ecological Society
Journal of Animal Ecology
75
274ndash287
Following Whittaker
et al
(2001) recommendationshereafter we will use the term
grain size
(see Levins 1968)to define the sampling effort unit (eg traps transectscells in a geographical grid or landscape patches)
In this work we analyse the effect of variation ingrain size on species richness estimations We evaluatethe accuracy of the predictions obtained with many ofthe estimators presently available when different strat-egies are used to group the same dataset into differentgrains (ie sample units) To do this we have used datafrom standardized surveys of the arthropod epigeancommunity of native forests from the five majorAzorean islands in order to estimate the total numberof arthropod species that occurs in the Archipelago (ex-cluding small islands) using seven different grain sizes
Biological dataset
The dataset used for this work comes from a studyconducted in the Azorean archipelago (North Atlan-tic 37ndash40
deg
N 25ndash31
deg
W) which comprises nine mainislands and some small islets Aligned on a WNWndashESEaxis these islands extend for about 615 km acrossthe Mid-Atlantic Ridge which separates the westerngroup (Flores and Corvo) from the central (Faial PicoSatildeo Jorge Terceira and Graciosa) and the eastern(Satildeo Miguel and Santa Maria) groups All islandsare of relatively recent volcanic origin ranging from250 000 years
(Pico) to 8middot12 Ma
(Santa Maria)(Nunes 1999) The climate is temperate oceanic withhigh relative atmospheric humidity (reaching 95 inhigh altitude native semitropical evergreen laurelforest) as well as limited temperature fluctuationsthroughout the year The predominant native vegeta-tion is lsquoLaurisilvarsquo a humid evergreen broadleaf andmicrophyllous (hereafter short-leaf) laurel type forest
Dominant trees and shrubs include short-leaf
Juni-perus brevifolia
and
Erica azorica
(both endemics) andthe broadleaf species
Ilex perado
ssp
azorica
(endemic)
Laurus azorica
(native) and the shrub
Vaccinium cylin-draceum
(endemic) (Silva
et al
2005)On seven of the Azorean islands (excluding the smaller
and more disturbed Graciosa and Corvo) native vege-tation was surveyed within Natural Forest Reservesandor NATURA 2000 protected areas using stand-ardized sampling protocols (see Borges
et al
2005a2006) During the summers of 1999ndash2003 150 m
times
5 mtransects were randomly placed in each fragment ofnative protected forest Simulating a speciesndasharea rela-tionship of 0middot35 slope (a 10
times
increase in area implies theduplication in the number of species) transects wereset up using a logarithmic scale placing two transectsin 10 ha fragments four transects in 100 ha fragmentsand eight transects in 1000 ha fragments Thereforelarger reserves received higher sampling effort (Borges
et al
unpublished data) For the present study only fiveislands were covered those with at least two nativeprotected areas (see Table 1) and a total of 78 transectslocated within 17 forest remnants were selected
Along each transect 30 pitfall traps were set in theground at 5-m intervals for at least a 2-week period (seealso Borges
et al
2005a) Fifteen traps were half-filledwith a nonattractive solution with a small proportionof ethylene glycol and the other half with a generalattractive solution (Turquin) made of dark beer andsome preservatives (see Turquin 1973) Traps wereplaced alternately along each transect With such aprocedure it was expected not only to survey the rela-tive abundance (although biased by their mobility)of each species sampled (with nonattractive traps) butalso to capture the maximum number of species (withattractive traps)
Table 1 List of the studied 11 natural forest reserves one geological reserve () and five additional areas (dagger) with their name codeisland (PIC = Pico FLO = Flores SJG = Satildeo Jorge SMG = Satildeo Miguel TER = Terceira) number of available transects areaand altitude (minimum and maximum) When nature reserves correspond to different habitats area and altitude are given just fortheir laurisilva forest remnants
Name Code Island TransectsArea (ha)
Altitude (m)
1 Morro Alto e Pico da Seacute FLO-MA FLO 8 1558 300ndash9152 Caldeiras Funda e Rasa FLO-FR FLO 4 459 350ndash6003 Misteacuterio da Prainha PIC-MP PIC 8 643 425ndash8414 Lagoa do Caiado PIC-LC PIC 4 131 800ndash9395 Caveiro PIC-C PIC 4 199 850ndash9506 Pico Pinheirodagger SJG-P SJG 2 175 600ndash7807 Pico Frades ndash Topodagger SJG-T SJG 2 50 600ndash9428 Pico do Galhardodagger TER-GH TER 4 66 550ndash7009 Caldeira do Guilherme Monizdagger TER-GM TER 4 408 455ndash47010 Terra Bravadagger TER-TB TER 8 143 600ndash75011 Serra de Sta Barbara e M Negros TER-SB TER 12 1274 550ndash102512 Biscoito da Ferraria TER-BF TER 6 391 475ndash80813 Algar do Carvatildeo TER-AC TER 2 28 62914 Mateladagger TER-M TER 2 25 350ndash39315 Graminhais SMG-G SMG 2 27 850ndash92516 Atalhada SMG-A SMG 2 15 425ndash53017 Pico da Vara SMG-PV SMG 4 245 400ndash1103
277
Effect of grain size on species richness estimators
copy 2006 The AuthorsJournal compilation copy 2006 British Ecological Society
Journal of Animal Ecology
75
274ndash287
All Araneae Opiliones Pseudoscorpiones andinsects (excluding Collembola Diplura Diptera andHymenoptera) were first sorted into morphospecies bystudents under supervision of a trained taxonomist(PB) (see Oliver amp Beattie 1993 1996) Later the mor-phospecies were identified by one of us (PB) usingvoucher specimens already available
in situ
and allunknowns were sent to several taxonomists for speciesidentification (see Acknowledgements)
At the end of this survey a total of 22 815 individualspertaining to 205 epigean arthropod species (or mor-phospecies) were captured As there is no completechecklist available for the studied fauna we provide acomparison with an expert lsquoguesstimatersquo of the totalnumber of species According to his expertise in suchfauna one of us (PB) has arbitrarily extrapolatedthe total number of epigean species for each one of themain arthropod groups present in the natural forests ofthe five studied islands The recent checklist of theAzorean arthropods (Borges
et al
2005b) developedfrom an exhaustive survey of relevant literature andcollections was taken as a starting point To get alsquoguesstimatersquo for each group current numbers in such achecklist were taken into account but also the degreeof knowledge of each group at the Azores and PBrsquosexpertise Only native forest fauna was considered notcounting introduced species andor pasture dwellingspecies (see also Borges 1999) According to PBrsquosknowledge 306 species could be an approximate figurefor the total number of species present in such forests(see Table 2) Such a guesstimate should not be takenas the true number of arthropod epigean species inAzorean Laurisilva but only as a milestone to identifyabnormally biased richness estimations
Data grouping
To study how variations in grain size affect species rich-ness estimations we have grouped data into samplesusing seven different strategies
1
Islands
grouping all individuals captured in eachisland as a single sample (
n
= 5)
2
Natural areas
using all data from each forest remnantas a sample (
n
= 17)
3
Transects
comprising all the individuals capturedin each transect (
n
= 78)
4
Pairs of traps
(herein lsquo2Trapsrsquo) combining the dataof each pair of Turquin and ethylene pitfalls into asingle measure (eg traps 1 and 2 traps 3 and 4 hellip ofa given transect) assuming that they constitute anheterogeneous though complementary sample unit com-prising two different capture methods (see Discussionon heterogeneous sampling units at Jimeacutenez-Valverdeamp Lobo 2005) (
n
= 1116)
5
Traps
using each pitfall trap separately (
n
= 2232)
6
Database records
(herein lsquoRecordsrsquo) where all theindividuals of the same species present in a single trapgive rise to a single sample (eg if a trap contains twoindividuals of the same species a single sample is usedwith an abundance value of 2 if on the contrary thesetwo individuals pertain to two different species twodifferent samples occur each one with an abundancevalue of 1 see examples in Hortal Lobo amp Martiacuten-Piera2001 Lobo amp Martiacuten-Piera 2002 and Martiacuten-Piera ampLobo 2003) (
n
= 8666)
7
Individuals
where each individual captured producesa sample (
n
= 22815)Here it is important to point out that both Recordsand Individuals provide only incidence measures(although species abundance is directly included inIndividuals and indirectly in Records) Thus the per-formance of abundance-based estimators (see below)could be less reliable for these two grains
Species richness estimators
We compared the performance of 15 different speciesrichness estimators (see abbreviations and descriptionsin Table 3)
For Clench Negative Exponential and Weibullestimators species richness is calculated as the asymp-tote value of a function fitted to the smoothed speciesaccumulation curve provided by
S 7middot0 (100randomizations Colwell 2004) This ideal curve rep-resents an unbiased description of the sampling processwhere possible effects due to the order by which thesamples have been taken or listed are removed by ran-domizing their order of entrance in the curve We used
to fit each function to the data (see functionequations in Soberoacuten amp Llorente 1993 for Clench andNegative Exponential and Flather 1996 for Weibull)and then calculated the asymptote value from theso-obtained parameters (see a description of the pro-cess in Jimeacutenez-Valverde amp Hortal 2003 or Hortal
et al
2004) MichaelisndashMenten is a nonparametric formula-tion of the Clench one and is calculated in
asthe mean score after 100 randomizations (Colwell 2004)As it presents slight differences from the scores obtainedwith Clench we have included it in our analyses
Table 2 Guesstimate (expert extrapolation) of total speciesrichness of the epigean arthropod fauna of natural forestremnants in the five Azorean islands studied (Satildeo MiguelTerceira Pico Flores and Satildeo Jorge) Sobs is the number ofepigean species recorded during the survey
Group Sobs Estimate
Coleoptera 82 126Araneae 50 70Blattaria 1 1Chilopoda 6 7Dermaptera 2 3Diplopoda 12 20Hemiptera 45 70Opiliones 2 2Pseudoscorpiones 3 4Thysanura 2 3Total 205 306
278
J Hortal P A V Borges amp C Gaspar
copy 2006 The AuthorsJournal compilation copy 2006 British Ecological Society
Journal of Animal Ecology
75
274ndash287
Together with the former we evaluated another 10nonparametric estimators Seven are the lsquoclassicalrsquo esti-mators provided by the
S software ACE ICEChao1 Chao2 Jackknife1 Jackknife2 Bootstrap (seeTable 3 for references) and have been widely used andstudied (eg Chazdon
et al
1998 Brose
et al
2003Chiarucci
et al
2003) They are available in several pro-grams (eg
S
ndash Chao amp Shen 2003ndash05or
ndash Henderson amp Seaby2002) Here it is important to check for the estimatorformulas used by each program while several estima-tors have been updated these changes are not alwaysavailable (eg Chao1 bias-corrected formula is used bycurrent versions of
S and
but not by
) The other three (F3 F5and F6) are available in
2
software (Turner Leitneramp Rosenzweig 2000) but their adequacy has not yetbeen formally tested against other estimators exceptfor the paper where they were proposed (Rosenzweig
et al
2003) This is also the case for the only speciesndash
area-based estimator we test (Ugland) for which theonly application available is its primary source (Ugland
et al
2003)
Comparison among estimators performance
We estimated the total species richness scores for thefive studied islands using the 15 estimators and theseven different grain sizes (Table 4) The eight estima-tors included in the
S package (as well as thethree asymptotic ones see Table 3) were applied to allgrains being computing times negligible (on a PentiumCentrino 1middot7 GHz with 1middot25 GB RAM) except forRecords and Individuals (note that high computationtimes are due to the randomization process which isnot necessary to obtain the results of nonparametricestimators if a single estimate is needed R Colwellpersonal communication) Computing times for
2
were higher reaching 10 min in the case of 2Traps 15 minfor Traps and 140 min for Records being impossible to
Table 3 Characteristics of the species richness estimators used for this analysis
Abbrev Estimator Type Data Program Reference
Clench Estimation of MichaelisndashMenten function asymptote
As In SSTAT Clench (1979) in Soberoacuten amp Llorente (1993)
Exp Neg Estimation of Negative Exponential function asymptote
As In SSTAT Miller amp Wiegert (1989) in Soberoacuten amp Llorente (1993)
Weibull Estimation of Weibull function asymptote
As In SSTAT Brown amp Mayer (1988) in Flather (1996)
MM Nonparametric MichaelisndashMenten richness estimator
AsNP In S Raaijmakers (1987) in Colwell (2004)
ACE Abundance-based Coverage Estimator of species richness
NP Ab S Chao amp Lee (1992) Chao et al (2000) Chazdon et al (1998) in Colwell (2004)
ICE Incidence-based Coverage Estimator of species richness
NP In S Lee amp Chao (1994) Chao et al (2000) Chazdon et al (1998) in Colwell (2004)
Chao1 Abundance-based estimator of species richness
NP Ab S Chao (1984) in Colwell (2004)
Chao2 Incidence-based estimator of species richness
NP In S Chao (1984 1987) Colwell (2004)
Jackknife1 First-order Jackknife richness estimator
NP In S Burnham amp Overton (1978 1979) Heltshe amp Forrester (1983) in Colwell (2004)
Jackknife2 Second-order Jackknife richness estimator
NP In S Smith amp van Belle (1984) in Colwell (2004)
Bootstrap Bootstrap richness estimator NP In S Smith amp van Belle (1984) in Colwell (2004)
F3 Extrapolation nonparametric estimator 3
NP Ab 2 Rosenzweig et al (2003)
F5 Extrapolation nonparametric estimator 5
NP Ab 2 Rosenzweig et al (2003)
F6 Extrapolation nonparametric estimator 6
NP Ab 2 Rosenzweig et al (2003)
Ugland Sample based speciesndasharea curve SA Ab Ugland Ugland et al (2003)
Abbrev is the abbreviation used throughout this work Type refers to the kind of method used to estimate species richness As asymptote value of a fitted species accumulation curve NP estimation using a nonparametric model SA speciesndasharea curve see text for further details Data refer to the kind of data required for the estimation In incidence of the species in each sample Ab abundance of the species in each sample Program refers to the software used for computing (S 7middot0 ndash Colwell 2004 available at httppurloclcorgestimates STAT ndash any common statistical program in this case StatSoft 2001 2 3middot2 (beta) ndash Turner et al 2000 available at httpeebwebarizonaedudiversity Ugland ndash Ugland et al 2003 Excelreg spreadsheet available at httpfolkuionojohnsgmainhtm) See text for further explanations
279Effect of grain size on species richness estimators
copy 2006 The AuthorsJournal compilation copy 2006 British Ecological Society Journal of Animal Ecology 75 274ndash287
compute the matrix of Individuals For the speciesndasharea curve estimator (Ugland) the samples needed tobe partitioned into up to five different groups and dueto Excelreg limitations it was only possible to use up to240 samples Thus we could only apply it to two grainsizes (Natural Areas and Transects) allowing the useof the 17 Natural Areas or the 78 Transects partitionedinto the five groups (islands)
We evaluated the effect of variations in grain size onspecies richness estimation in two ways First weevaluated the sensitivity of the estimators to suchvariations in order to identify those with higher inde-pendence from grain To do this we used precision (iethe variability in the estimates obtained with differentgrains) and secondarily bias (ie the distance betweenthe estimates and the guesstimate of 306 species) (seeWalther amp Moore 2005) The best-performing estim-ators can be regarded as the most suitable to compareareas sampled with different grains Second we usedthe results from the more precise estimators to analysethe suitability of using different grain sizes for com-parable biodiversity studies We characterized the rela-tionships among the estimates obtained with differentgrains to determine which groups of grains presentedsimilar values when the same estimator is used This waywe identified which pairs or groups of grains producecomparable estimations
Five estimators (Ugland F3 F5 F6 and Weibull)performed clearly worse than the other 10 Uglandcould only be applied to two grain sizes showing lowprecision and both estimations seem unrealistic whencompared with the guesstimate (601middot1 species estimatesusing Natural Areas and 440middot9 using Transects seeTable 4) The same occurred with F3 F5 and F6 which
also showed low precision and extremely biased scoresin the greatest grain sizes (see Table 4 and Fig 1)Although the three were more precise and less biased atgrains smaller than Transect (which are at most timesdirectly comparable see Relationships among grainsizes below) their overall performance was worse thanthe other estimators While their ranges in these threeestimates are equal or higher than 30 (36middot71 for F356middot15 for F5 and 29middot44 for F6) almost all the otherestimators presented variations smaller than 5middot5 Theonly lsquoclassicalrsquo estimator with a similar performance isWeibull (with a range of 26middot17 in the estimates for2Traps Traps and Records) which also presents anerratic behaviour While the other estimators show amore or less constant pattern of diminishing estimatedscores as grain diminishes (see Fig 2) Weibull reachesan unrealistic top value when calculated using Indi-viduals (nearly 750 species see Table 4) This pattern isprobably due to the high effectiveness of this functionin adjusting to the smoothed species accumulationcurves (adjusted R2 scores always higher than 99middot99see also Jimeacutenez-Valverde et al 2006) Such lsquooverfit-tingrsquo to the different curves obtained with each grainmakes this estimator extremely dependent on grainsize Owing to their poor performance we haveexcluded these five estimators from the rest of theanalyses
All the other 10 estimators showed limited vari-ability with SDs always less than 60 species (c 20 ofthe guesstimate) (Table 4) In general most of themshowed a decreasing pattern producing higher estima-tions at the greater grains and similar estimated scoresat the four smaller grain sizes (2Traps Traps Recordsand Individuals) (Fig 2) The abundance-basedestimators ACE and Chao1 and to a lesser extentBootstrap showed a high precision with negligibleSDs (0middot23 2middot79 and 4middot80 respectively see Table 4)produced by the little variations due to data aggregation
Table 4 Species richness estimated for seven different grains by the 15 estimators analysed n refers to the number of grains thatcould be used for each estimator note that F3 F5 and F6 could not be used with Individuals and the Ugland estimator could onlybe applied to two grains (see text) SD is the SD of the different results obtained with each estimator Results according toS output (note that slight differences could appear between S and estimates A Chao personalcommunication) NtAr is Natural Areas Ind is Individuals Other abbreviations as in text and Table 3
Estimator n SD Islands NtAr Transects 2Traps Traps Records Ind
Clench 7 45middot82 343middot6 277middot5 248middot7 223middot9 223middot3 223middot7 218middot4Exp Neg 7 18middot59 238middot2 208middot2 197middot0 188middot7 188middot7 188middot8 187middot5Weibull 7 162middot81 244middot6 306middot0 319middot4 433middot4 412middot1 407middot3 744middot9MM 7 57middot69 333middot0 253middot5 212middot7 184middot5 183middot5 183middot1 174middot1ACE 7 0middot23 288middot3 288middot3 288middot3 288middot3 288middot3 289middot0 288middot3ICE 7 31middot99 372middot8 329middot6 299middot1 291middot9 288middot7 288middot7 288middot1Chao1 7 2middot79 298middot1 plusmn 34middot9 301middot8 plusmn 34middot9 301middot8 plusmn 34middot9 301middot8 plusmn 34middot9 301middot8 plusmn 34middot9 307middot2 plusmn 37middot7 304middot2 plusmn 34middot9Chao2 7 32middot35 379middot5 plusmn 48middot3 363middot0 plusmn 49middot3 361middot0 plusmn 53middot1 311middot2 plusmn 37middot7 311middot2 plusmn 37middot7 307middot2 plusmn 37middot7 304middot2 plusmn 34middot9Jackknife1 7 10middot08 293middot8 plusmn 22middot6 287middot8 plusmn 13middot8 282middot0 plusmn 11middot1 270middot9 plusmn 8middot3 271middot0 plusmn 8middot3 271middot0 plusmn 8middot1 268middot0 plusmn 7middot9Jackknife2 7 15middot24 345middot1 345middot6 339middot7 316middot9 316middot9 317middot0 311middot0Bootstrap 7 4middot80 244middot3 240middot6 237middot3 232middot9 232middot9 232middot9 231middot7F3 6 381middot23 1255middot3 631middot2 435middot5 297middot8 295middot1 261middot1F5 6 2053middot94 5514middot3 1776middot8 670middot3 334middot7 331middot6 278middot5F6 6 457middot98 1588middot9 618middot4 512middot3 422middot6 444middot6 415middot2Ugland 2 113middot29 601middot1 440middot9
280J Hortal P A V Borges amp C Gaspar
copy 2006 The AuthorsJournal compilation copy 2006 British Ecological Society Journal of Animal Ecology 75 274ndash287
in samples at each grain First- and second-orderJackknife estimators also showed great precision Tothe contrary incidence-based estimators ICE andChao2 and asymptotic estimators (Clench NegativeExponential and MichaelisndashMenten) showed con-sistently higher scores at greater grain sizes These threeasymptotic estimators as well as Bootstrap were alsonegatively biased performing even worse than theobserved number of species (Negative Exponential andMichaelisndashMenten estimators Fig 2) Again ACEand Chao1 showed the best performance with scoresvery close to the guesstimate throughout the differentgrains ICE Chao2 and the two Jackknife estimatorsperformed quite well in the smaller grains Althoughbeing cautious about our guesstimate all these non-parametric estimators seemed to present higher accu-racy in their estimations thus seeming a better optionthan asymptotic estimators and Bootstrap
The results of all 10 estimators were highly depend-ent on the level of sampling effort (sample coverage)providing lower richness scores when calculated from alower number of samples We calculated the predictionsof these estimators at four levels of sample coverage(30 50 70 and 100 of the samples) For each grainwe calculated the average species richness predictedafter 100 randomizations at each sample coveragelevel (eg the mean predictions for each of the 10 esti-mators at 23 (30) 39 (50) 55 (70) and 78 (100)samples of Transects or at 2600 4333 6066 and 8666samples of Records) Islands grain size was excludeddue to its low number of samples Then we calculatedthe mean and SD for each estimator and level of sample
coverage to account for the bias and precision of theirpredictions (Table 5) Although the abundance-basednonparametric estimators (ACE and Chao1) are moreprecise when we analyse the effect of sample coveragetheir advantage over the rest of the estimators dimin-ishes While their precision decreases at lower samplingintensities the variability of incidence-based and Jack-knife nonparametric estimators diminishes or remainsmore or less constant (see Table 5)
Species richness estimates were highly correlatedamong the smaller grains We compared the results ofthe 10 best-performing estimators (see before) at eachgrain size to determine which ones produced similarestimates (Fig 3) Islands was the most dissimilar grainonly significantly related to Natural Areas (PearsonR = 0middot850) and Transects (Pearson R = 0middot733) Theextremely high correlation (Pearson R = 1middot000) betweenTraps and 2Traps and between Records and Individualsis remarkable Interestingly both pairs of grains werealso highly correlated (Pearson R = 0middot996) Thus itseems equivalent to use any of these four grains at leastin the studied case In addition these were the grainswhere the scores obtained from nonparametric esti-mators were less biased (see Fig 2)
Discussion
Species richness is a central component of biodiversity(Gaston 1996 Gaston amp Blackburn 2000) As the
Fig 1 Variability in the species richness scores calculated by each estimator Square plots represent the mean boxes show the SDand whiskers provide the 95 confidence interval (1middot96SD) The left graph shows 14 of the studied estimators (note that Uglandis excluded) As F3 F5 and F6 could only be applied to six grain sizes (see text) lsquoIndividualsrsquo is excluded from the calculationsof this graph Owing to the high variability in these three estimators the other 11 are represented in the right graph using datafor the seven grain sizes Here the guesstimate (306 species) is represented by a discontinuous line and the observed richness (205species) as dots and lines (see text) Abbreviations as in text and Table 3
281Effect of grain size on species richness estimators
copy 2006 The AuthorsJournal compilation copy 2006 British Ecological Society Journal of Animal Ecology 75 274ndash287
real number of species is unknown after samplingcampaigns estimators are needed to provide a clearerpicture of species richness patterns To date manyestimators are available a number that increases as newapproaches to the analysis of the process of speciesaccumulation with sampling effort are developed (egColwell et al 2004) However the estimation of thetrue number of species in a given place or area seemsto be elusive Unfortunately when a nearly completechecklist is available (in simulations or extremely well-known areas) most times the actual richness figures
are not accurately estimated (eg Brose et al 2003Brose amp Martinez 2004) depending on the data and theestimator used (see Walther amp Morand 1998 Waltheramp Martin 2001) Despite this drawback such estima-tors could be also useful if they provide a good pictureof species richness patterns Hortal et al (2004) foundthat predictive models of the geographical distributionof species richness developed from Clench estimationswere more accurate and representative than the modelsdeveloped from observed scores due to the diminutionin the estimations of the bias due to unequal sampling
Fig 2 Performance of the 10 less variable estimators across grain sizes The discontinuous line shows the guesstimate and theobserved number of species is represented as dots and lines Abbreviations as in text and Tables 3 and 4
282J Hortal P A V Borges amp C Gaspar
copy 2006 The AuthorsJournal compilation copy 2006 British Ecological Society Journal of Animal Ecology 75 274ndash287
effort Here in addition to the accuracy in representingreal species richness score (that is virtually unknownsuch as present data) we stress the importance of theestimates being comparable as a criterion for theadequacy of estimators (see eg Palmer 1990 1991)For an estimator to be useful it should combineaccuracy in representing real species richness with thecapacity to give unbiased estimations of the differencesin species richness among areas andor grain sizes
With regard to estimator performance it is impor-tant to point out the poor results shown for these databy the new estimators proposed by Rosenzweig et al(2003) and Ugland et al (2003) as well as of Weibull(Flather 1996) Therefore and given our results the useof the estimators F3 F5 F6 Weibull and Ugland is cur-rently not advisable until their performance in futurecomparative analyses determine that they could beworth using in a number of cases Once these estimatorswere excluded the rest seem to perform more or lesswell However asymptotic estimators appear less desir-able they consistently underestimate species richnessa pattern well-documented in the literature (see eg
Lamas et al 1991 Soberoacuten amp Llorente 1993 Colwellamp Coddington 1994 Chazdon et al 1998 Gotelli ampColwell 2001 Walther amp Martin 2001 Melo et al2003 Brose amp Martinez 2004 Hortal et al 2004Walther amp Moore 2005 Jimeacutenez-Valverde et al 2006)Although the performance of nonparametric estima-tors has been always questionable (see eg Longinoet al 2002 Chiarucci et al 2003 Jimeacutenez-Valverde ampHortal 2003 OrsquoHara 2005) neither observed speciesrichness nor speciesndasharea curves or asymptotic estima-tors seem to perform better than most of these estimatorsTherefore we believe that they should be used in theabsence of complete inventories despite their drawbacksand potential inaccuracy
The estimations of the abundance-based Chao1and ACE nonparametric estimators were independentfrom the grain used to aggregate the samples This resultwas expected as both estimators are calculated fromthe species frequencies directly obtained from the totalpool of individuals (A Chao and R Colwell personalcommunication) Therefore abundance data remainthe same regardless of the grain size used to aggregatedata (except for Records a measure of incidence) soonly small variations due to data aggregation in samplesappear This property makes both abundance-basedestimators extremely useful to compare data comingfrom different grains as they depend on total speciesabundances they should be quite robust to variationsin grain size if sample coverage is sufficiently large (AChao personal communication) However differencesin the survey methodologies and sampling effort usedat the different sites (ie sampling bias sensu Walther ampMoore 2005) could also affect estimations so to com-pare surveys with different grain size data should becarefully examined to determine if they are comparableIt is also worth mentioning the low bias of both Chao1and ACE estimators in our study although this resultcannot be taken as a general rule (see Walther amp Moore2005) On the contrary although Bootstrap estimatesare also highly precise its clear underestimations ofspecies richness (also reported by Chiarucci et al 2003)prevent us from using it
Table 5 Mean and SD of the estimates of species richness at different sample coverage (30 50 70 and 100 of the samplesIslands was excluded from this analysis due to its low number of samples) for the 10 less variable estimators
samples
Mean species richness estimation SD
30 50 70 100 30 50 70 100
Clench 171middot80 200middot05 217middot12 235middot92 19middot99 21middot03 21middot47 23middot02Exp Neg 132middot50 158middot44 173middot96 193middot15 4middot66 5middot74 6middot46 8middot15MM 147middot16 168middot34 181middot50 198middot58 26middot89 28middot49 28middot82 29middot92ACE 184middot63 229middot71 255middot64 288middot44 14middot23 11middot44 8middot86 0middot25ICE 202middot18 243middot42 267middot79 297middot67 13middot55 12middot96 12middot83 16middot18Chao1 191middot77 230middot75 258middot34 303middot11 20middot13 13middot01 11middot27 2middot24Chao2 209middot27 243middot49 271middot47 326middot33 6middot13 3middot77 4middot85 27middot78Jackknife1 181middot27 219middot30 242middot98 275middot12 5middot24 2middot05 3middot79 7middot89Jackknife2 209middot99 247middot97 281middot97 324middot52 6middot77 6middot87 6middot17 14middot37Bootstrap 154middot37 187middot54 208middot08 234middot70 6middot97 1middot98 0middot64 3middot46
Fig 3 Relationships between grain sizes Cluster analysiswas developed using Unweighted Pair-Group Average aslinkage rule (see eg Sokal amp Rohlf 1995) and Spearmancorrelations (Table 6) as similarity measure Abbreviations asin text and Table 4
283Effect of grain size on species richness estimators
copy 2006 The AuthorsJournal compilation copy 2006 British Ecological Society Journal of Animal Ecology 75 274ndash287
Having said this it is important to take into accountother effects to determine if these two abundance-basedestimators are preferable Given that other estimatorshave been identified as being more accurate in previousanalyses they could be a better alternative if the data tobe compared have small variations in sample grainsizes Interestingly when the effect of sample coverageis studied the precision of abundance-based estimatorsACE and Chao1 diminishes at lower sampling intensi-ties whereas it remains constant or even increases forincidence-based and Jackknife nonparametric estima-tors (see Table 5) A higher precision of incidence-based estimators at low sampling intensities has beenpreviously reported (eg Chazdon et al 1998) so theyappear to be the best option when sampling effort hasbeen scarce In our study Jackknife and incidence-based estimators showed an erratic behaviour in thegreater grain sizes However when grain is maintainedconstant these four estimators (ICE Chao2 Jackknife1and Jackknife2) have been reported to be more accurateand less sensitive to other drawbacks such as samplecoverage patchiness of species distributions variabilityin the probability of capture and many others (seePalmer 1990 1991 Baltanaacutes 1992 Palmer amp White1994 Chazdon et al 1998 Chiarucci et al 2001Brose et al 2003 Brose amp Martinez 2004) Therefore abalance between sample grain (see below) and samplecoverage is needed to make the best choice of anestimator for specific datasets
With regard to the most-adequate grain size foraggregating samples it seems that any of the smallgrains (2Traps Traps Records and Individuals) hereconsidered could give an appropriate picture of thecommunity All these grains refer to data captured in asingle point or a reduced area Their high similaritycould be due either to the effectiveness of such pointdata to describe the studied fauna or to the fact thatthe arthropod community of a limited area is sampledequally by all of them Gotelli amp Colwell (2001) discussthe differences between using individuals or samples asa measurement of sampling intensity Given ourresults estimations made using individuals did not dif-fer so much from those obtained using small samplessuch as traps On the other hand greater grains includ-ing Transect seem not to be adequate to obtain un-biased species richness estimations that could be comparedamong different places andor grains As a conclusiondata referred to a point or a small area (a plot) seem tobe the most adequate to estimate species richness Wethus recommend that authors should record and makeavailable the abundance data for traps or similar unitsin biological databases and published papers Notcompiling the information available from biodiversitystudies in an extensive way but just for transects orlocal studies may result in the loss of useful informa-tion on biodiversity patterns
The performance of Records is particularly remark-able this is a measure that although seeming lessinformative performs as well as Individuals and Traps
Records is just an incidence measure that is a sampleof each time a species is recorded in a different placeday trap or by a different collector regardless of thenumber of individuals found In spite of this their per-formance in our study has been also good when usingabundance-based estimators (see above) Other studieshave demonstrated the utility of this measure to char-acterize sampling effort (Hortal et al 2001 Lobo ampMartiacuten-Piera 2002 Martiacuten-Piera amp Lobo 2003) andrecent works demonstrate its accuracy to describe theprocess of species accumulation from heterogeneousdata (JM Lobo unpublished results Romo Benito ampGarciacutea-Barros 2005) Thus we encourage the use of thismeasure to analyse data coming from heterogeneoussources such as studies made with different methodol-ogies or museum and collection data a still underes-timated but valuable reservoir of biodiversity data(see Petersen amp Meier 2003 Petersen Meier amp Larsen2003 Graham et al 2004 Suarez amp Tsutsui 2004)
Many times the information available for biodiver-sity meta-analyses comes from heterogeneous sourcesand different sampling methodologies and thus fromdifferent grains Given the here-presented grain-associatedperformance as well as the recommendations made byChazdon et al (1998) Brose et al (2003) and Brose ampMartinez (2004) among others we propose a decisionframework to determine which estimator should beused in each case (see Table 6) When all data pertain tocomparable grains (or small grains which we have seento provide similar estimates) ICE any of the two Jack-knives or Chao2 should be preferred The relativeperformance of these estimators is still under discussionas the results obtained to date are heterogeneous Forexample whereas Chazdon et al (1998) found a betterperformance of ICE and Chao2 at low sample cover-ages Brose et al (2003) found that the behaviour of thelatter is erratic and dependent on sample coverage andthat Jackknife estimators were the most accurate indetermining species richness We thus recommendfollowing the recommendations given in Chazdon et al(1998) as well as the decision paths provided by Broseet al (2003) and Brose amp Martinez (2004) to decidewhich estimator should be used when grains are similar
Table 6 Choice of the best species richnessrsquo estimator forbiodiversity meta-analyses depending on data characteristics(abundance or incidence) and studied grain sizes (lsquoComparablersquomeans similar grain sizes and lsquosmall grainsrsquo refer to data aboutTraps small groups of Traps Records or Individuals) Notethat the estimators recommended for abundance data whenusing lsquoComparable andor small grainsrsquo are of incidencetype
Abundance data
Incidence data
Comparable andor small grains
ICE Jackknife1 Jackknife2 Chao2
ICE Jackknife1 Jackknife2 Chao2
Noncomparable andor great grains
ACE or Chao1 Jackknife1 or Jackknife2
284J Hortal P A V Borges amp C Gaspar
copy 2006 The AuthorsJournal compilation copy 2006 British Ecological Society Journal of Animal Ecology 75 274ndash287
or comparable However when grains are heterogene-ous and specially when analysing data from largegrain sizes such as islands regions or forest remnantsall these estimators lose accuracy thus producing agrain-related effect in the estimated richness scoresBeing data on abundance available the precision ofACE andor Chao1 in our study make them the bestchoice However both estimators give a lower boundto species richness (OrsquoHara 2005) producing onlyconservative estimates Moreover abundance data arenot usually available as checklists from different landpatches andor regions are the only information avail-able (see eg the butterfly data of Ricketts et al 1999used by Rosenzweig et al 2003) In those cases whereincidence estimators are needed we recommend the useof any of the Jackknife estimators as both seem to beless affected by grain size than ICE and Chao1 Herethe decision framework provided by Brose et al (2003)and Brose amp Martinez (2004) could help to decidewhich Jackknife estimator best suits the available data
Concluding remarks
Chao1 and ACE estimators are highly precise withrespect to grain variations Abundance data will allowthe direct comparison of species richness scores esti-mated from different grains using these two estimatorsHowever they present several drawbacks so we pro-vide a framework to decide which estimator should bepreferred in each case within the six that performedbest in our study (ACE ICE Chao1 Chao2 Jackknife1and Jackknife2) Although it is desirable to obtain ageneral agreement on using a single measure to estimatespecies richness (to allow the comparison of differentworks) their performance varies between data and cases(see Walther amp Moore 2005) Thus we also recommendproviding the results of these six measures as a commonaddition to the results of biodiversity studies
With regard to the selection of grain size the smallergrains (from Pairs of Traps to Individuals which usu-ally may correspond to the real sample units applied inthe field) seem to produce the most precise and un-biased estimations Therefore we recommend use of thesegrains for biodiversity estimations It is also importantto remark on the good performance of Records(Martiacuten-Piera amp Lobo 2003) a measure that could beapplied to most of the primary biodiversity data withno information on sampling effort associated currentlystored in old collections and classic literature
Acknowledgements
The authors wish to thank Alberto Jimeacutenez ValverdeJorge M Lobo Pedro Cardoso Bruno A WaltherRobert Colwell Anne Chao and one anonymousreferee for their suggestions discussions and criticalreview and to Rafael Zardoya (Museo Nacional deCiencias Naturales) for his kind help to use a Mac com-puter for computing the Individuals curve We are also
indebted to all the taxonomists who helped identify themorphospecies H Enghoff F Ilharco V ManhertJ Ribes ARM Serrano and J Wunderlich and toJ Amaral A Arraiol E Barcelos P Cardoso PGonccedilalves S Jarroca C Melo F Pereira H Mas iGisbert A Rodrigues L Vieira and A Vitorino fortheir contribution to field andor laboratory workFunding for field data collecting was provided bylsquoDirecccedilatildeo Regional dos Recursos Florestaisrsquo (lsquoSecre-taria Regional da Agricultura e Pescasrsquo) through theProject lsquoReservas Florestais dos Accedilores Cartografia eInventariaccedilatildeo dos Artroacutepodes Endeacutemicos dos Accediloresrsquo(PROJ 1701-080203) This work was also supportedby Project ATLANTICO financed by European Com-munity program INTERREG III B JH was supportedby a Portuguese FCT (Fundaccedilatildeo para a Ciecircncia eTecnologia) grant (BPD208092004) and also by theFundacioacuten BBVA project lsquoYaacutemana ndash Disentildeo de unared de reservas para la proteccioacuten de la biodiversidaden Ameacuterica del Sur Austral utilizando modelos pre-dictivos de distribucioacuten con taxones hiperdiversosrsquothe Spanish MEC project CGL2004-0439BOS and theFCT Center CITAA CG was supported by a FCTgrant (BD110492002)
References
Baltanaacutes A (1992) On the use of some methods for theestimation of species richness Oikos 65 484ndash492
Borges PAV (1999) A list of arthropod species of sown andsemi-natural pastures of three Azorean islands (S MariaTerceira and Pico) with some conservation remarksAccediloreana 9 13ndash34
Borges PAV amp Brown VK (2003) Estimating speciesrichness of arthropods in Azorean pastures the adequacyof suction sampling and pitfall trapping Graellsia 59 7ndash24
Borges PAV Aguiar C Amaral J Amorim IR AndreacuteG Arraiol A Baz A Dinis F Enghoff H Gaspar CIlharco F Mahnert V Melo C Pereira F Quartau JARibeiro S Ribes J Serrano ARM Sousa AB StrassenRZ Vieira L Vieira V Vitorino A amp Wunderlich J(2005a) Ranking protected areas in the Azores using stand-ardized sampling of soil epigean arthropods Biodiversityand Conservation 14 2029ndash2060
Borges PAV Vieira V Dinis F Jarroca S Aguiar CAmaral J Aarvik L Ashmole P Ashmole MAmorim IR Andreacute G Argente MC Arraiol ACabrera A Diaz S Enghoff H Gaspar C GisbertHM Gonccedilalves P Lopes DH Melo C MendonccedilaEP Mota JA Oliveira O Oromiacute P Pereira F PomboDT Quartau JA Ribeiro SP Rodrigues AC SantosAMC Serrano ARM Simotildees AMA Soares AOSousa AB Vieira L Vitorino A amp Wunderlich J(2005b) List of the arthropods (Arthropoda) A List of theTerrestrial Fauna (Mollusca and Arthropoda) and Flora(Bryophyta Pteridophyta and Spermatophyta) from theAzores (eds PAV Borges R Cunha R Gabriel AF Mar-tins L Silva amp V Vieira) pp 163ndash221 Direcccedilatildeo Regionalde Ambiente and Universidade dos Accedilores Horta Angrado Heroiacutesmo and Ponta Delgada
Borges PAV Lobo JM Azevedo EB Gaspar C MeloC amp Nunes VL (2006) Invasibility and species richness ofisland endemic arthropods a general model of endemic vsexotic species Journal of Biogeography 33 169ndash187
285Effect of grain size on species richness estimators
copy 2006 The AuthorsJournal compilation copy 2006 British Ecological Society Journal of Animal Ecology 75 274ndash287
Brose U (2002) Estimating species richness of pitfall catchesby non-parametric estimators Pedobiologia 46 101ndash107
Brose U amp Martinez ND (2004) Estimating the richness ofspecies with variable mobility Oikos 105 292ndash300
Brose U Martinez ND amp Williams RJ (2003) Estimatingspecies richness sensitivity to sample coverage and insen-sitivity to spatial patterns Ecology 84 2364ndash2377
Brown JH Ernest SKM Parody JM amp Haskell JP(2001) Regulation of diversity maintenance of speciesrichness in changing environments Oecologia 126 321ndash332
Brown RF amp Mayer DG (1988) Representing cumulativegermination 2 The use of the Weibull function and otherempirically derived curves Annals of Botany 61 127ndash138
Burnham KP amp Overton WS (1979) Robust estimationof population size when capture probabilities vary amonganimals Ecology 60 927ndash236
Chao A (1984) Non-parametric estimation of the number ofclasses in a population Scandinavian Journal of Statistics11 265ndash270
Chao A (1987) Estimating the population size for capture-recapture data with unequal catchability Biometrics 43783ndash791
Chao A amp Bunge J (2002) Estimating the number of speciesin a stochastic abundance model Biometrics 58 531ndash539
Chao A amp Lee S-M (1992) Estimating the number ofclasses via sample coverage Journal of the AmericanStatistical Association 87 210ndash217
Chao A amp Shen T-J (2003ndash05) Program SPADE (SpeciesPrediction and Diversity Estimation) Program and UserrsquosGuide published at httpchaostatnthuedutw
Chao A Hwang W-H Chen Y-C amp Kuo C-Y (2000)Estimating the number of shared species in two communitiesStatistica Sinica 10 227ndash246
Chazdon RL Colwell RK Denslow JS amp GuariguataMR (1998) Statistical methods for estimating species rich-ness of woody regeneration in primary and secondary rainforests of NE Costa Rica Forest Biodiversity ResearchMonitoring and Modeling Conceptual Background and OldWorld Case Studies (eds F Dallmeier amp JA Comiskey)pp 285ndash309 Parthenon Publishing Paris
Chiarucci A Enright NJ Perry GLW Miller BP ampLamont BB (2003) Performance of nonparametricspecies richness estimators in a high diversity plant com-munity Diversity and Distributions 9 283ndash295
Chiarucci A Maccherini S amp De Dominicis V (2001)Evaluation and monitoring of the flora in a nature reserveby estimation methods Biological Conservation 101 305ndash314
Clench H (1979) How to make regional fists of butterfliessome thoughts Journal of the Lepidopteristsrsquo Society 33216ndash231
Colwell RK (2004) Estimates Statistical Estimation ofSpecies Richness and Shared Species from Samples Version7 Userrsquos Guide and application published at httppurloclcorgestimates Department of Ecology amp Evolu-tionary Biology University of Connecticut Storrs CT
Colwell RK amp Coddington JA (1994) Estimating ter-restrial biodiversity through extrapolation PhilosophicalTransactions of the Royal Society of London B 345 101ndash118
Colwell RK Mao CX amp Chang J (2004) Interpolatingextrapolating and comparing incidence-based speciesaccumulation curves Ecology 85 2717ndash2727
Conroy M amp Noon BR (1996) Mapping of species richnessfor conservation of biological diversity conceptual andmethodological issues Ecological Applications 6 763ndash773
Currie DJ (1991) Energy and large-scale patterns of animal-and plant-species richness The American Naturalist 13727ndash49
Flather CH (1996) Fitting species-accumulation functionsand assessing regional land use impacts on avian diversityJournal of Biogeography 23 155ndash168
Gaston KJ (1996) Species richness measure and measure-ment Biodiversity A Biology of Numbers and Difference(ed KJ Gaston) pp 77ndash113 Blackwell Science Oxford
Gaston KJ (2000) Global patterns in biodiversity Nature405 220ndash227
Gaston KJ amp Blackburn TM (2000) Pattern and Process inMacroecology Blackwell Science Oxford
Gotelli NJ amp Colwell RK (2001) Quantifying biodiversityprocedures and pitfalls in the measurement and comparisonof species richness Ecology Letters 4 379ndash391
Graham CH Ferrier S Huettman F Moritz C ampPeterson AT (2004) New developments in museum-basedinformatics and applications in biodiversity analysisTrends in Ecology and Evolution 19 497ndash503
Gray JS Ugland KI amp Lambshead J (2004) On speciesaccumulation and speciesndasharea curves Global Ecology andBiogeography 13 567ndash568
Gray JS Ugland KI amp Lambshead J (2005) Speciesaccumulation curves analysed by a class if null modelsdiscovered by Arrhenius Oikos 108 263ndash274
He F amp Legendre P (1996) On speciesndasharea relations TheAmerican Naturalist 148 719ndash737
Heltshe J amp Forrester NE (1983) Estimating species rich-ness using the jackknife procedure Biometrics 39 1ndash11
Henderson PA amp Seaby RMH (2002) Species Diversityand Richness V3middot0 Pisces Conservation Ltd LymingtonHants
Hortal J Lobo JM amp Martiacuten-Piera F (2001) Forecastinginsect species richness scores in poorly surveyed territoriesthe case of the Portuguese dung beetles (Col Scarabaeinae)Biodiversity and Conservation 10 1343ndash1367
Hortal J Garcia-Pereira P amp Garciacutea-Barros E (2004)Butterfly species richness in mainland Portugal predictivemodels of geographic distribution patterns Ecography 2768ndash82
van Jaarsveld AS Freitag S Chown SL Muller CKoch S Hull H Bellamy C Kruumlger M Endroumldy-Younga S Mansell MW amp Scholtz CH (1998)Biodiversity assessment and conservation strategies Science279 2106ndash2108
Jimeacutenez-Valverde A amp Hortal J (2003) Las curvas de acu-mulacioacuten de especies y la necesidad de evaluar la calidad delos inventarios bioloacutegicos Revista Ibeacuterica de Aracnologiacutea8 151ndash161
Jimeacutenez-Valverde A amp Lobo JM (2005) Determining acombined sampling procedure for a reliable estimation ofAraneidae and Thomisidae assemblages (ArachnidaAranaeae) Journal of Arachnology 33 33ndash42
Jimeacutenez-Valverde A Jimeacutenez Mendoza S Martiacuten Cano Jamp Munguira ML (2006) Comparing relative model fit ofseveral species accumulation functions to local Papilionoideaand Hesperoidea butterfly inventories of Mediterraneanhabitats Biodiversity and Conservation 15 in press
Keating KA Quinn JF Ivie MA amp Ivie L (1998)Estimating the effectiveness of further sampling in speciesinventories Ecological Applications 8 1239ndash1249
Kerr JT (1997) Species richness endemism and the choice ofareas for conservation Conservation Biology 11 1094ndash1100
Koellner T Hersperger AM amp Wohlgemuth T (2004)Rarefaction method for assessing plant species diversity ona regional scale Ecography 27 532ndash544
Lamas G Robbins RK amp Harvey DJ (1991) A preliminarysurvey of the butterfly fauna of Pakitza Parque Nacionaldel Manu Peru with an estimate of its species richnessPublicaciones del Museo de Historia Natural UniversidadNacional Mayor de San Marcos Serie a Zoologiacutea 40 1ndash19
286J Hortal P A V Borges amp C Gaspar
copy 2006 The AuthorsJournal compilation copy 2006 British Ecological Society Journal of Animal Ecology 75 274ndash287
Lee S-M amp Chao A (1994) Estimating population size viasample coverage for closed capture-recapture modelsBiometrics 50 88ndash97
Levins R (1968) Evolution in Changing EnvironmentsPrinceton University Press Princeton NJ
Lobo JM amp Martiacuten-Piera F (2002) Searching for a predic-tive model for species richness of Iberian dung beetle basedon spatial and environmental variables Conservation Biology16 158ndash173
Longino JT Coddington JA amp Colwell RR (2002) Theant fauna of a tropical rain forest estimating species richnessin three different ways Ecology 83 689ndash702
Margules CR Nicholls AO amp Pressey RL (1988) Select-ing networks of reserves to maximise biological diversityBiological Conservation 43 63ndash76
Martiacuten-Piera F amp Lobo JM (2003) Database records as asampling effort surrogate to predict spatial distribution ofinsects in either poorly or unevenly surveyed areas ActaEntomoloacutegica Ibeacuterica e Macaroneacutesica 1 23ndash35
May RM (1975) Patterns of species abundance and diver-sity Ecology and Evolution of Communities (eds ML Codyamp JM Diamond) pp 81ndash120 Harvard University PressHarvard MA
Medelliacuten RA amp Soberoacuten J (1999) Predictions of mammaldiversity on four land masses Conservation Biology 13143ndash149
Melo AS Pereira RAS Santos AJ Shepherd GJMachado G Medeiros HF amp Sawaya RJ (2003) Com-paring species richness among assemblages using sampleunits why not use extrapolation methods to standardizedifferent sample sizes Oikos 101 398ndash410
Miller RI amp Wiegert RG (1989) Documenting completenessspeciesndasharea relations and the species-abundance distribu-tion of a regional flora Ecology 70 16ndash22
Naeem S Haringkanson K Lawton JH Crawley MJ ampThompson LJ (1996) Biodiversity and plant productivityin a model assemblage of plant species Nature 368 734ndash737
Nunes JCC (1999) A Actividade Vulcacircnica na ilha do Pico doPlistoceacutenico Superior ao Holoceacutenico Mecanismo Eruptivo eHazard Vulcacircnico PhD Thesis Universidade dos Accedilores
OrsquoHara RB (2005) Species richness estimators how manyspecies can dance on the head of a pin Journal of AnimalEcology 74 375ndash386
Oliver I amp Beattie AJ (1993) A possible method for therapid assessment of biodiversity Conservation Biology 7562ndash568
Oliver I amp Beattie AJ (1996) Invertebrate morphospecies assurrogates for species a case study Conservation Biology10 99ndash109
Palmer MW (1990) The estimation of species richness byextrapolation Ecology 71 1195ndash1198
Palmer MW (1991) Estimating species richness the second-order Jackknife reconsidered Ecology 72 1512ndash1513
Palmer MW amp White PS (1994) Scale dependence and thespeciesndasharea relationship The American Naturalist 144717ndash740
Petersen FT amp Meier R (2003) Testing species-richness esti-mation methods on single-sample collection data using theDanish Diptera Biodiversity and Conservation 12 667ndash686
Petersen FT Meier R amp Larsen MN (2003) Testing spe-cies richness estimation methods using museum label dataon the Danish Asilidae Biodiversity and Conservation 12687ndash701
Peterson AT amp Slade NA (1998) Extrapolating inventoryresults into biodiversity estimates and the importance ofstopping rules Diversity and Distributions 4 95ndash105
Pielou EC (1975) Ecological Diversity Wiley InterscienceNew York
Pielou EC (1977) The Interpretation of Ecological DataJohn Wiley amp Sons New York
Raaijmakers JGW (1987) Statistical analysis of the Michaelis-Menten equation Biometrics 43 793ndash803
Ricketts TH Dinerstein E Olson DM Loucks CEichbaum W Kavanagh K Hedao P Hurley PCarney KM Abel R amp Walters S (1999) TerrestrialEcoregions of North America a Conservation AssessmentIsland Press Washington DC
Romo Benito H amp Garciacutea-Barros E (2005) Distribucioacuten eintensidad de los estudios fauniacutesticos sobre mariposasdiurnas en la Peniacutensula Ibeacuterica e Islas Baleares (LepidopteraPapilionoidea y Hesperoidea) Graellsia 61 37ndash50
Rosenzweig ML Turner WR Cox JG amp Ricketts TH(2003) Estimating diversity in unsampled habitats of abiogeographical province Conservation Biology 17 864ndash874
Scheiner SM (2003) Six types of speciesndasharea curves GlobalEcology and Biogeography 12 441ndash447
Scheiner SM (2004) A meacutelange of curves ndash further dialogueabout speciesndasharea relationships Global Ecology and Bio-geography 13 479ndash484
Scheiner SM Cox SB Willig MR Mittelbach GGOsenberg C amp Kaspari M (2000) Species richnessspeciesndasharea curves and Simpsonrsquos paradox EvolutionaryEcology Research 2 791ndash802
Shen T-J Chao A amp Lin C-F (2003) Predicting thenumber of new species in further taxonomic samplingEcology 84 798ndash804
Silva L Pinto N Press B Rumsey F Carine MHenderson S amp Sjoumlgren E (2005) Vascular plants(Pteridophyta and Spermatophyta) A List of the TerrestrialFauna (Mollusca and Arthropoda) and Flora (BryophytaPteridophyta and Spermatophyta) from the Azores (edsPAV Borges R Cunha R Gabriel AF Martins L Silvaamp V Vieira) pp 133ndash155 Direcccedilatildeo Regional de Ambienteand Universidade dos Accedilores Horta Angra do Heroiacutesmoand Ponta Delgada
Smith EP amp van Belle G (1984) Nonparametric estimationof species richness Biometrics 40 119ndash129
Soberoacuten J amp Llorente J (1993) The use of species accumulationfunctions for the prediction of species richness ConservationBiology 7 480ndash488
Sokal RR amp Rohlf FJ (1995) Biometry 3rd edn WHFreeman and Company New York
Soslashrensen LL Coddington JA amp Scharff N (2002)Inventorying and estimating subcanopy spider diversityusing semiquantitative sampling methods in an afromon-tane forest Environmental Entomology 31 319ndash330
StatSoft I (2001) STATISTICA (data analysis softwaresystem) StatSoft Inc Tulsa OK
Suarez AV amp Tsutsui ND (2004) The value of museumcollections for research and society Bioscience 54 66ndash74
Tilman D Wedin D amp Knops J (1996) Productivity andsustainability influenced by biodiversity in grasslandecosystems Nature 379 718ndash720
Turner WR Leitner W amp Rosenzweig ML (2000) Ws2mSoftware for the Measurement and Analysis of SpeciesDiversity Version 3middot2 (beta) Userrsquos Guide and applicationpublished at httpeebwebarizonaedudiversity3middot2 (beta)edn Department of Ecology amp Evolutionary BiologyUniversity of Arizona Tucson AZ
Turquin M-J (1973) Une biocenose cavernicole originalepour le Bugey Le puits de Rappe Commptes Rendus 96eCongresse Naturel Socieacutetegraves Savantes Toulouse 1971 Sciences3 pp 235ndash256
Ugland KI Gray JS amp Ellingsen KE (2003) The species-accumulation curve and estimation of species richnessJournal of Animal Ecology 72 888ndash897
Walther BA Cotgreave P Gregory RD Price RD ampClayton DH (1995) Sampling effort and parasite speciesrichness Parasitology Today 11 306ndash310
287Effect of grain size on species richness estimators
copy 2006 The AuthorsJournal compilation copy 2006 British Ecological Society Journal of Animal Ecology 75 274ndash287
Walther BA amp Martin J-L (2001) Species richness estimationof bird communities how to control for sampling effortIbis 143 413ndash419
Walther BA amp Moore JL (2005) The definitions of biasprecision and accuracy and their use in testing the per-formance of species richness estimators with a literaturereview of estimator performance Ecography 28 815ndash829
Walther BA amp Morand S (1998) Comparative performanceof species richness estimation methods Parasitology 116395ndash405
Whittaker RJ Willis KJ amp Field R (2001) Scale andspecies richness towards a general hierarchical theory ofspecies richness Journal of Biogeography 28 453ndash470
Received 13 May 2005 accepted 11 October 2005
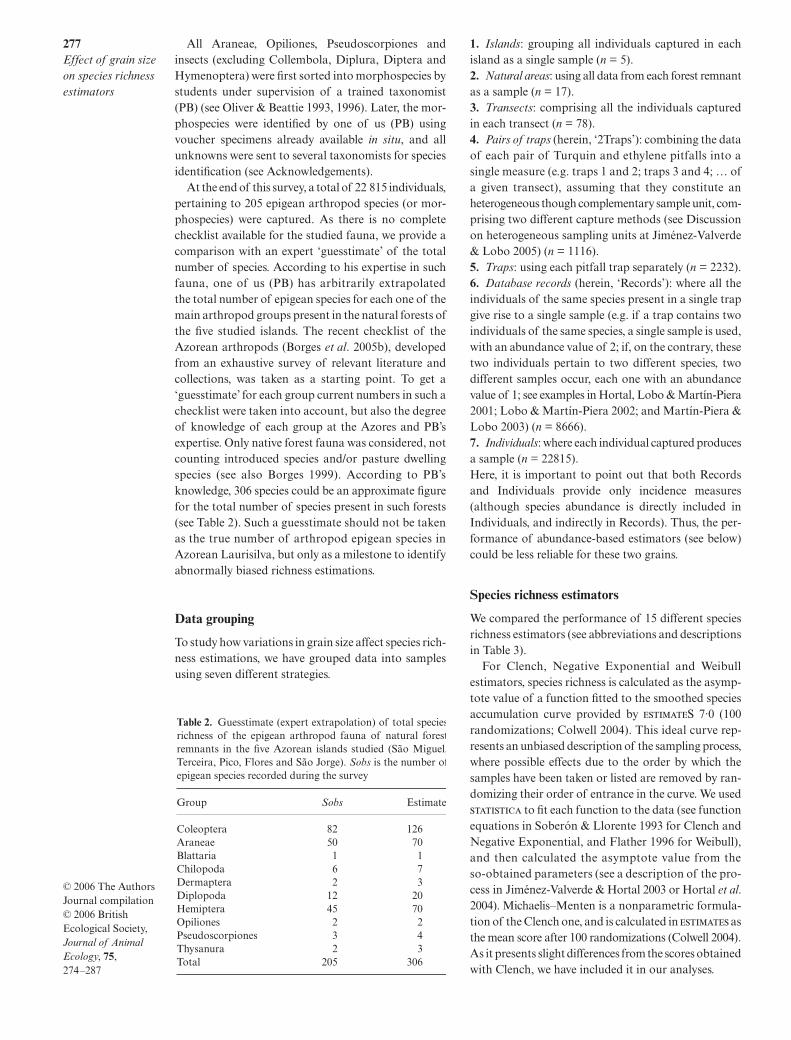
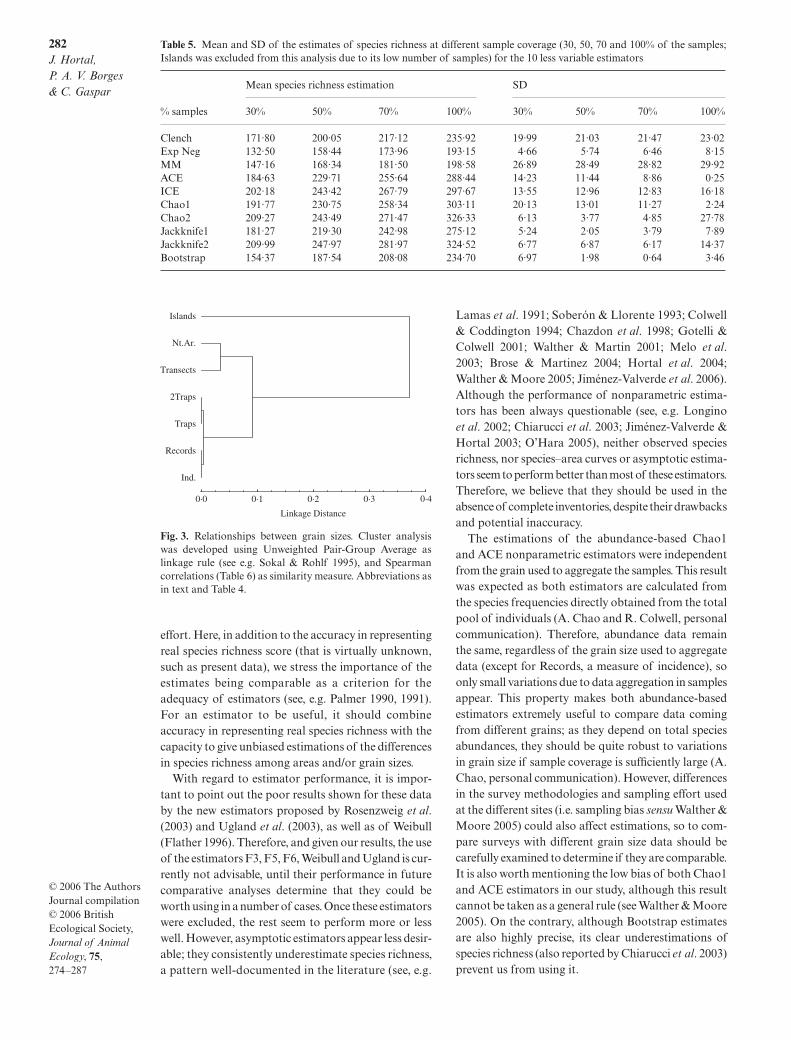