2013
Private Equity EMEA Compensation
Executive Report
3100153 - EMEA Comp Survey 2013 8.indd 1 12/06/2014 12:28
Heidrick & Struggles 2
2013 EMEA Compensation Survey
IntroductionIn March 2013 Heidrick & Struggles invited 4750 executives working in the European private equity industry to participate in an online survey of compensation. We received 561 useable responses from professionals working across the PE value chain: executives who raise and retain capital, executives who invest this capital and those who work to improve returns, as well as the CFOs, General Counsels and CHRO of their funds. This represented a response rate of 12% and we would like to take this opportunity to thank all those who completed the survey.
The largest respondent group was investment professionals (82 % of total participants), and this report focuses principally on their compensation levels and trends. We gathered significant data on some aspects of fundraising compensation and have reported on it where appropriate. For the other functional specialisations we did not record data that would allow us to analyse trends in depth.
Should you wish to discuss the survey in greater detail, please do not hesitate to contact us.
Richard Thackray Tom Thackeray Sachin SrivastavaPartner Senior Associate Research Analyst
[email protected] [email protected] [email protected]
On ConfidentialityThe survey has been conducted on an anonymous basis for the individuals and their employers and Heidrick & Struggles has kept separate the data relating to name and firm from their compensation.
3100153 - EMEA Comp Survey 2013 8.indd 2 12/06/2014 12:28
Heidrick & Struggles 3
2013 EMEA Compensation Survey
Table of ContentsIntroduction 2
Market Backdrop 4
General Observations on Compensation Trends 5
Respondents Cash Compensation Development 6
Mean Base, Bonus & Carry by Fund Size 72013 data for Investment Professionals only 7
Mean Base, Bonus & Carry for Fundraising and Investor Relations Professionals 8
Years of PE Experience & Compensation in 2013 8
Years of PE Experience & Carry 2013 9
Comparison of Compensation across Europe 10
Variation by Firm Type 11All Professionals € Thousands 11Investment Professionals only € Thousands 12
Conclusion 13
Appendix 14Respondents PE Experience Demographics 14Respondents Educational Demographics 14
3100153 - EMEA Comp Survey 2013 8.indd 3 12/06/2014 12:28
Heidrick & Struggles 4
2013 EMEA Compensation Survey
Market BackdropThe 2013 survey requested that participants provide data from 2012 and also collected data from 2011 and 2010 for some questions. Accordingly it represents an insight on the industry during a period of change. 2012 saw the end of the investment period of most 2007 vintage funds and the resultant news from the fundraising market reflected a bifurcation in the industry in Europe. A select group of funds were able to raise quickly and hit hard caps with a single close. The remainder faced varying degrees of difficulty with many withdrawing from the market.
The employment market has reflected a general contraction in the PE industry which has affected all of the key disciplines. Quite simply the demand for roles has greatly exceeded the number of new positions available.
Few sectors of the employment market have shown momentum but some themes have been present:
• A consistent demand for investment talent to move from GPs to well-funded (pension and sovereign) LP platforms as these players increase their exposure to direct private equity;
• Competition for the services of proven deal doers and fundraisers; and
• A draw for PE professionals with sophisticated credit skills away from pure equity investment platforms towards debt funds (albeit with limited success).
Accordingly we were interested to understand compensation with the industry in detail and to answer questions such as:
• How has pay developed recently?
• How does compensation compare across levels?
• What is the relationship between fund size and compensation?
• Is there variation between single strategy and multi strategy firms?
• Is there a difference between European markets in compensation?
3100153 - EMEA Comp Survey 2013 8.indd 4 12/06/2014 12:28

Heidrick & Struggles 5
2013 EMEA Compensation Survey
General Observations on Compensation Trends
Base Salary 2013 vs. 2012 Bonus 2013 vs. 2012Breakdown of Respondents Reporting
an increase in 2013 Base Salaries
No Change 347 63% Decrease
8 1%
Increase 199 36%
No Change 264 51%
Increase 195 37%
Decrease 61
12%4.02%
35.18%
51.76%
6.03%
3.02%
1 - 10%increase
11 - 20%increase
21 - 50%increase
51 -100%
increase
Morethan
100%increase
When looking at the number of respondents reporting on pay development between 2012 and 2013 the majority did not receive pay (64%) or bonus increases (63%). When compared to the overall levels of increase reported we see a clear trend: Of those that did receive increases in base pay over half were getting substantial increases of between 20% and 50% with another 9% getting increases of 50% or more. This reflects a picture of concentration, with top performers at good firms earning increasingly well.
There was an insignificant variation between data for Investment Professionals and all respondents.
It is important to note that we have recorded data from individuals showing their pay development over the past three years. It will only be in 2014 when we look at time series data will be able to establish whether Associates of 2-4 years seniority are paid more as a group versus 2013.
Please note: Respondents who have reported any of the above figures as “Not Applicable” or “Cannot Remember” have not been considered in the above analysis.
3100153 - EMEA Comp Survey 2013 8.indd 5 12/06/2014 12:28

Heidrick & Struggles 6
2013 EMEA Compensation Survey
Respondents Cash Compensation Development 2011-2013
(€’000) 2011 2012 2013
All ProfessionalsMean Base
Mean Bonus
Total Comp
Mean Base
Mean Bonus
Total Comp
Mean Base
Mean Bonus
Total Comp
CAGR Total Comp
Managing Director Level: Managing Directors, Managing Partners, Senior Partners, Partners
259.83 256.87 516.70 270.83 266.76 537.59 289.94 266.57 556.51 3.78%
Principal Level: Principals, Vice Presidents and Directors 133.17 133.33 266.51 145.81 153.18 298.98 158.53 147.28 305.81 7.12%
Associate Level: Associates and Analysts 68.13 47.78 115.91 81.62 57.46 139.08 90.00 64.96 154.96 15.62%
(€’000) 2011 2012 2013
Investment ProfessionalsMean Base
Mean Bonus
Total Comp
Mean Base
Mean Bonus
Total Comp
Mean Base
Mean Bonus
Total Comp
CAGR Total Comp
Managing Director Level 259.31 264.23 523.54 267.55 280.98 548.54 286.71 271.81 558.52 3.29%
Principal Level 131.79 134.49 266.29 145.05 154.64 299.69 159.03 150.33 309.36 7.78%
Associate Level 69.28 48.91 118.18 82.50 58.15 140.65 90.11 65.74 155.85 14.83%
There has been a marked difference in compensation development with increasing seniority. The junior echelon of Analysts and Associates saw pay rise by 14.8% CAGR from 2011 to 2013 compared to Principals at 7.8% and senior professionals at 3.3%. This probably reflects the rapidly increased utility of younger team members as they acquired new skills as well as the relatively lower cost of rewarding them more. The cash increase through period in mean total compensation of all respondents was €39k for Associates versus €40k for Principals and €40k for Managing Directors.
3100153 - EMEA Comp Survey 2013 8.indd 6 12/06/2014 12:28
Heidrick & Struggles 7
2013 EMEA Compensation Survey
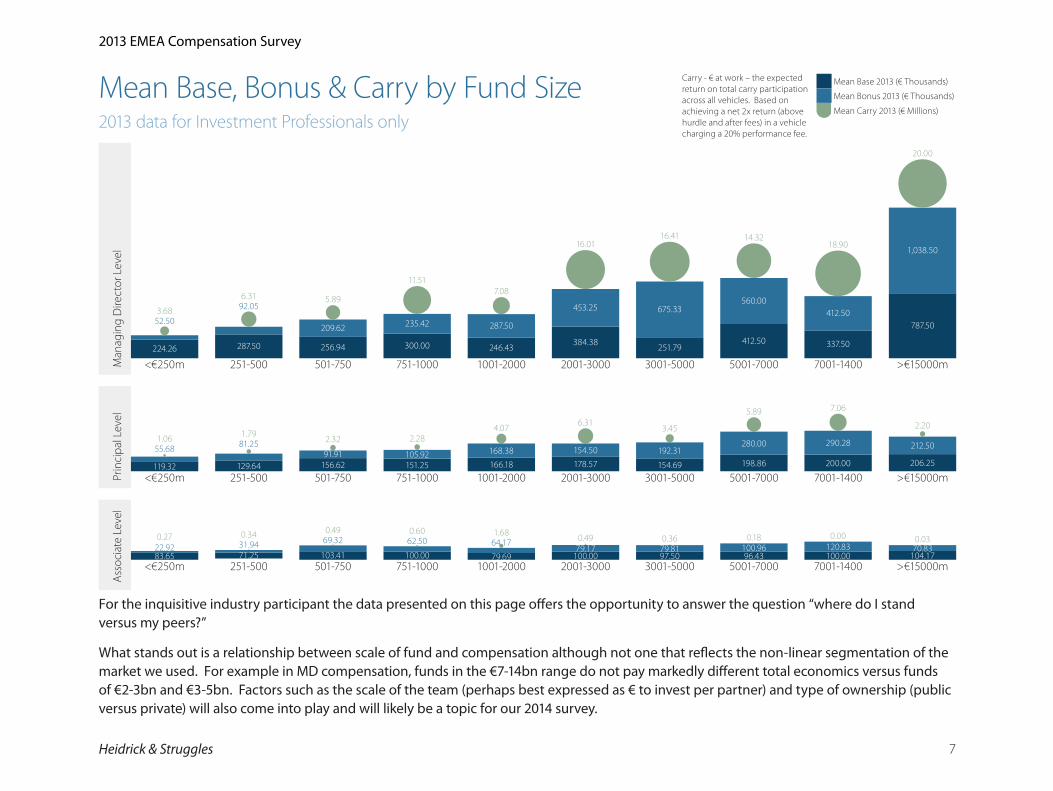
Mean Base, Bonus & Carry by Fund Size2013 data for Investment Professionals only
Man
agin
g D
irect
or L
evel
<€250m
3.68
251-500
6.31
501-750
5.89
751-1000
11.51
1001-2000
7.08
2001-3000
16.01
3001-5000
16.41
5001-7000
14.32
7001-1400
18.90
>€15000m
20.00
224.26 287.50 256.94 300.00 246.43384.38 251.79
412.50 337.50
787.5052.50
92.05
209.62 235.42 287.50
453.25 675.33560.00
412.50
1,038.50
Prin
cipa
l Lev
el
1.06 1.79 2.32 2.284.07 6.31
3.45
5.89 7.06
2.20
119.32 129.64 156.62 151.25 166.18 178.57 154.69 198.86 200.00 206.25
55.68 81.2591.91 105.92 168.38 154.50 192.31
280.00 290.28 212.50
<€250m 251-500 501-750 751-1000 1001-2000 2001-3000 3001-5000 5001-7000 7001-1400 >€15000m
Ass
ocia
te L
evel
0.27 0.34 0.49 0.60 1.68 0.49 0.36 0.18 0.030.00
83.65 71.25 103.41 100.00 79.69 100.00 97.50 96.43 100.00 104.1722.92 31.94 69.32 62.50 64.17
79.17 79.81 100.96 120.83 70.83
<€250m 251-500 501-750 751-1000 1001-2000 2001-3000 3001-5000 5001-7000 7001-1400 >€15000m
For the inquisitive industry participant the data presented on this page offers the opportunity to answer the question “where do I stand versus my peers?”
What stands out is a relationship between scale of fund and compensation although not one that reflects the non-linear segmentation of the market we used. For example in MD compensation, funds in the €7-14bn range do not pay markedly different total economics versus funds of €2-3bn and €3-5bn. Factors such as the scale of the team (perhaps best expressed as € to invest per partner) and type of ownership (public versus private) will also come into play and will likely be a topic for our 2014 survey.
Carry - € at work – the expected return on total carry participation across all vehicles. Based on achieving a net 2x return (above hurdle and after fees) in a vehicle charging a 20% performance fee.
Mean Base 2013 (€ Thousands)
Mean Bonus 2013 (€ Thousands)
Mean Carry 2013 (€ Millions)
3100153 - EMEA Comp Survey 2013 8.indd 7 12/06/2014 12:28
Heidrick & Struggles 8
2013 EMEA Compensation Survey
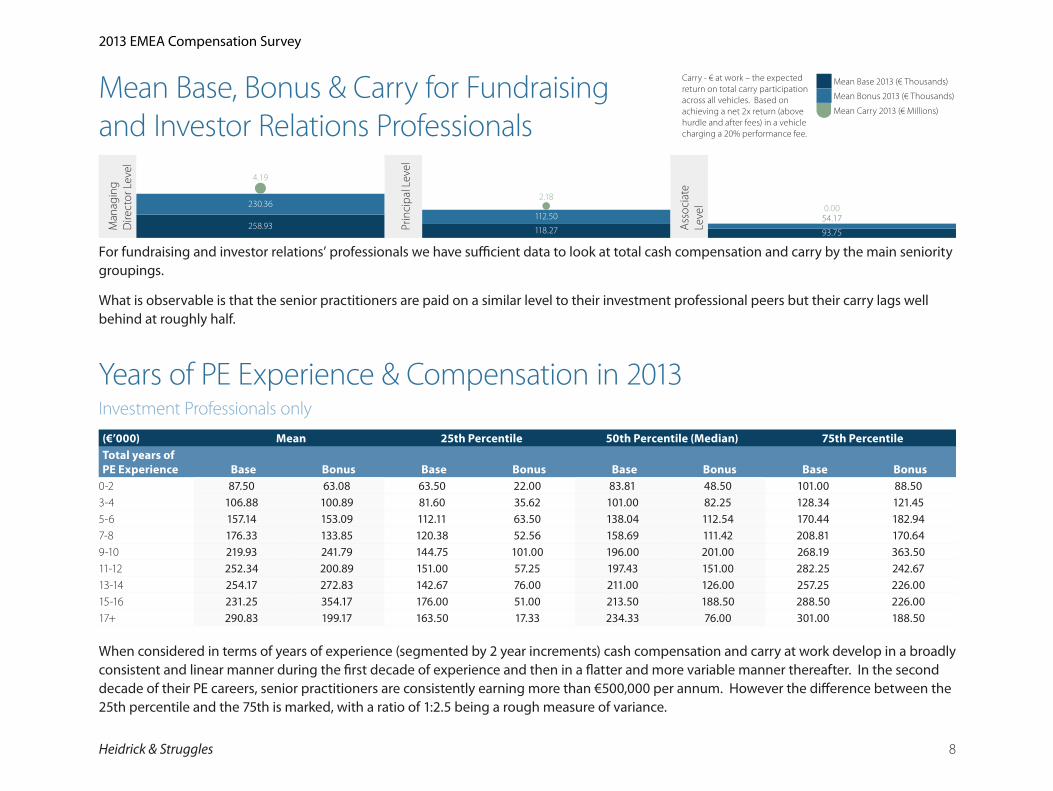
Mean Base, Bonus & Carry for Fundraising and Investor Relations Professionals
Man
agin
g D
irect
or L
evel
258.93
230.36
4.19
Prin
cipa
l Lev
el
2.18
118.27
112.50
Ass
ocia
te
Leve
l
93.75
54.170.00
For fundraising and investor relations’ professionals we have sufficient data to look at total cash compensation and carry by the main seniority groupings.
What is observable is that the senior practitioners are paid on a similar level to their investment professional peers but their carry lags well behind at roughly half.
Years of PE Experience & Compensation in 2013Investment Professionals only
(€’000) Mean 25th Percentile 50th Percentile (Median) 75th PercentileTotal years of PE Experience Base Bonus Base Bonus Base Bonus Base Bonus
0-2 87.50 63.08 63.50 22.00 83.81 48.50 101.00 88.503-4 106.88 100.89 81.60 35.62 101.00 82.25 128.34 121.455-6 157.14 153.09 112.11 63.50 138.04 112.54 170.44 182.947-8 176.33 133.85 120.38 52.56 158.69 111.42 208.81 170.649-10 219.93 241.79 144.75 101.00 196.00 201.00 268.19 363.5011-12 252.34 200.89 151.00 57.25 197.43 151.00 282.25 242.6713-14 254.17 272.83 142.67 76.00 211.00 126.00 257.25 226.0015-16 231.25 354.17 176.00 51.00 213.50 188.50 288.50 226.0017+ 290.83 199.17 163.50 17.33 234.33 76.00 301.00 188.50
When considered in terms of years of experience (segmented by 2 year increments) cash compensation and carry at work develop in a broadly consistent and linear manner during the first decade of experience and then in a flatter and more variable manner thereafter. In the second decade of their PE careers, senior practitioners are consistently earning more than €500,000 per annum. However the difference between the 25th percentile and the 75th is marked, with a ratio of 1:2.5 being a rough measure of variance.
Carry - € at work – the expected return on total carry participation across all vehicles. Based on achieving a net 2x return (above hurdle and after fees) in a vehicle charging a 20% performance fee.
Mean Base 2013 (€ Thousands)
Mean Bonus 2013 (€ Thousands)
Mean Carry 2013 (€ Millions)
3100153 - EMEA Comp Survey 2013 8.indd 8 12/06/2014 12:28
Heidrick & Struggles 9
2013 EMEA Compensation Survey
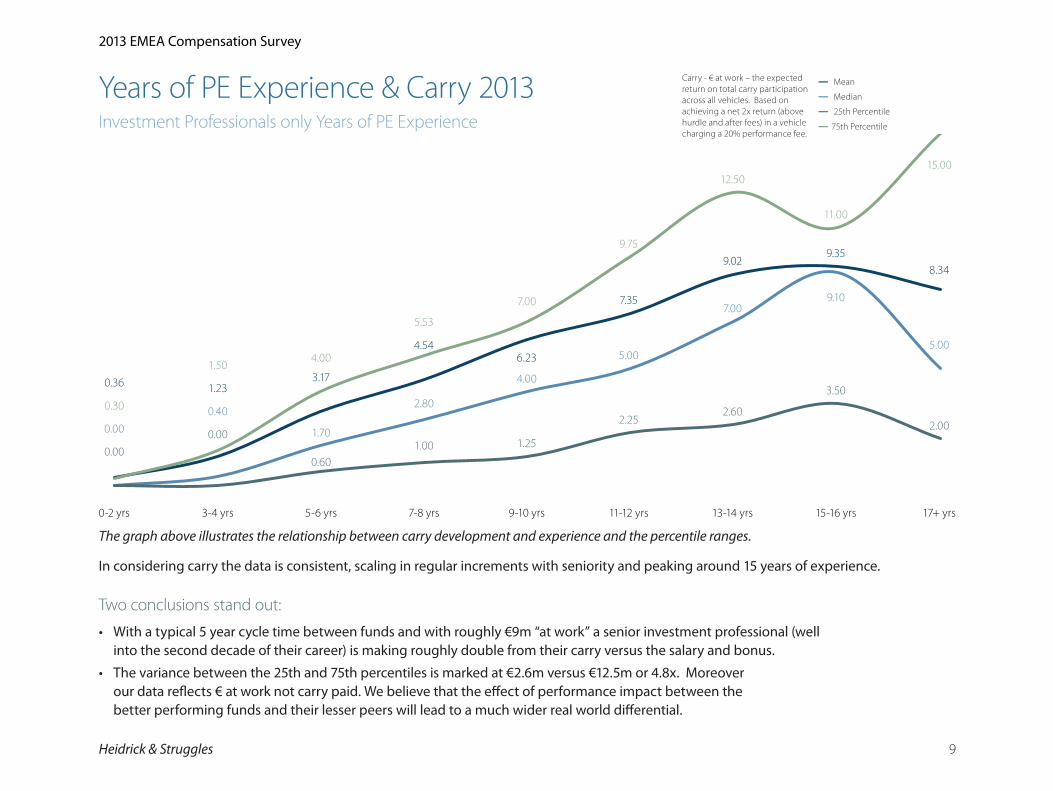
Years of PE Experience & Carry 2013Investment Professionals only Years of PE Experience
0.36 1.233.17
4.546.23
7.35
9.029.35
8.34
0.000.40
1.70
2.80
4.00
5.00
7.009.10
5.00
0.000.00
0.601.00 1.25
2.252.60
3.50
2.00
0.30
1.504.00
5.53
7.00
9.75
12.50
11.00
15.00
0-2 yrs 3-4 yrs 5-6 yrs 7-8 yrs 9-10 yrs 11-12 yrs 13-14 yrs 15-16 yrs 17+ yrs
The graph above illustrates the relationship between carry development and experience and the percentile ranges.
In considering carry the data is consistent, scaling in regular increments with seniority and peaking around 15 years of experience.
Two conclusions stand out:
• With a typical 5 year cycle time between funds and with roughly €9m “at work” a senior investment professional (well into the second decade of their career) is making roughly double from their carry versus the salary and bonus.
• The variance between the 25th and 75th percentiles is marked at €2.6m versus €12.5m or 4.8x. Moreover our data reflects € at work not carry paid. We believe that the effect of performance impact between the better performing funds and their lesser peers will lead to a much wider real world differential.
Carry - € at work – the expected return on total carry participation across all vehicles. Based on achieving a net 2x return (above hurdle and after fees) in a vehicle charging a 20% performance fee.
— Mean
— Median
— 25th Percentile
— 75th Percentile
3100153 - EMEA Comp Survey 2013 8.indd 9 12/06/2014 12:28
Heidrick & Struggles 10
2013 EMEA Compensation Survey
France
Benelux
Germany
MD
Prin
cipa
l
Asso
ciat
e
Mean Bonus 2013
Mean Base 2013
Total Comp with ref to that of UK
Nordics
62 82 95
UnitedKingdom
100
100
100
Spain
53 58 80
107
87 7214
2
66 65
81 98 85
Italy
NA
95 28
Central &EasternEurope
68 78 70
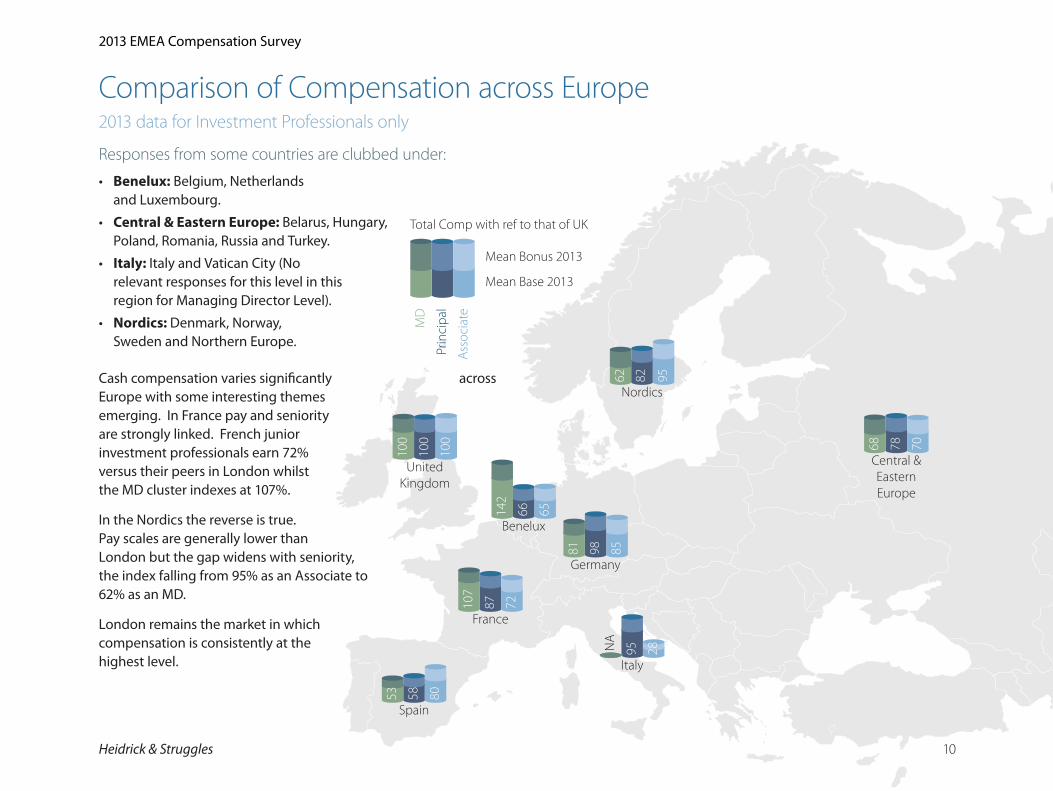
Comparison of Compensation across Europe2013 data for Investment Professionals only
Responses from some countries are clubbed under:
• Benelux: Belgium, Netherlands and Luxembourg.
• Central & Eastern Europe: Belarus, Hungary, Poland, Romania, Russia and Turkey.
• Italy: Italy and Vatican City (No relevant responses for this level in this region for Managing Director Level).
• Nordics: Denmark, Norway, Sweden and Northern Europe.
Cash compensation varies significantly across Europe with some interesting themes emerging. In France pay and seniority are strongly linked. French junior investment professionals earn 72% versus their peers in London whilst the MD cluster indexes at 107%.
In the Nordics the reverse is true. Pay scales are generally lower than London but the gap widens with seniority, the index falling from 95% as an Associate to 62% as an MD.
London remains the market in which compensation is consistently at the highest level.
3100153 - EMEA Comp Survey 2013 8.indd 10 12/06/2014 12:28

Heidrick & Struggles 11
2013 EMEA Compensation Survey
France
Benelux
Germany
MD
Prin
cipa
l
Asso
ciat
e
Mean Bonus 2013
Mean Base 2013
Total Comp with ref to that of UK
Nordics
62 82 95
UnitedKingdom
100
100
100
Spain
53 58 80
107
87 7214
2
66 65
81 98 85
Italy
NA
95 28
Central &EasternEurope
68 78 70
Variation by Firm TypeAll Professionals € Thousands
Man
agin
g D
irect
or L
evel
Single Strategy Firm Multi Strategy Firm
2011 2012 2013 2011 2012 2013
274.11 283.09 308.97230.45 241.35 253.75
239.14 247.35 235.80315.06 326.60 355.26
Prin
cipa
l Lev
el
Single Strategy Firm Multi Strategy Firm
2011 2012 2013 2011 2012 2013
132.67 145.79 158.26 137.11 148.44 162.89
129.32 150.98 149.81 155.47 172.27 147.34
Ass
ocia
te L
evel
Single Strategy Firm Multi Strategy Firm
2011 2012 2013 2011 2012 201369.83 82.50 90.90 63.43 76.38 84.97
53.25 63.44 70.3936.50 47.84 55.77
The data compiled here focuses on the differences between single and multi-strategy firms. A single strategy firm would encompass a typical General Partner structure and a multi-strategy could cover a large public alternative asset management firm as well businesses combing principal investing with fund and secondary investing.
Mean Base 2013 (€ Thousands)
Mean Bonus 2013 (€ Thousands)
3100153 - EMEA Comp Survey 2013 8.indd 11 12/06/2014 12:28
Heidrick & Struggles 12
2013 EMEA Compensation Survey
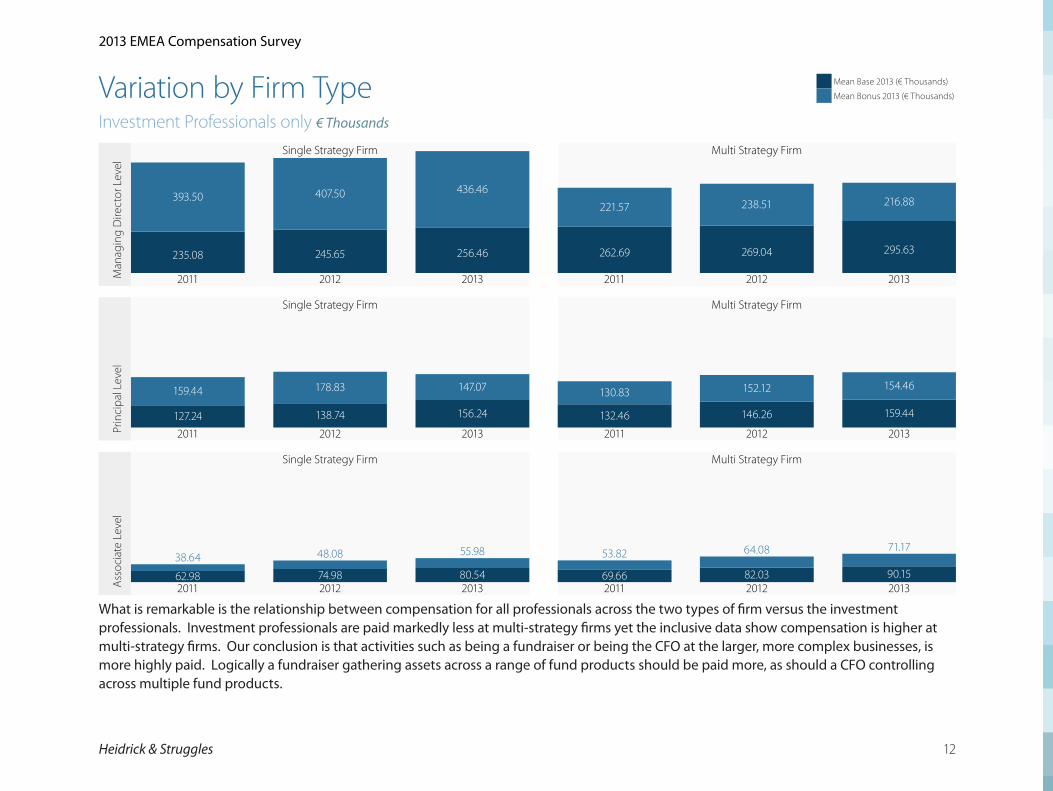
Variation by Firm TypeInvestment Professionals only € Thousands
Man
agin
g D
irect
or L
evel
Single Strategy Firm Multi Strategy Firm
2011 2012 2013 2011 2012 2013
235.08 245.65 256.46 262.69 269.04 295.63
393.50 407.50 436.46
221.57 238.51 216.88
Prin
cipa
l Lev
el
Single Strategy Firm Multi Strategy Firm
2011 2012 2013 2011 2012 2013127.24 138.74 156.24 132.46 146.26 159.44
159.44 178.83 147.07 130.83 152.12 154.46
Ass
ocia
te L
evel
Single Strategy Firm Multi Strategy Firm
2011 2012 2013 2011 2012 201362.98 74.98 80.54 69.66 82.03 90.1538.64 48.08 55.98 53.82 64.08 71.17
What is remarkable is the relationship between compensation for all professionals across the two types of firm versus the investment professionals. Investment professionals are paid markedly less at multi-strategy firms yet the inclusive data show compensation is higher at multi-strategy firms. Our conclusion is that activities such as being a fundraiser or being the CFO at the larger, more complex businesses, is more highly paid. Logically a fundraiser gathering assets across a range of fund products should be paid more, as should a CFO controlling across multiple fund products.
Mean Base 2013 (€ Thousands)
Mean Bonus 2013 (€ Thousands)
3100153 - EMEA Comp Survey 2013 8.indd 12 12/06/2014 12:28

ConclusionOverall the results have been broadly consistent with our expectations. The industry rewards durability and the consistent building of skills and experience. Private Equity is an “endurance team sport” and being part of the right team is critical. Unsurprisingly scale matters, but working in a firm which fits into the upper quartile of its sector is also highly important for annual compensation and critical for carry grants.
The most positive result we see from the data is the on-going importance of carry for the industry: Senior professionals are still generating the majority of their compensation through carry and it gives the opportunity for significant wealth creation. Its payment is aligned with investors and despite often reported concerns related to a shift in emphasis to management fee and accordingly annual compensation our results indicate a different picture.
3100153 - EMEA Comp Survey 2013 8.indd 13 12/06/2014 12:28
Heidrick & Struggles 14
2013 EMEA Compensation Survey
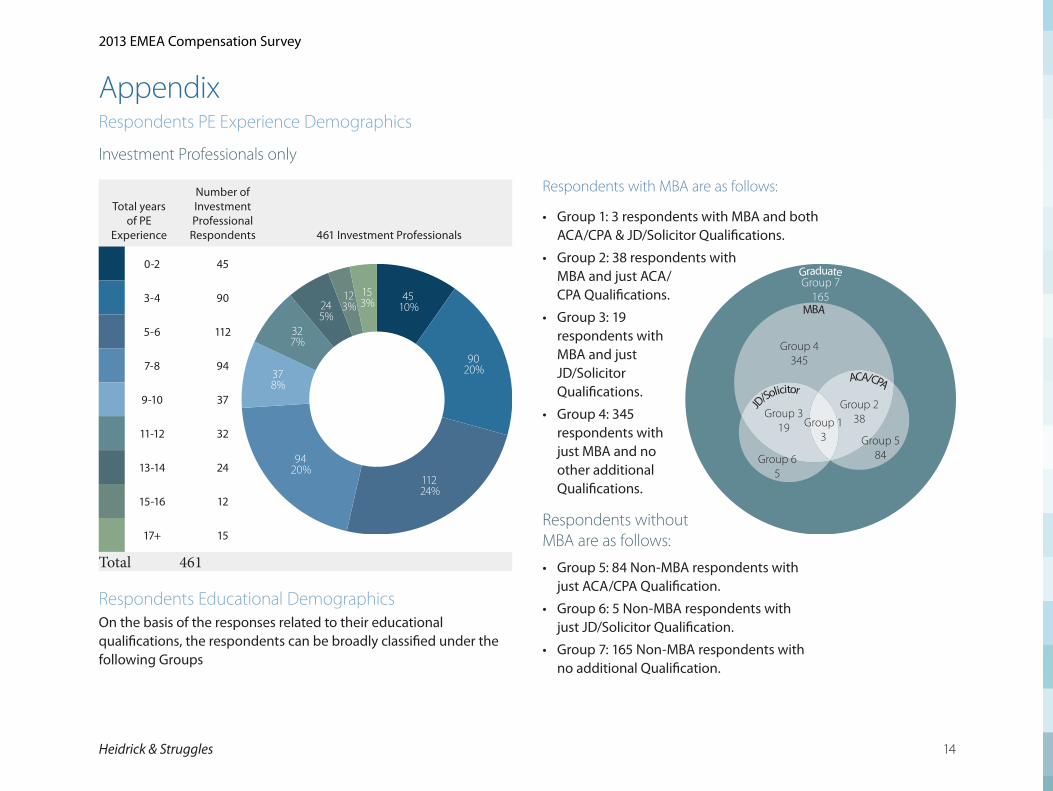
Respondents with MBA are as follows:
• Group 1: 3 respondents with MBA and both ACA/CPA & JD/Solicitor Qualifications.
• Group 2: 38 respondents with MBA and just ACA/CPA Qualifications.
• Group 3: 19 respondents with MBA and just JD/Solicitor Qualifications.
• Group 4: 345 respondents with just MBA and no other additional Qualifications.
Respondents without MBA are as follows:
• Group 5: 84 Non-MBA respondents with just ACA/CPA Qualification.
• Group 6: 5 Non-MBA respondents with just JD/Solicitor Qualification.
• Group 7: 165 Non-MBA respondents with no additional Qualification.
AppendixRespondents PE Experience Demographics
Investment Professionals only
Total years of PE
Experience
Number of Investment Professional
Respondents 461 Investment Professionals
0-2 45
4510%
9020%
11224%
9420%
378%
327%
245%
123%
153%3-4 90
5-6 112
7-8 94
9-10 37
11-12 32
13-14 24
15-16 12
17+ 15
Total 461
Respondents Educational DemographicsOn the basis of the responses related to their educational qualifications, the respondents can be broadly classified under the following Groups
GraduateGraduate
MBA
JD/Sol
icitorACA/CPA
Group 4345
Group 319
Group 238
Group 584Group 6
5
Group 7165
Group 13
3100153 - EMEA Comp Survey 2013 8.indd 14 12/06/2014 12:28

Heidrick & Struggles is the premier provider of senior-level Executive Search, Culture Shaping and Leadership Consulting services. For more than 60 years we have focused on quality service and built strong relationships with clients and individuals worldwide. Today, Heidrick & Struggles leadership experts operate from principal business centers globally.
www.heidrick.com
Copyright ©2014 Heidrick & Struggles International, Inc.All rights reserved. Reproduction without permission is prohibited. Trademarks and logos are copyrights of their respective owners.
3100153
Richard Thackray
Partner
Phone: +44 20 7075 4224
Email: [email protected]
Tom Thackeray
Senior Associate
Phone: +44 20 7075 4332
Email: [email protected]
Sachin Srivastava
Senior Research Analyst
Email: [email protected]
3100153 - EMEA Comp Survey 2013 8.indd 15 12/06/2014 12:28
Recommended