Embed Size (px)
Citation preview

2013Private equity portfolio company stock compensation survey
Driving portfolio company performance in a changing private equity environment


Table of contents
3
The heart of the matter 4
Aligning rewards with performance
An in-depth discussion 6
Detailed survey resultsStock compensation plan: Vehicles and award levelsShare reserve poolsKey plan terms
What this means for your business 16
A successful rewards program requires critical consideration of the behaviors and outcomes that you are trying to drive
2013 private equity portfolio company stock compensation survey

The heart of the matter
Aligning rewards with performance

5
Is your management equity plan driving behavior towards a successful exit? The size of the share reserve is only the first step.
US private equity funds face an increas-ingly competitive investment market. During the period 2010–2012, the number of deals has decreased by ~25% when compared to pre-financial crisis levels. At the same time, it is estimated that global PE funds still have over $400b reserved for lever-aged buyouts. The combination of these factors has generally resulted in more competitive auction processes for buyout firms, requiring sponsors to be competitive when determining management awards.
Our survey of US-based private equity funds contains critical market data on how US PE funds structure the equity-based incentive plans at their portfolio companies. While the amount of equity reserved for management has generally held constant since our last survey (conducted in 2008), funds are finding new ways to align interests of management with investors and drive performance through increased use of exit-based performance awards. Additionally, there is increased focus on who should participate and how funds communicate the value of the plan.
Financial sponsors continue to further the link between management and investor incentives by tying a greater portion of awards to exit-based performance conditions.
PwC’s 2013 US Private Equity Portfolio Company Stock Compensation Survey highlights practices and trends in equity compensation design among US-based private equity firms. This year’s survey includes data on 30 US-based portfolio companies acquired by 17 different sponsors since January 2010.
Survey highlights
At the median, firms are reserving 10% of fully-diluted equity for manage-ment incentives. Share reserves range from 4.5% to 17% and are generally inversely related to the size of the sponsor’s equity investment. The top five executives generally receive almost half of the share reserve.
Stock options continue to be the most prevalent form of equity compensation used by private equity funds. Those portfolio companies structured as partnerships are issuing profits inter-ests to take advantage of capital gains tax rates.
Equity participation stretches further down into organizations than histori-cally seen with the second and third layer of management regularly receiving grants.
Performance-based vesting condi-tions comprise a majority of the equity awards for most portfolio companies. PE firms generally require 50–75% of the total award be tied to the sponsor’s financial return realized upon exit.
Sponsors generally do not have a formal process for determining grant sizes, which has resulted in variability of practices and payouts which may be in excess of competitive practice. Most sponsors rely on an internal bench-marking approach of terms imple-mented at other recent acquisitions.
2013 private equity portfolio company stock compensation survey

An in-depth discussion
Detailed survey results

7
Stock compensation plan: Vehicles and award levels
Management investment
PE firms generally require a meaningful investment by management.
A meaningful management invest-ment is viewed as a “table stakes” issue for financial sponsors. A number of participants indicated they have walked away from a deal because the management team was unwilling to make a significant investment along-side the financial sponsor.
In over 80% of the companies surveyed, management invested a portion of their sale proceeds in NewCo. Most commonly, executives were required to invest 20–50% of pre-tax proceeds in NewCo equity, with the CEO often investing at (or above) the 50% level. Based on our discussions, in those instances when management did not make a material equity investment, it was largely due to lack of transaction proceeds which could be reinvested. This can be particularly true for carve-out transactions where long-term incentive awards are often forfeited upon consummation of the deal.
Award vehicles
Awards inherently tied to the equity growth of the company (such as options and profits interests) remain the primary vehicle for financial sponsors.
Similar to our findings in the 2008 survey, US funds continue to rely on ‘nil cost, upside only’ equity awards as over 90% of plans use stock options or profits interests as the primary incentive type. PE funds have continued to avoid using restricted stock as the primary equity award vehicle because of a combination of US tax treatment and valuation constraints that have made restricted stock unattractive. Specifically, even where firms utilize a dual equity structure (i.e., preferred /common),
the valuation of the common stock is sufficiently high that executives are reluctant to make IRC Section 83(b) elections (which would take into income the value of the grant upon issuance and therefore the compensatory element of the award). Absent an 83(b) election the taxation of restricted shares occurs at vesting at increasingly higher values forcing employees to pay tax without liquidity. While companies can withhold shares to fund their tax withholding obligation, the statutory minimum withholding rate of 25% typically leaves the participant with the responsibility to fund any shortfalls, which can be close to 20% given the recent increase in the highest marginal rate and phase outs of itemized deductions.
Stock options70%
Other7%
Profits interests23%
2013 private equity portfolio company stock compensation survey
8 2013 private equity portfolio company stock compensation survey
Share reserve pools
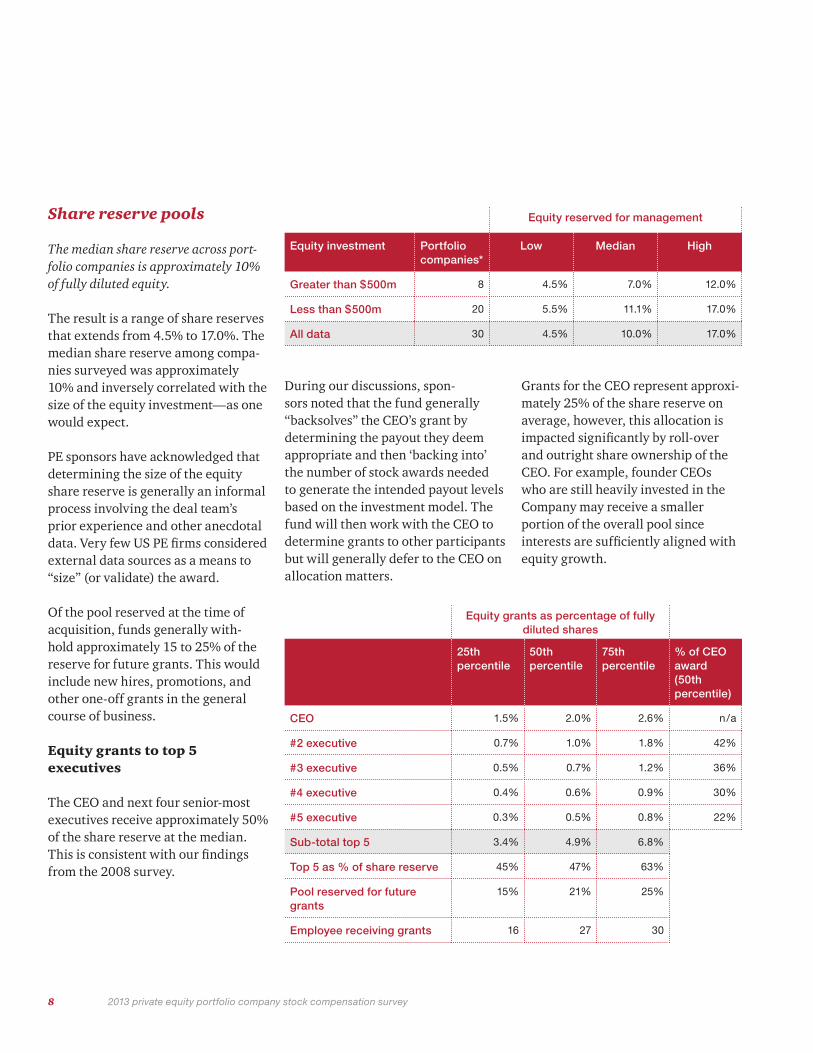
The median share reserve across port-folio companies is approximately 10% of fully diluted equity.
The result is a range of share reserves that extends from 4.5% to 17.0%. The median share reserve among compa-nies surveyed was approximately 10% and inversely correlated with the size of the equity investment—as one would expect.
PE sponsors have acknowledged that determining the size of the equity share reserve is generally an informal process involving the deal team’s prior experience and other anecdotal data. Very few US PE firms considered external data sources as a means to “size” (or validate) the award.
Of the pool reserved at the time of acquisition, funds generally with-hold approximately 15 to 25% of the reserve for future grants. This would include new hires, promotions, and other one-off grants in the general course of business.
Equity grants to top 5 executives
The CEO and next four senior-most executives receive approximately 50% of the share reserve at the median. This is consistent with our findings from the 2008 survey.
During our discussions, spon-sors noted that the fund generally “backsolves” the CEO’s grant by determining the payout they deem appropriate and then ‘backing into’ the number of stock awards needed to generate the intended payout levels based on the investment model. The fund will then work with the CEO to determine grants to other participants but will generally defer to the CEO on allocation matters.
Grants for the CEO represent approxi-mately 25% of the share reserve on average, however, this allocation is impacted significantly by roll-over and outright share ownership of the CEO. For example, founder CEOs who are still heavily invested in the Company may receive a smaller portion of the overall pool since interests are sufficiently aligned with equity growth.
Equity reserved for management
Equity investment Portfolio companies*
Low Median High
Greater than $500m 8 4.5% 7.0% 12.0%
Less than $500m 20 5.5% 11.1% 17.0%
All data 30 4.5% 10.0% 17.0%
Equity grants as percentage of fully diluted shares
25th percentile
50th percentile
75th percentile
% of CEO award (50th percentile)
CEO 1.5% 2.0% 2.6% n/a
#2 executive 0.7% 1.0% 1.8% 42%
#3 executive 0.5% 0.7% 1.2% 36%
#4 executive 0.4% 0.6% 0.9% 30%
#5 executive 0.3% 0.5% 0.8% 22%
Sub-total top 5 3.4% 4.9% 6.8%
Top 5 as % of share reserve 45% 47% 63%
Pool reserved for future grants
15% 21% 25%
Employee receiving grants 16 27 30

9
Vesting conditions
Funds continue to tie vesting to perfor-mance, granting 50–75% of awards with performance vesting conditions.
Private equity funds show a clear pref-erence for performance-based vesting as nearly 80% of those surveyed utilize performance-based vesting conditions on a meaningful portion of an individual’s equity awards. The larger the equity investment, the more likely that a sponsor would attach vesting conditions to equity awards.
At the median, those companies with performance-based vesting condi-tions are tying approximately 65% of award value to such awards. The most common split among participants is to provide either 25% or 33% of award value with time-based vesting conditions and attach performance vesting conditions to the remainder of awards. This trend is consistent with long-term incentive grants to execu-tives at public companies, which have seen a shift from time-vesting awards to performance-based vesting awards according to PwC’s 2011 Global Equity Incentives survey.
Performance metrics
Of the companies with performance-based vesting criteria, ~65% used exit-based performance metrics such as a Multiple of Invested Capital (MOIC) or Internal Rate of Return (or a combination of both). Approximately 35% of those compa-nies with performance-based vesting criteria used a combination of annual financial targets (e.g., EBITDA) and exit-based metrics to determine vesting under the plan.
Combinationtime and performance70%
Performance-based only8%
Time-based only23%
2013 private equity portfolio company stock compensation survey

10 2013 private equity portfolio company stock compensation survey
Choosing the right performance metric is critical to aligning the incentives of management and the finan-cial sponsor. It should come as no surprise that PE firms have historically been partial to internal rate of return (IRR) metrics. Following the financial crisis, which resulted in longer holding periods and therefore lower IRRs, an increasing number of financial sponsors have shifted to using a Multiple of Invested Capital (MOIC) metric as the primary return measure. However, isolating any one metric can yield sub-optimal results for either management or the financial sponsor.
The table below shows the correlation between IRR in the year of exit and the MOIC achieved at such exit date. The gray line illustrates a hypothetical vesting threshold for performance based awards at a MOIC of 2.5× original investment.
Sponsors should therefore consider structuring awards to include both IRR and MOIC performance hurdles. For example, using MOIC as the key return measure but having a minimum IRR threshold in order to vest. This can create better alignment between management and investor.
Choosing the right metric
IRR in year of exit
MOIC 1 2 3 4 5 6 7 8 9 10
1.00 0% 0% 0% 0% 0% 0% 0% 0% 0% 0%
1.25 25% 12% 8% 6% 5% 4% 3% 3% 3% 2%
1.50 50% 22% 14% 11% 8% 7% 6% 5% 5% 4%
1.75 75% 32% 21% 15% 12% 10% 8% 7% 6% 6%
2.00 100% 41% 26% 19% 15% 12% 10% 9% 8% 7%
2.25 125% 50% 31% 22% 18% 14% 12% 11% 9% 8%
2.50 150% 58% 36% 26% 20% 16% 14% 12% 11% 10%
2.75 175% 66% 40% 29% 22% 18% 16% 13% 12% 11%
3.00 200% 73% 44% 32% 25% 20% 17% 15% 13% 12%
3.25 225% 80% 48% 34% 27% 22% 18% 16% 14% 13%
3.50 250% 87% 52% 37% 28% 23% 20% 17% 15% 13%
Achieving a MOIC of 3.0× after 5 years results in an IRR of 25%, an outcome that is likely desirable to the sponsor and would result in full vesting under the plan.
However, a MOIC of 3.0× after 9 years results in an IRR of ~13%. In this scenario, awards may vest though performance falls short of the sponsor’s expectation.
11 2013 private equity portfolio company stock compensation survey
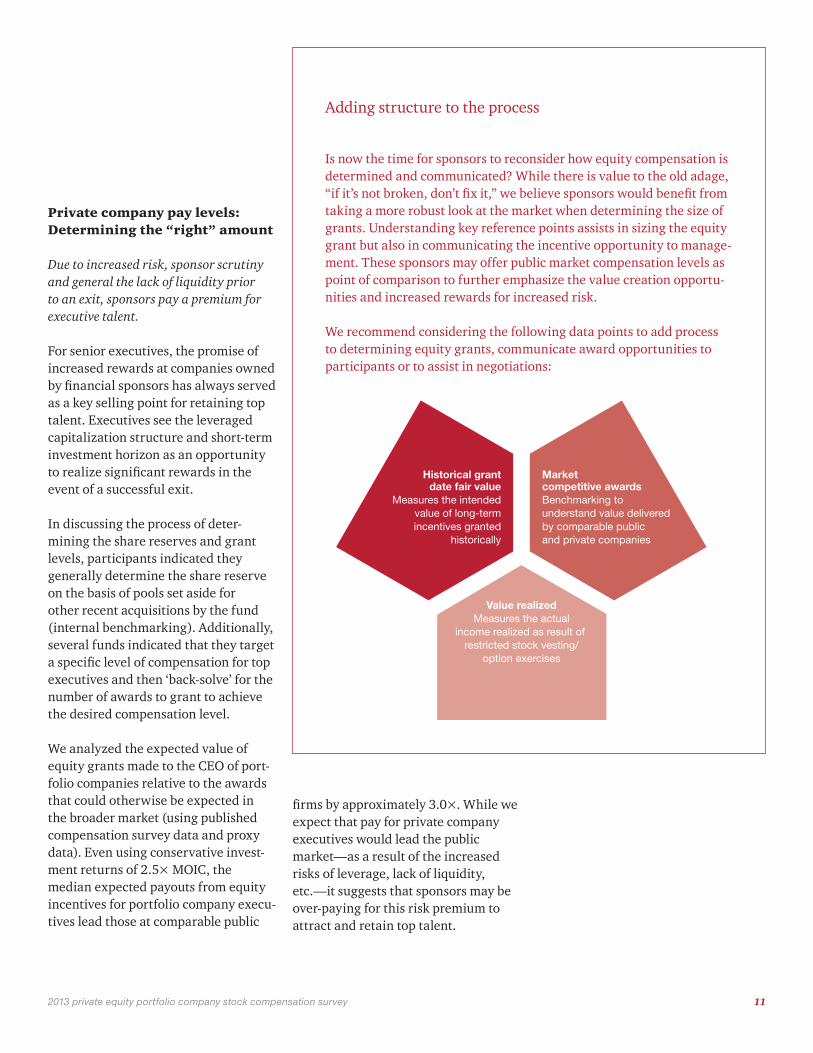
Is now the time for sponsors to reconsider how equity compensation is determined and communicated? While there is value to the old adage, “if it’s not broken, don’t fix it,” we believe sponsors would benefit from taking a more robust look at the market when determining the size of grants. Understanding key reference points assists in sizing the equity grant but also in communicating the incentive opportunity to manage-ment. These sponsors may offer public market compensation levels as point of comparison to further emphasize the value creation opportu-nities and increased rewards for increased risk.
We recommend considering the following data points to add process to determining equity grants, communicate award opportunities to participants or to assist in negotiations:
Adding structure to the process
Private company pay levels: Determining the “right” amount
Due to increased risk, sponsor scrutiny and general the lack of liquidity prior to an exit, sponsors pay a premium for executive talent.
For senior executives, the promise of increased rewards at companies owned by financial sponsors has always served as a key selling point for retaining top talent. Executives see the leveraged capitalization structure and short-term investment horizon as an opportunity to realize significant rewards in the event of a successful exit.
In discussing the process of deter-mining the share reserves and grant levels, participants indicated they generally determine the share reserve on the basis of pools set aside for other recent acquisitions by the fund (internal benchmarking). Additionally, several funds indicated that they target a specific level of compensation for top executives and then ‘back-solve’ for the number of awards to grant to achieve the desired compensation level.
We analyzed the expected value of equity grants made to the CEO of port-folio companies relative to the awards that could otherwise be expected in the broader market (using published compensation survey data and proxy data). Even using conservative invest-ment returns of 2.5× MOIC, the median expected payouts from equity incentives for portfolio company execu-tives lead those at comparable public
firms by approximately 3.0×. While we expect that pay for private company executives would lead the public market—as a result of the increased risks of leverage, lack of liquidity, etc.—it suggests that sponsors may be over-paying for this risk premium to attract and retain top talent.
Historical grantdate fair value
Measures the intendedvalue of long-termincentives granted
historically
Value realizedMeasures the actual
income realized as result of restricted stock vesting/
option exercises
Marketcompetitive awardsBenchmarking to understand value deliveredby comparable publicand private companies

12 2013 private equity portfolio company stock compensation survey
Plan participation
Although most funds deferred participa-tion decisions to the CEO, some sponsors question whether all participants appre-ciate the value of the plans in their search to maximize the effectiveness of awards.
Most funds indicated that they give the CEO discretion to select participants in the equity pool. In general, those invest-ments with higher margins (e.g., profes-sional services, IT) tend to have larger share reserves and participation bases.
Though the sample is limited, among the professional and business services firms the average share reserve was 13% of fully diluted equity and partici-pation was approximately 3.1% of the employee base. For those industries with lower margins such as manufac-turing and retail/consumer business, the average reserve was approxi-mately 9% of shares and only 1.7% of employees participate.
At the median, there are approximately 27 participants in equity plans which generally reflects the CEO’s direct reports and the next layer of critical value drivers within the organization.
Based on the data, it is clear that a subset of respondents is effectively limiting participation to the first tier of leadership (and perhaps a handful of other key contributors) with about
15 participants. Additionally, the data confirmed our expectations that companies rarely push equity deep within the organization and tend to concentrate participation among the top two–three tiers of management, with only a handful of organizations including more than 30 participants. Within our discussions, fund profes-sionals expressed concern whether the last entrants appropriately valued equity plan participation as wealth.
Non-participating employees (middle management)
Financial sponsors are often chal-lenged with whether to compensate the employee population who had historically participated in long-term incentive plans but may not usually be eligible for equity awards under
Matching economic value with perceived value
One approach to increasing the perceived value of the overall rewards program is to deliver cash to certain participants who may value it more than the equity. This approach involves applying a greater degree of scrutiny on the ‘last participants into’ the equity compensation plans. Funds should consider whether they can deliver more value to certain participants (who prefer the cash awards) without giving away as much equity and economic value. In this scenario, the benefit is maximized for all parties.
rewards structures for PE-backed companies. Historically, sponsors generally did not make accommoda-tions for these employees. However, we see an increasing trend of changing total rewards for certain groups of key employees post-transactions.
Those funds who take action generally implement an extra bonus structure or supplemental pool for certain key employees who will not participate in the equity plan. Funds indicated that these pools are generally not extended to all employees who participated historically, but rather are focused on critical functions or roles.

13 2013 private equity portfolio company stock compensation survey
While non-cash stock compensation expenses are generally added back to earnings during the diligence process, funds should consider the likelihood of imple-menting any ‘replacement’ plans post-transaction. Expenses related to these cash plans should ideally be included in the deal model, even if the exact details of the plan are known during diligence.
The schedule below shows how a sponsor may bifur-cate a target company’s population consider future equity and long-term incentives.
Consider your population
Average grant date fair value of equity awards by individual
Grade Average salary ($)
Number of employees
2011 2012 2013 3-year average
10 $1,300,000 1 $1,210,000 $1,260,000 $1,300,000 $1,255,000
9 700,000 1 $420,000 $435,000 $450,000 $435,000
8 630,000 3 $295,000 $305,000 $315,000 $305,000
7 500,000 7 $235,000 $245,000 $250,000 $245,000
6 278,000 15 $105,000 $110,000 $110,000 $110,000
5 172,000 241 $40,000 $40,000 $45,000 $40,000
4 136,000 399 $30,000 $35,000 $35,000 $35,000
3 107,000 295 $10,000 $10,000 $10,000 $10,000
2 88,000 258 $10,000 $10,000 $10,000 $10,000
1 75,000 280 $5,000 $5,000 $10,000 $5,000
Aggregate grant date fair value
1,500 $34,300,000 $36,500,000 $39,200,000 36,700,000
Certain figures above are rounded for illustrative purposes.
The most senior 27 employees participate in the equity plan post-transaction
Certain middle managers may participate in a cash long-term incentive plan
Equity awards for junior employees may not be replaced post-transaction
14 2013 private equity portfolio company stock compensation survey
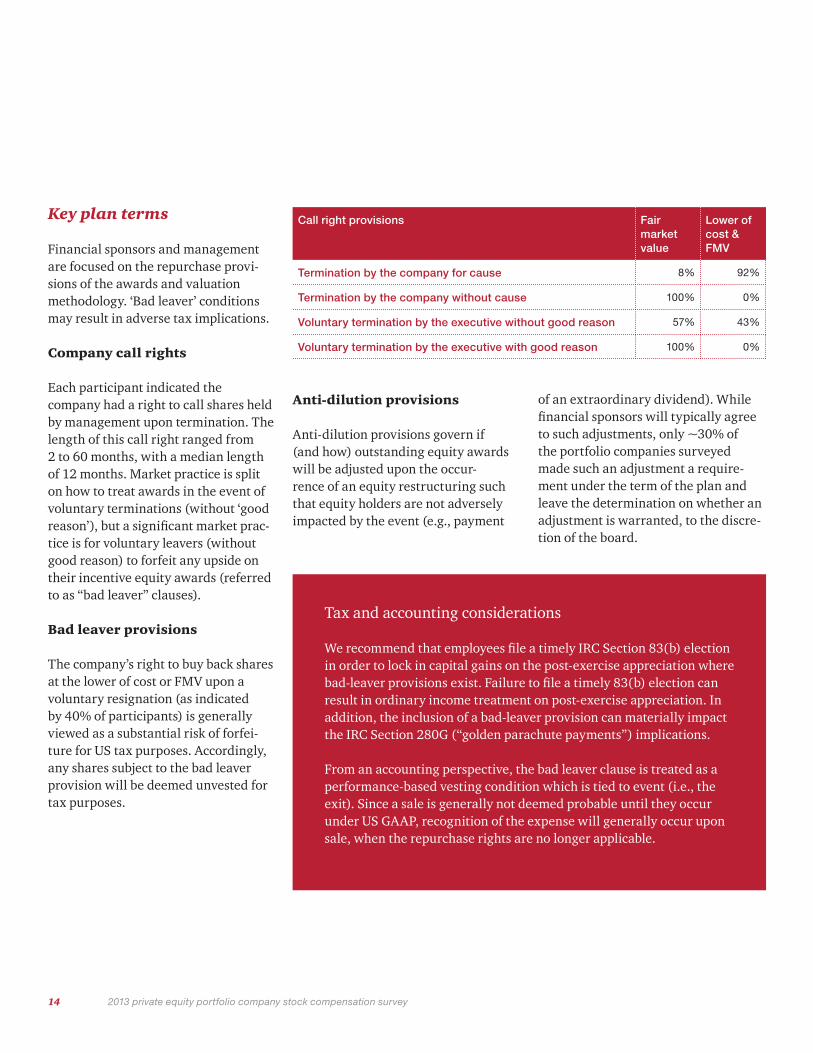
Key plan terms
Financial sponsors and management are focused on the repurchase provi-sions of the awards and valuation methodology. ‘Bad leaver’ conditions may result in adverse tax implications.
Company call rights
Each participant indicated the company had a right to call shares held by management upon termination. The length of this call right ranged from 2 to 60 months, with a median length of 12 months. Market practice is split on how to treat awards in the event of voluntary terminations (without ‘good reason’), but a significant market prac-tice is for voluntary leavers (without good reason) to forfeit any upside on their incentive equity awards (referred to as “bad leaver” clauses).
Bad leaver provisions
The company’s right to buy back shares at the lower of cost or FMV upon a voluntary resignation (as indicated by 40% of participants) is generally viewed as a substantial risk of forfei-ture for US tax purposes. Accordingly, any shares subject to the bad leaver provision will be deemed unvested for tax purposes.
Anti-dilution provisions
Anti-dilution provisions govern if (and how) outstanding equity awards will be adjusted upon the occur-rence of an equity restructuring such that equity holders are not adversely impacted by the event (e.g., payment
Call right provisions Fair market value
Lower of cost & FMV
Termination by the company for cause 8% 92%
Termination by the company without cause 100% 0%
Voluntary termination by the executive without good reason 57% 43%
Voluntary termination by the executive with good reason 100% 0%
Tax and accounting considerations
We recommend that employees file a timely IRC Section 83(b) election in order to lock in capital gains on the post-exercise appreciation where bad-leaver provisions exist. Failure to file a timely 83(b) election can result in ordinary income treatment on post-exercise appreciation. In addition, the inclusion of a bad-leaver provision can materially impact the IRC Section 280G (“golden parachute payments”) implications.
From an accounting perspective, the bad leaver clause is treated as a performance-based vesting condition which is tied to event (i.e., the exit). Since a sale is generally not deemed probable until they occur under US GAAP, recognition of the expense will generally occur upon sale, when the repurchase rights are no longer applicable.
of an extraordinary dividend). While financial sponsors will typically agree to such adjustments, only ~30% of the portfolio companies surveyed made such an adjustment a require-ment under the term of the plan and leave the determination on whether an adjustment is warranted, to the discre-tion of the board.

15 2013 private equity portfolio company stock compensation survey
Although a seemingly inconsequential distinc-tion, those companies with ‘adjustment discretion’ can encounter significant, and often unanticipated, accounting charges to the extent such discretion is utilized to make an equitable adjustment. In this instance, incremental fair value is created because the award’s fair value immediately before the modification is based on the assumption that the award does not have an antidilution provision, while the fair value of the award after the modification is higher as a result of the “equitable” adjustment. The amount on incre-mental accounting expense is the difference in the fair value of awards before and after the modification.
Consider the following situation where management has received 1m options with a strike price of $10. Two years later, the stock price is $20 and the company issues an extraordinary dividend of $5. The plan does not require an adjustment for equity restructuring. However, the Company makes an adjustment to exer-cise price of options to maintain the intrinsic value of awards. See below for an illustration of the potential accounting impact.
Note: Accounting guidance provides that if an award is modified to add an anti-dilution provision and the provision is not added in contemplation of an equity restructuring event, the company is not required to calculate the incremental fair value of the modified award. Therefore, there may still be time to modify plans and avoid potential charges in the future.
Impact of discretionary adjustments
Immedately before modification
Immediately after modification
Market price of stock* $15.00 $15.00
Exercise price $10.00 $5.00
Fair-value per option $7.84 $10.73
# of options 1,000,000 1,000,000
Total comp cost $7,800,000 $10,700,000
Est. incremental compensation charge $2,900,000
* Although the market price is $20 prior to the dividend, the market price is assumed to be $15 before the modification
What this means for your business
A successful rewards program requires critical consideration of the behaviors and outcomes that you are trying to drive

17
At first glance, it may appear that management equity plans have become “standard” among sponsor-backed port-folio companies with limited change in the amount of share reserves and types of awards. However, there are a number of critical design features that impact the effectiveness of these equity programs and serve to further align the interests of management with the fund. Sponsors, faced with a competi-tive deal environment, have responded by increasingly attaching exit-based return metrics to award vesting.
Interestingly, the decrease in leverage on the balance sheet of portfolio companies (vis-a-vis pre-2007 buyouts) has not materially impacted the equity incentives of management. We believe that this finding speaks to the competitiveness of the bidding process in conjunction with the limited struc-ture which sponsors use to determine share reserves and option allocations. Interviewed participants indicated that they generally use an ‘internal’ benchmarking approach and provide comparable plans to other recent acquisitions. As a result, compensation for management at sponsor-backed companies regularly outpace pay levels for comparable public company
executives. Much of this differentiation is rightfully driven by the increased demands of a private company environ-ment. However, funds (and their inves-tors) may benefit from a more robust process of determining grant levels which considers external market data and provides for the most efficient use of resources.
Sponsors are proactively looking to increase the effectiveness of rewards programs by delivering the right type of incentives to the right people. This added scrutiny will help improve the strength (and efficacy) of the rewards program by ensuring that the value perceived by participants matches the value delivered by the fund.
There are many considerations and stakeholders that will influence the terms and design of a management equity plan. Employing a robust approach to determining participation, grant allocations, performance goals and vesting provisions will result in a plan which serves to retain and moti-vate management in the drive towards a successful exit.
2013 private equity portfolio company stock compensation survey

Appendix
Methodology and participant demographics

19
In the 2013 survey, PwC collected and analyzed data on the equity compensa-tion plans of 17 US-based private equity firms used at 30 portfolio companies acquired between January 1, 2010 and December 31, 2012.
Data was collected using an excel-based questionnaire which was completed by the participating private equity firm. Data was collected in the fall and winter of 2012. Additionally, PwC conducted interviews with approximately one-half of the partici-pants to gain additional insight on plan design and the decision making process within the fund. To preserve confiden-tiality, the participant list or details of the portfolio companies studied have not been provided.
The charts on the right summarize the demographics of the respondent set.
Over $1 billion, 21%
Manufacturing/industrial13%
Retail/consumer17%
Professional/business services20%
Other23%
Technology10%
Healthcare/life sciences
10%
Less than $100 million, 14%
$500million–$1billion, 18%
$100–500 million, 46%
By enterprise value
By industry
Participant summary
2013 private equity portfolio company stock compensation survey

20 2013 private equity portfolio company stock compensation survey
Survey questionnaire
Respondents completed the survey questions below. Some sponsors omitted responses to certain questions for confidentiality purposes.
Section 1 Company information and capital structure
1 Please enter the name of the portfolio company (or ID # to maintain confidentiality).
2 Please enter the total number of full-time employees.
3 Please enter total annual revenue (or estimate) for your last completed FY.
4 What year did the transaction close?
5 Which of the following best describes the nature of the transaction?
6 Please select an appropriate industry for the portfolio company.
7 What was the total equity value invested (in millions)?
8 Please provide a breakdown of the equity (in millions) invested by: Sponsors:Management:
9 What was the total amount of debt used to finance the transaction (in millions)?
10 Were management investments financed through company loans?
If yes 1 Were the loans fully recourse?
11 What was the ultimate post-closing equity structure?
1 If preferred and common, please describe terms of the preferred
2 What is the coupon rate of the preferred (PIC)?
3 If split preferred/common, what percentage of equity was allocated to preferred and what percentage to common (on a fully diluted basis)?
Please enter preferred % first then common (ex. 90% preferred/10% common)
12 Was management required to reinvest deal proceeds into NewCo (i.e., cash received from shares held outright, stock options, etc.)?
If yes 1 What was the average rollover investment (expressed as a % of pre-tax proceeds) required from the current sale?
2 Into what type of equity were rollover proceeds invested?

21 2013 private equity portfolio company stock compensation survey
Section 2 Management equity plan
1 How many of the Company's employees received stock compensation awards?
2 Does management have discretion to choose who participates in the equity plan?
3 What was the primary form of stock award granted under the plan?
If other, please describe:
4 What is percentage of total equity reserved for management stock awards on a fully diluted basis? (enter a percent, e.g., 10%)
5 What percentage of the pool of shares reserved under the equity plan were 'held-back' for future grants? (enter a percent, e.g., 30%)
6 What was the primary use for share reserves 'held-back'? Indicate all that apply.New hiresAdditional grants for current participantsAdditional grants for non-participantsOther (specify)
7 What percentage of fully diluted shares outstanding was awarded to the CEO?
8 What percentage was awarded to the NewCo's #2 Executive Officer?Please indicate title.
9 What percentage was awarded to the NewCo's #3 Executive Officer?Please indicate title.
10 What percentage was awarded to the NewCo's #4 Executive Officer?Please indicate title.
11 What percentage was awarded to the NewCo's #5 Executive Officer?Please indicate title.
12 What type(s) of vesting provisions apply to the awards granted under the plan?
2 Into what type of equity were rollover proceeds invested?
Time-based vesting provisions
If you do not grant stock awards that are subject to a time-based vesting schedule, then please select “Not applicable” for questions in this section
1 What percentage of award was subject to time-based vesting provisions?
2 What is the total length of the vesting period? (enter in years)
3 Are the awards subject to ratable vesting or cliff based vesting?
4 Do unvested time-based awards automatically vest upon change in control?
5 Do unvested time-based awards automatically vest upon an IPO?
6 What was the primary use for share reserves 'held-back'? Indicate all that apply.
Survey questionnaire, continued

22 2013 private equity portfolio company stock compensation survey
Performance-based vesting: General
If you do not grant stock awards that are subject to a performance-based vesting schedule, then please select “Not applicable” for questions in this section
1 What percentage of awards were subject to performance-based vesting provisions?
2 Please select the type of performance metric that applies to performance-based vesting awards.
Performance-based vesting: Financial metrics (e.g. EBITDA)
The following questions relate to the performance-based vesting awards that are tied to an EBITDA
1 How are EBITDA/Financial targets determined?
2 When are EBITDA/financial targets determined?
3 Is there a ‘cumulative catch-up’ provision if the annual EBITDA targets are not met?
4 Is there an ultimate time-based vesting date if the EBITDA targets are not met?
5 Do awards automatically vest upon a change in control?
6 Do financial metric-based vesting awards automatically vest upon an IPO?
Performance-based vesting: Stock-based metrics
1 What type of stock-based metrics are used to determine vesting?
2 What is the minimum stock-based metric needed in order for vesting to occur?
3 Is there a ratcheting provision to vesting whereby less options vest if the financial metric realized at sale is less than the minimum target?
4 Is there an ultimate vesting date if the target(s) are not achieved?
5 Do stock-based vesting awards automatically vest upon a change in control?
6 Do stock-based vesting awards automatically vest upon an IPO?
Anti-dilution provisions
The anti-dilution provisions can typically be found in the stock incentive plan document.
1 Does the stock incentive plan’s “anti-dilution” provision require options be adjusted upon an equity restructuring OR is any adjustment left to discretion of the company?
Survey questionnaire, continued

23 2013 private equity portfolio company stock compensation survey
Repurchase rights: Call right details
1 Does the company have a call right to management shares upon an individual’s termination of employment?
If yes 1 How long is the company’s call right (enter in months)
2 Please indicate the price paid upon exercise of the company’s call right under the following termination events:Termination by the company for causeTermination by the company without causeVoluntary termination by the executive without good reasonVoluntary termination by the executive with good reason
3 Do the company’s call rights expire upon IPO?
Repurchase rights: Employee put rights
1 Does the employee have a put right upon termination of employment?
If yes: 1 How long is the employees put right (enter in months)
2 Please indicate the price paid upon exercise of the employees put right under the following termination events:Termination by the company for causeTermination by the company without causeVoluntary termination by the executive without good reasonVoluntary termination by the executive with good reason
3 Does the employee’s put right expire upon IPO?
Determination of fair market value
1 How is “fair market value” defined in the stock incentive plan document (or stockholder’s agreement, as applicable)?
Dividends and distributions
1 Do management equity holders participate in dividends/distributions?
Section 3 Middle management incentives
1 Was an additional incentive plan put in place for employees who participated in equity plans prior to the transaction but not post-transaction?
If yes 1 What was the form of the new incentive plan? If other, please describe.
2 What is the level of participation in the new plan (relative to those who partici-pated historically)?
Section 4 Plan terms / decision making
1 Please indicate the extent to which the terms of the plan are pre-determined at the fund level or subject to negotiation by the terms of the individual deal:Share reserveDepth of participationType of awardVesting conditions
Survey questionnaire, continued

www.pwc.com
© 2013 PricewaterhouseCoopers LLP, a Delaware limited liability partnership. All rights reserved. PwC refers to the US member firm, and may sometimes refer to the PwC network. Each member firm is a separate legal entity. Please see www.pwc.com/structure for further details. This content is for general information purposes only, and should not be used as a substitute for consultation with professional advisors. NY-13-0760
To have a deeper conversation about how this subject may affect your business, please contact:
Aaron Sanandres Principal—Human Resource Services [email protected] +1 646 471 4567
Steve Rimmer Principal—Human Resource Services [email protected] +1 646 471 8860
Andrew Skor Director—Human Resource Services [email protected] +1 646 471 2311
Daniel Fund Manager—Human Resource Services [email protected] +1 617 530 5278


