Principles, Rules, Bright Lines and Transaction Structuring: A Cross-Regime Study of Lessees
Darren Henderson University of Western Ontario
Patricia C. O’Brien
University of Waterloo
January 2012
Abstract: We study lease accounting in an international panel data set to examine how an accounting regime’s reliance on principles versus rules, and the existence or not of “bright-line” tests, affect decisions about reporting leases as capital or operating. We study companies in four countries: Australia, Canada, the UK and the US, in two lease-intensive industries, retail and transportation. Our study period spans the time when Australia and the UK switched from domestic to international accounting standards. We find no support for the idea that basing accounting standards on principles rather than rules encourages greater adherence to the spirit of the standard. Further, we find no evidence that omitting bright-line tests reduces the amount of transaction structuring done to avoid capital lease treatment. Overall, we conclude that the benefits of principles-based standards may be more elusive than generally believed. The authors are grateful to participants in the Brown Bag Lunch Group at the University of Waterloo for helpful early feedback on the project, to Catalina Anghel, Vishal Baloria, Joseph Cheng and Deanna Qi for excellent research assistance, and to the Ernst & Young Professorship at the University of Waterloo and the Social Sciences and Humanities Research Council of Canada for financial assistance.

1
1. Introduction
A precept of Accounting standard-setting in recent years holds that standards should be
written as general principles, not specific rules, and should avoid “bright-line” tests (Maines et
al. (2003), Schipper (2003), SEC (2008)). This view emphasizes that specifying clear and
enforceable rules provides opportunities for companies to structure contracts to evade the rules.
It rests, however, on the hope that principles will better curb manipulative reporting. Nelson
(2003), on the other hand, cites a large body of survey and experimental evidence suggesting that
imprecise accounting standards encourage more aggressive reporting.
We study the lease accounting choices of lessee firms in four countries, namely Australia,
Canada, the UK and the US, both before and after Australia and the UK adopted IFRS. As we
explain in greater detail below, the regimes differ in whether the lease standard applied a strict
rule or required the exercise of professional judgement, and in the existence and particulars of
bright line tests. This variation in accounting regimes provides a “natural experiment” to study
the impact of these features on companies’ reporting choices. Although using four separate
countries exposes us to potential confounds from country-specific characteristics other than
accounting regime, these four countries share linguistic, cultural and legal backgrounds, along
with the “Anglo-Saxon” accounting model,1 providing a relatively homogeneous setting by
worldwide standards. Furthermore, by looking at data pre- versus post-IFRS for Australia and
the UK, and comparing their changes to those in the Canada and the US, we can use each
country as its own control.
Nelson (2003) describes US standards as generally principles-based, with gradations of
guidance tending toward rules as the guidance becomes more specific. Discussion outside the
1 See Mueller, Gernon and Meek (1997) and Nobes (2011).

2
US generally regards the US as distinct in emphasizing rules, rather than principles, despite
overall similarity in guidance, or the accepted practice of using US guidance when local
standards provide none. In this view, including a clause that requires the preparer or auditor to
exercise professional judgement in applying a general principle makes the standard “principles-
based.”
In the US, the Financial Accounting Standards Board’s (FASB) Statement of Financial
Accounting Standards No. 13 (FAS13) provides strict rules for determining when a lessee
company must use capital lease accounting, and when it must use operating lease treatment.
These rules include bright-line tests about useful life and asset value. To our knowledge, it is the
only US standard with a strict rule, but this feature has made it the “poster child” for the failure
of rules-based standards. Imhoff and Thomas (1988) demonstrate that US companies changed
the way they wrote contracts following FAS13, resulting in substantially more use of operating
leases, the opposite of the standard’s intent. Since then, it has served as the key example of how
rules and bright lines promote transaction structuring and circumvention, rather than informative
accounting.
Other countries, such as Australia, Canada, and the UK, have or had similar lessee
accounting standards with identical bright-line guidance, but they emphasize that the principle
should prevail, that is, professionals should judge whether the risks and rewards of ownership
have effectively transferred. In the pre-IFRS period, we test whether professional judgement
increased lessee companies’ use of capital leases in the presence of bright lines, by comparing
companies’ lease accounting choices in Australia, Canada, and the UK with those of industry
peers in the US. We conduct our analyses within-industry to control for operating

3
characteristics, limiting our analysis to two industries in which leasing is economically
important, Retail and Transportation.
In 2005, Australia and the UK changed to International Financial Reporting Standards
(IFRS), which deliberately eschew all bright-line tests in lease accounting. Using data from
2003 and 2007, we compare changes in lease accounting in these two regimes to their industry
counterparts in the unchanged regimes of Canada and the US, using a difference-in-differences
approach. This allows us to see whether eliminating bright line tests alters accounting decisions,
as evidently hoped by standard-setters. If, on the other hand, companies continue to adhere to
past guidance or to employ existing US guidance to fill the void, we should expect no change.
While we find that capital lease use varies significantly across our sample countries, the
data are not consistent overall with professional judgment curbing transaction structuring, in the
presence of bright line tests. Canada looks very similar to the US. Relative to their US
counterparts pre-IFRS, fewer UK companies use capital leases, while more Australian
companies use them. We also find no support for the idea that eliminating bright lines reduces
transaction structuring. The UK and Australia, the two countries that switched to IFRS in our
sample period, move in opposite directions between 2004 and 2007.
We further test whether specific bright lines influence companies to set contract terms to
avoid tripping them. For the useful life test, we conjecture that operating leases in bright-line
regimes will be structured to be shorter. We find no evidence that operating lease terms are
shorter in bright-line regimes, contrary to this expectation. For the present value test, we
hypothesize that companies in bright-line regimes will use more contingent rentals, to reduce the
reported minimum lease payments enough to allow operating lease treatment. We find no
evidence of greater use of contingent rentals in bright-line regimes.

4
Overall, although we find significant differences across regimes, their pattern does not
conform to what we should expect if professional judgment overrules bright line guidance, or if
eliminating or avoiding bright lines reduces transaction structuring. Rather, our results are more
consistent with Nobes’ (2011) conclusion that “accounting differences are generally very deep-
seated and resistant to harmonization,” or with Ball’s (2006) assertion that harmonizing
standards is unlikely to overcome local incentives of those who prepare and audit financial
statements.
Our study contributes to the principles versus rules debate. Rules-based standards are
criticized for providing specific guidance on how to structure transactions to generate a desired
accounting treatment. Principles-based standards can prevent transaction structuring, however,
only if the perceived costs from the audit or reporting processes outweigh the perceived benefit
from structuring. By comparing companies’ choices under different accounting regimes, we
complement recent experimental work (Jamal and Tan (2010), Agoglia et al. (2011), Cohen et al.
(2011)) and answer calls by Nelson (2003) and Jamal et al. (2010) for empirical analysis of the
effects of principles-based standards on companies’ accounting choices.
Our study is subject to certain limitations. We limit our analysis to the Retail and
Transportation industries to control for operating characteristics via within-industry analysis.
We chose these two industries because of their high leasing activity, similar to Imhoff et al.
(1991, 1993). We also limited our analysis to four OECD-member, primarily English-speaking
countries with similar legal and regulatory profiles, providing some control for cross-country
differences. Our findings will only generalize to the extent that accounting decisions in these
industries and countries represent those in the broader population.

5
Our paper proceeds as follows: in Section 2, we discuss relevant background and form
hypotheses; in Section 3, we discuss our data and measurement choices; in Section 4, we discuss
our results; and in Section 5, we conclude.
2. Background and Hypothesis Development
Standard-setters have long recognized the potential threat to fair presentation posed by
leasing transactions. The FASB introduced FAS13 in 1976 and the International Accounting
Standards Committee introduced IAS 17, “Accounting for Leases” in 1982. These standards
introduced capital lease treatment to account for leases that were very similar to outright
purchases. Capital lease accounting makes companies appear more highly levered than the
alternative, operating lease treatment, hence many companies seek operating treatment for their
leases.2 In addition, firms with growing lease activity report lower income under capital lease
treatment (ceteris paribus), providing another, albeit temporary, advantage to operating lease
treatment. On the other hand, firms can report consistently higher operating cash flow under
capital lease treatment, because they classify a significant portion of the lease payment as repaid
borrowing. Standard-setters have been most concerned with concealed leverage, and have
attempted to curtail the use of operating leases.
US companies responded to FAS13 by altering their lease terms to achieve operating
lease accounting (Imhoff and Thomas 1988). Further, entire industries came into existence with
the sole purpose of structuring lease contracts to avoid capital lease treatment (SEC 2008 pp. 41).
More recently, in the hope of eliminating transaction structuring to avoid capitalization, the
2 Some jurisdictions use “finance lease”, “financing lease”, and “hire purchase contract” for contracts that transfer substantially all risks and rewards to the lessee. We treat these terms as interchangeable with “capital lease”, and use the latter term consistently to avoid confusion.

6
FASB and the International Accounting Standards Board (IASB) issued a joint Exposure Draft
on leasing proposing capitalization of all leases based on the right-of-use model (FASB/IASB
2010).3
In the US, FAS13 applies a rule: lessee companies must use capital lease accounting for
non-cancellable leases that meet any of four criteria, and must use operating lease accounting for
leases that fail to meet any of the criteria. Two of these criteria employ quantitative bright lines:
that the lease term be at least 75 percent of the asset’s useful life, and that the present value of
minimum lease payments be at least 90 percent of the asset’s fair market value at lease
inception.4
The pre-IFRS Canadian CICA Handbook section 3065 and Australian standard
AASB1008 contain precisely the same four criteria as the US standard, but as guidance,
emphasizing that the accountant must exercise professional judgment to decide whether a lease
transfers “substantially all the risks and rewards” of ownership.5 Thus, they embed the bright-
line criteria within a principles-based framework. The UK’s Statement of Standard Accounting
Practice 21 governing lease accounting includes the fair value test, but omits the useful life test.
Like the Australian and Canadian standards, it embeds the test as guidance within a principle-
based standard. Beginning in 2005, Australia and the UK adopted IFRS, which indicate that the
transfer of “substantially all” risks and rewards should determine the lease accounting, but
decline to state any bright-line criteria for determining whether the transfer has occurred.6
3 At the time of writing, the FASB/IASB intend to issue a revised Exposure Draft, responding to public comment, in 2012Q1, and hope to have a final standard by 2012Q4. 4 FAS13, para. 7. 5 See CICA HB Sec. 3065.6 and AASB1008 sec. 5. 6 See SSAP21, para. 15, 16 & 32, and IAS 17 para. 7, 8 & 12.

7
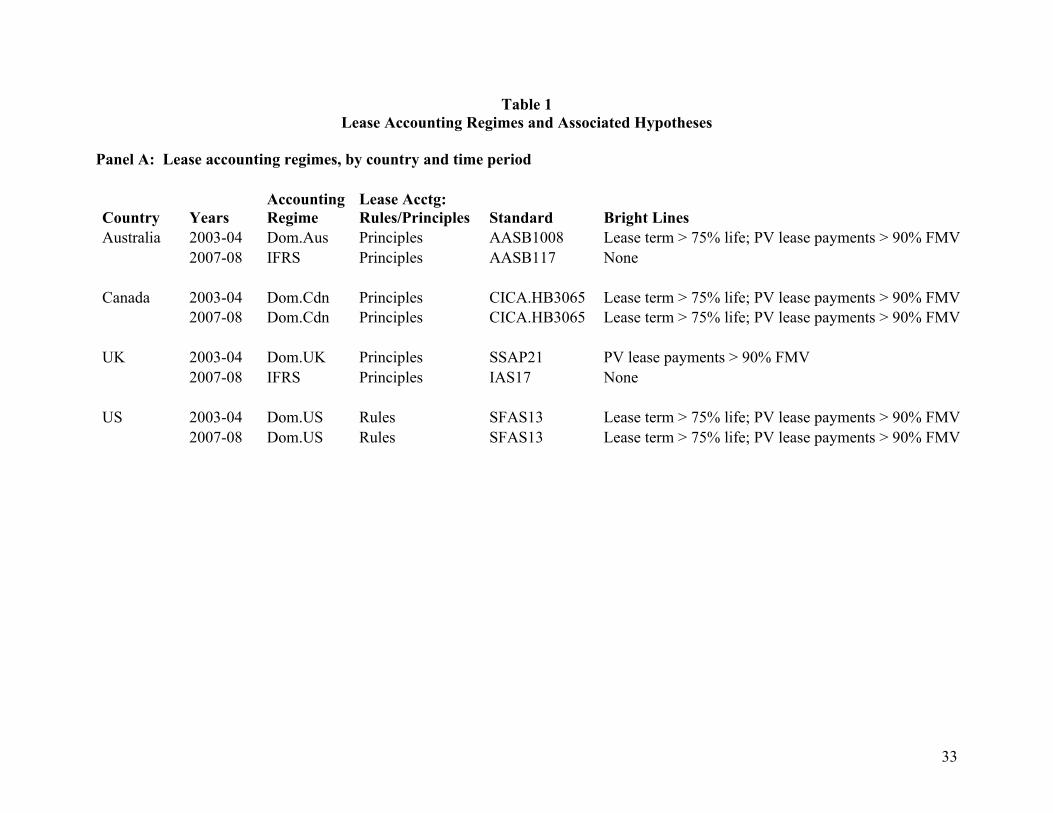
Table 1, Panel A identifies reporting regimes by country and time period, as background
for our hypotheses. We use the four countries and six reporting regimes (four domestic regimes,
plus IFRS implemented in two countries) to examine whether professional judgment overrides
bright-line criteria and whether avoiding or eliminating bright lines alters companies’ decisions
to report leases as capital or operating.
Some experimental research supports the conjectures that bright-line criteria increase
companies’ ability to avoid capitalizing leases through transaction structuring, and that
principles-based standards without bright lines curb transaction structuring. Agoglia et al. (2011)
find CFOs less likely to capitalize a lease when facing a bright line than when the bright line is
absent, in a rule-based setting. Cohen et al. (2011) find that, in a setting with bright-line tests,
firms are more likely to capitalize a lease under a principles-based standard. Further, in a survey
of audit professionals, Nelson et al. (2002) find that firms are less likely to manage earnings
through transaction structuring with principles-based standards.
The opposing view suggests that principles-based standards may not reduce transaction
structuring. Jamal and Tan (2010) find that rules- versus principles-based standards do not
influence a manager’s propensity to capitalize leases unless confronting a “principles-oriented”
auditor. Agoglia et al. (2011) find that strong corporate governance can prevent misreporting in
a rules-based regime, reducing the expected benefit from principles-based standards.
To study the role of professional judgement, we compare Australia, Canada and the UK,
to the US. Comparing Australian and UK companies before and after the switch to IFRS allows
us to evaluate as well whether eliminating bright lines made a difference. We use the US and
Canada, where accounting standards did not change in this period, to control for changes in the
business environments over time. To limit operating differences that may confound our results,

8
we examine cross-country differences within industry, for two lease-intensive industries, Retail
and Transportation.
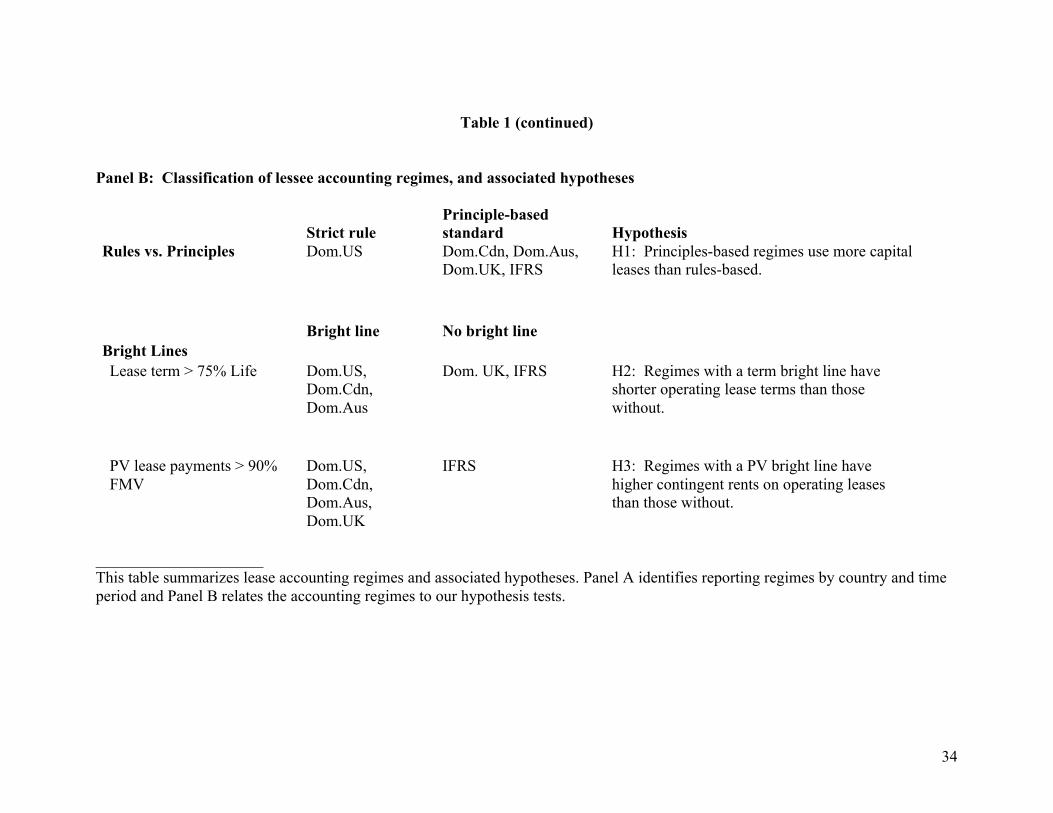
Panel B of Table 1 relates the various accounting regimes to our tests. If requiring
professionals to apply an overriding principle leads to less transaction structuring by companies,
then we expect more capital lease use in regimes with such “principles-based” standards, relative
to the US, the sole regime with a strict rule. In alternative form, our first hypothesis is.
H1: Firms in principles-based regimes use more capital leases than firms in rules-based
regimes.
We look for more detailed evidence of transaction structuring by considering specific
bright lines. In particular, we consider the lease term and the proportion of contingent rentals,
discussed further below. If the bright line at 75 percent of useful life causes firms to write lease
contracts to fall just short of the line, then eliminating the bright line could, by the arguments
above, reduce operating lease terms for regimes having this bright line. The UK never had this
bright line, so the switch to IFRS represents no change on this criterion. Canada and the US, on
the other hand, have this criterion in both of our sample periods, so they also represent no
change, but within the opposite regime. Australia went from having this criterion under
domestic GAAP to not having it under IFRS. Our tests examine, first, whether operating lease
terms in the UK in 2003 were longer than those in the same industry in Australia, Canada and the
US. Second, we examine whether Australian companies experienced greater increases in lease
terms than their industry counterparts in the other countries between 2003 and 2007. Formally,
we state our hypothesis in alternative form, under the conjecture that bright lines constrain lease
contracts, as follows.
9
H2: Firms in regimes with a bright-line criterion for the lease term will have shorter
operating lease terms than firms in regimes with no such bright-line criterion.
To study the criterion that the present value of operating lease payments should not
exceed 90 percent of the asset’s fair value, we examine contingent rentals. Companies can use
contingent rentals to reduce the minimum lease payments included in the present value
calculations, to stay below the 90 percent threshold and qualify for operating lease treatment. By
the arguments above, removing the bright line should reduce the use of contingent rentals. To
study this, we compare Australian and UK companies’ use of contingent rentals before versus
after they adopted IFRS. We use industry peers in Canada and the US, who did not change this
bright line in this period, as a control. The hypothesis, in alternative form, under the conjecture
that bright lines constrain lease contracts, is as follows.
H3: Firms in regimes with a bright-line criterion for the minimum lease payments will
use more contingent rentals than firms in regimes with no such bright-line criterion.
3. Measures, Data and Descriptive Statistics
We propose to examine the proportionate use of capital leases, the lease term and
contingent rentals to test the hypotheses outlined in the previous section. In this section, we
explain the measures we use to test our hypotheses, describe our data sources and collection, and
provide descriptive information about our sample companies.
For our first hypothesis, we measure capital lease use in two ways, first as the proportion
of firms in the industry-country using any capital leases, and second as the average ratio of
capital leases to total leases, measured firm-by-firm among firms having lease activity. The first
measure is straightforward, based on how many companies disclose capital leases. To construct
10
the second measure, we must place operating and capital leases on a comparable basis. We
considered three candidates, two representing total aggregate lease commitments and the third
representing current-year payments: (1) aggregate undiscounted operating lease commitments,
plus aggregate undiscounted capital lease commitments; (2) the capitalized liability value of non-
cancellable operating leases using the method of Imhoff et al. (1991), plus the reported liability
value of capital leases; and (3) the annual operating rent expense, plus current-year cash
payments under capital leases. Both (1) and (2) have the drawback that future operating lease
commitments omit contingent rentals, a potentially important transaction structuring tool.
Measure (2) has the additional drawback that we must assume a discount rate to constructively
capitalize operating leases. Canada does not require firms to disclose rent expense for operating
leases, and most Canadian firms do not report it separately, eliminating (3) for comparisons
involving Canadian companies. The pre-IFRS UK did not require firms to report aggregate
undiscounted operating lease commitments, but we are able to estimate it from disclosed
information, as we explain in part A of the Appendix. We use measure (1), because we can
observe it for all regimes, unlike (3), and it requires fewer assumptions than (2).
We face similar data perils in measuring operating lease term and contingent rentals to
test our hypotheses about transaction structuring. Companies variously report the maximum
lease term, a range of terms, or a longest expiry date, but do not provide details relating monetary
amounts to time periods beyond five years. We compute a weighted-average lease term, using
the undiscounted cash flow amounts in each year as the weights, and assuming that the lump-
sum amount beyond five years expires in equal instalments, equal to the amount in year five.
When the firm reports a lump-sum cash flow for years two through five together, as is common
in the UK and Australia, we assign equal monetary amounts to each year in the interval. We

11
compute an alternative proxy for the lease term, equal to the maximum number of years
(unweighted) with lease commitments, assuming the lump-sum for years beyond five expires in
equal instalments, as described above. The Pearson (Spearman) correlation between these two
operating lease term proxies across firms is 0.949 (0.965). Because the proxies are so highly
correlated and provide similar inferences, we report and discuss results for the weighted-average
lease term proxy only.
We estimate contingent rentals on operating leases, for all regimes except Canada, by
dividing the minimum commitment for one year ahead reported in year t, by actual rent expense
in year t+1. A lower ratio would indicate more contingent rentals. As mentioned above, we
cannot measure this amount for Canadian companies because they rarely disclose rent expense
on operating leases separately. If companies use more contingent rentals to structure operating
leases when the lease standard includes a bright line, then we should find the ratio of
commitment to expense to be lower in such regimes.
Much of the data we require must be hand-collected.7 To limit the cost of hand-
collecting data, we focus on two industries, Retail and Transportation, for which we used the
Fama-French industry definitions.8 In preliminary analysis, we found that these two industries
had reasonable numbers of companies with relatively large amounts of lease activity in all four
countries, both of which add power to our tests. In addition, many of the leased assets in these
industries, such as retail stores and transportation vehicles, are fundamental to company
7 We found that the reliability of Compustat lease data varied widely across countries and many data items were missing, necessitating hand collection, even of data items purportedly covered by Compustat. See part B of the Appendix. 8 We are grateful to Kenneth French for making the definitions freely available: http://mba.tuck.dartmouth.edu/pages/faculty/ken.french/Data_Library.
12
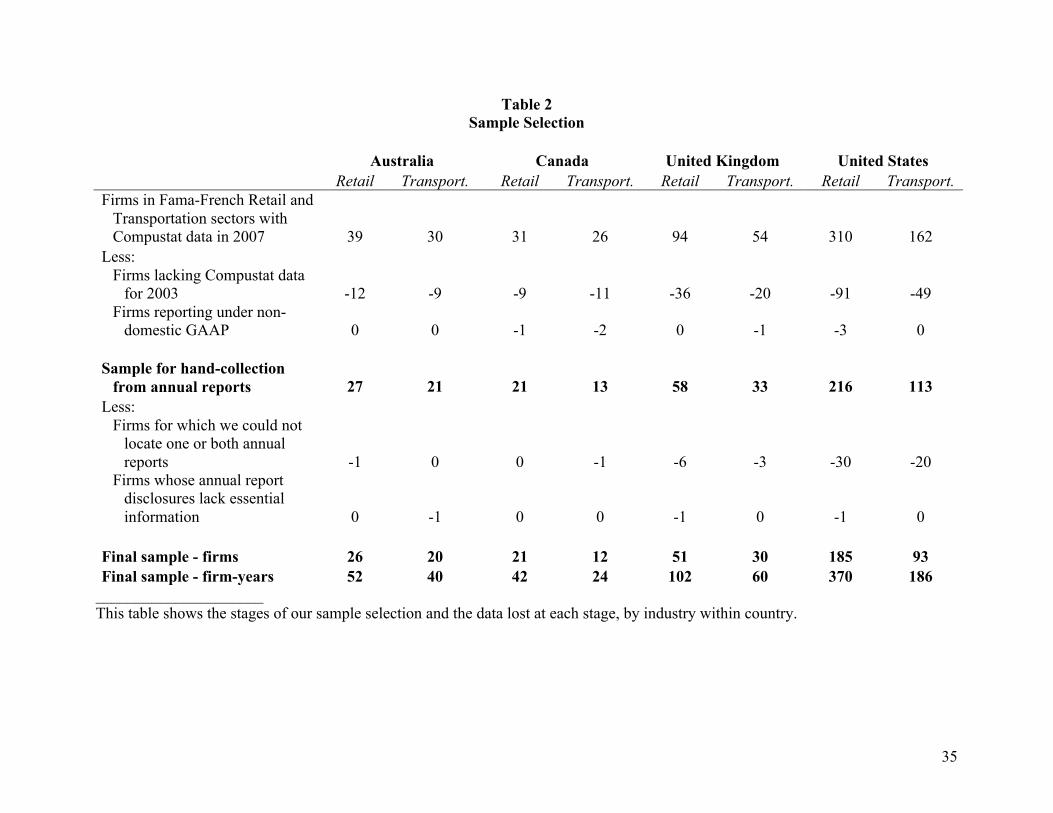
operations, making the leasing activity economically important. Table 2 shows the stages of our
sample selection and the data lost at each stage, by industry within country.
We began with companies listed in Compustat North America and Compustat Global for
our two industries and four countries in 2007. Because most leases are long-term, information
for a given firm changes little from year to year. We therefore chose to collect only one
observation per firm before and one per firm after 2005, in 2003 and 2007 respectively for
December year-end firms. We chose 2003 for the pre-IFRS year because firms restated their
opening (2004) balance sheets when they switched to IFRS; 2003 gives us the last year of the old
regime. We chose 2007 for symmetry around the switch. The UK and Australia adopted IFRS
for fiscal years beginning on or after January 1, 2005, so the comparable years for non-December
year-end firms are the fiscal years ending in calendar 2004 and 2008, respectively. For
simplicity, we refer to the two times in our sample as 2003 and 2007.
As a first step, we eliminate firms from the Compustat list for which Total Assets is
missing or zero in 2003. This condition eliminates firms that went public between 2003 and
2007 from our sample, but allows us to make more precise comparisons between the periods.
We also eliminate firms that, according to Compustat, used GAAP that differed from the regimes
identified in Table 1, for example a Canadian firm reporting under US GAAP.
We obtain annual reports for the remaining companies, either from the company’s own
website, or from the following sources: in Australia, from Annual Reports Online by Aspect
Huntley via the National Library of Australia9, in Canada from the Canadian Securities
Administrators’ SEDAR site10, in the UK from Companies House11 and in the US from the
9 We thank Joseph Cheng for obtaining and coding these reports for us. 10 http://www.sedar.com/homepage_en.htm 11 http://www.companieshouse.gov.uk/

13
Securities and Exchange Commission’s EDGAR site.12 We lost additional firms at this stage, in
most cases because we were unable to locate one of the annual reports.
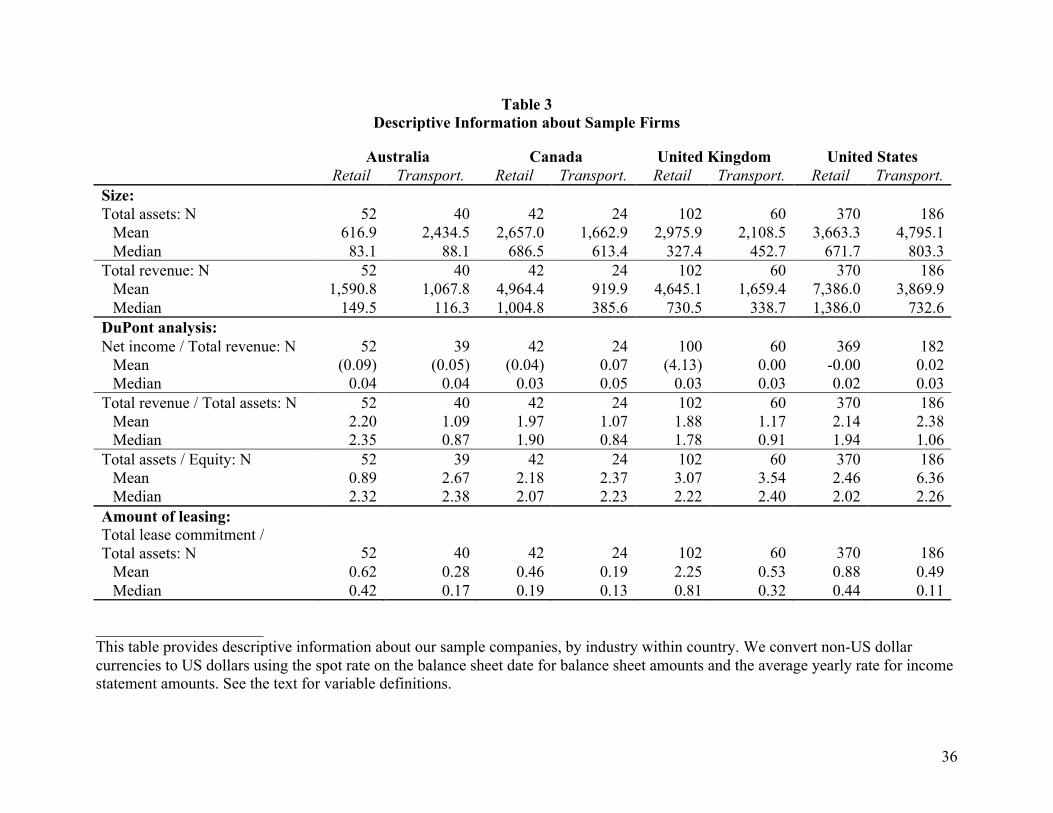
Table 3 provides descriptive information about our sample companies, again by industry
within country. We compare firms across three dimensions: size, operations, and leasing. For
size, we consider assets and revenue (stated in US dollars to allow comparison).13 Based on
median total assets in the Retail and Transportation industries respectively, US firms are largest
at $672 and $803 million, while Australian firms are smallest at $83 and $88 million. We
mitigate problems stemming from differences in firm size across countries by using ratio
measures in our tests. We find median profit margins (net income / revenue) are similar across
countries and industries, ranging from 2 to 5 percent. Median asset turnover (revenue / assets) in
all countries is higher in Retail (1.8 to 2.4 times) than in Transportation (0.8 to 1.1 times), while
the median equity multiplier (assets / equity) is relatively consistent across countries and
industries, ranging between 2.02 and 2.40. To measure the relative level of leasing activity
across countries and industries, we approximate lease assets as the total undiscounted operating
plus capital lease commitment and compare this amount to total assets. Retail firms use
consistently more leases than transportation firms in all countries. The median value of leases as
a percent of total assets ranges from 19 percent in Canada to 81 percent in the UK in Retail and
from 11 percent in the US to 32 percent in the UK in Transportation.
4. Results of Hypothesis Tests
4.1 H1: Principles-based regimes increase capital lease use
12 http://www.sec.gov/edgar/searchedgar/webusers.htm 13 We converted other currencies to US dollars using the spot rate on the balance sheet date for balance sheet amounts and the average yearly rate for income statements amounts.

14
Our first hypothesis conjectures that firms in principles-based regimes use more capital
leases than the sole rules-based regime, the US. We measure capital lease use as the proportion
of firms in the industry employing capital leases, and capital lease intensity as the within-firm
proportion of total leases that are capital.
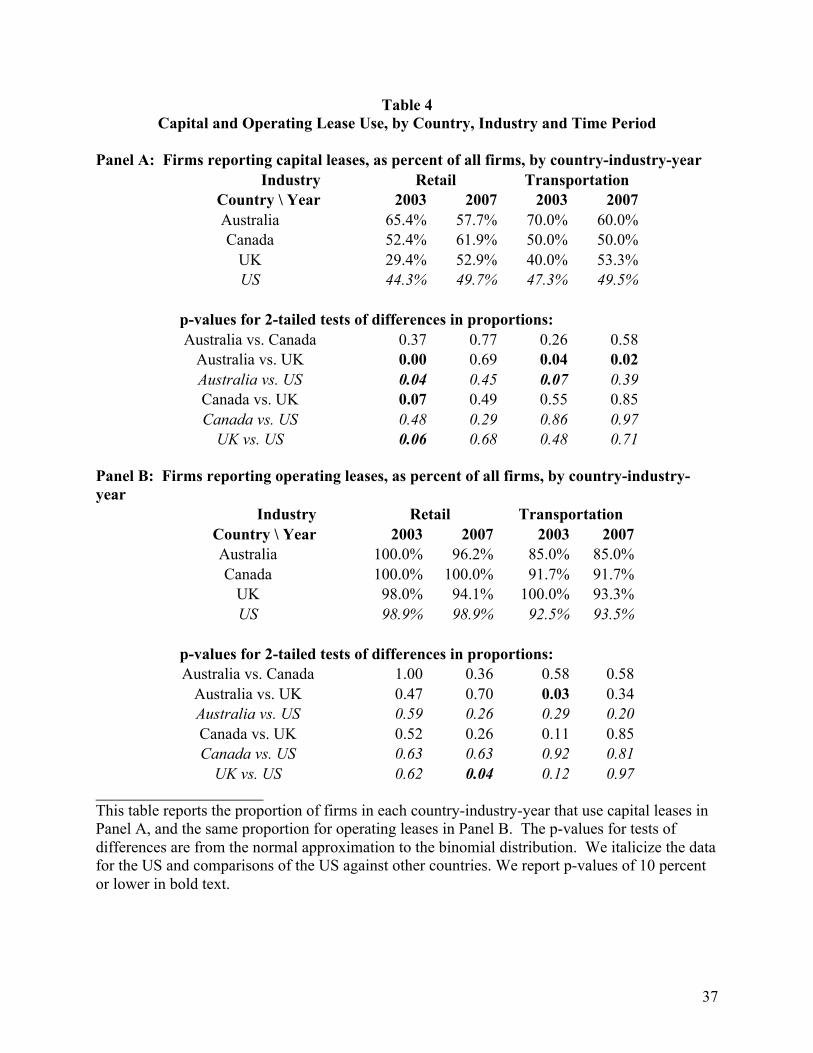
Table 4 shows capital lease use in Panel A and for comparison operating lease use in
Panel B. In the lower portion of each panel, we report the p-values for two-tailed statistical tests
of differences in proportions, using the normal approximation to the binomial distribution. We
discuss tests with a two-tailed p-value of 10 percent or lower as significant. In Hypothesis 1, we
are interested in isolating the principles-rules comparison, so we have italicized the data for the
US and the comparisons of the US against other countries. We include all pair-wise comparisons
across countries, for completeness.
In general, Panel A of Table 4 shows substantial variation in companies’ use of capital
leases, with between 29 and 70 percent of firms in a given country-industry-year reporting some
capital leases. In contrast, Panel B shows that 85 percent to 100 percent of companies in the
same country-industry-years use operating leases. Thus, our sample industries, broadly
speaking, consist of lessee companies, and we see fairly wide variation across regimes in the use
of capital leases.
Turning now to the statistical tests in Panel A of Table 4, we do not find the US generally
to have proportionately fewer firms using capital leases than other countries, as we might expect
if rules allow companies to follow the letter and escape the spirit of the standard, while principles
provide more discipline. Australia in 2003 is the exception. In 2003, proportionately more
Australian companies in both Retail and Transportation use capital leases (65.4% and 70.0%)
than their industry peers in the US (44.3% and 47.3%), and these differences are statistically

15
significant at the 4 and 7 percent levels, respectively. However, proportionately fewer firms in
both Retail and Transportation used capital leases in the principles-based UK (29.4% and 40.0%)
than in the rules-based US (44.3% and 47.3%), and the difference is statistically significant at the
6 percent level in Retail. Further, Australia in 2007, which remains principles-based under IFRS,
is statistically indistinguishable from the US in both industries. Firms in principles-based
Canada are not significantly different in either industry, either year, from their counterparts in the
US. The UK experiences a surge in capital lease use after its switch to IFRS, while Australia
experiences a decline, but all of these regimes are principles-based, so their differences have no
bearing on the principles-versus-rules distinction. We return to these intertemporal differences
below when we consider our bright-lines hypotheses. The results in Table 4 do not support the
first hypothesis, that principles-based accounting standards result in more use of capital leases
than rules-based standards. Rather, the proportion of companies using capital leases varies
across regimes in a way that does not correspond to principles versus rules.
We report capital lease intensity, an alternative proxy for the extent of capital lease use,
in Table 5. Based on the results in Table 4 showing that countries differ in the proportion of
firms using any capital leases, in Table 5 we report statistics for all firms having any operating or
capital leasing activity in Panel A, and for firms having capital lease activity in Panel B. We
compute intensity for each firm-year as the capital lease proportion of total leasing activity, using
undiscounted lease commitments to measure lease activity as explained in Section 3. We
perform t-tests and Wilcoxon rank-sum tests of the cross-country differences, by industry and
year.
In Panel A of Table 5, as with capital lease use reported in Table 4, Australia is notable
for companies reporting a higher proportion of leasing activity as capital, with average intensities
16
several times larger than, and usually significantly different from, those in the corresponding
industry-years in other countries. US capital lease intensity is not remarkably low, as we might
expect if its rules-based regime helped companies to avoid capital leases. Its average capital
lease intensity of around 4 percent in Retail exceeds the corresponding average figures in Canada
and the UK, which are below 3 percent. The US capital lease intensity of around 7 percent in
Transportation falls at an intermediate level between Canada and the UK in 2003. It has the
lowest average of the four countries in Transportation in 2007, but it is not significantly different
from either Canada or the UK. Because the averages can be influenced by extreme observations,
we also perform a Wilcoxon rank-sum test of these differences. This non-parametric test
confirms that Australia stands out from all three other countries as using more capital leases, but
the US is not exceptionally low. Aside from its difference from Australia, which Canada and the
UK generally share, the only significant US difference is that it is lower than the UK in Retail in
2003. Thus, we do find regime-based differences in capital lease intensity, mostly involving
Australia, but not distinguishing the US from principles-based jurisdictions. We therefore do not
find support for H1 in Panel A.
In Panel B of Table 5, we calculate capital lease intensity only for those firms with
capital leases. Sample sizes in this panel are substantially lower than in Panel A, because only
29 to 70 percent of firms have capital leases in a given country-industry-year. Correspondingly,
fewer differences are statistically significant in Panel B, but the ordering of capital lease intensity
by country for each industry-year is the same as in Panel A. Our general conclusions above
therefore are unchanged in this subset of data.
We can also interpret the evidence in Tables 4 and 5 in relation to our hypotheses about
bright lines. If bright lines, and not rules or principles, determine lease reporting behaviour, then
17
we might expect the UK in 2003, with one less bright line, to differ from other countries. We
may also look for changes when the UK and Australia drop bright lines between 2003 and 2007,
as each of those countries switched to IFRS.
Table 4 shows that the UK has the lowest capital lease use in both industries in 2003, at
29.4 percent for Retail and 40.0 percent for Transportation. This is significantly lower than other
countries in Retail, and significantly lower than Australia in Transportation. One might be
tempted to conclude that the absence of a bright line regarding lease terms has allowed more UK
companies to avoid capital lease treatment. Note, however, that Table 5 contradicts this in terms
of lease intensity. UK Retail companies use significantly more capital leases as a percent of total
lease activity than their Canadian or US counterparts in 2003, according to the non-parametric
Wilcoxon test. The parametric t-test shows no differences among these three countries in Retail,
and UK Transportation firms are statistically similar to those in Canada or the US by either test.
Overall, with lease use showing fewer pre-IFRS UK Retail companies using capital leases, and
lease intensity showing a higher proportion of leases as capital, we cannot with confidence
support either that the absence of one bright line eases constraints to allow more capital leases, or
that it creates ambiguity requiring more capital leases.
The switch to IFRS in Australia and the UK shows a similar conflicted picture. Both
Tables 4 and 5 show, in terms of raw numbers, that Australia decreased its capital lease use and
intensity between 2003 and 2007, in both industries. At the same time, the UK increased capital
lease use in both industries and its capital lease intensity in Transportation. None of these
differences are statistically significant, however, according to tests analogous to those reported in

18
the tables.14 Thus, we cannot conclude that IFRS’ eliminating bright lines had a systematic
effect on companies’ use of capital leases.
4.2 H2: Lease term bright lines lead to shorter operating leases
We now turn to our tests of specific lease features that may indicate transaction structuring.
In 2003, Australia, Canada and the US each had a bright line criterion for lease terms, while the
UK did not. Between 2003 and 2007, Australia adopted IFRS, and so eliminated its bright line.
These regime differences define the categories for our tests: we compare the UK to all others in
2003, and Australia’s change from 2003 to 2007. If companies structure their leases to avoid the
bright-line test, then we expect to find the evidence in shorter operating lease terms in regimes
with the bright line than in regimes without.
Table 6 displays our results on lease terms. In all four countries, few companies provide
details about lease terms, and the data provided varies, with some companies reporting a
maximum lease term, others a range of lease terms, and still others an average lease term. We
use the disclosure on undiscounted future minimum cash flows to construct two proxies, a
weighted-average lease term using cash flow weights, and an amortized-cash-flow lease term, as
follows.
1. Pre-IFRS, UK firms reported future operating lease cash flows in a different format from
Australian, Canadian and US firms. We convert the 2003 UK data to the same format as the
other countries’, using the method described in Appendix A.
2. Especially in Australia and the UK, companies often group several years’ cash flows
together. In such cases, we divide the amount equally among years. For example, Australian
companies commonly report one aggregate value for future years two through five. In this
14 These tests are available on request from the authors.
19
case, we assign one-quarter of the disclosed aggregate value to each year between two and
five inclusive.
3. In all our sample countries, companies with lease commitments beyond five years in the
future report a single “thereafter” value for cash flows beyond year five. We assign to
subsequent years a value equal to year five’s value, until we exhaust the “thereafter” amount.
We define the count of years resulting from this process as the amortized-cash-flow term.
For example, if the “thereafter” value is 800, and the year five value is 250, we assign 250 to
each of years six, seven and eight, and the remaining 50 to year nine. The amortized-cash-
flow term for this company is nine.
4. We compute the weighted-average lease term using the cash flows assigned to years as
described in step 3. We weight each ordinal year by its cash flow, as a proportion of total
cash flow summed across years. For example, if a company reports minimum commitments
of 1000, 500 and 200, respectively, in future years one, two and three, and nothing beyond
year three, then we compute the weighted average term as (1000×1 + 500×2 + 200×3)/1700 =
1.5 years.
The data requirements for estimating lease terms reduce our available observations,
relative to the final sample numbers reported in Table 2. We lose between zero and three firms
across countries in Retail, with the greatest proportional loss in the UK, where we lose 6 percent,
or three of 51 firms. Transportation experiences somewhat more substantial losses. The US
loses the largest number, nine of 93, while Australia loses the greatest proportion, 25 percent or
five of twenty. Unfortunately, as discussed in Appendix A, UK companies did not disclose
sufficient information pre-IFRS to allow us to estimate lease terms. We therefore assume that
20
UK firms’ lease terms do not change from 2003 to 2007 to allow cross-country comparisons in
2003. We discuss the implications of this assumption further below.
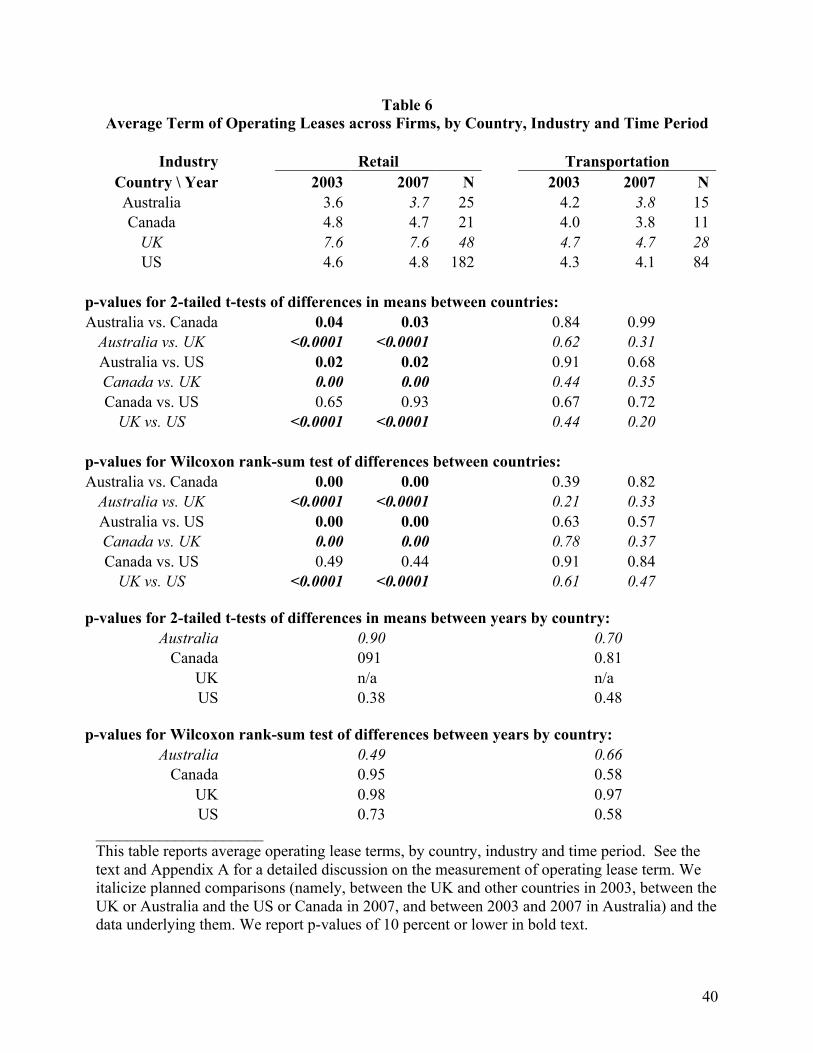
Table 6 shows the average term of operating leases using the weighted-average lease
term as discussed above by country, industry and year. In the lower portion of the table, we
report the p-values for t-tests and Wilcoxon rank-sum tests. We discuss tests with a two-tailed p-
value of 10 percent or lower as significant. In Hypothesis 2 we are interested in testing the effect
of having no bright line for useful life, so we have italicized the data for the UK and post-IFRS
Australia and the comparisons of these two regimes against others. We include all pair-wise
comparisons across countries, for completeness.
We observe that the UK has consistently longer operating lease terms than all three other
countries in both industries, both before and after IFRS. The UK’s Retail lease term, averaged
over 2003 and 2007, of 7.6 years is significantly higher than Australia (3.7 years), Canada (4.8
years), and the US (4.7 years) to more than 99 percent confidence, but we find no significant
difference in Transportation (4.7 years versus 4.0 years, 3.9 years, and 4.2 years for Australia,
Canada, and the US respectively). With our second hypothesis, we expect the absence of a
bright line for useful life will lead to longer operating lease terms. Thus, the UK’s longer lease
terms provide support for H2, but these lease terms are measured using post-IFRS data.
Australia post-IFRS, with the shortest operating lease terms, does not support H2.
Next we consider the impact of IFRS adoption in Australia and the resulting removal of
the useful life bright line. Consistent with the above logic, we expect operating lease terms to
lengthen in Australia after IFRS as firms more aggressively exclude longer leases from capital
lease treatment. At the bottom of Table 6, we report p-values for t-tests and Wilcoxon rank-sum
tests between 2003 and 2007 for all countries. We note that the lack of any perceptible change in

21
lease terms in Canada and the US lends credibility to our assuming that UK terms did not
change, while also obviating the need to control for non-accounting influences on lease terms in
Australia. Australian operating lease terms increase from 3.6 years to 3.7 years for Retail under
IFRS, but decrease from 4.2 years to 3.8 years in Transportation under IFRS. Neither change is
statistically significant, with p-values of 0.90 and 0.70 respectively.
Based on the above, we conclude that regime-specific differences across countries drive
the operating lease term differences across countries. If the lack of a useful life bright line
caused the longer operating lease terms in the UK, then we would expect to find a similar result
for Australia post-IFRS. Since we do not, we cannot conclude that the bright line for useful life
causes shorter operating lease terms, or its absence promotes longer terms.
4.3 H3: Lease present value bright lines lead to more contingent rents
Next, we consider whether a present value bright line leads to more transaction structuring
using contingent rents to reduce the present value of future minimum lease payments below 90%
of fair value. In 2003, all of our sample countries had a bright-line criterion to qualify for
operating lease treatment, and all excluded contingent rentals from minimum lease payments. In
2007, Australia and the UK adopted IFRS, which has no bright line. We therefore look for
cross-country differences in 2007, and pre- versus post-IFRS differences in Australia and the
UK. We cannot include Canada in our tests of H3 because Canadian companies rarely disclose
operating lease expense, a necessary data item for our contingent rental measure, which we
describe below. Consequently, our cross-country tests are limited to comparing the US to
Australia or the UK. If this bright line causes companies to use more contingent rentals, we
should find US companies in 2007 using more contingent rentals than companies reporting under
22
IFRS, and Australian and UK companies reducing their use of contingent rentals between 2003
and 2007.
Few companies in any country disclose contingent rentals, so we rely on a proxy.15 We
conjecture that the difference between the operating lease expense in year t and the amount
disclosed in year t-1 as one-year-ahead operating lease commitment comprises mainly contingent
rentals. Consequently, we calculate the ratio of prior year disclosed commitment to current year
operating lease expense, to estimate the non-contingent proportion of operating lease expense. A
lower number represents more contingent rentals.
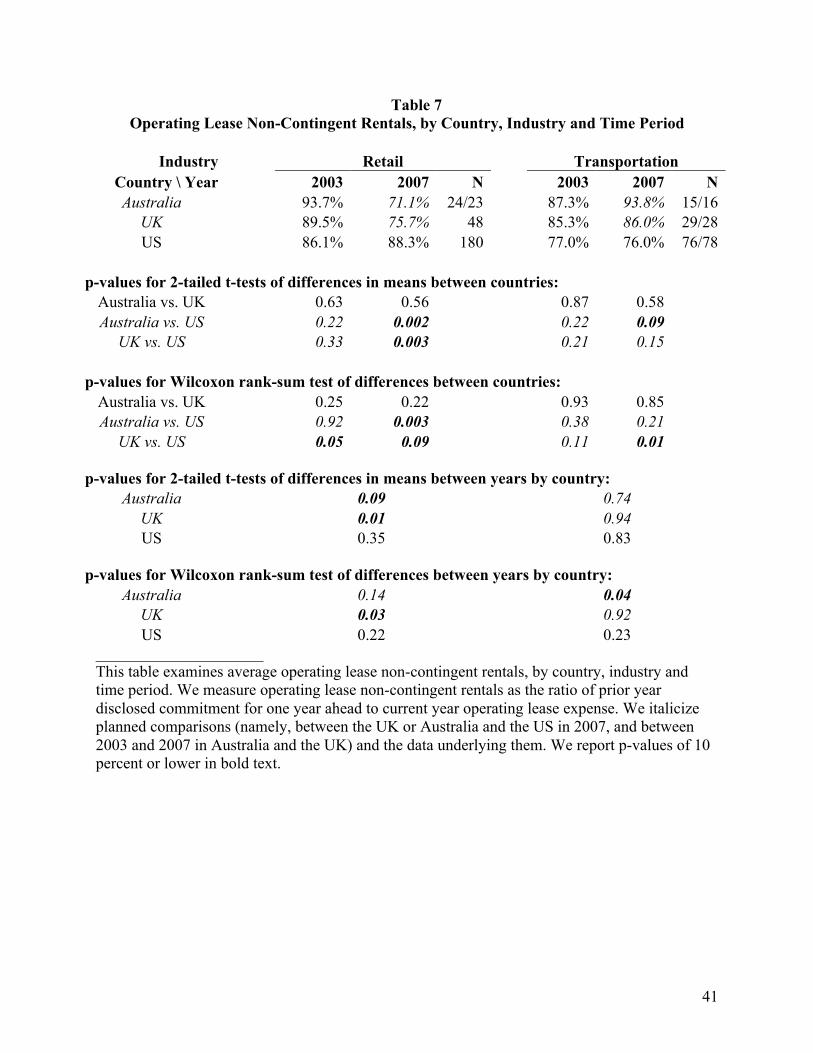
Table 7 reports our tests of H3. As was true for H2, the available data limit our
observations to test H3. For several sample firms, we lose only one observation due to missing
data rather than both, causing the number of observations to be different between 2003 and 2007.
In Retail, we lose between two and five firms per country, while in Transportation we lose
between one and seventeen firms, representing 3.3 percent to 25 percent of observations.
The top portion of Table 7 shows the average non-contingent proportion of operating lease
expense by country (omitting Canada), industry, and time period. In the lower four portions, we
report p-values for t-tests and Wilcoxon rank sum tests, for between-country, and between years
within-country tests. We show p-values below 10 percent in bold, and we italicize planned
comparisons between the US and Australia or the UK in 2007. We report all pair-wise
comparisons for completeness.
15 Australia requires that companies separately disclose both minimum payments and contingent rentals under operating leases for the current year (see AASB1008 paragraph 11.1(b)); however, no other sample country requires the same disclosure and Australian companies list contingent rentals in fewer than 15 percent of observations. As a result, we use our constructed proxy for Australia as well.
23
Pre-IFRS, the US is similar to Australia and the UK in both industries, with only the UK-
US rank-sum test showing a significant difference (p-value = 0.05). Post-IFRS in Retail,
opposite the prediction of H3, the US has a significantly higher proportion of non-contingent
rentals than either Australia or the UK. Strikingly, in Retail in 2003, we find Australian and UK
firms with nominally higher (though generally not significantly so) proportions of non-
contingent rentals than US companies (93.7% and 89.5% versus 86.1%, respectively), while in
2007 the roles reverse, significantly (71.1% and 75.7% versus 88.3%, respectively). Our within-
country across-years tests confirm that the results described above stem from Australian and UK
companies increasing their use of contingent rentals, and not from US companies decreasing
their use. This suggests that IFRS’ elimination of bright lines leads to more transaction
structuring through contingent rentals, contrary to H3.
In Transportation, we find weak support for H3. Both Australian and UK companies
nominally increase their proportion of non-contingent rentals, with the Australian increase
significant according to the Wilcoxon test. In 2007, the Australia-US difference is significant at
the 9% level according to the t-test, though insignificant according to the Wilcoxon, and the UK-
US difference is significant at the 1% level according to the Wilcoxon test, though insignificant
according to the t-test. In Transportation, therefore, we find some support for H3. The contrary
results in Retail lead us to question whether the differences stem from IFRS.
5. Conclusion
The idea that principles-based standards lead to more representative financial reporting by
reducing the propensity for transaction structuring is firmly entrenched in the thought processes
of the SEC, FASB and IASB (see SEC 2008 and FASB/IASB 2010). Standard-setters and

24
regulators believe that eliminating bright-line tests and focusing on general principles will reduce
transaction structuring, because firms will follow and auditors will enforce the principles. We
explore this issue by examining whether statements of principle or the elimination of bright lines
affect companies’ reporting leasing contracts as operating leases.
For two lease-intensive industries, Retail and Transportation, we explore whether the
presence of rules-based bright-line tests for leasing led to increased transaction structuring within
firms relative to firms operating in principles-based regimes having fewer or no bright lines. The
regimes we study are in four countries, Australia, Canada, the UK and the US, and in two time
periods, before and after Australia and the UK switched to IFRS. We examine the extent of
capital lease use, the lease term and the use of contingent rentals. While we find differences in
leasing structure and activity across countries, industries, and time periods, our evidence does not
support the notion that principles-based standards limit transaction structuring, nor that
eliminating bright lines does so. The fact that we find statistically significant differences across
countries and through time mitigates concerns that our tests lack power.
Our findings contribute to the debate about principles- versus rules-based standards. We
find no clear evidence that principles-based standards provide the expected benefit of limiting
transaction structuring, suggesting that benefits stemming from general principles may be more
elusive than thought by regulators and standard-setters.

25
References
Agoglia, C., T. Doupnik, G. Tsakumis, “Principles-Based versus Rules-Based Accounting Standards: The Influence of Standard Precision and Audit Committee Strength on Financial Reporting Decisions,” The Accounting Review 86:3 (2011) pp. 747-767.
Australian Accounting Standards Board (AASB), “Leases,” Accounting Standard No. 1008 (AASB1008), Victoria, NSW, Australia: (October 1998).
Canadian Institute Of Chartered Accountants (CICA), “Leases” CICA Handbook—Accounting (CICA HB), Section 3065, Toronto, ON, Canada: (January 1979).
Cohen, J., G. Krishnamoorthy, M. Peytcheva, A. Wright, “The Impact of Regulatory Enforcement and Principles-Based Accounting on Auditors’ Judgments to Curb Aggressive Reporting,” Boston College, Northeastern University, and Lehigh University working paper (April 2011).
Financial Accounting Standards Board (FASB), “Accounting for Leases” Statement of Financial Accounting Standards No. 13 (FAS13), Norwalk, CT, USA: (November 1976), http://www.fasb.org/st/.
Financial Accounting Standards Board (FASB)/International Accounting Standards Board (IASB), “Leases” Exposure Draft, Norwalk, CT, USA: (August 17, 2010).
Imhoff, E., R. Lipe, and D. Wright, “Operating leases: Impact of Constructive Capitalization,” Accounting Horizons 5:1 (1991) pp. 51–63.
Imhoff, E., R. Lipe, and D. Wright, "The Effects of Recognition Versus Disclosure on Shareholder Risk and Executive Compensation," Journal of Accounting, Auditing & Finance 8:4 (1993) pp. 335-368.
Imhoff, E.A. and J.K. Thomas, “Economic Consequences of Accounting Standards: The Lease Disclosure Rule Change,” Journal of Accounting and Economics 10:4 (1988) pp. 277-310.
Institute of Chartered Accountants in England and Wales (ICAEW), “Accounting for Leases and Hire Purchase Contracts,” Statement of Standard Accounting Practice No. 21 (SSAP21), London, England: (August 1984).
International Accounting Standards Committee (IASC), “Leases,” International Accounting Standard 17 (IAS17), London, England: (December 1997), revised and re-issued by International Accounting Standards Board (IASB), London, England: (December 2003).
Jamal, K., H.-T. Tan, “Joint Effects of Principles-Based versus Rules-Based Standards and Auditor Type in Constraining Financial Managers’ Aggressive Reporting,” The Accounting Review 85:4 (2010) pp. 1325-1346.
26
Maines, L.A., E. Bartov, P. Fairfield, D.E. Hirst, T.E. Iannoconi, R. Mallett, C.M. Schrand, D.J. Skinner and L. Vincent, “Evaluating Concepts-Based vs. Rules-Based Approaches to Standard Setting,” Accounting Horizons 17:1 (2003) pp. 73-89.
Mueller, G. G., H. Gernon, and G. Meek., eds. Accounting: An International Perspective. Chicago, IL: Richard D. Irwin (1997).
Nelson, M., “Behavioral Evidence on the Effects of Principles- and Rules-Based Standards,” Accounting Horizons 17:1 (2003) pp. 91-104.
Nelson, M., J. Elliott, R. Tarpley, “Evidence from Auditors about Managers’ and Auditors’ Earnings Management Decisions,” The Accounting Review 77:supplement (2002) pp.175-202.
Nobes, C.W., “IFRS Practices and the Persistence of Accounting System Classification,” Abacus 47:3 (2011) pp. 267-283.
Schipper, K., “Principles-based Accounting Standards,” Accounting Horizons 17:1 (2003) pp. 61-72.
Securities Exchange Commission (SEC), Final Report of the Advisory Committee on Improvements to Financial Reporting, available at http://www.sec.gov/about/offices/oca/acifr.shtml (August 2008).
27
Appendix A. UK pre-IFRS operating lease disclosures
Prior to 2005, most UK companies disclosed their future commitments under operating leases in a format different from that used in North America or Australia. The UK’s SSAP21, para. 56, required lessee companies to disclose “the payments which he is committed to make during the next year, analysed between those in which the commitment expires within that year, in the second to fifth years inclusive and over five years from the balance sheet date”. In contrast, the other jurisdictions provide guidance similar to that in FAS13, para. 16, which requires the company to disclose “[f]uture minimum rental payments required as of the date of the latest balance sheet presented, in the aggregate and for each of the five succeeding fiscal years.” Figure A.1 gives examples of disclosures from UK retailer Marks & Spencer and US retailer Nordstrom Inc. for illustration. Figure A.2 shows how a single hypothetical company with seven identical leases expiring one per year over the next seven years would report its information under (a) US and Canadian guidance, (b) IFRS and Australian guidance, and (c) pre-IFRS UK guidance. We convert UK data to the format used in other jurisdictions, by the following method. Denote the value reported in the UK for future period t as UK[t] and the value reported in the other jurisdictions as World[t]. Denote the time period for the lump-sum beyond five years as T. For the first year, the World value is simply the sum across years of all the UK values:
€
World[1] = UK[t]t=1
T
∑
If we had UK data for each of the years 2 through 5, we would similarly compute the World amount by summing beginning at that year. We use the detailed data disclosed by UK firms in 2007 to extrapolate the aggregate amount for years 2 through 5. Denote the aggregate amount for year 1 in 2007 as η1, and for years 2 through 5 in 2007 as η2-5. We apply the following formula:
€
World[2 − 5] =η2−5η1
⎛
⎝ ⎜
⎞
⎠ ⎟ × World[1]( )
Prior to switching to IFRS in 2005, UK firms generally provided neither lease terms nor aggregate undiscounted cash flows, which would allow us to estimate the World[T] value. Consistent with World[2-5] above, we use the detailed data disclosed by UK firms in 2007 to extrapolate World[T]. Denote the amount for the thereafter period in 2007 as ηT. Our formula for the lump-sum value beyond 5 years is:
€
World[T] =ηT
η2−5 +η1
⎛
⎝ ⎜
⎞
⎠ ⎟ × World[2 − 5] +World[1]( )
Finally, our estimate of the aggregate undiscounted cash flows is the sum of the three World values described above. By using the method above to manage data restrictions, we effectively make the pre-IFRS lease term equal to the post-IFRS lease term, eliminating the possibility of testing for such a change.

28
Figure A.1: Operating lease minimum commitment disclosures from a UK and a US retailer
Extract from note 30, “Commitments and Contingent Liabilities” of Marks & Spencer’s Annual report and financial statements 2004:
Extract from note 12, “Leases” of Nordstrom Inc.’s Annual report 2004:
_____________________ This figure provides examples of disclosures of future commitments under operating leases from the 2004 annual reports of UK retailer Marks & Spencer and US retailer Nordstrom Inc.

29
Figure A.2: Example of disclosed minimum operating lease payments from simulated data
Lease cash flows future year 1 2 3 4 5 6 7
Lease 1 100 2 100 100 3 100 100 100 4 100 100 100 100 5 100 100 100 100 100 6 100 100 100 100 100 100 7 100 100 100 100 100 100 100
1 2 3 4 5 there-
after (a) US or Cdn format 700 600 500 400 300 300
1 2-5 there-
after (b) Aus. or IFRS format 700 1800 300
1 2 3 4 5 there-
after (c) UK format, pre-IFRS 100 100 100 100 100 200
1 2-5 there-
after aggregating 2-5 100 400 200
_____________________ This figure shows how a hypothetical company with seven identical leases expiring one per year over the next seven years would report its information under (a) US and Canadian guidance, (b) IFRS and Australian guidance, and (c) pre-IFRS UK guidance. See Appendix A for a detailed discussion on how the data for the pre-IFRS UK regime is reported.

30
Appendix B. Compustat lease data
As we describe further below, we found that Compustat lease data often were incomplete or had data errors. We base our analysis and conclusions below on reviews of Compustat data and comparisons with data from companies’ annual reports. We obtained US and Canadian data from the Compustat Fundamentals Annual file for North America, and the UK and Australian data from the Compustat Fundamentals Global Annual file with country codes ‘GBR’ and ‘AUS’. Incomplete data: For operating leases, Compustat collects annual footnote disclosures on one-year through five-year-out operating lease commitments (MRC1-MRC5), five-year total lease commitment (MRCT), thereafter (beyond five years) commitments (MRCTA), and operating lease expense (titled ‘rental expense’; XRENT). We found operating lease commitment data available for firms in the US and Canada, but not for the UK or Australia. We found rental expense data for all countries when disclosed. Compustat does not collect data on operating lease term, even when the company discloses it. In summary, we found operating lease data generally complete for the US and Canada, except for lease term data. We found operating lease data generally missing for the UK and Australia, except for rent expense. For capital leases, Compustat has fields for annual footnote disclosures for two-year- through five-year-out capital lease commitments (CLD2-CLD5), but does not collect one-year-out or thereafter capital lease commitments. As a result, total undiscounted capital lease commitment is unavailable through Compustat. In addition, Compustat collects total discounted capital lease commitment (DCLO). We found this field populated for firms in the US and Canada, but not for those in the UK and Australia. Compustat contains the data field ‘loans/claims/advances - lease’ (LCAL), but this field is never populated for any of our four countries. For capital lease assets, Compustat has fields for: capital lease assets at cost (FATL), net capital lease assets (PPENLS), and accumulated depreciation on capital lease assets (PPACLS). While Compustat populates the first of these, neither of the latter two is populated. Compustat contains fields for the following current-year capital lease data: capital lease principal payments (CAPFL), capital lease interest payments (INTFL), and capital lease increases (FINLE). For UK firms, we found these fields populated only in 2003, prior to adoption of IFRS.16 Compustat does not capture any data on capital lease terms or interest rates. In summary, capital lease data are largely missing for all countries. Data errors: To assess the accuracy of Compustat’s data, we compared it to data from annual reports for a sample of firms. We compared five data items: one-year out operating lease commitment (MRC1), operating lease expense (XRENT), two-year out capital lease commitment (CLD2), total discounted lease commitment (DCLO), and capital lease assets at cost (FATL). For the US, we used 2004 data for 21 firms in SIC code 2836 that had capital lease balances in Compustat and 10-K, 20-F or 40-F forms available from EDGAR. All available data were 16 Among 1,288 Australian firms in 2003, we found the CAPFL and FINLE fields populated for one firm, and the INTFL populated for two firms.

31
correctly reflected in Compustat, with the exception of capital lease assets at cost. This Compustat field had errors for 18 of 21 firms because Compustat often includes leasehold improvements, normally a separate asset that is not part of the lease contract, in capital lease assets. Relatedly, we found many instances where Compustat reported capital lease assets, but no capital lease liabilities for a firm-year. On investigation, all of these proved to be cases where Compustat had coded leasehold improvements as capital lease assets. For Canada, we used 2004 data for 21 firms in SIC code 7372 with lease activity and annual reports available from company websites or SEDAR. Operating lease data (MRC1 and XRENT) were correctly recorded in Compustat when disclosed, but operating lease expense was only disclosed by two of 21 firms since this disclosure is not required in Canada. For capital leases, two-year out commitment was correct in 18 of 21 firms, with Compustat missing the disclosed figure for two firms and reporting an incorrect figure for one firm. Total discounted lease commitment was correct for 19 of 21 firms, with Compustat missing the disclosed figure for one firm and reporting an incorrect figure for one firm. Capital lease assets were correct for 2 of 21 firms, with Compustat reporting leasehold improvements as capital lease assets for 18 firms, and missing the disclosed figure for one firm. For the UK, we compared Compustat to hand-collected data from annual reports for 13 firms with capital leasing activity and available annual reports in 2004. We investigated different data items in the UK than in the US and Canada, because of the differences in Compustat’s coverage, as we discussed above under the heading “Incomplete data”. Specifically, we investigated: current year capital lease principal payment (CAPFL) and interest payment (INTFL), capital lease increases (FINLE), and operating lease expense (XRENT). We found current year capital lease principal payments reported correctly for all firms. Capital lease interest payments were correct for nine of thirteen firms, with Compustat missing the disclosed figure for the remaining four firms. Capital lease increases were correct for ten of thirteen firms, with Compustat missing the disclosed figure for three firms. Operating lease expense was correct for eight of thirteen firms, with Compustat missing the disclosed figure for three firms and reporting incorrect figures for two firms. We added Australia to our study after we had conducted the above accuracy analysis and concluded that we would need to hand-collect footnote disclosures. Hence, we have no similar accuracy comparisons for Australia. In summary, we found Compustat data for leases to be generally accurate for the US and Canada, with the exception of capital lease assets, which was incorrect for 37 of 42 firms. We found several errors in Compustat’s Canadian data (three of 21 for CLD2; two of 21 for DCLO). We also found errors in the UK, including incorrect figures (two of thirteen for XRENT) and missed data (four of thirteen for INTFL; three of thirteen for FINLE; three of thirteen for XRENT). Conclusion: We found Compustat’s operating lease data to be generally complete and accurate for the US and Canada, but incomplete for the UK and Australia, where Compustat evidently has not collected the available footnote data. Compustat’s capital lease data are generally incomplete in the US and Canada, lacking current year payments, one-year-out commitments and thereafter (beyond

32
five years) commitments, all of which firms disclose. Compustat has data fields for net capital lease assets and accumulated depreciation on capital lease assets, but generally does not populate these fields. Compustat’s capital lease assets at cost are mostly incorrect when available. For UK firms, Compustat does not provide the capital lease commitment data that companies disclose, and often records missing values for current year payments that we found available in company disclosures. Overall, we recommend careful checking before relying on Compustat lease data.
33
Table 1 Lease Accounting Regimes and Associated Hypotheses
Panel A: Lease accounting regimes, by country and time period
Country Years Accounting Regime
Lease Acctg: Rules/Principles Standard Bright Lines
Australia 2003-04 Dom.Aus Principles AASB1008 Lease term > 75% life; PV lease payments > 90% FMV 2007-08 IFRS Principles AASB117 None Canada 2003-04 Dom.Cdn Principles CICA.HB3065 Lease term > 75% life; PV lease payments > 90% FMV 2007-08 Dom.Cdn Principles CICA.HB3065 Lease term > 75% life; PV lease payments > 90% FMV UK 2003-04 Dom.UK Principles SSAP21 PV lease payments > 90% FMV 2007-08 IFRS Principles IAS17 None US 2003-04 Dom.US Rules SFAS13 Lease term > 75% life; PV lease payments > 90% FMV 2007-08 Dom.US Rules SFAS13 Lease term > 75% life; PV lease payments > 90% FMV
34
Table 1 (continued)
Panel B: Classification of lessee accounting regimes, and associated hypotheses
Strict rule Principle-based standard Hypothesis
Rules vs. Principles
Dom.US
Dom.Cdn, Dom.Aus, Dom.UK, IFRS
H1: Principles-based regimes use more capital leases than rules-based.
Bright line No bright line Bright Lines Lease term > 75% Life Dom.US,
Dom.Cdn, Dom.Aus
Dom. UK, IFRS H2: Regimes with a term bright line have shorter operating lease terms than those without.
PV lease payments > 90% FMV
Dom.US, Dom.Cdn, Dom.Aus, Dom.UK
IFRS H3: Regimes with a PV bright line have higher contingent rents on operating leases than those without.
_____________________ This table summarizes lease accounting regimes and associated hypotheses. Panel A identifies reporting regimes by country and time period and Panel B relates the accounting regimes to our hypothesis tests.
35
Table 2 Sample Selection
Australia Canada United Kingdom United States Retail Transport. Retail Transport. Retail Transport. Retail Transport. Firms in Fama-French Retail and
Transportation sectors with Compustat data in 2007 39 30 31 26 94 54 310 162
Less: Firms lacking Compustat data
for 2003 -12 -9 -9 -11 -36 -20 -91 -49 Firms reporting under non-
domestic GAAP 0 0 -1 -2 0 -1 -3 0 Sample for hand-collection
from annual reports 27 21 21 13 58 33 216 113 Less:
Firms for which we could not locate one or both annual reports -1 0 0 -1 -6 -3 -30 -20
Firms whose annual report disclosures lack essential information 0 -1 0 0 -1 0 -1 0
Final sample - firms 26 20 21 12 51 30 185 93 Final sample - firm-years 52 40 42 24 102 60 370 186
_____________________ This table shows the stages of our sample selection and the data lost at each stage, by industry within country.
36
Table 3 Descriptive Information about Sample Firms
Australia Canada United Kingdom United States Retail Transport. Retail Transport. Retail Transport. Retail Transport. Size: Total assets: N 52 40 42 24 102 60 370 186
Mean 616.9 2,434.5 2,657.0 1,662.9 2,975.9 2,108.5 3,663.3 4,795.1 Median 83.1 88.1 686.5 613.4 327.4 452.7 671.7 803.3
Total revenue: N 52 40 42 24 102 60 370 186 Mean 1,590.8 1,067.8 4,964.4 919.9 4,645.1 1,659.4 7,386.0 3,869.9 Median 149.5 116.3 1,004.8 385.6 730.5 338.7 1,386.0 732.6
DuPont analysis: Net income / Total revenue: N 52 39 42 24 100 60 369 182
Mean (0.09) (0.05) (0.04) 0.07 (4.13) 0.00 -0.00 0.02 Median 0.04 0.04 0.03 0.05 0.03 0.03 0.02 0.03
Total revenue / Total assets: N 52 40 42 24 102 60 370 186 Mean 2.20 1.09 1.97 1.07 1.88 1.17 2.14 2.38 Median 2.35 0.87 1.90 0.84 1.78 0.91 1.94 1.06
Total assets / Equity: N 52 39 42 24 102 60 370 186 Mean 0.89 2.67 2.18 2.37 3.07 3.54 2.46 6.36 Median 2.32 2.38 2.07 2.23 2.22 2.40 2.02 2.26
Amount of leasing: Total lease commitment / Total assets: N 52 40 42 24 102 60 370 186
Mean 0.62 0.28 0.46 0.19 2.25 0.53 0.88 0.49 Median 0.42 0.17 0.19 0.13 0.81 0.32 0.44 0.11
_____________________ This table provides descriptive information about our sample companies, by industry within country. We convert non-US dollar currencies to US dollars using the spot rate on the balance sheet date for balance sheet amounts and the average yearly rate for income statement amounts. See the text for variable definitions.
37
Table 4 Capital and Operating Lease Use, by Country, Industry and Time Period
Panel A: Firms reporting capital leases, as percent of all firms, by country-industry-year
Industry Retail Transportation Country \ Year 2003 2007 2003 2007 Australia 65.4% 57.7% 70.0% 60.0% Canada 52.4% 61.9% 50.0% 50.0%
UK 29.4% 52.9% 40.0% 53.3% US 44.3% 49.7% 47.3% 49.5%
p-values for 2-tailed tests of differences in proportions: Australia vs. Canada 0.37 0.77 0.26 0.58
Australia vs. UK 0.00 0.69 0.04 0.02 Australia vs. US 0.04 0.45 0.07 0.39 Canada vs. UK 0.07 0.49 0.55 0.85 Canada vs. US 0.48 0.29 0.86 0.97
UK vs. US 0.06 0.68 0.48 0.71
Panel B: Firms reporting operating leases, as percent of all firms, by country-industry-year
Industry Retail Transportation Country \ Year 2003 2007 2003 2007 Australia 100.0% 96.2% 85.0% 85.0% Canada 100.0% 100.0% 91.7% 91.7%
UK 98.0% 94.1% 100.0% 93.3% US 98.9% 98.9% 92.5% 93.5%
p-values for 2-tailed tests of differences in proportions: Australia vs. Canada 1.00 0.36 0.58 0.58
Australia vs. UK 0.47 0.70 0.03 0.34 Australia vs. US 0.59 0.26 0.29 0.20 Canada vs. UK 0.52 0.26 0.11 0.85 Canada vs. US 0.63 0.63 0.92 0.81
UK vs. US 0.62 0.04 0.12 0.97 _____________________ This table reports the proportion of firms in each country-industry-year that use capital leases in Panel A, and the same proportion for operating leases in Panel B. The p-values for tests of differences are from the normal approximation to the binomial distribution. We italicize the data for the US and comparisons of the US against other countries. We report p-values of 10 percent or lower in bold text.

38
Table 5 Capital Lease Intensity, by Country, Industry and Time Period
Panel A: Capital lease intensity for firms reporting capital or operating leases, by country-industry-year
Industry Retail Transportation Country \ Year 2003 2007 2003 2007 Australia 13.8% 7.6% 39.7% 35.3% Canada 0.9% 1.1% 10.9% 8.7%
UK 3.7% 1.4% 4.2% 12.4% US 3.1% 5.2% 7.4% 6.8%
p-values for 2-tailed tests of differences in means: Australia vs. Canada 0.02 0.13 0.04 0.04
Australia vs. UK 0.04 0.03 <0.0001 0.02 Australia vs. US <0.0001 0.43 <0.0001 <0.0001 Canada vs. UK 0.45 0.68 0.19 0.67 Canada vs. US 0.22 0.16 0.55 0.73
UK vs. US 0.69 0.05 0.36 0.19 p-values for Wilcoxon rank-sum test: Australia vs. Canada 0.12 0.76 0.10 0.10
Australia vs. UK 0.00 0.43 0.00 0.06 Australia vs. US 0.01 0.52 0.00 0.01 Canada vs. UK 0.04 0.69 0.31 0.85 Canada vs. US 0.82 0.86 0.71 0.83
UK vs. US 0.03 0.79 0.27 0.45

39
Table 5 (continued) Panel B: Capital lease intensity for firms reporting capital leases, by country-industry-year
Industry Retail Transportation Country \ Year 2003 2007 2003 2007 Australia 21.1% 12.7% 53.9% 52.9% Canada 1.8% 1.8% 20.0% 15.9%
UK 12.6% 2.4% 10.4% 22.4% US 6.8% 10.4% 14.6% 12.9%
p-values for 2-tailed t-tests of differences in means: Australia vs. Canada 0.03 0.11 0.06 0.03
Australia vs. UK 0.41 0.03 0.00 0.03 Australia vs. US 0.00 0.65 <0.0001 <0.0001 Canada vs. UK 0.24 0.46 0.34 0.65 Canada vs. US 0.12 0.08 0.60 0.74
UK vs. US 0.17 0.02 0.56 0.19 p-values for Wilcoxon rank-sum test: Australia vs. Canada 0.10 0.39 0.14 0.02
Australia vs. UK 0.11 0.26 0.02 0.01 Australia vs. US 0.10 0.65 0.01 0.00 Canada vs. UK 0.39 0.99 0.51 0.71 Canada vs. US 0.27 0.08 0.72 0.77
UK vs. US 0.17 0.02 0.59 0.18 _____________________ This table examines capital lease intensity, by country, industry and time period. We define capital lease intensity as the capital lease proportion of total leasing activity, where leasing activity is undiscounted lease commitments. Panel A reports on firms with operating or capital lease activity. Panel B reports on the subset of those firms with capital lease activity. We italicize the data for the US and comparisons of the US against other countries. We report p-values of 10 percent or lower in bold text.
40
Table 6 Average Term of Operating Leases across Firms, by Country, Industry and Time Period
Industry Retail Transportation
Country \ Year 2003 2007 N 2003 2007 N Australia 3.6 3.7 25 4.2 3.8 15 Canada 4.8 4.7 21 4.0 3.8 11
UK 7.6 7.6 48 4.7 4.7 28 US 4.6 4.8 182 4.3 4.1 84
p-values for 2-tailed t-tests of differences in means between countries: Australia vs. Canada 0.04 0.03 0.84 0.99
Australia vs. UK <0.0001 <0.0001 0.62 0.31 Australia vs. US 0.02 0.02 0.91 0.68 Canada vs. UK 0.00 0.00 0.44 0.35 Canada vs. US 0.65 0.93 0.67 0.72
UK vs. US <0.0001 <0.0001 0.44 0.20 p-values for Wilcoxon rank-sum test of differences between countries: Australia vs. Canada 0.00 0.00 0.39 0.82
Australia vs. UK <0.0001 <0.0001 0.21 0.33 Australia vs. US 0.00 0.00 0.63 0.57 Canada vs. UK 0.00 0.00 0.78 0.37 Canada vs. US 0.49 0.44 0.91 0.84
UK vs. US <0.0001 <0.0001 0.61 0.47 p-values for 2-tailed t-tests of differences in means between years by country:
Australia 0.90 0.70 Canada 091 0.81
UK n/a n/a US 0.38 0.48
p-values for Wilcoxon rank-sum test of differences between years by country:
Australia 0.49 0.66 Canada 0.95 0.58
UK 0.98 0.97 US 0.73 0.58
_____________________ This table reports average operating lease terms, by country, industry and time period. See the text and Appendix A for a detailed discussion on the measurement of operating lease term. We italicize planned comparisons (namely, between the UK and other countries in 2003, between the UK or Australia and the US or Canada in 2007, and between 2003 and 2007 in Australia) and the data underlying them. We report p-values of 10 percent or lower in bold text.
41
Table 7 Operating Lease Non-Contingent Rentals, by Country, Industry and Time Period
Industry Retail Transportation
Country \ Year 2003 2007 N 2003 2007 N Australia 93.7% 71.1% 24/23 87.3% 93.8% 15/16
UK 89.5% 75.7% 48 85.3% 86.0% 29/28 US 86.1% 88.3% 180 77.0% 76.0% 76/78
p-values for 2-tailed t-tests of differences in means between countries:
Australia vs. UK 0.63 0.56 0.87 0.58 Australia vs. US 0.22 0.002 0.22 0.09
UK vs. US 0.33 0.003 0.21 0.15 p-values for Wilcoxon rank-sum test of differences between countries:
Australia vs. UK 0.25 0.22 0.93 0.85 Australia vs. US 0.92 0.003 0.38 0.21
UK vs. US 0.05 0.09 0.11 0.01 p-values for 2-tailed t-tests of differences in means between years by country:
Australia 0.09 0.74 UK 0.01 0.94 US 0.35 0.83
p-values for Wilcoxon rank-sum test of differences between years by country:
Australia 0.14 0.04 UK 0.03 0.92 US 0.22 0.23
_____________________ This table examines average operating lease non-contingent rentals, by country, industry and time period. We measure operating lease non-contingent rentals as the ratio of prior year disclosed commitment for one year ahead to current year operating lease expense. We italicize planned comparisons (namely, between the UK or Australia and the US in 2007, and between 2003 and 2007 in Australia and the UK) and the data underlying them. We report p-values of 10 percent or lower in bold text.
Recommended