Embed Size (px)
Citation preview
Effects on Investor Judgments from Expanded Disclosures of Non-Financial
Intangibles Information
Alex C. Yen Doctoral Student
The University of Texas at Austin Red McCombs School of Business
Department of Accounting
Visiting Lecturer Indiana University-Bloomington
Kelley School of Business Department of Accounting
Contact information:
e-mail: [email protected] Phone: (812) 855-9355
February 2004
Preliminary-Please Do Not Quote I thank my dissertation committee members, D. Eric Hirst (chair), Keith Brown, Steven Kachelmeier, Lisa Koonce, and Art Markman for their guidance and valuable comments. I thank David Barrett, Walt Blacconiere, Pat Hopkins, Kevin Jackson, Laureen Maines, Molly Mercer, Fred Phillips, Jamie Pratt, Jerry Salamon, Kristy Towry, David Upton, Michael Williamson, and workshop participants at Indiana University and the University of Texas at Austin for helpful comments and suggestions. I thank Ana Marques, David Verduzco, David Greene, Kirti Modi, and Gretchen Charrier for their assistance in obtaining study participants. I am grateful for financial support from the Deloitte & Touche Doctoral Fellowship, the Eugene & Dora Bonham Memorial Fund, and the Department of Accounting at the University of Texas at Austin.

Effects on Investor Judgments from Expanded Disclosures of Non-Financial Intangibles Information
Abstract
In this study, I use an experiment to examine whether and when expanded disclosures of
non-financial intangibles information affect investor judgments of financial performance. I
propose that, given the complexity of the relationships between today’s intangibles activities and
future financial results, disclosure alone of non-financial information may not be sufficient to
influence investors’ judgments. Instead, investors may need to receive supplemental discussion
of how a firm’s non-financial measures are causally linked to future financial performance, in
order to have the knowledge to use the non-financial information. Experimental results for the
full sample are mixed. I also examine the results for a subset of participants with relatively low
familiarity with the industry setting used in the study. For these participants, non-financial
measures are incorporated into performance judgments only when the supplemental links
discussion is provided. This study provides evidence on the benefits from expanded intangibles
disclosures and the necessary conditions for achieving such benefits.

1
Effects on Investor Judgments from Expanded Disclosures of Non-Financial Intangibles Information
1. INTRODUCTION
The ability of accounting and financial reporting to represent and report information that
is useful in assessing firm value and management performance has come under a great deal of
scrutiny in recent years. Evidence exists tha t an increasing number of items that affect valuation
are not captured in firms’ financial statements. This disconnect is particularly acute for firms
with large, unrecognized, investments in intangible assets. Critics suggest that firms should
compensate for this by expanding their disclosures of intangibles information, particularly
disclosures of non-financial measures (Lev, 2000, and Eccles, Herz, Keegan, and Phillips, 2001,
Financial Accounting Standards Board, 2002). Their rationale is that these expanded disclosures
will better communicate a company’s economics and help unlock additional relevant information
about firm value. This will allow investors to distinguish between strong and weak firms and to
make more differentiated judgments of past and future financial performance.
The realization of these benefits relies on the assumption that investors will react to and
use the expanded intangibles information in their judgments. Whether and when this happens is
unclear. It is possible that simply providing non-financial intangibles information will lead to
investors incorporating this information in their judgments. On the other hand, the relationships
between today’s intangibles activity and the related non-financial measures and future financial
results are often complex. If complex relations are misunderstood, mischaracterized, or even
ignored, expanded disclosures of non-financial intangibles information may not have the effect
on investors that their advocates envision. That is, disclosure alone of non-financial information
might not affect investors’ judgments, because investors lack the knowledge to use the
information.

2
In an experiment set in a research and development investment context, I study whether
and when expanded disclosure of non-financial intangibles information leads to different investor
judgments. I use a 2 X 2 plus 1 between subjects research design. The first factor that I
manipulate is links discussion. Participants who receive a report on non-financial measures
either receive it with or without a supplemental discussion of how the firm’s non-financial
intangibles measures are causally linked to future financial performance. This “links” condition
is inspired by the managerial accounting literature on the Balanced Scorecard (Kaplan and
Norton, 1993, 1996a, 1996b). The provision of cause-and-effect links is intended to clarify the
complex relationships between non-financial measures and future performance, thus leading to
increased use of non-financial intangibles disclosures in investor judgments.
The second manipulated factor is level of non-financial performance, where the
disclosing firm is identified as having either above or below-average performance on non-
financial measures. The performance manipulation is used to examine whether and when
investors differentiate between high and low performing firms by incorporating the content of
non-financial intangibles disclosures in their judgments. The “plus 1” is a control condition
where participants receive neither the report on non-financial measures nor the links discussion.
I hypothesize that, due to complexity in the data and complex relationships between non-
financial measures and future financial performance, disclosure of non-financial intangibles
information without links discussion is less likely to affect investors’ future financial
performance judgments. In other words, in the absence of links, investors’ performance
judgments in the above-average and below-average conditions are not significantly different
from each other, nor from judgments in the control condition, where non-financial measures are
not provided. When causal links are provided, I hypothesize that investors incorporate non-

3
financial measures into their judgments of future performance. This results in the prediction of a
links discussion by performance level interaction, where investors more strongly differentiate
between the above and below-average firms in their judgments when a links discussion is
provided.
I find mixed results with respect to my predictions, depending on which performance
measure is used as the dependent variable. For next period revenue estimates, investors’
estimates for above-average and below-average firms are not significantly different in the
absence of links, and they are significantly different when links are provided, as hypothesized.
For judgments of future revenue growth (3 to 5 years out), there is significant differentiation
without links, contrary to predictions. Additionally, providing links does not increase the
differentiation between above average and below average firms, also contrary to predictions.
Because the hypothesized relationships assume that investors do not already have well-
developed knowledge of the linkages between non-financial measures and future performance, I
partition the data based on investors’ self- ratings of their familiarity with the industry setting
used in the experimental materials. For the subset of participants who self- identified as having
lower familiarity with the industry setting (i.e. those participants who were most likely to acquire
knowledge and benefit from the links), results were stronger and more consistent with
predictions. For both next period revenue estimates and judgments of future revenue growth,
investors’ estimates for above-average and below-average firms are not significantly different in
the absence of links, and they are significantly different when links are provided, as
hypothesized.
Overall, these results suggest that disclosure alone of non-financial intangibles
information may not be sufficient to influence investors’ judgments and that some investors need

4
cause-and-effect link information to process and incorporate non-financial measures in their
judgments. Additionally, the results suggest that knowledge about non-financial measures and
their relationships with future financial performance measures helps to counteract non-financial
measures’ inherent complexities and that investors who do not already possess this knowledge
can acquire it when cause-and-effect linkages are provided.
This study is of interest to managers of firms (in particular CFOs and investor relations
staff of intangibles-heavy firms), accounting researchers, and standard setters. Managers have
expressed an interest in increasing the transparency of their disclosures to better communicate
information about firm value to investors (Eccles et al, 2001). Information about investors’
reactions to and use of intangibles information can help managers identify when their disclosures
are most effective, and help them achieve their goal of better communication.
Additionally, non-financial information is an emerging area of accounting research and I
provide evidence on the role of supplemental causal link disclosures and knowledge on
investors’ use of non-financial performance information. The experimental method is well-
suited for this study. Conducting my study in a laboratory setting allows me to control for
incentives and self-selection of disclosures, which would not be possib le using archival data
(Libby, Bloomfield, and Nelson, 2002). This study is also in contrast to prior behavioral
financial accounting studies that examine historical financial information and its influence on
judgments of future financial performance, and ultimately on investor valuation judgments (e.g.
Hirst and Hopkins (1998), Maines and McDaniel (2000), Krische (2001), Frederickson and
Miller (2002), and Hirst, Jackson, and Koonce (2003)). I examine how historical non-financial
measures influence perceptions of future financial performance. Given that these amounts are
non-financial and the relationships to future financial performance are complex, it is not clear ex

5
ante how they will be mapped into judgments of future financial performance by investors. This
study examines whether disclosure alone is sufficient to influence investor judgments or whether
supplemental links discussion is necessary.
Finally, the FASB has identified expanded disclosures of information about intangible
assets as one of its areas of interest and I provide evidence on the variables that influence
investors’ use of intangibles information. In a recent commentary that summarizes academic
research with implications for the FASB’s intangibles project, the Financial Accounting
Standards Committee of the American Accounting Association (AAA FASC, 2003) observes
that there is “little direct evidence on the benefits and costs of intangibles disclosures.” This
study provides evidence on the potential benefits from expanded intangibles disclosures in the
form of more differentiated investor judgments, and the necessary conditions for achieving such
benefits.
The remainder of the paper is organized as follows. Section 2 describes the experimental
context, theory, and hypotheses to be tested. Section 3 describes the experiment used to test the
hypotheses. Section 4 describes the results, and section 5 summarizes the findings and concludes.
2. THEORY AND HYPOTHESES
Experimental Context: Forecasting in a Research and Development Investment Setting
As observed earlier, there is evidence that a number of items that affect valuation are not
captured in firms’ financial statements. This disconnect is particularly acute for firms with large,
unrecognized, investments in intangible assets (Amir and Lev, 1996, Lev and Sougiannis, 1996,
and Lev, 2000).1 For investors in these firms, this makes the task of forecasting future financial
performance much more challenging.
1 Some researchers disagree that there has been a decline in the value-relevance of financial statements. Collins, Maydew, and Weiss (1997) and Francis and Schipper (1999) find little evidence that the overall value relevance of
6
For a pharmaceutical company in the midst of a research and development (R&D)
initiative, the company may be reporting significant revenue growth, but it may also report much
smaller increases in earnings, due to its R&D expense. Given this scenario, how does an
investor forecast future financial performance? First, forecasting earnings may be very difficult,
because of the uncertainties surrounding the persistence of discretionary R&D expense. On the
other hand, forecasting revenue is incrementally easier than forecasting earnings because it is not
directly affected by R&D expense, but even so, the timing of future revenue could be
significantly affected by the fruits of the current R&D initiative.
Prior empirical-archival research suggests that current required disclosures of R&D
expense may be useful to investors in R&D intensive firms. Lev and Sougiannis (1996) find that
the valuation of R&D intensive firms is more consistent with adjusted GAAP earnings (R&D
expenditures added back and amortized) than GAAP earnings (immediate expensing of R&D
expenditures). These results suggest that investors in R&D intensive firms make an adjustment
for R&D expense in their valuations. However, disclosures of R&D expense, while useful for
approximating future benefits from R&D investment, are coarse estimates of those benefits.
They reflect inputs into the R&D process, not outputs. For example, two firms with the same
amount of R&D spending could have very different future financial prospects due to their
different respective returns on R&D investment. Disclosures of R&D expense alone would not
be able to help investors differentiate between these two firms.
financial statements has declined over time. Similarly, Core, Guay, and Van Buskirk (2002) find little evidence of a change in the determinants of equity values over a 25 year period ending in 2000. While the debate on the value relevance of financial statements remains unsettled, the fact remains that standard setters and financial statement preparers have been spurred on to take action. Accordingly, this paper examines the effect on investors from some potential actions to be taken.

7
Disclosure of Non-Financial Measures
To reduce this information gap, Lev (2000) and Eccles et al (2001) call upon companies
to expand and improve the disclosures of intangibles information in financial reports, particularly
non-financial information about a company’s activity and progress in the various stages of the
intangibles/innovation process. These disclosures of non-financial measures, especially those
that are leading indicators of intangibles process outputs, provide information on additional
dimensions of firm performance that are not captured in disclosures of R&D expense. Non-
financial measures are arguably more relevant than disclosures of R&D spending because they
measure the firm’s activity and progress in later stages of the innovation process, when the
effects on future financial performance are more imminent. In the case of the two firms with
equal amounts of R&D investment, any differences in their internal returns on R&D investment
would be reflected in their performance on non-financial measures (for example, above-average
vs. below-average patent generation). Investors who are provided with non-financial intangibles
disclosures would then be able to better differentiate between these firms.
If non-financial measures provide information about the amount and timing of future
benefits from the current R&D initiative, investors should be able to differentiate between firms
on the basis of the effectiveness of their R&D activities. That differentiation should then be
reflected in investors’ forecasts of revenue (and revenue growth). However, the effect of
disclosing non-financial measures on investors’ forecasts of earnings (and earnings growth) is
less straightforward, because of the unknown nature of the future R&D spending strategy of the
firm.
This discussion illustrates how expanded disclosures of non-financial measures can
facilitate forecasting for R&D intensive firms. However, the envisioned benefits to investors

8
from expanded disclosures can only be realized if investors process and use the non-financial
measures. Upton (2001) observes that “To be useful, a metric must be understood. Many
nonfinancial metrics…are unfamiliar to users of business information,” suggesting that
disclosures may be too complex for investors to understand. If investors do not possess the
knowledge to understand and/or use non-financial intangibles information, the performance-
relevant information contained in non-financial measures may not be reflected in their
performance judgments.
In figure 1, I summarize the stages of investors’ processing of non-financial intangibles
information. Figure 1 indicates that even if non-financial information is disclosed, there are
pitfalls at nodes along the way, where investors who lack knowledge about non-financial
measures and their relationships with financial measures could diverge from the path, and end up
with a performance judgment that does not reflect performance on non-financial measures. For
example, investors who lack knowledge about non-financial measures and their relationships
with financial measures may fail to acquire or retain non-financial intangibles information, so
that the information is not reflected in their performance judgments. Additionally, even if non-
financial intangibles information is acquired and retained in memory, investors who lack
knowledge about the relationships between non-financial and financial measures may fail to
properly use/weight this information, so that it is not reflected in their performance judgments.
[Insert Figure 1 here]
Given the complexities inherent in non-financial measures and their relationships to
future financial performance, I hypothesize that with disclosure alone (i.e. without links), non-
financial measures will not be incorporated into investors’ performance judgments. This
hypothesis is formalized as follows:

9
H1: Investors’ performance judgments will not reflect information contained in disclosures of non-financial intangibles information, and will not differentiate between above-average, below-average, and non-disclosing (control condition) firms, with disclosure alone. If investors do not differentiate between above-average and below-average firms, then the
benefits from expanded disclosures of non-financial intangibles will not be realized. To increase
the relevance of non-financial measures, investors may need to receive supplemental
information, linking non-financial measures to future financial performance. This is discussed in
the following section.
Providing Cause-and-Effect Links
In recent years, one of the popular topics in the managerial accounting literature has been
the importance of incorporating non-financial measures into performance measurement (Kaplan
and Norton, 1992, 1993, 1996a, 1996b). One of the most discussed tools is the Balanced
Scorecard, introduced by Kaplan and Norton (1992). The Balanced Scorecard specifies cause-
and-effect paths linking financial and non-financial measures to the company’s overall goal. It is
hypothesized to be more effective than previous systems in facilitating managers’ decisions
(Kaplan and Norton, 2001) because providing linkages leads to managers internalizing non-
financial measures more appropriately (Rucci, Kirn, and Quinn, 1998). In this study, I examine
whether providing cause-and-effect linkages could also affect investors’ incorporation of
intangibles-related non-financial measures in their investment judgments.
A look at firms’ financial reports suggests that some firms are attempting to provide
linkages in their communications with investors. In its 1999 annual report Axcan Pharma
reported:
10
“Our aim for the next five years is to have one product or new indication from our research program approved each year in the United States……Axcan is conducting a double-blind study…in Canada and the United States. Once the study is completed in 2001, we will seek regulatory approval to promote URSOR 250 mg as an effective treatment for this disease in the United States. We foresee approval for this treatment by 2004, with potential revenues of US $150 million.”
The Axcan disclosure links the innovation activity with the expected time to market and the
potential future revenues, providing linkages of non-financial measures to financial performance.
However, linkage disclosures are not made by all companies on a consistent basis (Upton 2001),
suggesting that there is some disagreement over the effectiveness of such disclosures.
The Role of Links Discussion in Providing Knowledge to Facilitate Processing of Non-Financial Intangibles Information
Earlier, I hypothesized that investors may lack knowledge of the relationships between
non-financial measures and future financial performance, so that disclosure alone of non-
financial intangibles information is not sufficient to influence investors’ performance judgments.
Based on prior research in managerial accounting that providing linkages (à la Balanced
Scorecard) facilitates managerial decision-making (Rucci et al, 1998), I hypothesize that
providing links in a financial accounting setting facilitates investor decision-making, by leading
to greater use of non-financial intangibles information by investors.
Links are hypothesized to increase investors’ knowledge and use of non-financial
information in a number of ways. Drawing on prior research in psychology and accounting, I
posit that providing links would increase investors’ knowledge about non-financial measures at
either of two stages of processing (information acquisition/retention or information

11
use/weighting)2, resulting in greater incorporation of non-financial measures in investor
judgments.
Prior research in psychology suggests that mental representations of a phenomenon affect
the information that people seek and acquire, which then affects their subsequent judgments
(Muchinsky and Dudycha, 1975, Sniezek, 1986, Kempton, 1986). I hypothesize that when
causal links are provided, this leads to a change of perspective on the part of the investor. In the
case of an R&D initiative, causal links discussion reinforces the interconnectedness of the
present and future components of the initiative. Without links, investors forecast using historical
information by re-defining the relationships in the financial statements (such as adding-back
R&D expense). Because R&D expense amounts are already in the financial statements and they
are already expressed in dollars, it is cognitively easier to add-back R&D spending than it is to
factor in non-financial measures. Providing causal links leads to a change of perspective (and a
more refined mental representation of the problem) to consider additional information, which
counteracts the default tendency to only add-back R&D. 3 Without links, information on non-
financial measures is less likely to be sought or acquired by the investor, so that they stray from
the path at the acquisition/retention node in Figure 1. On the other hand, with links, investors
more readily link the present and the future. Thus, they are more likely to incorporate into their
performance judgments the effects of incremental revenues in the future periods, information
that is provided in non-financial intangibles measures.
Even if non-financial intangibles information is seen and acquired, investors may not
subsequently retain that information if they lack a framework to effectively encode it in memory.
2 Similar to Maines and McDaniel (2000), I posit that the degree to which (non-financial) information is incorporated in investor performance judgments is a function of multiple processes, as investors’ processing of information moves through a number of stages prior to being incorporated in performance judgments.

12
Given that non-financial intangibles measures may be voluminous or ill-structured or may
represent idiosyncratic, company-specific measures, there is clearly a lot of information for
investors to digest and retain in memory. Without links, information on non-financial measures
is less well-retained by investors, so that they also stray from the path at the acquisition/retention
node in Figure 1. The links discussion offsets this by providing a framework for investors to
retain the non-financial intangibles information that they encounter, similar to advance
organizers studied in the educational psychology literature (Ausubel, 1968). Advance organizers
help readers retain more of what they read, by providing a framework to relate new knowledge to
existing knowledge, which assists in encoding and subsequent retention of the new knowledge
(Ausubel and Youssef, 1963). Later studies find that signaling the key causal links of a cause-
and-effect system enhances recall (Mayer, Dyck, and Cook, 1984). Applied to the current
situation, links discussion provides investors with a structure to receive new non-financial
intangibles information. With this structure in place, more associations between non-financial
measures and the existing structure are made, and the associations are made are more salient.
This should lead to enhanced retention of non-financial intangibles information and to greater
incorporation of that information in investors’ performance judgments.
Even if non-financial intangibles information is seen and retained in memory, investors
may not appropriately reflect these measures in their performance judgments if the implications
for performance are not clear. Prior research suggests that investors act as if they do not always
consider performance-relevant financial items, such as other comprehensive income (Hirst and
Hopkins, 1998, Maines and McDaniel, 2000), prior period one time gains (Krische, 2001),
aggressive software capitalization (Hirst et al, 2003), and pro-forma earnings (Frederickson and
3 This is similar to Luft and Shields (2001), where the label (capital or expense) associated with a spending initiative led to different perceived relationships in managers’ minds, which in turn affected where they sought information
13
Miller, 2002). Without cause-and-effect links, information on non-financial measures may be
under-weighted (or not used at all) by investors in their performance judgments, so that they
stray from the path at the use/weighting node in Figure 1. On the other hand, causal links are
hypothesized to increase the incorporation of non-financial intangibles information in investors’
performance judgments by providing links to performance and earnings measures, so that
investors use the information on non-financial intangibles information in their performance
judgments, consistent with weighting effects found in prior research (Maines and McDaniel
(2000), Hirst et al (2003), Krische (2001) and Frederickson and Miller (2002)).
The notion that linked items are more likely to be incorporated in judgments of financial
performance is consistent with results in the causal reasoning literature. Einhorn and Hogarth
(1986), Tversky and Kahneman (1980), and Ajzen (1977) argue that individuals tend to organize
events in terms of cause-effect relations. A crucial feature affecting the attention to and use of
data is whether the data are causally linked to the judgment variable. When links are provided or
suggested between data and an outcome, via labeling, location, explicit performance
implications, or inclusion in a performance measure, the data are more likely to be reflected in
the outcome judgment.
Based on the preceding discussion, I hypothesize that non-financial measures will be
incorporated more into investors’ performance judgments when there is a causal links discussion.
The hypothesis is formalized as follows:
H2: The information contained in disclosures of non-financial intangibles information will affect investors’ performance judgments more when links discussion is provided than when it is not provided.
for decision-making.
14
See Figure 2 for a pictorial summary of hypotheses 1 and 2.4
[Insert Figure 2 here]
3. METHOD
To test the hypotheses, I conducted an experiment in which 87 MBA students at a large
state university participated. Participants were recruited by way of an e-mail notice and were
paid a flat wage of $10 plus the chance of winning a random cash drawing. On average, study
participants had 5.7 years of work experience and had completed 2.5 accounting classes and 3.1
finance classes. Eighty-three percent indicated that they had invested in common stock or in a
common stock mutual fund; 100 percent indicated that they had invested or planned to invest in
common stock.
Participants were asked to assume the role of an investor evaluating the common stock of
a pharmaceutical firm. The hypothetical firm was profitable, with products already in the market
and products in the pipeline. This context is the prototypical inter-temporal intangibles situation,
with R&D expenditures incurred up front, and cash and earnings payoffs in subsequent years.
Two factors were manipulated and fully crossed. When combined with a control
condition, this results in a 2 X 2 plus 1 between-subjects design. The first manipulated factor
was links discussion, where participants who received a report on non-financial measures, either
received it with or without a supplemental discussion of how the firm’s non-financial intangibles
4 Hypothesis 2 predicts a difference between above average and below average firms when links are provided. I do not make a formal prediction about how judgments in these two links conditions compare to judgments in the control (no disclosure) condition. Verrecchia (1983) observes that in the absence of proprietary costs of voluntary disclosure, rational expectations traders will infer bad news as soon as it becomes apparent that information is being withheld. Thus, in this study, if there is no disclosure, investors may infer low performance. On the other hand, if investors had no ex ante expectation of disclosure (i.e. no belief that something is being withheld), as I believe is the case in this study, they would not necessarily infer low performance from non-disclosure, but would instead infer an average level of performance. If this is the case, then judgments would be lower for the below average links firm, as compared to the non-disclosing (average) firm. Similarly, for hypothesis 1, I assume that participants have no ex ante expectation of disclosure, so their performance judgments are based on the content (if provided) of the NFM disclosures.

15
measures were linked to future financial performance. The second manipulated factor was level
of non-financial performance, where the disclosing firm was identified as having either above-
average performance (HI NFM) or below-average performance (LO NFM) on non-financial
measures. This performance manipulation was used to examine whether and when investors
incorporate the content of non-financial intangibles disclosures in their judgments. The “plus 1”
was a control condition where participants received neither the report on non-financial measures
nor the links discussion.
In Part A of the experiment, participants were provided with background information
about the pharmaceutical company. At this time, participants in the links discussion condition
also received a supplemental discussion of how the firm’s non-financial intangibles measures
were linked to future financial performance. The supplemental discussion contained a narrative,
graphical, and matrix description of the links (see Appendix A).5
In Part B, participants were provided with a stylized press release reporting current year
results. The press release discussed financial results for the year just ended, and included
comparative income statements, condensed balance sheets, and a report on the company’s non-
financial measures.
The level of non-financial performance was manipulated in this stage of the experiment.
The non-financials report for participants in the HI NFM (LO NFM) condition showed the
company to be performing above (below) the industry average on its key linked non-financial
measures (see Appendix B). The HI/LO NFM manipulation was intended to reflect the variation
in firms’ values that investors would need to differentiate (even when R&D spending is held
5 In a Balanced Scorecard/evaluation of manager performance task, Banker et al (2001) find that evaluators relied on non-financial measures more when their links to financial performance were presented graphically vs. when they were presented in a narrative. By including a graphical depiction, I am giving the links strongest chance to have an effect.

16
constant between firms). Participants in the control condition did not receive a report on the
company’s non-financial measures. Otherwise, the discussion of financial results, income
statements, and condensed balance sheets were identical in all conditions.
After reviewing the background information and the earnings announcement package,
participants were instructed to make predictions of the company’s future financial performance
(next year’s net income, next year’s revenue, net income growth, and revenue growth). The next
year net income and revenue questions were open-ended questions with no response scale
provided. Participants also answered an open-ended question on how they arrived at their net
income judgment. The session concluded with participants responding to a series of post-
experimental questions about the case, including manipulation checks and demographic
questions, including a question asking participants to rate their familiarity level with the
pharmaceutical industry.
I use next year’s revenue and revenue growth (3 to 5 years out) as the primary dependent
variables for this study. As discussed earlier, because of the discretionary nature surrounding
R&D spending and the assumptions that investors must make about the future R&D spending
strategy of the firm, earnings-related dependent variables are noisier. At the same time, revenue
is an input into valuation (as it is an input into earnings), so there is validity to using it as a
dependent variable, without it being confounded by expectations of R&D expense. Also,
although I use next year’s revenue and revenue growth (3 to 5 years out) interchangeably as
operationalizations of future financial performance, different investor perceptions of the timing
of the benefits from R&D (brought on by disclosure of non-financial measures and/or cause-and-
effect links) could lead to different results for these two dependent variables.
17
4. RESULTS
Manipulation and other checks
The results from the manipulation check questions reveal that partic ipants saw the two
manipulated variables as intended. For the links discussion variable, I reasoned that the
usefulness of non-financial measures would be higher for participants who received the links
discussion than for those who did not. As expected, participants who received the links
discussion rated the usefulness of non-financial measures (in predicting earnings) higher (mean
of 11.00 on a 15-point scale with 1 as “not at all useful” and 15 as “extremely useful) than those
who did not receive the links discussion (mean of 9.77) (p=.06, one-tailed).
For the non-financial measures performance manipulation, I reasoned that the
performance on non-financial measures should affect participants’ evaluations of management’s
competence and the quality of the job that management was doing in its stewardship of the
company. As expected, participants receiving HI NFM performance rated management’s
competence higher (mean of 9.83 on a 15-point scale with 1 as “not at all competent” and 15 as
“very competent”) than participants receiving LO NFM performance (mean of 8.63) (p=.01, one-
tailed). Similarly, participants receiving HI NFM performance rated management’s stewardship
of the company higher (mean of 9.49 on a 15-point scale with 1 as “very poor job” and 15 as
“outstanding/excellent job”) than participants receiving LO NFM performance (mean of 8.24)
(p=.01, one-tailed). Overall, these results indicate that the manipulations were successful.
Noise in the Net income and Net Income Growth Measures
Earlier, I provided a rationale for my choice of revenue and revenue growth as the
primary dependent variables for this study. Because of the discretionary nature surrounding

18
R&D spending, investors would have to make assumptions about the future R&D spending
levels of the firm, leading to increased noise in the net income and net income growth measures.
As discussed earlier, participants were asked to explain how they arrived at their net
income judgments. Analysis of participants’ explanations for their net income judgments
indicates that these judgments were strongly influenced by their expectations and assumptions
about R&D expense. Seventy-seven percent of participants referred to R&D expense in their
explanations of how they arrived at their net income judgment, and 56% of participants indicated
that they adjusted R&D expense from the current year to arrive at their next year net income
estimate. Some participants believed that R&D in 2002 was unusually high, so R&D expense
would be lower in the next year. Some participants believed that R&D expense would be higher
next year, either to sustain the many products in the company’s research and development
pipeline (those in the HI NFM condition) or to catch up to their competitors who had more
products in their pipeline (those in the LO NFM condition). These idiosyncratic adjustments for
R&D made by participants contributed to the noise in the net income and net income growth
dependent measures. Accordingly, these net income measures are dropped from the analysis,
and I focus on next year revenue and revenue growth in the analysis and discussion that follows.
Experimental Results-Full Sample
Descriptive statistics for main dependent variables are reported in Table 1 and are
presented in a graph in Figure 3.
[Insert Table 1 here] [Insert Figure 3 here]
Effect of Disclosing Non-Financial Measures Alone (Hypothesis 1)
Recall that hypothesis 1 predicts that investors will not differentiate between HI NFM,
LO NFM, and no NFM firms if non-financial measures are disclosed alone. To test this, a series
19
of 1 X 3 ANOVA’s was performed, with condition (no NFM vs. HI NFM-No links vs. LO NFM-
No links) as the between-subjects variable.6
[Insert Table 2 here]
When next year revenue is used as the dependent variable, the results of the ANOVA
indicate no significant effect for condition (F=.408, p=.67) (Table 2, Panel A). This “no effect”
result suggests that investors do not distinguish between HI NFM, LO NFM, and No NFM firms,
consistent with hypothesis 1.
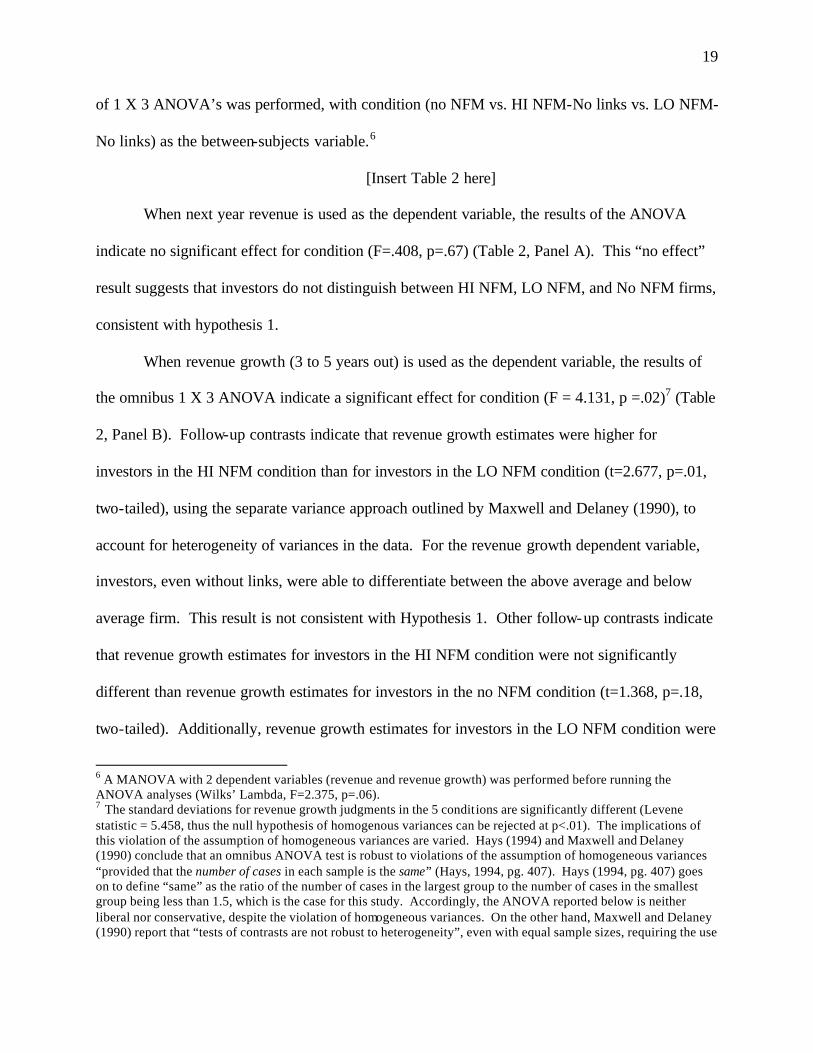
When revenue growth (3 to 5 years out) is used as the dependent variable, the results of
the omnibus 1 X 3 ANOVA indicate a significant effect for condition (F = 4.131, p =.02)7 (Table
2, Panel B). Follow-up contrasts indicate that revenue growth estimates were higher for
investors in the HI NFM condition than for investors in the LO NFM condition (t=2.677, p=.01,
two-tailed), using the separate variance approach outlined by Maxwell and Delaney (1990), to
account for heterogeneity of variances in the data. For the revenue growth dependent variable,
investors, even without links, were able to differentiate between the above average and below
average firm. This result is not consistent with Hypothesis 1. Other follow-up contrasts indicate
that revenue growth estimates for investors in the HI NFM condition were not significantly
different than revenue growth estimates for investors in the no NFM condition (t=1.368, p=.18,
two-tailed). Additionally, revenue growth estimates for investors in the LO NFM condition were
6 A MANOVA with 2 dependent variables (revenue and revenue growth) was performed before running the ANOVA analyses (Wilks’ Lambda, F=2.375, p=.06). 7 The standard deviations for revenue growth judgments in the 5 condit ions are significantly different (Levene statistic = 5.458, thus the null hypothesis of homogenous variances can be rejected at p<.01). The implications of this violation of the assumption of homogeneous variances are varied. Hays (1994) and Maxwell and Delaney (1990) conclude that an omnibus ANOVA test is robust to violations of the assumption of homogeneous variances “provided that the number of cases in each sample is the same” (Hays, 1994, pg. 407). Hays (1994, pg. 407) goes on to define “same” as the ratio of the number of cases in the largest group to the number of cases in the smallest group being less than 1.5, which is the case for this study. Accordingly, the ANOVA reported below is neither liberal nor conservative, despite the violation of homogeneous variances. On the other hand, Maxwell and Delaney (1990) report that “tests of contrasts are not robust to heterogeneity”, even with equal sample sizes, requiring the use
20
not significantly different than revenue growth estimates for investors in the no NFM condition
(t=1.541, p=.13, two-tailed).
In summary, providing non-financial measures alone was effective in helping investors
differentiate between HI NFM and LO NFM firms when investors were asked about revenue
growth, but not for next period revenue. This suggests that investors brought enough knowledge
to the table (i.e. they had their own links) to use NFM even with disclosure alone (without links),
in some cases. The fact that NFM performance was more readily reflected in the growth
dependent variable (3 to 5 years out) than in the next year estimate suggest that the knowledge
that investors already had linked NFM performance to specific periods in the future.
Effect of Disclosing Non-Financial Measures with Links Discussion (Hypothesis 2)
Recall that hypothesis 2 predicts that investors can better differentiate between HI NFM
and LO NFM firms when links are provided. To test this, a series of 2 x 2 ANOVA’s was
performed, with links discussion and NFM performance as the independent variables.8
[Insert Table 3 here]
First, I examined the effect of providing links with next year revenue as the dependent
variable. As indicated in table 3, panel A, there is a marginally significant links by performance
interaction (F = 1.977, p=.08, one-tailed9), with no main effect for either links or performance.
Follow-up simple effects tests indicate that, when NFM are provided without links, revenue
judgments for HI NFM and LO NFM are not significantly different (p=.53). When links are
of a “separate variance approach” (Maxwell and Delaney, 1990), or the use of nonparametric tests that are distribution free. 8 A MANOVA with 2 dependent variables (revenue and revenue growth) was performed before running the ANOVA analyses (for the interaction, all measures, p=.38) (however, as the analysis for hypothesis 1 above indicates, in this instance, next year revenue and revenue growth may be capturing perceptions of the differential timing of future revenues). 9 McNeil, Newman, and Kelly (1996) advise extending the usual logic of a one-sided hypothesis test to directional tests of single-degree-of-freedom interactions between two factors.

21
added, revenue predictions are (marginally) higher for HI NFM vs. LO NFM (p=.09, one-tailed),
consistent with hypothesis 2.
When revenue growth is used as the dependent variable (table 3, panel B), there is no
significant interaction (p=.48, one-tailed), which is not consistent with hypothesis 2. There is a
main effect for NFM performance (p<.01), and no effect for links (p=.70). This is consistent
with the earlier result for hypothesis 1 that investors’ judgments of revenue growth reflect
performance on NFM even when links are not provided.
These tests suggest that investors can better differentiate between HI NFM and LO NFM
firms when links are provided than when they are not when next year revenue is used as the
dependent variable. On the other hand, when revenue growth is used as the dependent variable,
investors can differentiate between HI NFM and LO NFM firms with or and without the links.
Experimental Results-Low Familiarity Subset
Links as a Substitute for Knowledge-Analysis of Results for Participants with Low Familiarity
The premise underlying hypotheses 1 and 2 is that links provide knowledge, allowing
investors to understand non-financial measures and their implications for future financial
performance. However, if investors already have the knowledge to use non-financial measures,
then providing the links would not make a difference. This may explain the mixed results
observed above with the full sample.
To focus on the participants who would benefit the most from having links provided and
to provide a stronger test of the role of links in providing knowledge, I partitioned my sample
and analyzed the responses for a subset of participants who self-reported themselves as having
low familiarity with the pharmaceutical industry. In the demographic questions in the
experimental materials, I asked participants to indicate their level of familiarity with the

22
pharmaceutical industry on a 7-point scale, with the endpoints labeled 1=“not familiar at all” and
7=“very familiar.” To partition the sample, I designated those participants who rated themselves
4 or lower as “low familiarity” participants (n=63), and re-analyzed the data for this subset.
Links should provide the greatest benefit for these participants to help them understand non-
financial measures. Descriptive statistics for the main dependent variables for these 63
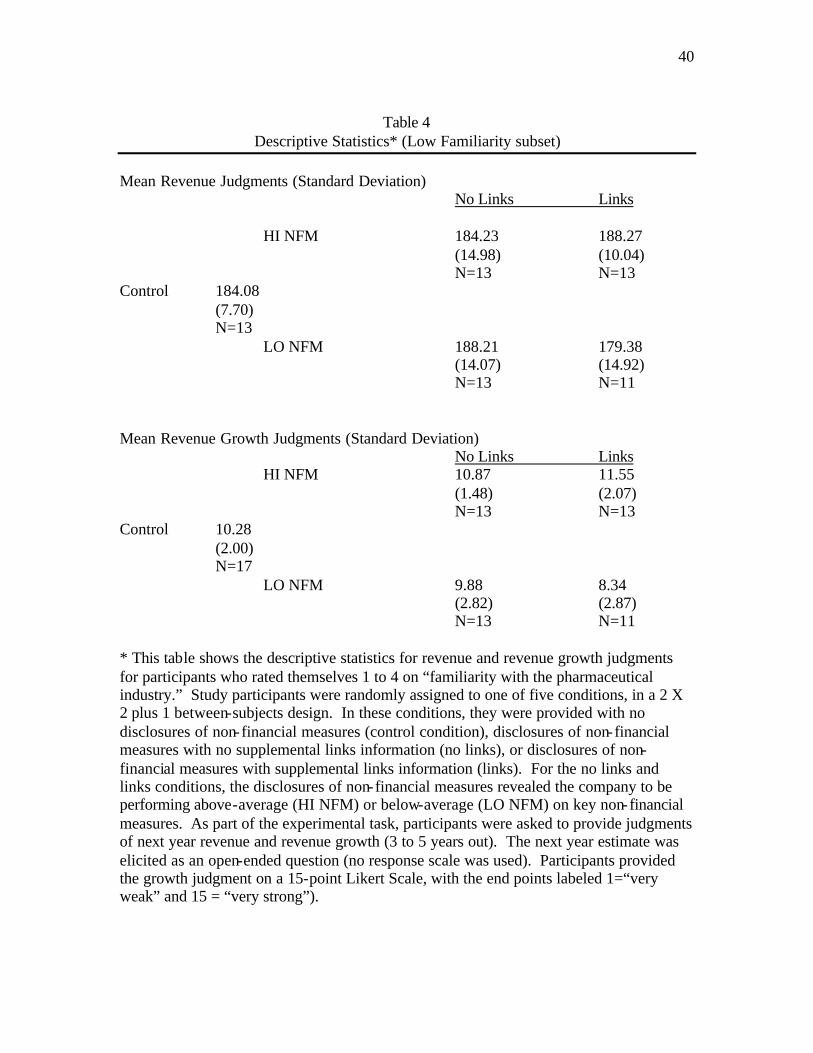
participants are reported in Table 4 and are presented in a graph in Figure 4. 10
[Insert Table 4 here] [Insert Figure 4 here]
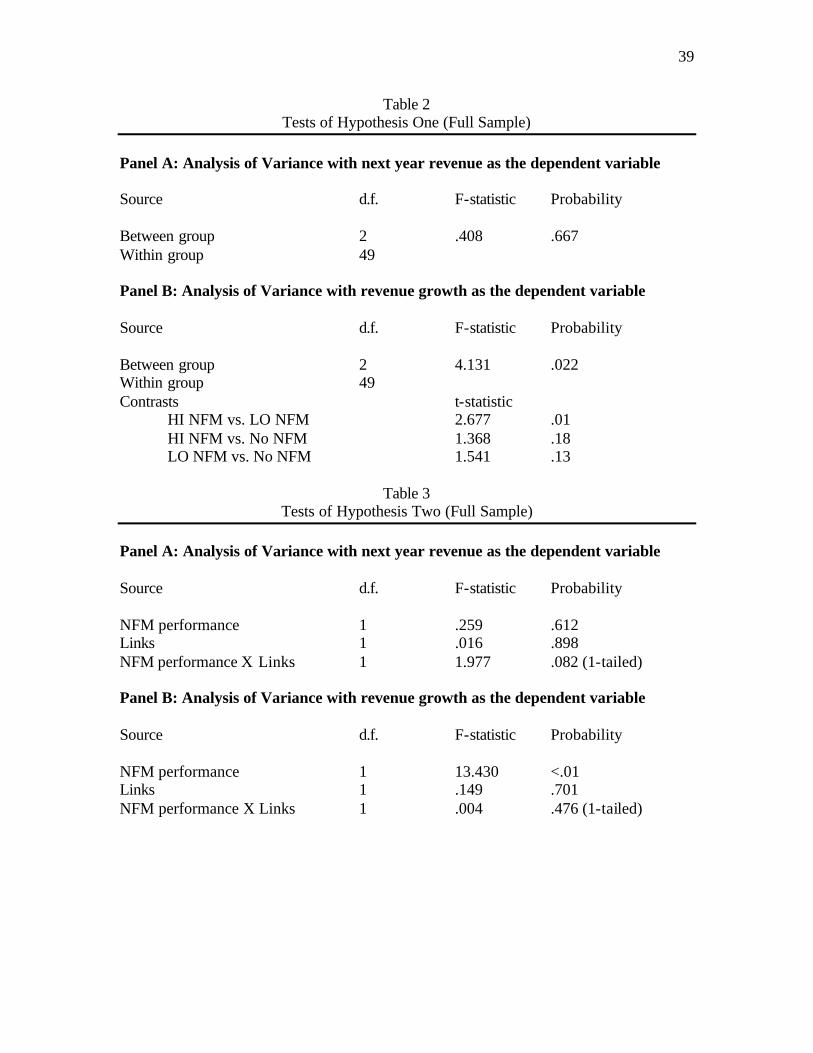
Effect of Disclosing Non-Financial Measures Alone (Hypothesis 1)
To re-test the hypothesis that investors will not differentiate between HI NFM, LO NFM,
and no NFM firms if non-financial measures are disclosed alone, I performed a series of
ANOVA’s on the low familiarity subset, with condition (no NFM vs. HI NFM-No links vs. LO
NFM-No links) as the between-subjects variable.11
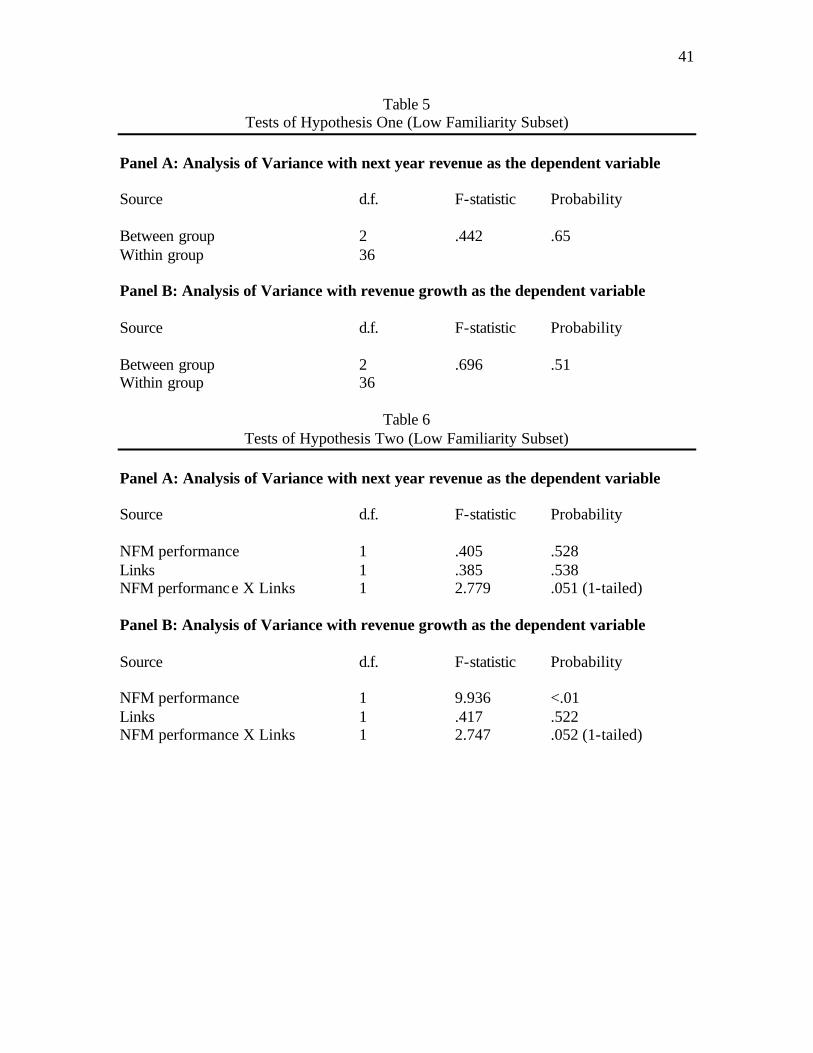
[Insert Table 5 here]
When next year revenue is used as the dependent variable, the results of the ANOVA
indicate no significant effect for condition (F=.442, p=.65) (table 5, panel A). This “no effect”
result is consistent with hypothesis 1. When revenue growth (3 to 5 years out) is used as the
dependent variable, the results of the omnibus 1 X 3 ANOVA for the low familiarity participants
10 To explicitly test the joint effect of NFM, links, and familiarity, I ran a 2 X 2 X 2 MANOVA (using the 2 dependent variables identified earlier), with NFM performance, links, and a dichotomous familiarity variable, coding participants who rated themselves a 5 or higher on familiarity with the pharmaceutical industry as High and participants who rated themselves a 4 or lower on familiarity as Low (note that this results in unequal cell sizes). The results of the 3-way MANOVA are significant (p=.013). However, this result for this MANOVA is sensitive to the “cut-point” used to determine High and Low familiarity participants. When I code participants who rated themselves a 4 or higher on familiarity as High and participants who rated themselves a 3 or lower on familiarity as Low, the results of the MANOVA are not significant (p=.20). When I code participants who rated themselves a 3 or higher on familiarity as High and participants who rated themselves a 2 or lower on familiarity as Low, the results of the MANOVA are significant (p=.07). Consequently, these ex post analyses should be interpreted with caution. 11 A MANOVA with 2 dependent variables (revenue and revenue growth) was performed before running the ANOVA analyses (all measures, p>.36).
23
now indicate no significant effect for condition (F = .696, p =.51) (table 5, panel B), consistent
with hypothesis 1.
Overall, as predicted, for the low familiarity subset, disclosure alone of non-financial
measures does not lead to more differentiated investor judgments, even when NFM performance
is unambiguously above or below average.
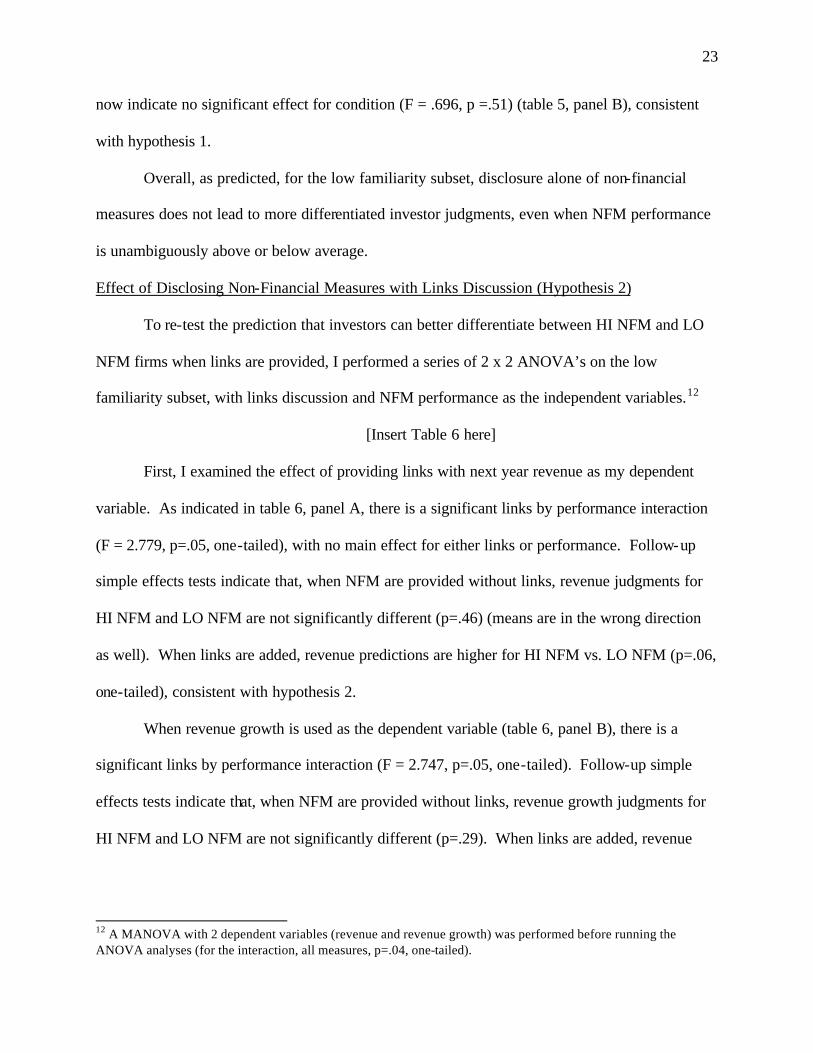
Effect of Disclosing Non-Financial Measures with Links Discussion (Hypothesis 2)
To re-test the prediction that investors can better differentiate between HI NFM and LO
NFM firms when links are provided, I performed a series of 2 x 2 ANOVA’s on the low
familiarity subset, with links discussion and NFM performance as the independent variables.12
[Insert Table 6 here]
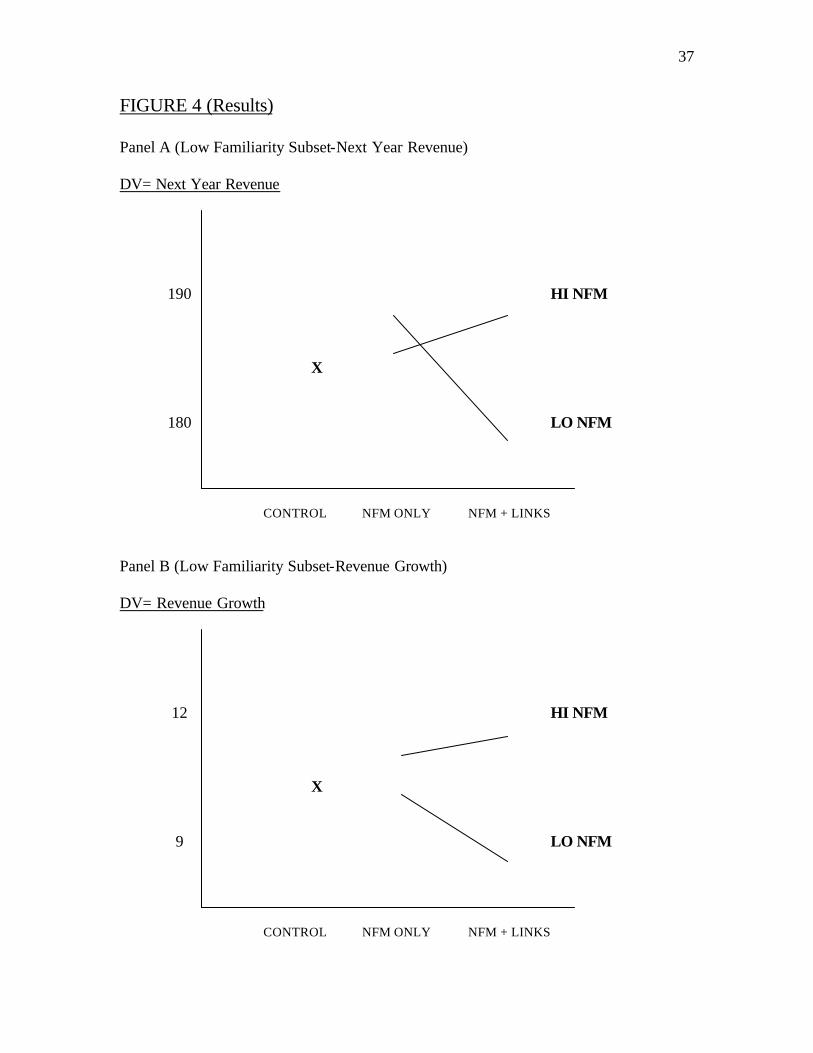
First, I examined the effect of providing links with next year revenue as my dependent
variable. As indicated in table 6, panel A, there is a significant links by performance interaction
(F = 2.779, p=.05, one-tailed), with no main effect for either links or performance. Follow-up
simple effects tests indicate that, when NFM are provided without links, revenue judgments for
HI NFM and LO NFM are not significantly different (p=.46) (means are in the wrong direction
as well). When links are added, revenue predictions are higher for HI NFM vs. LO NFM (p=.06,
one-tailed), consistent with hypothesis 2.
When revenue growth is used as the dependent variable (table 6, panel B), there is a
significant links by performance interaction (F = 2.747, p=.05, one-tailed). Follow-up simple
effects tests indicate that, when NFM are provided without links, revenue growth judgments for
HI NFM and LO NFM are not significantly different (p=.29). When links are added, revenue
12 A MANOVA with 2 dependent variables (revenue and revenue growth) was performed before running the ANOVA analyses (for the interaction, all measures, p=.04, one-tailed).

24
growth predictions are higher for HI NFM vs. LO NFM (p<.01, one-tailed), consistent with
hypothesis 2.
Overall these results using the low familiarity subset are more consistent with the
hypothesis that providing links leads to more differentiated judgments of future financial
performance. The stronger results with the low familiarity subset play into the theory that links
provide investors with the knowledge to understand and use non-financial measures. The weaker
effects of links with the full sample could be due to some investors in the full sample already
having the knowledge to understand non-financial measures in the pharmaceutical industry. For
these investors, links did not help to differentiate above and below average firms because
investors could do it on their own. Once the high familiarity investors were eliminated from the
analysis, the effects of links are much stronger. Essentially, knowledge is necessary for investors
to process non-financial information, and investors can either bring it to table based on prior
work experience and schooling or can acquire it from supplemental links discussion.
Supplemental Analysis-Mediating Processes
Given the overall effect for providing links observed above, it is possible to conclude
that, without links or pre-existing knowledge, investors do stray from the path outlined in Figure
1 and do not incorporate non-financial intangibles information in their performance judgments.
What is yet unknown is when (i.e. at which node in Figure 1) this breakdown occurs. In this
section, I provide preliminary evidence on what specific investors’ processes are affected by the
provision of links (i.e. looking at how providing cause and effect links helps low familiarity
investors use non-financial intangibles information).
In the hypothesis development section, I suggested that providing cause and effect links
increases investors’ knowledge and use of non-financial information, by affecting the

25
information acquisition/retention or information use/weighting processes. For these processes,
there are testable hypotheses involving intermediate stage cognitions and judgments, to
determine if the processes are affected by links discussion.
If providing causal links leads to a change of perspective, leading investors to consider
additional information, low familiarity investors with links would be more likely to seek and
acquire information about linked non-financial intangibles, relative to low familiarity investors
without links. Similarly, if providing causal links gives investors a structure to receive new non-
financial intangibles information, low familiarity investors with links would be more likely to
retain information about linked non-financial intangibles, relative to low familiarity investors
without links. Differences in information acquisition/information retention (from having a
change of perspective or a structure) should be reflected participants’ recall of non-financial
information.
As part of the post-experimental questionnaire, participants who received a report on
non-financial measures completed a recall task, asking for details about the non-financial
measures report that they saw. They were asked (1) for the number of projects in the
hypothetical company’s development pipeline, (2) whether the number of projects currently in
the pipeline was higher than, the same as, or lower than the industry average, and (3) the number
of years that it takes the hypothetical company to complete the cycle from initial investment to
development. For the low familiarity subset, of the participants in the no links condition, 62%,
77%, and 77% correctly answered the “number of projects”, “higher/same/lower”, and “number
of years” questions, respectively. Of the low familiarity participants in the links condition, 48%,
64%, and 88% correctly answered the “number of projects”, “higher/same/lower”, and “number
of years” questions, respectively. There were no statistically significant differences in the
26
proportion of low familiarity participants in the no links condition vs. links condition correctly
recalling the details of performance on key non-financial measures. This is not consistent with
the prediction that providing links leads to greater acquisition/retention of non-financial
information. The results of the recall tests suggest that even for participants with low familiarity
and no links, they stayed on the right path at the acquisition/retention node in Figure 1. The
results of these recall tests also suggest that the differences in judgments of future financial
performance observed earlier are attributable to links affecting use or weighting of NFM, and no t
to links affecting acquisition/retention.
To more directly examine the notion that links affect how NFM are used, I examined
investors’ perceived usefulness of NFM and I examined the explanation data to see if
participants referred to using NFM information when arriving at their (net income) performance
judgments. Earlier, I suggested that links highlight the relevance of NFM for performance
judgments by making linkages between current non-financial performance and future financial
performance more explicit. Accordingly, judgments of the usefulness of NFM disclosure for
deriving their net income estimate should be higher for investors in the links condition than for
investor who did not receive links. Recall that in the manipulation check section that participants
were asked to rate the usefulness of non-financial measures (in predicting earnings) on a 15-point
Likert scale, with 1 labeled as “not at all useful” and 15 as “extremely useful. Results reported in
the manipulation check section earlier indicated that, for the full sample, participants receiving
links rated the usefulness of NFM higher (mean of 11.00) than those who did not receive the
links discussion (mean of 9.77) (p=.06, one-tailed). For the low familiarity subset, results were
similar. Participants who received links rated the usefulness of NFM higher (mean of 10.87)
than those who did not receive the links discussion (mean of 9.27) (p=.04, one-tailed).

27
However judgments/perceptions of usefulness may not be consistent with the information
actually used by investors in arriving at their judgments. Recall that participants were asked to
explain how they arrived at their net income prediction. If links affected participants’ use of
non-financial measures, non-financial measures should be mentioned more frequently in
participants’ explanations.
I reviewed low familiarity participants’ written explanations for their net income
judgments. Compared to participants in the no links condition, those in the links condition
referred more often to non-financial measures (67% to 60%), referred more often to one of the
three linked non-financial measures (67% to 57%), and compared NFM performance to industry
average more often (50% to 19%). Although the directional pattern of these proportions is
consistent with predictions, only the difference in comparison of NFM performance to industry
average is statistically significant (chi-square statistic is 5.27, p<.025). Overall, there were
mixed results on low familiarity investors with links being more likely to use (and refer to) non-
financial measures. This may be driven by the relatively small sample size.
Interestingly, significantly more investors referred to the company’s NFM performance
relative to industry average in their judgment explanations when they received links than when
they did not, but the recall data presented earlier showed that recall of NFM performance relative
to industry average was not different across conditions. In other words, the overall differences
observed earlier appear to be driven by differences in whether and how non-financial
information is used, and not by differences in the acquisition or retention of that information.
5. CONCLUSION
In this study, I examine in an experimental setting whether and when expanded
disclosures of intangibles information influence investor performance evaluations. To this end, I

28
introduce a progression of intangibles disclosures, from disclosures of financial information only
to disclosures of non-financial intangibles information to disclosures of non-financial
information with a causal links discussion added. The central prediction in this study is that
investors will not use (or not be able to use) non-financial intangibles information and will not
differentiate between above average and below average firms, in the absence of disclosure of
cause-and-effect linkages. Once links are provided, they are hypothesized to facilitate
acquisition, retention, and use/weighting of non-financial intangibles information and lead to
investors making more differentiated evaluations of firms with above and below average
performance on non-financial measures. The choice of links discussion as an independent
variable in this study is inspired by the managerial accounting literature. Just as the provision of
links via the Balanced Scorecard is hypothesized to lead to increased emphasis by managers on
linked non-financial measures in a managerial accounting setting and increased understanding,
the provision of links in this setting is expected to lead to increased use of non-financial
intangibles disclosures in investor judgments.
For the full sample of study participants, I find mixed results. Results were stronger and
more consistent with hypotheses when data were analyzed for the subset of participants who self-
reported low familiarity with the pharmaceutical setting. These results suggest that disclosure
alone of non-financial intangibles information may not be sufficient to influence investors’
performance judgments and that some investors need links information to appropriately process
and incorporate non-financial measures in their judgments. Additionally, the results suggest that
knowledge about non-financial measures and their relationships with future financial
performance measures helps to counteract non-financial measures’ inherent complexities and

29
that investors may either bring this knowledge to the table (high familiarity) or acquire it when
links are provided.
Financial reporting continues to come under scrutiny for its perceived deficiencies in
capturing and communicating firm value. With intangible assets getting the credit (or the blame)
for being the biggest source of the disconnect between GAAP financial statements and firm
value, firms have been encouraged to close the gap and get their message out to investors by
expanding disclosures of intangibles information. This study weighs in on this issue by
providing evidence on the effect on investor judgments from providing expanded intangibles
disclosures, and the necessary conditions for any anticipated benefits to be achieved.
Consequently, this study is of interest to managers of firms (especially those of intangible-heavy
firms), accounting researchers, and standard setters.
One of the limitations of this study is its context. The hypothetical company in the study
is a pharmaceutical firm with products already in the market (so it is profitable), while also
having products in the pipeline. This context was chosen because it is the prototypical inter-
temporal intangibles situation: R&D expenditures are incurred upfront, and cash and earnings
payoffs occur in subsequent years. Additionally, intangible assets related to R&D expenditures
are the types of intangible assets covered by the FASB’s project on disclosures of information
about intangible assets. On the other hand, the AAA FASC (AAA FASB, 2003) observes that
the R&D context is unique among intangibles, because of existing disclosure rules, which may
limit the generalizability of this study to other complex intangibles relationships. Future research
could examine expanded disclosures of intangibles information in other intangible asset contexts,
such as those related to customer or employee satisfaction or distribution channels. Other areas
for future research include examining the specific proposals (historical cost and fair value) being

30
considered by the FASB, examining the effect of expanded intangibles disclosures when the
credibility of the discloser is varied, and examining the effect of standardization and increased
comparability of intangibles information on investor judgments.

31
REFERENCES Ajzen, I. 1977. Intuitive Theories of Events and the Effects of Base-Rate Information on Prediction. Journal of Personality and Social Psychology 35: 303-314. American Account ing Association Financial Accounting Standards Committee. 2003. Implications of Accounting Research for the FASB’s Initiatives on Disclosure of Information about Intangible Assets. Accounting Horizons 17 (June): 175-185. Amir, E. and B. Lev. 1996. Value-Relevance of Nonfinancial Information: The Wireless Communications Industry. Journal of Accounting and Economics 22: 3-30. Ausubel, D.P. 1968. Educational Psychology: A Cognitive View. New York, NY: Holt, Rinehart and Winston. Ausubel, D.P. and M. Youssef. 1963. Role of Discriminability in Meaningful Parallel Learning. Journal of Educational Psychology 54: 331-336. Banker, R.D., H. Chang, and M. Pizzini. 2001. The Balanced Scorecard: Judgmental Effects of Performance Measures Linked to Strategy. Working paper, University of Texas at Dallas. Collins, D.W., E.L. Maydew, and I.S. Weiss. 1997. Changes in the Value-Relevance of Earnings and Book Values Over the Past Forty Years. Journal of Accounting and Economics 24: 39-67. Core, J.E., W.R. Guay, and A. Van Buskirk. 2002. Market Valuations in the New Economy: An Investigation of What Has Changed. Journal of Accounting and Economics, Forthcoming. Eccles, R.G., R.H. Herz, E.M. Keegan, and D.M.H. Phillips. 2001. The ValueReporting Revolution: Moving Beyond the Earnings Game. Einhorn, H.J. & Hogarth, R.M. 1986. Judging probable cause. Psychological Bulletin 99: 3-19. Financial Accounting Standards Board (FASB). 2002. Action Alert 02-03. Norwalk, CT: FASB. Francis, J. and K. Schipper. 1999. Have Financial Statements Lost Their Relevance? Journal of Accounting Research 37 (Autumn): 319-352. Frederickson, J.R. and J.S. Miller. 2002. Pro Forma Earnings Disclosures: Do Analysts and Nonprofessional Investors React Differently? The Accounting Review, Forthcoming. Hays, W.L. 1994. Statistics. Fort Worth, Texas: Harcourt Brace.

32
Hirst, D.E. and P.E. Hopkins. 1998. Comprehensive Income Reporting and Analysts’ Valuation Judgments. Journal of Accounting Research 36 (Supplement): 47-75. Hirst. D.E., K.E. Jackson, and L. Koonce. 2003. Improving Financial Reports by Revealing the Accuracy of Prior Estimates. Contemporary Accounting Research 20 (Spring): 165-193. Kaplan, R.S. and D.P. Norton. 1992. The Balanced Scorecard: Measures that drive performance. Harvard Business Review (January-February): 71-79. Kaplan, R.S. and D.P. Norton. 1993. Putting the Balanced Scorecard to work. Harvard Business Review (September-October): 134-147. Kaplan, R.S. and D.P. Norton. 1996a. Using the Balanced Scorecard as a strategic management system. Harvard Business Review (January-February): 75-85. Kaplan, R.S. and D.P. Norton. 1996b. Linking the Balanced Scorecard to strategy. California Management Review (Fall): 53-79. Kaplan, R.S. and D.P. Norton. 2001. Transforming the Balanced Scorecard from Performance Measurement to Strategic Measurement. Accounting Horizons (March): 87-104. Kempton, W. 1986. Two Theories of Home Heat Control. Cognitive Science 10 (1): 75-90. Krische, S.D. 2001. Investors’ Evaluations of Strategic Benchmark Disclosures. Working paper, University of Illinois. Lev, B. 2000. Intangibles: Management, Measurement, and Reporting. Lev, B. and T. Sougiannis. 1996. The Capitalization, Amortization, and Value-Relevance of R&D. Journal of Accounting and Economics 21: 107-138. Libby, R., R. Bloomfield, and M. Nelson. 2002. Experimental Research in Financial Accounting. Accounting, Organizations and Society 27: 775-810. Luft, J. and M.D. Shields. 2001. Why Does Fixation Persist? Experimental Evidence on the Judgment Performance Effects of Expensing Intangibles. The Accounting Review 76 (October): 561-587. Maines, L.A. and L.S. McDaniel. 2000. Effects of Comprehensive-Income Characteristics on Nonprofessional Investors’ Judgments: The Role of Financial-Statement Presentation Format. The Accounting Review 75 (April): 179-207. Maxwell, S.E. and H.D. Delaney. 1990. Designing Experiments and Analyzing Data. Pacific Grove, California: Brooks/Cole Pub lishing Company.

33
Mayer, R.E., J.L. Dyck, and L.K. Cook. 1984. Techniques That Help Readers Build Mental Models From Scientific Text: Definitions Pretraining and Signaling. Journal of Educational Psychology 76 (6): 1089-1105. McNeil, K., I. Newman, and F.J. Kelly. 1996. Testing Research Hypotheses with the General Linear Model. Carbondale, Illinois: Southern Illinois Press. Muchinsky, P.M. and A.L. Dudycha. 1975. Human Inference Behavior in Abstract and Meaningful Environments. Organizational Behavior and Human Performance 13: 377-391. Rucci, A.J., S.P. Kirn, and R.T. Quinn. 1998. The Employee Customer-Profit Chain at Sears. Harvard Business Review: 83-97. Sniezek, J. 1986. The Role of Variable Labels in Cue Probability Learning Tasks. Organizational Behavior and Human Decision Processes 38 (2): 141-161. Tversky, A., and D. Kahneman. 1980. Causal Schemas in Judgments under Uncertainty. In M. Fishbein (Ed.), Progress in Social Psychology. New York, Lawrence Earlbaum Associates. Upton, W.S., Jr. 2001. Special Report: Business and Financial Reporting, Challenges from the New Economy. Stamford, CT: FASB.
Verrecchia, R.E. 1983. Discretionary Disclosure. Journal of Accounting and Economics 5: 179-194.

34
Figure 1 Proposed Model of Investor Processing of Non-financial Intangibles Information
No disclosures of Disclosure of Non-financial information Non-financial information (Baseline) As evidenced by:
NO Is non-financial information Recall of NFM acquired/retained? YES* Is non-financial NO information Perceived usefulness of NFM appropriately Use of NFM in performance judgments (from explanation data) weighted/used? YES* Non-financial information Non-financial information NOT reflected in performance IS reflected in performance judgments judgments *Participants with knowledge, either from familiarity with the pharmaceutical industry or from causal links discussion, are hypothesized to stay on the path where non-financial information is reflected in performance judgments (i.e. “YES” at each node).

35
FIGURE 2 (Pictorial Summary of Hypotheses 1 and 2)
DV= Revenue/Revenue Growth
HI NFM (H1) HI NFM (H2) LO NFM LO NFM CONTROL NFM ONLY NFM + LINKS

36
FIGURE 3 (Results)
Panel A (Full Sample-Next Year Revenue) DV= Next Year Revenue
190 HI NFM X 180 LO NFM CONTROL NFM ONLY NFM + LINKS
Panel B (Full Sample-Revenue Growth) DV= Revenue Growth
12 HI NFM X 9 LO NFM CONTROL NFM ONLY NFM + LINKS
37
FIGURE 4 (Results)
Panel A (Low Familiarity Subset-Next Year Revenue) DV= Next Year Revenue
190 HI NFM X 180 LO NFM CONTROL NFM ONLY NFM + LINKS
Panel B (Low Familiarity Subset-Revenue Growth) DV= Revenue Growth
12 HI NFM X 9 LO NFM CONTROL NFM ONLY NFM + LINKS

38
Table 1
Descriptive Statistics* (Full sample) Mean Revenue Judgments (Standard Deviation)
No Links Links
HI NFM 184.66 189.64 (14.82) (11.71)
N=18 N=18 Control 184.01
(7.21) N=17 LO NFM 187.57 183.43
(13.26) (14.27) N=17 N=17
Mean Revenue Growth Judgments (Standard Deviation) No Links Links HI NFM 11.47 11.68
(1.83) (1.78) N=18 N=18
Control 10.54 (2.15)
N=17 LO NFM 9.12 9.40 (3.16) (3.45) N=17 N=17 * This table shows the descriptive statistics for revenue and revenue growth judgments. Study participants were randomly assigned to one of five conditions, in a 2 X 2 plus 1 between-subjects design. In these conditions, they were provided with no disclosures of non-financial measures (control condition), disclosures of non-financial measures with no supplemental links information (no links), or disclosures of non-financial measures with supplemental links information (links). For the no links and links conditions, the disclosures of non-financial measures revealed the company to be performing above-average (HI NFM) or below-average (LO NFM) on key non-financial measures. As part of the experimental task, participants were asked to provide judgments of next year revenue and revenue growth (3 to 5 years out). The next year estimate was elicited as an open-ended question (no response scale was used). Participants provided the growth judgment on a 15-point Likert Scale, with the end points labeled 1=“very weak” and 15 = “very strong”).
39
Table 2 Tests of Hypothesis One (Full Sample)
Panel A: Analysis of Variance with next year revenue as the dependent variable Source d.f. F-statistic Probability Between group 2 .408 .667 Within group 49 Panel B: Analysis of Variance with revenue growth as the dependent variable Source d.f. F-statistic Probability Between group 2 4.131 .022 Within group 49 Contrasts t-statistic HI NFM vs. LO NFM 2.677 .01 HI NFM vs. No NFM 1.368 .18 LO NFM vs. No NFM 1.541 .13
Table 3
Tests of Hypothesis Two (Full Sample) Panel A: Analysis of Variance with next year revenue as the dependent variable Source d.f. F-statistic Probability NFM performance 1 .259 .612 Links 1 .016 .898 NFM performance X Links 1 1.977 .082 (1-tailed) Panel B: Analysis of Variance with revenue growth as the dependent variable Source d.f. F-statistic Probability NFM performance 1 13.430 <.01 Links 1 .149 .701 NFM performance X Links 1 .004 .476 (1-tailed)
40
Table 4
Descriptive Statistics* (Low Familiarity subset) Mean Revenue Judgments (Standard Deviation)
No Links Links
HI NFM 184.23 188.27 (14.98) (10.04) N=13 N=13
Control 184.08 (7.70)
N=13 LO NFM 188.21 179.38
(14.07) (14.92) N=13 N=11
Mean Revenue Growth Judgments (Standard Deviation) No Links Links
HI NFM 10.87 11.55 (1.48) (2.07) N=13 N=13
Control 10.28 (2.00)
N=17 LO NFM 9.88 8.34 (2.82) (2.87) N=13 N=11 * This table shows the descriptive statistics for revenue and revenue growth judgments for participants who rated themselves 1 to 4 on “familiarity with the pharmaceutical industry.” Study participants were randomly assigned to one of five conditions, in a 2 X 2 plus 1 between-subjects design. In these conditions, they were provided with no disclosures of non-financial measures (control condition), disclosures of non-financial measures with no supplemental links information (no links), or disclosures of non-financial measures with supplemental links information (links). For the no links and links conditions, the disclosures of non-financial measures revealed the company to be performing above-average (HI NFM) or below-average (LO NFM) on key non-financial measures. As part of the experimental task, participants were asked to provide judgments of next year revenue and revenue growth (3 to 5 years out). The next year estimate was elicited as an open-ended question (no response scale was used). Participants provided the growth judgment on a 15-point Likert Scale, with the end points labeled 1=“very weak” and 15 = “very strong”).
41
Table 5 Tests of Hypothesis One (Low Familiarity Subset)
Panel A: Analysis of Variance with next year revenue as the dependent variable Source d.f. F-statistic Probability Between group 2 .442 .65 Within group 36 Panel B: Analysis of Variance with revenue growth as the dependent variable Source d.f. F-statistic Probability Between group 2 .696 .51 Within group 36
Table 6 Tests of Hypothesis Two (Low Familiarity Subset)
Panel A: Analysis of Variance with next year revenue as the dependent variable Source d.f. F-statistic Probability NFM performance 1 .405 .528 Links 1 .385 .538 NFM performance X Links 1 2.779 .051 (1-tailed) Panel B: Analysis of Variance with revenue growth as the dependent variable Source d.f. F-statistic Probability NFM performance 1 9.936 <.01 Links 1 .417 .522 NFM performance X Links 1 2.747 .052 (1-tailed)
42
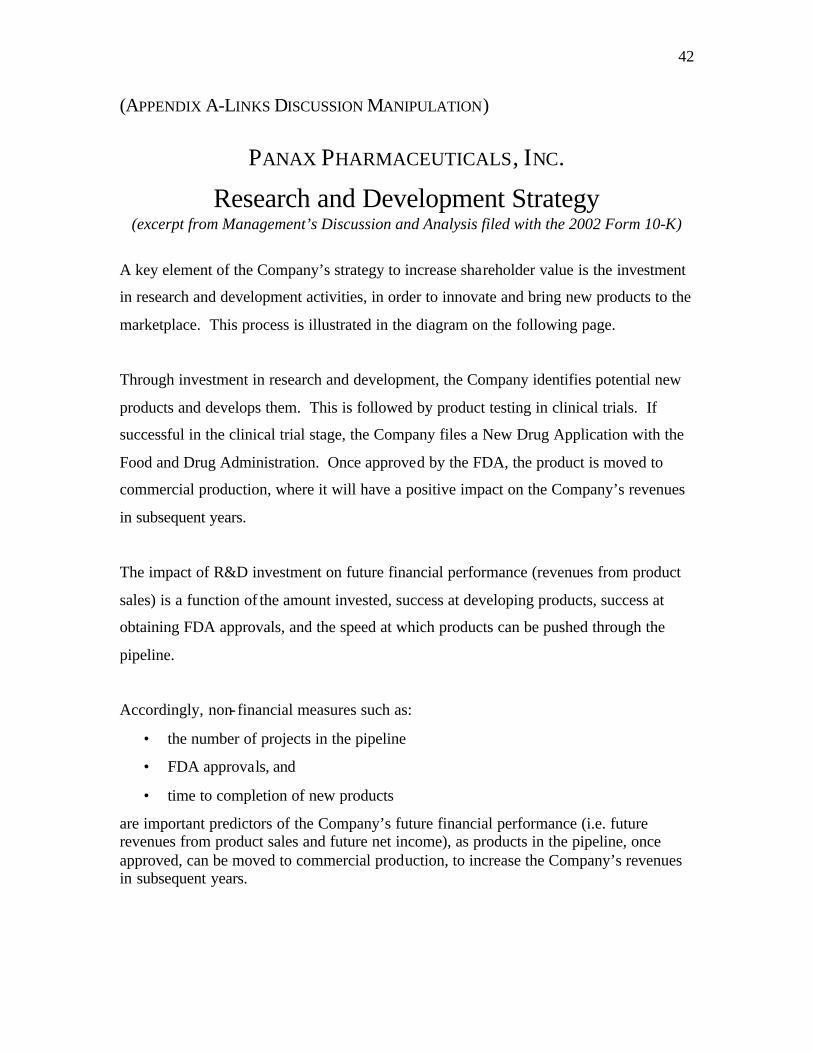
(APPENDIX A-LINKS DISCUSSION MANIPULATION)
PANAX PHARMACEUTICALS, INC.
Research and Development Strategy (excerpt from Management’s Discussion and Analysis filed with the 2002 Form 10-K)
A key element of the Company’s strategy to increase shareholder value is the investment
in research and development activities, in order to innovate and bring new products to the
marketplace. This process is illustrated in the diagram on the following page.
Through investment in research and development, the Company identifies potential new
products and develops them. This is followed by product testing in clinical trials. If
successful in the clinical trial stage, the Company files a New Drug Application with the
Food and Drug Administration. Once approved by the FDA, the product is moved to
commercial production, where it will have a positive impact on the Company’s revenues
in subsequent years.
The impact of R&D investment on future financial performance (revenues from product
sales) is a function of the amount invested, success at developing products, success at
obtaining FDA approvals, and the speed at which products can be pushed through the
pipeline.
Accordingly, non-financial measures such as:
• the number of projects in the pipeline
• FDA approvals, and
• time to completion of new products
are important predictors of the Company’s future financial performance (i.e. future revenues from product sales and future net income), as products in the pipeline, once approved, can be moved to commercial production, to increase the Company’s revenues in subsequent years.

43
Panax Pharmaceuticals, Inc. - Research and Development Strategy (Innovation Process)
Investment in R&D
Product Formulation
Clinical Trials
FDA Application
FDA Approval
Future Financial Performance
Revenue
Shareholder Value

44
Panax Pharmaceuticals, Inc. - Research and Development Strategy (Innovation Process) How We Measure Our Success at Innovation PROCESS WHAT IT MEANS HOW WE MEASURE IT
Development pipeline (including product
formulation, clinical trials, FDA
applications)
The projects in the development pipeline are
the potential blockbuster drugs of the future,
contributing to the Company’s future
revenue and net income growth.
Number of projects in the development
pipeline
FDA approval FDA approval represents the final regulatory
hurdle that must be met before commercial
production can begin. Projects nearing FDA
approval are expected to positively impact
the company’s revenue and net income in the
near future.
Number of expected FDA approvals in the
near future
Product development speed The speed at which projects can be converted
to products contributes to the Company’s
revenue and net income, by accelerating the
payback/return on amounts invested in R&D
in earlier periods.
Time to completion of new products

45
(Appendix B – Level of Non-Financial Performance Manipulation) PANAX PHARMACEUTICALS, INC. – REPORT ON NON-FINANCIAL MEASURES AS OF DECEMBER 31, 2002 HI(LO) INDUSTRY Measure PANAX AVERAGE Employee training programs offered 8 10 Expected FDA Approvals of New Products in 2003 3 (1) 2 Foreign patent applications as a percentage of total
patent applications 50% 40% Number of awards for family-friendly workplace (2002) 1 2 Number of projects currently in the development pipeline (12/31/02) 6 (2) 4 Social justice rating 85 75 Time to completion of new products 3 (7)yrs 5 yrs