Prepared by CSN Institutional Research
November 8, 2012
Hispanic/Latino Students at CSN

Enrollment and FTE

9055; 24%
Fall 2012 Total Headcount*by Ethnicity (n=37,516)
African American
Asian
Caucasian
Hawaiian/Pac Isl
Hispanic
Native American
Multiethnic (non-Hisp)
Unknown
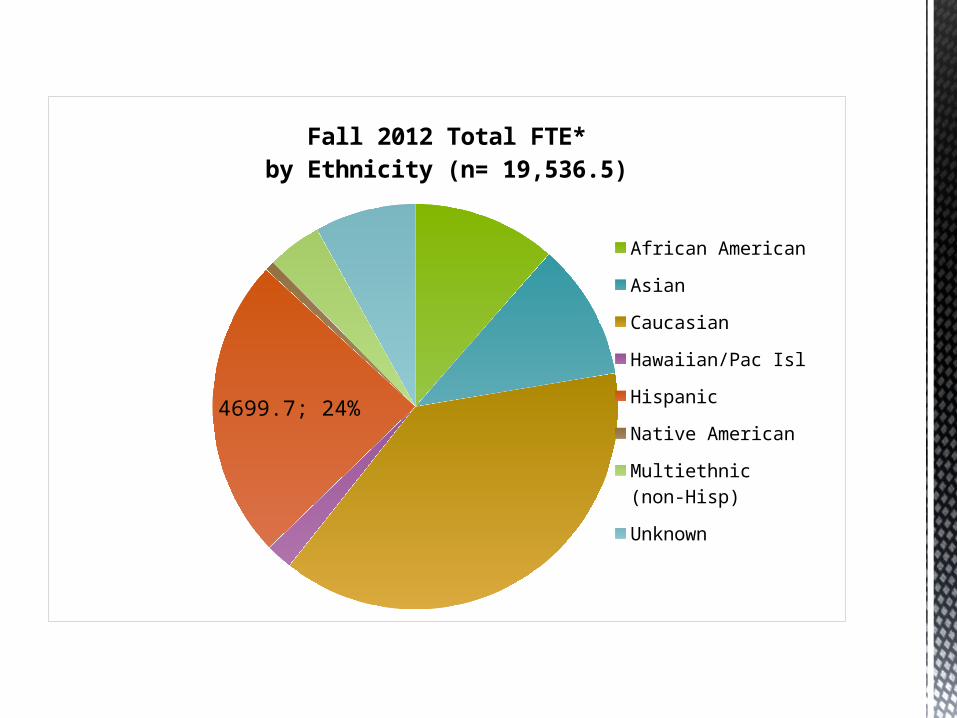
4699.7; 24%
Fall 2012 Total FTE*by Ethnicity (n= 19,536.5)
African American
Asian
Caucasian
Hawaiian/Pac Isl
Hispanic
Native American
Multiethnic (non-Hisp)
Unknown
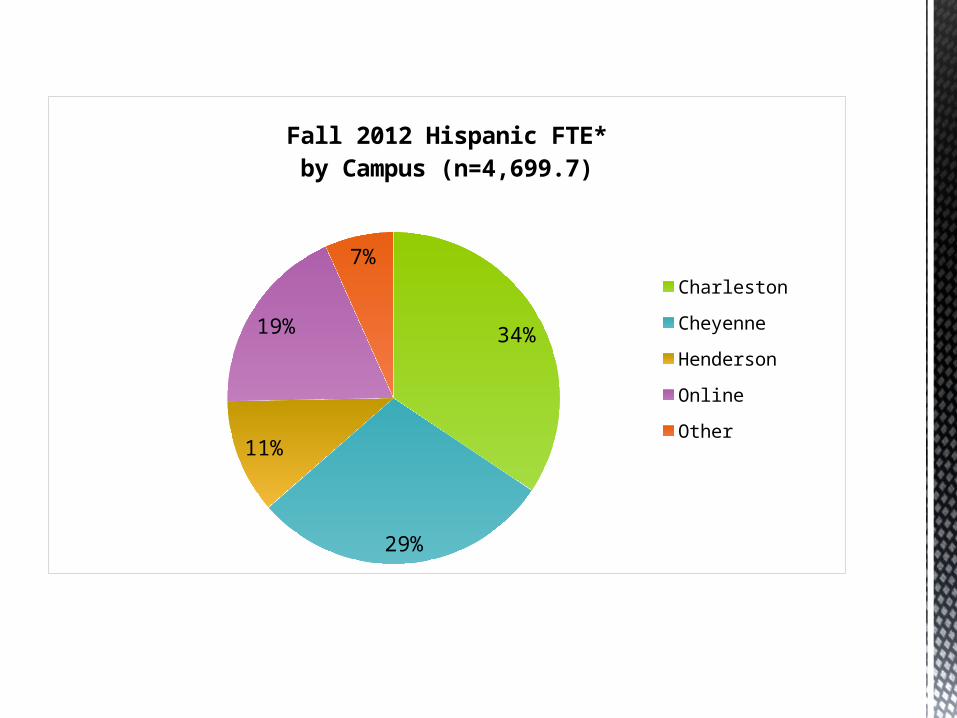
34%
29%
11%
19%
7%
Fall 2012 Hispanic FTE*by Campus (n=4,699.7)
Charleston
Cheyenne
Henderson
Online
Other
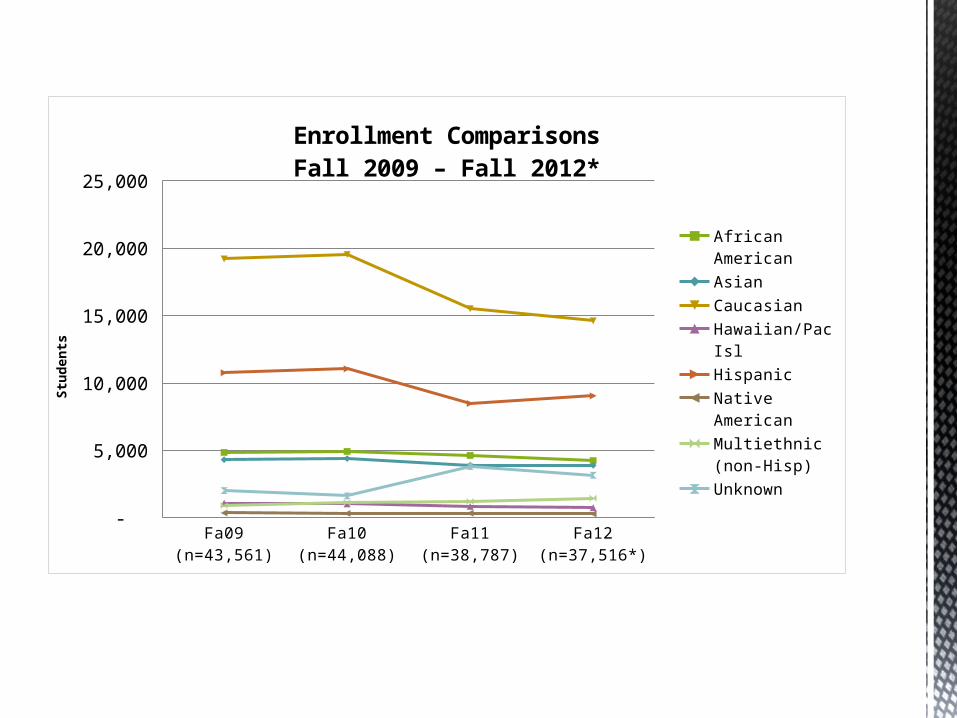
Fa09 (n=43,561) Fa10 (n=44,088) Fa11 (n=38,787) Fa12 (n=37,516*) -
5,000
10,000
15,000
20,000
25,000
Enrollment ComparisonsFall 2009 – Fall 2012*
African American
Asian
Caucasian
Hawaiian/Pac Isl
Hispanic
Native American
Multiethnic (non-Hisp)
Unknown
Stud
ents

Fa09 (n=21,850.4) Fa10 (n=22,368.8) Fa11 (n=20,257.5) Fa12 (n=19,536.5*)
0.0
2000.0
4000.0
6000.0
8000.0
10000.0
12000.0
FTE ComparisonsFall 2009 – Fall 2012*
African American
Asian
Caucasian
Hawaiian/Pac Isl
Hispanic
Native American
Multiethnic (non-Hisp)
Unknown
Stud
ents

Fall 2009 Fall 2010 Fall 2011 Fall 2012 -
2,000
4,000
6,000
8,000
10,000
12,000
Hispanic Student Enrollmentby Age Fall 2009 – 2012*
Unknown65 & Over50 to 6440 to 4935 to 3930 to 3425 to 2920 to 2418 to 19Under 18
Fall 2009 Fall 2010 Fall 2011 Fall 20120
2000
4000
6000
8000
10000
12000
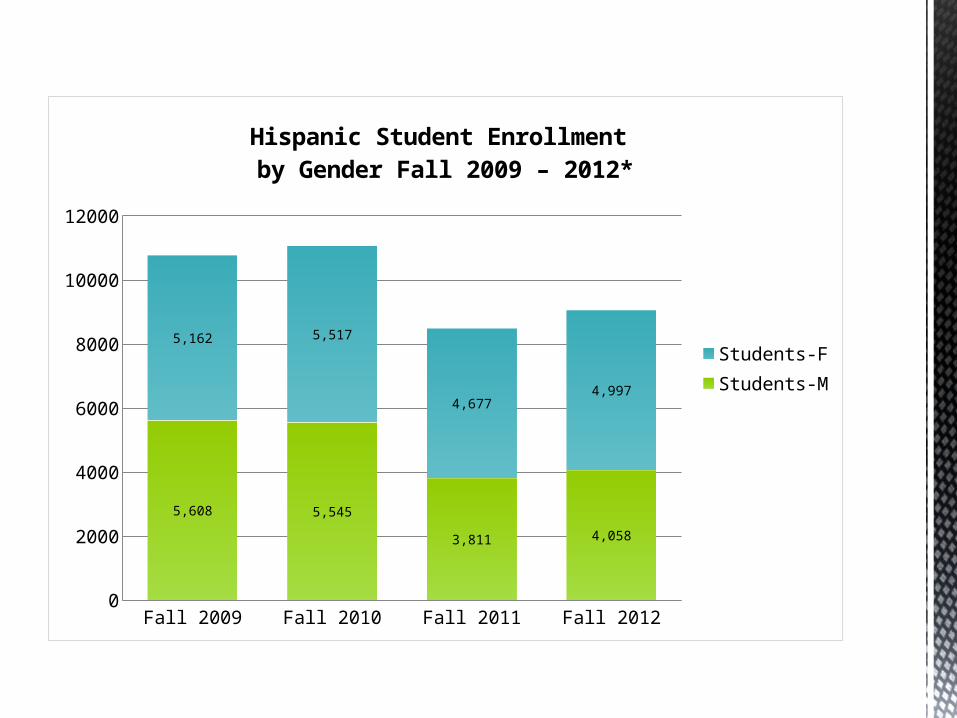
5,608 5,545
3,811 4,058
5,162 5,517
4,6774,997
Hispanic Student Enrollment by Gender Fall 2009 – 2012*
Students-FStudents-M

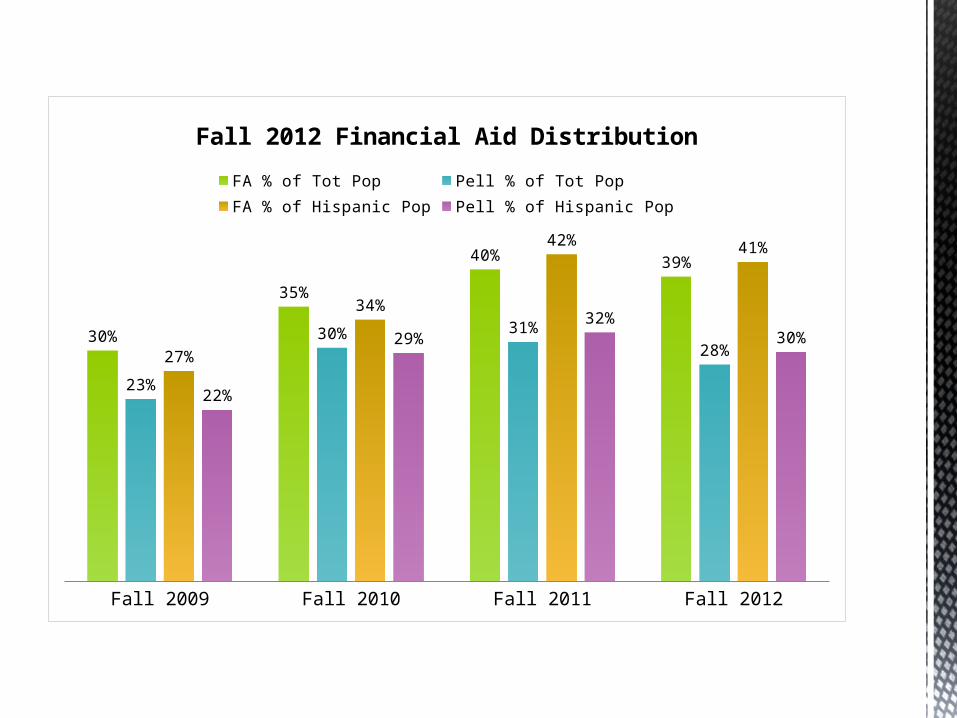
Financial Aid• Financial Aid recipients include
need/non-need based aid, loans, grants and scholarships
• Pell eligibility depends solely on need and is based on Expected
Family Contribution
Fall 2009 Fall 2010 Fall 2011 Fall 2012
30%
35%
40% 39%
23%
30% 31%
28%27%
34%
42% 41%
22%
29%32%
30%
Fall 2012 Financial Aid DistributionFA % of Tot Pop Pell % of Tot Pop FA % of Hispanic Pop Pell % of Hispanic Pop
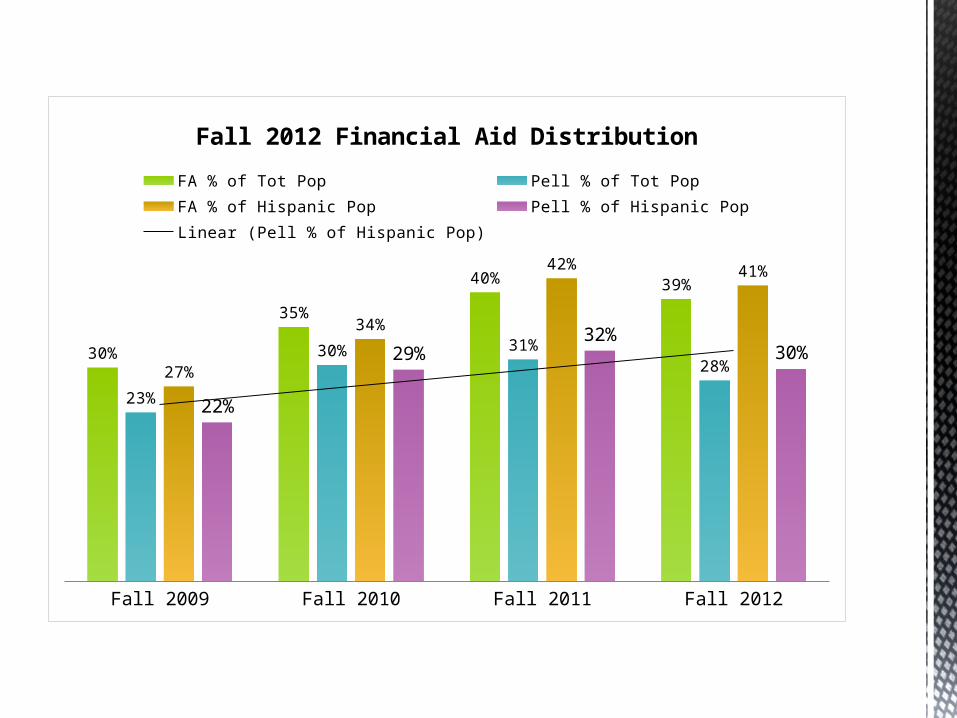
Fall 2009 Fall 2010 Fall 2011 Fall 2012
30%
35%
40% 39%
23%
30% 31%
28%27%
34%
42% 41%
22%
29%32%
30%
Fall 2012 Financial Aid DistributionFA % of Tot Pop Pell % of Tot Pop FA % of Hispanic PopPell % of Hispanic Pop Linear (Pell % of Hispanic Pop)

Academic Plans• Financial Aid requires students
to declare themselves as degree/certificate seeking
• Declaration of intent is part of the admissions process
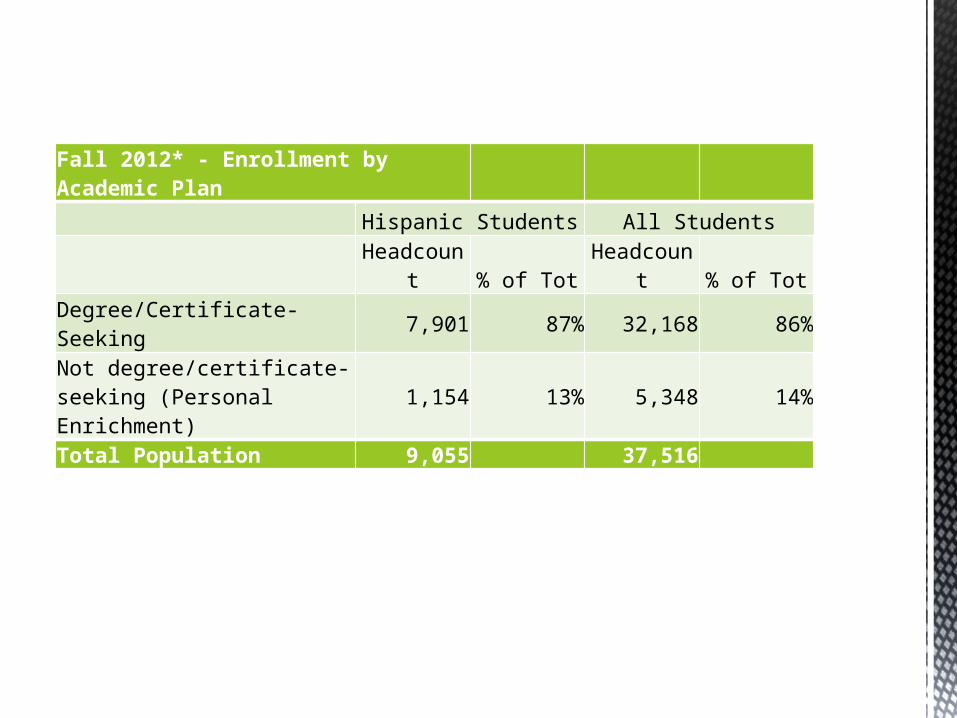
Fall 2012* - Enrollment by Academic Plan
Hispanic Students All StudentsHeadcount % of Tot Headcount % of Tot
Degree/Certificate-Seeking 7,901 87% 32,168 86%
Not degree/certificate-seeking (Personal Enrichment) 1,154 13% 5,348 14%
Total Population 9,055 37,516
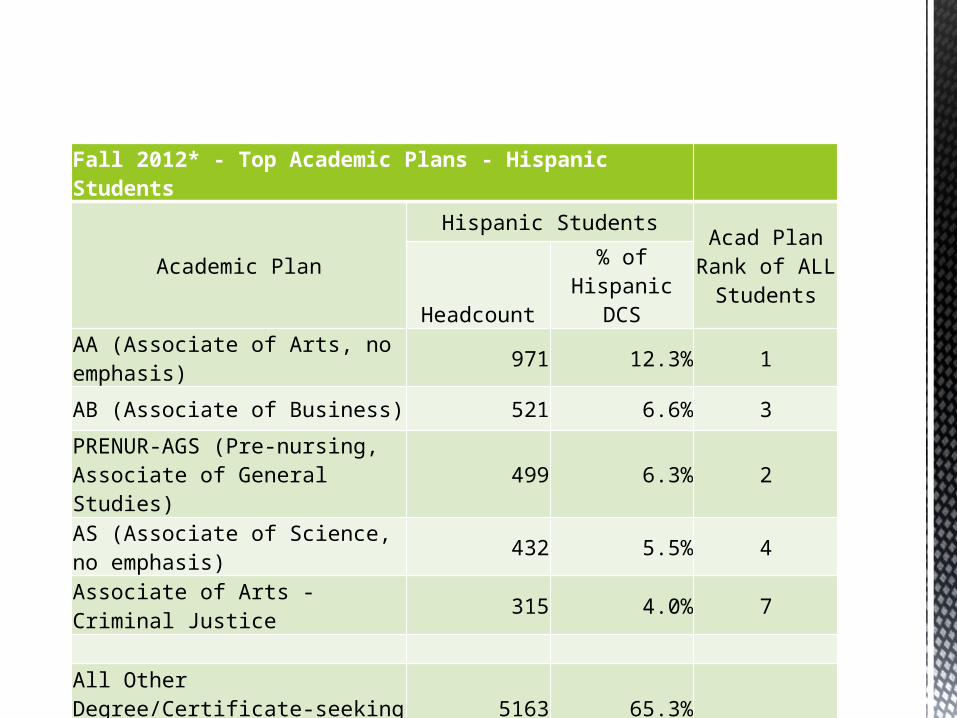
Fall 2012* - Top Academic Plans - Hispanic Students
Academic PlanHispanic Students Acad Plan Rank
of ALL StudentsHeadcount
% of Hispanic DCS
AA (Associate of Arts, no emphasis) 971 12.3% 1
AB (Associate of Business) 521 6.6% 3
PRENUR-AGS (Pre-nursing, Associate of General Studies) 499 6.3% 2
AS (Associate of Science, no emphasis) 432 5.5% 4
Associate of Arts - Criminal Justice 315 4.0% 7
All Other Degree/Certificate-seeking 5163 65.3% Total Degree/Certificate-seeking 7901

Completions• Source: IPEDS Completions
2012-13• Number of students who
complete a certificate of achievement or associate
degree between July 1, 2011 and June 30, 2012
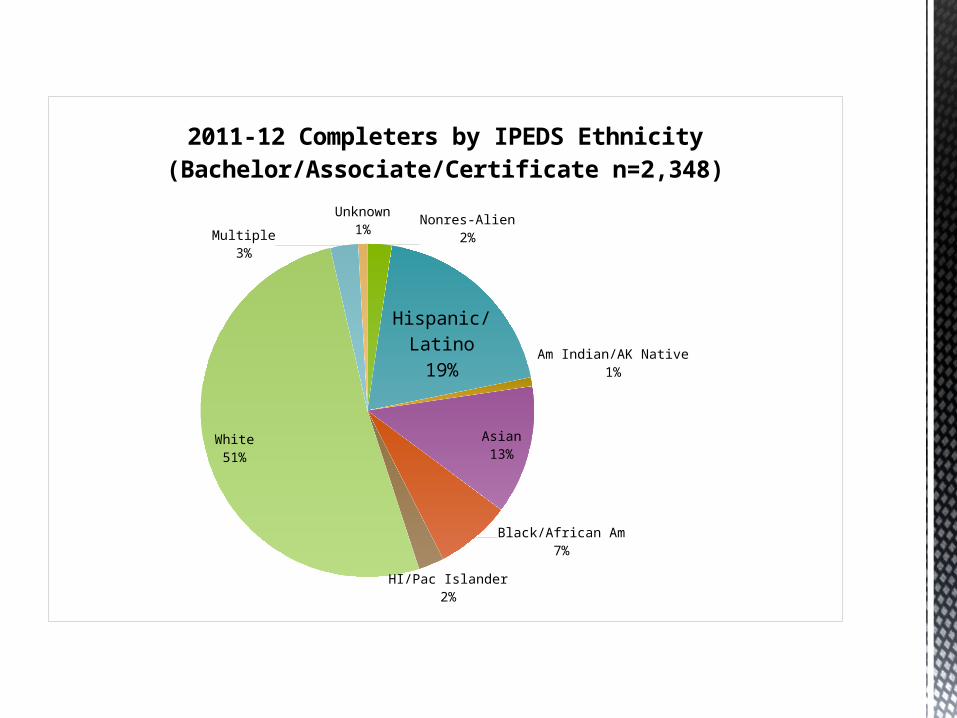
Nonres-Alien2%
Hispanic/Latino19% Am Indian/AK Native
1%
Asian13%
Black/African Am7%
HI/Pac Islander2%
White51%
Multiple3%
Unknown1%
2011-12 Completers by IPEDS Ethnicity(Bachelor/Associate/Certificate n=2,348)
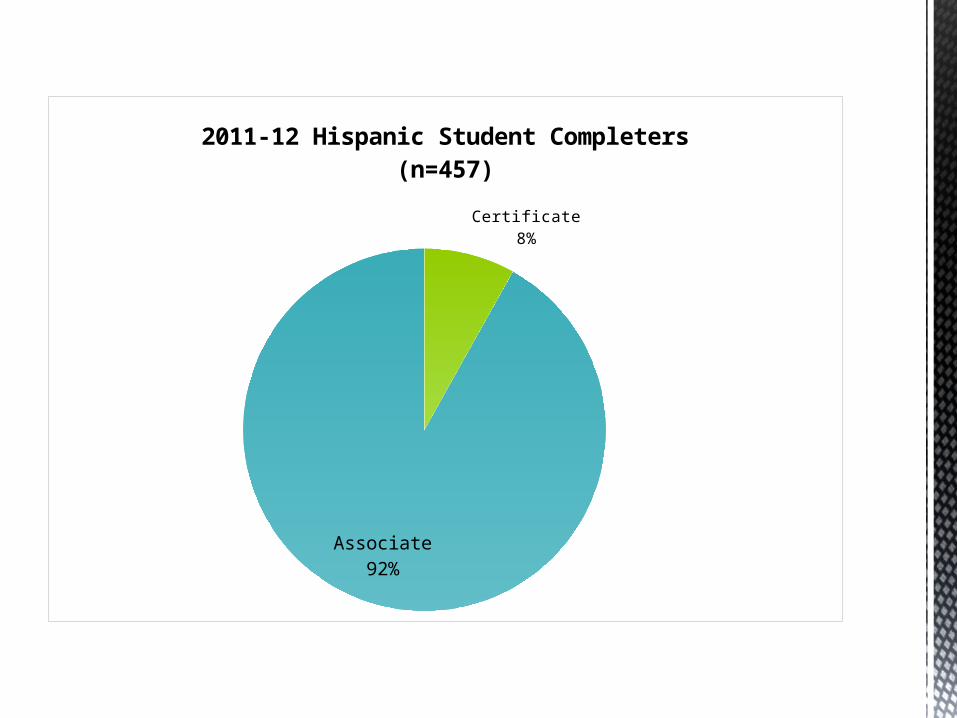
Certificate8%
Associate92%
2011-12 Hispanic Student Completers(n=457)

Additional Resources
www.csn.edu/csnstats/
Recommended