Post-School (PSO) Outcomes for School Year Exiters 2014-2015
Tips about Student Engagement You Need To Know
Northern District Perspective
2016 PSO Survey Data
Erin Galland Russ Randall and Jay Johnson
Flagstaff Unified School District and
Arizona Department of Education
Session Outcomes
bull Identify student engagement rates and subgroup representation
bull Identify examples to support collaboration with high school teams to support studentsfamilies
bull Acquire new or enhanced information regarding secondary transition planning and how it affects student outcomes (PSO)
bull Identify possible solutions for site level challenges in transition services
bull Create a next-steps plan for addressing site level challenges in transition service provision
2
IDEA Purpose
To ensure that all children with disabilities have available to them a free appropriate public
education that emphasizes special education and related services designed to meet their unique needs and prepare them for further education
employment and independent living
IDEA Regulations sect3001(a)
3
Indicator 14
Percent of youth who are no longer in secondary school had IEPs in effect at the time they left school and were
1 enrolled in higher education 2 competitively employed 3 enrolled in postsecondary education or training 4 some other employment
within one year of leaving high school
4
June through September 2016 Survey Participants
bull 268 PEAs (districts and charter schools) were included in the reported data
bull Per SAIS the total number of exiters (youth who graduated aged out or dropped out) who were eligible to take the PSO Survey = 8409
bull Total number of exiters who responded to the PSO Survey = 6332
5
The Three Rrsquos of the PSO
bull Response Rate
bull Representativeness
bull Results
6
Response Rate Representativeness
Eligible for survey
Respondents
Response Rate
Gender (Female)
Ethnicity (Minority)
Limited English Proficiency Exit Reason (Dropout)
Specific Learning Disability Emotional
Disturbance
Intellectual Disability
All Other Disabilities
Flagstaff Unified (2014-2015) Districts Greater than 100 Eligible (2014-2015)
119 4944
109 3658
9160 7399
Represented Under-represented
Over-represented Represented Under-
represented Over-
represented
X X
X X
X X
X X
Represented Under-represented
Over-represented Represented Under-
represented Over-
represented
X X
X X
X X
X X
7
Response Rate Representativeness Flagstaff Unified 2014-2015 PSO Response Rate by Demographic
Overall Disability Category Gender Ethnicity
LEP Exit
LD ED ID AO Female Minority Dropout Target Leaver Totals 119 80 23 4 12 43 42 1 27
Response Totals 109 74 20 4 11 41 38 1 21 Response Rate 9160 9250 8696 10000 9167 9535 9048 10000 7778
Representativeness Disability Category Gender Ethnicity
LEP Exit
LD ED ID AO Female Minority Dropout Target Leaver Representation 6723 1933 336 1008 3613 3529 084 2269
Respondent Representation 6789 1835 367 1009 3761 3486 092 1927 Difference 066 -098 031 001 148 -043 008 -342
Districts Greater than 100 Eligible 2014-2015 PSO Response Rate by Demographic
Overall Disability Category Gender Ethnicity
LEP Exit
LD ED ID AO Female Minority Dropout Target Leaver Totals 4944 2906 524 394 1120 1770 817 53 891
Response Totals 3658 2119 333 307 899 1287 561 38 443 Response Rate 7399 7292 6355 7792 8027 7271 6867 7170 4972
Representativeness Disability Category Gender Ethnicity
LEP Exit
LD ED ID AO Female Minority Dropout Target Leaver Representation 5878 1060 797 2265 3580 1653 107 1802
Respondent Representation 5793 910 839 2458 3518 1534 104 1211 Difference -085 -150 042 192 -062 -119 -003 -591
8
Higher Education
Categories of Engagement bull full- or part-time bull community college (two-year program)
bull collegeuniversity (four- or more year program)
bull one complete term
Competitive Employment
bull pay at or above the minimum wage bull setting with others who are nondisabled
bull 20 hours a week bull for at least 90 days (includes military)
9
By 2020 the percentage of all Jobs requiring at least some college will rise to 65 including 34 of labor-intensive jobs traditionally associated with less education
1973 1992 2010
middotbullmiddotmiddotmiddotmiddotmiddot 65 of all job 1 categories will require 1 indica ed degree
I I
2020 Projected
I I I I
I I I I I I I I I ___
II Bachelors degree or higher
II Associates degree
II Some college no degree
labor-intensive jobs (eg construction transportation) requiring at least some college associates or bachelors+ degree
College amp Career Readiness and Success Center
College amp Career Readiness and Success Center 10
Fgure 17 Completion rates of students with disabi llities 1iro1m current or most recently attended postsecondary school
Graduated ~ram or completed program at
Any postsecondary school
2-year or communiity colllege
Vocational lbusiiness or technica school
4-year colllege
0
407 (3 71 )1
524 (102)
--~ 411 3 (432)
224 1 33)
56 7 (561 ) i64 5 (1 68)
20 40 60 80 100
Percent
D Young adults with disabilities
bull Young adults in general population
2011 National Longitudinal Transition Study
p lt 01 p lt 001 for the difference between young adults with disabilities and young adults in the general population NOTE Standard errors are in parentheses Findings are reported for young adults with disabilities out of high school up to 8 years NLTS2 percentages are weighted population estimates based on a sample of approximately 4800 young adults with disabilities
2011 National Longitudinal Transition Study 11
-
External Data
$180000
$160000
$140000
$120000
$100000
$80000
$60000
$40000
$20000
$-
Unemployment rate and earnings by educational attainment 2013 Average Unemployment 61 Average Earnings $827
Source US Bureau of Labor Statistics 120
$162300 $171400
$132900
$110800
$77700 $72700
$65100
$47200
100
80
60 Unemployment rate ()
40
20
00 Doctoral Professional Masters Bachelors Associates Some High school Less than a degree degree degree degree degree college no diploma high school
degree diploma
Median weekly earnings ($)
12
Categories of Engagement
Other Postsecondary Education or
Training
Other Employment
bull full- or part-time bull at least one complete term bull education or training program (eg Job Corps adult education workforce development program or vocational technical school that is less than a two-year program)
bull work for pay or self-employed bull at least 90 days bull includes working in a family business (eg farming working in a store fishing ranching catering services)
13
onthly unemployment rates by educational attainment 2003- 13
~- less than a high sdhoo1 dlploma a- High schooll diploma or eq11lval~ent bullbullbull Some coUege or assodates degree - Bachello11s degree or h glm
16 __ ____ __ __ ____ __ ___ ____ __ ___ ____ __ __ __ __ _
i ft l v 14 __ ____ __ __ ____ __ ___ ____ ____ __ __ ____ __ __ _
I I V
12 --------------------------------------------- ------------------------- ~ -----w V yenl bull e I lbull ~ v~ U I bull S 10
4
2003 2004 2005 2006 2007 2008 2009
Note Seasonal]y adjusted unempJoyment rates middotOf peop]e in the Jabotmiddot force ages 25 years and over Source US Bureau of Labor Statistics Current Population Survey
2010 2011 2012 2013
External Data
14
bull
Measurements A B amp C Arizona IDEA Part B SPPAPR Indicator 14 Post-School
Outcomes for School Year Exiters
Measurement A Higher Education
Measurement B Higher Education amp
Competitive Employment
Measurement C Higher Education
Competitive Employment amp Some Other Education Training
or Employment
Not Engaged
2014 23 59 73 27 2015 22 61 75 25
23
59
73
27 22
61
75
25
0
20
40
60
80
100
15
bull
Engagement Rates State Engagement Rates 6332 responded for a 7530 response rate
Enrolled In Higher Not Engaged 250 Education 224
Some Other Employment 56
Enrolled In Other Postsecondary
Competitive Education Or Training Employment 390 80
State
390 224 250
80 56
Enrolled In Higher Competitive Employment Enrolled In Other Some Other Employment Not Engaged Education Postsecondary Education
Or Training
16
Post-School (PSO) Outcomes for School Year Exiters 2014-2015
Tips about Student Engagement You Need To Know
Northern District Perspective
Flagstaff Unified
2016 PSO Survey
Erin Galland and Russ Randall Transition Specialists
Flagstaff Unified School District
bull
Measurements A B amp C Arizona IDEA Part B SPPAPR Indicator 14 Post-School
Outcomes for School Year Exiters
Measurement A Higher Education
Measurement B Higher Education amp
Competitive Employment
Measurement C Higher Education
Competitive Employment amp
Some Other Education Training or Employment
Not Engaged
Flagstaff Unified 24 78 87 13 Districts Greater than 100 Eligible 25 62 76 24
24
78
87
13
25
62
76
24
0
20
40
60
80
100
18
J
bull bull
Engagement Rates Flagstaff Unified Engagement Rates 109 Districts Greater than 100 Eligible
responded for a 916 response rate Engagement Rates 3658 responded for a Not 74 response rate
Engaged Not Enrolled In Enrolled In Engaged 128 Higher Higher
244 Education Education Other 239 254 Employ Other 37
Employ 53
Other Post Other Post Education Education
Or Training Competitive Or Training Competitive 55 Employ 80 Employ
541 369
541 369
244 239 254 128 55 80 37 53
Enrolled In Higher Education
Competitive Employment Enrolled In Other Postsecondary Education
Or Training
Some Other Employment Not Engaged
Flagstaff Unified Districts Greater than 100 Eligible
19
bull bull bull bull
Exit Data Flagstaff Unified Respondents Post-Secondary Outcomes by Exit Type
100
80
60
40
20
0 Aged Out (0) Dropout (21) Graduated (88) Unknown (0)
Not Engaged 00 238 102 00 Some Other Employment 00 95 23 00 Enrolled In Other Postsecondary
Education Or Training 00 95 45 00
Competitive Employment 00 571 534 00 Enrolled In Higher Education 00 00 295 00
20
bull bull bull bull
Exit Data Districts Greater than 100 Eligible Respondents Post-Secondary Outcomes by Exit
Type 100
80
60
40
20
0 Aged Out (0) Dropout (443) Graduated (3215) Unknown (0)
Not Engaged 00 515 207 00 Some Other Employment 00 61 52 00 Enrolled In Other Postsecondary
Education Or Training 00 79 80 00
Competitive Employment 00 316 376 00 Enrolled In Higher Education 00 29 285 00
21
bull bull bull bull
Gender Data Flagstaff Unified Respondents Post-Secondary Outcomes by Gender
Female (41) Male (68) Not Engaged 98 147 Some Other Employment 73 15 Enrolled In Other Postsecondary
Education Or Training 98 29
Competitive Employment 390 632 Enrolled In Higher Education 341 176
0
20
40
60
80
100
22
bull bull bull bull
Gender Data Districts Greater than 100 Eligible Respondents Post-Secondary Outcomes by
Gender 100
80
60
40
20
0 Female (1287) Male (2371)
Not Engaged 256 237 Some Other Employment 54 53 Enrolled In Other Postsecondary
Education Or Training 87 76
Competitive Employment 324 394 Enrolled In Higher Education 279 240
23
Figure 11 Types of accommodations and supports received from postsecondary schools by young adu lts with disabil it ies who had ever enrolled in a postsecondary school and had received these types of assistance
Additional time for tests
Technology
Tutor
Leamingbehavior management support
Additional time for modified assignments
Different test setting
Readerinterpreter in-class aide
Note taker
Written materials
Physical adaptations to classroom
Other testing accommodations
Large printbooks on tape Bra ille mater ials
Social work services
Case management
Independent living supports
Early registration
Other accommodations or supports
0
792 (8 17)
20 40 60 80
Percent of students who received accommodations and supports
100
2011 National Longitudinal Transition Study
2011 National Longitudinal Transition Study 24
Action Planning
bull Spring 2017 to Spring 2018 Planning bull Connecting and Events
bull Connecting students to Earn to Learn and Money Smart bull ldquoCollege Signing Dayrdquo
ndash Connects students to school community and self-disclosure
bull Connecting students to Earn to Learn and Money Smart
bull Training on college accommodations and used Think College Resource Library Transition Team Checklist in all high school IEPs
bull Using Infographic Transition to College What Changes after High School during ParentStudent Meetings
25
bull
Measurements A B amp C Arizona IDEA Part B SPPAPR Indicator 14 Post-School
Outcomes for School Year Exiters
Measurement A Higher Education
Measurement B Higher Education amp
Competitive Employment
Measurement C Higher Education
Competitive Employment amp
Some Other Education Training or Employment
Not Engaged
Flagstaff Unified TSW 23 77 81 19 Flagstaff Unified No TSW 24 79 92 8
23
77 81
19 24
79
92
8
0
20
40
60
80
100
26
bull bull
Engagement Rates Flagstaff Unified TSW Engagement Rates 47 responded for a 959 response rate
Enrolled In Higher Not
Education Engaged 234 191
Some Other Employmen
t 21
Enrolled In Other
Postsecond ary
Education Competitive Or Training Employmen
t 532 21
532 548
234 242 21
Flagstaff Unified No TSW Engagement Rates 62 responded for a 886 response
rate Not Enrolled In
Engaged Higher 81 Education
242 Some Other Employmen
t 48
Enrolled In Other
Postsecond ary Competitive
Education Employmen Or Training t 548
81
191 81 48 81 21
Enrolled In Higher Education
Competitive Employment Enrolled In Other Postsecondary Education
Or Training
Some Other Employment Not Engaged
Flagstaff Unified TSW Flagstaff Unified No TSW
27
bull bull bull bull
Disability Data Flagstaff Unified TSW Respondents Post-Secondary Outcomes by Disability Type
100
80
60
40
20
0 All Other
Disabilities (8) Emotional
Disturbance (12) Intellectual
Disability (2) Specific Learning
Disability (25) Not Engaged 125 167 00 240 Some Other Employment 00 83 00 00 Enrolled In Other Postsecondary
Education Or Training 00 00 00 40
Competitive Employment 750 500 500 480 Enrolled In Higher Education 125 250 500 240
28
bull bull bull bull
Disability Data Flagstaff Unified No TSW Respondents Post-Secondary Outcomes by Disability
Type 100
80
60
40
20
0 All Other
Disabilities (3) Emotional
Disturbance (8) Intellectual
Disability (2) Specific Learning
Disability (49) Not Engaged 00 125 1000 41 Some Other Employment 00 00 00 61 Enrolled In Other Postsecondary
Education Or Training 00 250 00 61
Competitive Employment 667 625 00 551 Enrolled In Higher Education 333 00 00 286
29
bull bull bull bull
Ethnicity Data Flagstaff Unified TSW Respondents Post-Secondary Outcomes by Ethnicity
100
80
60
40
20
0
American Indian or Alaskan
Native (19)
Asian (1)
Black or African
American (3)
Hispanic or Latino
(9)
Multi-racial (0)
Native Hawaiian or Other Pacific
Islander (0)
White (15)
Not Engaged 158 00 333 111 00 00 267 Some Other Employment 53 00 00 00 00 00 00 Enrolled In Other Postsecondary
Education Or Training 00 00 00 111 00 00 00
Competitive Employment 526 1000 667 778 00 00 333 Enrolled In Higher Education 263 00 00 00 00 00 400
30
bull bull bull bull
Ethnicity Data Flagstaff Unified No TSW Respondents Post-Secondary Outcomes by Ethnicity
100
80
60
40
20
0
American Indian or Alaskan
Native (11)
Asian (0)
Black or African
American (3)
Hispanic or Latino
(24)
Multi-racial (1)
Native Hawaiian or Other Pacific
Islander (0)
White (23)
Not Engaged 00 00 00 83 00 00 130 Some Other Employment 91 00 333 00 00 00 43 Enrolled In Other Postsecondary
Education Or Training 00 00 00 167 00 00 43
Competitive Employment 636 00 667 583 00 00 478 Enrolled In Higher Education 273 00 00 167 1000 00 304
31
bull bull bull bull
Gender Data Flagstaff Unified TSW Respondents Post-Secondary Outcomes by Gender
Female (17) Male (30) Not Engaged 235 167 Some Other Employment 59 00 Enrolled In Other Postsecondary
Education Or Training 59 00
Competitive Employment 294 667 Enrolled In Higher Education 353 167
0
20
40
60
80
100
32
bull bull bull bull
Gender Data Flagstaff Unified No TSW Respondents Post-Secondary Outcomes by Gender
Female (24) Male (38) Not Engaged 00 132 Some Other Employment 83 26 Enrolled In Other Postsecondary
Education Or Training 125 53
Competitive Employment 458 605 Enrolled In Higher Education 333 184
0
20
40
60
80
100
33
bull bull bull bull
Exit Data Flagstaff Unified TSW Respondents Post-Secondary Outcomes by Exit Type
100
80
60
40
20
0 Aged Out (0) Dropout (7) Graduated (40) Unknown (0)
Not Engaged 00 286 175 00 Some Other Employment 00 00 25 00 Enrolled In Other Postsecondary
Education Or Training 00 00 25 00
Competitive Employment 00 714 500 00 Enrolled In Higher Education 00 00 275 00
34
bull bull bull bull
Exit Data Flagstaff Unified No TSW Respondents Post-Secondary Outcomes by Exit Type
100
80
60
40
20
0 Aged Out (0) Dropout (14) Graduated (48) Unknown (0)
Not Engaged 00 214 42 00 Some Other Employment 00 143 21 00 Enrolled In Other Postsecondary
Education Or Training 00 143 63 00
Competitive Employment 00 500 563 00 Enrolled In Higher Education 00 00 313 00
35
Reviewing Data
bull Reviewing Data bull TSW Students v Non TSW Students
bull Autism 100 (Non-No Students) bull Emotional Disability 857 (Non-80) bull Emotional Disability (Private Day) 80 (Non-100) bull Mild Intellectual Disability 100 (Non-0) bull Multiple Disabilities 0 (Non-No Students) bull Other Health Impairment 100 (Non-100) bull Specific Learning Disabilities 76 (Non 95) bull Traumatic Brain Injury 100 (Non-No Students)
36
bull bull
Disability Data (Extended Breakdown) Flagstaff Unified TSW Respondents Post-Secondary Outcomes by
Disability Type Engaged vs Not Engaged (Extended)
Autism (1)
Emotional Disability (7)
Emotional Disability (separate facility private school) (5)
Hearing Impairment (0)
Mild Intellectual Disability (2)
Moderate Intellectual Disability (0)
Multiple Disabilities (1)
Multiple Disabilities - Severe Sensory Impairment (0)
Orthopedic Impairment (0)
Other Health Impairment (3)
Severe Intellectual Disability (0)
Specific Learning Disability (25)
SpeechLanguage Impairment (0)
Traumatic Brain Injury (3)
Visual Impairment (0)
1000
857
800
143
200
1000
1000
1000
760 240
1000
Engaged Not Engaged
37
bull bull
Disability Data (Extended Breakdown) Flagstaff Unified No TSW Respondents Post-Secondary Outcomes
by Disability Type Engaged vs Not Engaged (Extended)
Autism (0)
Emotional Disability (5)
Emotional Disability (separate facility private school) (3)
Hearing Impairment (0)
Mild Intellectual Disability (2)
Moderate Intellectual Disability (0)
Multiple Disabilities (0)
Multiple Disabilities - Severe Sensory Impairment (0)
Orthopedic Impairment (0)
Other Health Impairment (3)
Severe Intellectual Disability (0)
Specific Learning Disability (49)
SpeechLanguage Impairment (0)
Traumatic Brain Injury (0)
Visual Impairment (0)
800 200
1000
1000
1000
959 41
Engaged Not Engaged
38
bull bull bull bull
Disability Data (Extended Breakdown) Flagstaff Unified TSW Respondents Post-Secondary Outcomes by
Disability Type (Extended)
Autism (1)
Emotional Disability (7)
Emotional Disability (separate facility private school) (5)
Hearing Impairment (0)
Mild Intellectual Disability (2)
Moderate Intellectual Disability (0)
Multiple Disabilities (1)
Multiple Disabilities - Severe Sensory Impairment (0)
Orthopedic Impairment (0)
Other Health Impairment (3)
Severe Intellectual Disability (0)
Specific Learning Disability (25)
SpeechLanguage Impairment (0)
Traumatic Brain Injury (3)
Visual Impairment (0)
1000
429
500
429
600
500
200
1000
240
333
480
667
40
Enrolled In Higher Education Competitive Employment Enrolled In Other Postsecondary Education Or Training Some Other Employment
39
bull bull bull bull
Disability Data (Extended Breakdown) Flagstaff Unified No TSW Respondents Post-Secondary Outcomes
by Disability Type (Extended)
Autism (0)
Emotional Disability (5)
Emotional Disability (separate facility private school) (3)
Hearing Impairment (0)
Mild Intellectual Disability (2)
Moderate Intellectual Disability (0)
Multiple Disabilities (0)
Multiple Disabilities - Severe Sensory Impairment (0)
Orthopedic Impairment (0)
Other Health Impairment (3)
Severe Intellectual Disability (0)
Specific Learning Disability (49)
SpeechLanguage Impairment (0)
Traumatic Brain Injury (0)
Visual Impairment (0)
600
667
200
333
333 667
286 551 61 61
Enrolled In Higher Education Competitive Employment Enrolled In Other Postsecondary Education Or Training Some Other Employment
40
bull bull
National Longitudinal Transition Study (NLTS2) - 2012
N=305000 Students
Graduation Post-Secondary Paying Job AT 100 81 80 No AT 80 40 51
100
81 8080
40
51
0
20
40
60
80
100
120
National Longitudinal Transition Study 41
Reviewing Data
bull Local AT Data and National Longitudinal Transition Study bull 2012 National Longitudinal Transition Study
bull 809 Students with AT attended higher Ed bull 401 Students who did not receive AT Higher Ed bull 78 of students with high-incidence disabilities reported
receiving AT in high school
bull 2014-2015 AT Loan Library Data bull 144 High School Requests bull Coconino County 19 of all AT Loan Library Requests bull Higher Education in Coconino County 30 bull Higher Education in Arizona 22
42
Local Example bull Spring 2017 to Spring 2018 Planning
bull PSO Data and Not Engaged Students bull Training Staff
bull Training staff to use AT (Assistive Technology) and create AT Implementation Plan
bull Used ldquoA Student Handbook for Choosing and Using ATrdquo bull Providing self-advocacy skills and sense of pride bull Use AT Loan Library and AzTAP Loan Library bull New Apps Clips or CADET for Captioning for all Students
bull Connected High School CTE (Career and Technical Education) Program with College Level CTE Program bull Connecting to Community and self-disclosure
bull Connected Counseling Department and Transition Department (Connecting Community)
43
Inform and align
Multiple-Measure Accountablllty bull Multiple measures
of CCR bull Continuum of
readiness indicators bull Usable data
Well-Rounded Education bull Enriched accelerated
curricula and educational experiences
bull Improved conditions for learning
t State CCR Definition
bull Academic readiness
bull Nonacademic readiness
Inform and allgn
Purposeful Assessment bull Balanced assessment
systems bull Design and delivery for
meaningful results bull Measuring nonacademic
readiness
How PSO Can Improve Programming
College amp Career Readiness and Success Center 44
bull bull
Disability Data (Extended Breakdown) Flagstaff Unified Respondents Post-Secondary Outcomes by
Disability Type Engaged vs Not Engaged (Extended)
Autism (1)
Emotional Disability (12)
Emotional Disability (separate facility private school) (8)
Hearing Impairment (0)
Mild Intellectual Disability (4)
Moderate Intellectual Disability (0)
Multiple Disabilities (1)
Multiple Disabilities - Severe Sensory Impairment (0)
Orthopedic Impairment (0)
Other Health Impairment (6)
Severe Intellectual Disability (0)
Specific Learning Disability (74)
SpeechLanguage Impairment (0)
Traumatic Brain Injury (3)
Visual Impairment (0)
1000
833
875
500
167
125
500
1000
1000
892 108
1000
Engaged Not Engaged
45
bull bull bull bull
Disability Data (Extended Breakdown) Flagstaff Unified Respondents Post-Secondary Outcomes by
Disability Type (Extended)
Autism (1)
Emotional Disability (12)
Emotional Disability (separate facility private school) (8)
Hearing Impairment (0)
Mild Intellectual Disability (4)
Moderate Intellectual Disability (0)
Multiple Disabilities (1)
Multiple Disabilities - Severe Sensory Impairment (0)
Orthopedic Impairment (0)
Other Health Impairment (6)
Severe Intellectual Disability (0)
Specific Learning Disability (74)
SpeechLanguage Impairment (0)
Traumatic Brain Injury (3)
Visual Impairment (0)
1000
250 500
625
83
125 125
250 250
167 833
270 527 54 41
333 667
Enrolled In Higher Education Competitive Employment Enrolled In Other Postsecondary Education Or Training Some Other Employment
46
Post-School (PSO) Outcomes for School Year Exiters 2014-2015
Tips about Student Engagement You Need To Know
Southern District Perspective
State of Arizona 2016 PSO Survey
Jay Johnson Education Program Specialist
PSO Initiatives
Disability Data (Extended Breakdown) Arizona Post-Secondary Outcomes by Disability Type
Engaged vs Not Engaged (Extended)
Autism (455)
Emotional Disability (466)
Emotional Disability (separate facility private school) (116)
Hearing Impairment (57)
Mild Intellectual Disability (316)
Moderate Intellectual Disability (128)
Multiple Disabilities (102)
Multiple Disabilities - Severe Sensory Impairment (28)
Orthopedic Impairment (37)
Other Health Impairment (653)
Severe Intellectual Disability (26)
Specific Learning Disability (3837)
SpeechLanguage Impairment (52)
Traumatic Brain Injury (33)
Visual Impairment (26)
637
646
526
772
554
461
578
429
595
363
354
474
228
446
539
422
571
405
793
500
808
923
758
769
207
500
192
77
242
231
Engaged Not Engaged
48
bull bull bull bull
Disability Data (Extended Breakdown) Arizona Post-Secondary Outcomes by Disability Type (Extended)
Autism (455)
Emotional Disability (466)
Emotional Disability (separate facility private school) (116)
Hearing Impairment (57)
Mild Intellectual Disability (316)
Moderate Intellectual Disability (128)
Multiple Disabilities (102)
Multiple Disabilities - Severe Sensory Impairment (28)
Orthopedic Impairment (37)
Other Health Impairment (653)
Severe Intellectual Disability (26)
Specific Learning Disability (3837)
SpeechLanguage Impairment (52)
Traumatic Brain Injury (33)
Visual Impairment (26)
303
131
149
401
152
73
33
41
86 276 78 86
316 298 105 53
79
23
216
36
241
94
137
36
149
273
147
286
85
70
78
71
378
299
27
400
162
44
27
51
38 346 115
229
538
461
346
60
38
58
364
423
182
192
152
77
61
77
Enrolled In Higher Education Competitive Employment Enrolled In Other Postsecondary Education Or Training Some Other Employment
49
Pride
Self-Advocate o o gt i-i--o o
0
0
0
00 C 0
0
PATH TO DISABILITY
PRIDE
New Insights for Building Disability Pride and Empowering Students with Hidden Disabilities
0 0
0 0
0
0 0
0
PATH OF DISABILITY
SHAME 0
Disability Shame
Positive Student Outcomes
50
Resources
bull Review the student list to see if students can be excluded from having the PSO Survey administered (ie re-enrolled)
bull Grandparentsfriends are great resources
bull Update contact list as much as possible
bull Any parentstudent meeting (ie IEP progress parent conferences)
bull Some districts have used social media to contact hard to reach youth
bull Consider teachertransition specialist stipends
bull Make contact with families as often as possible
bull Email-to-text message
bull Strategies for Increasing Response Rates
bull Strategies for Contacting Hard-to-Find Youth
51
Resources
bull Arizona Department of Education (Search PSO Transitions ECAP AZCIS Arizona Community of Practice on Transition-AZCoPT)
bull Secondary Transition
bull ECAP-Education and Career Action Plan
bull AZCIS-Arizona Career Information System
bull AZCoPT-Arizona Community of Practice On Transition
bull NTACT-National Technical Assistance on Transition
bull Career One Stop (Your Source for Career Exploration)
bull My Futurecom (Figure out whatrsquos next)
52
June through September 2017 Survey Participants
bull 276 PEAs (districts and charter schools) WILL BE included in the reported data
bull Per SAIS the total number of exiters (youth who graduated aged out or dropped out) who ARE eligible to take the PSO Survey = 9701
53
ldquoUnengagedrdquo Characteristics
bull Of the 1584 individuals counted in the non-engaged category 1183 did not attempt any post secondary educationtraining or employment
bull However 401 respondents (25) indicated that they attempted post secondary educationtraining or employment but did not meet the criteria to be counted in an engagement category
bull If those 401 youth who attempted engagement had been successful engagement rate would have increased from 75 to 81
54
PSO Assistance
Contact Information bull Jay Johnson
bull JayJohnsonazedgov
bull PSO E-mail bull PSOInboxazedgov
55
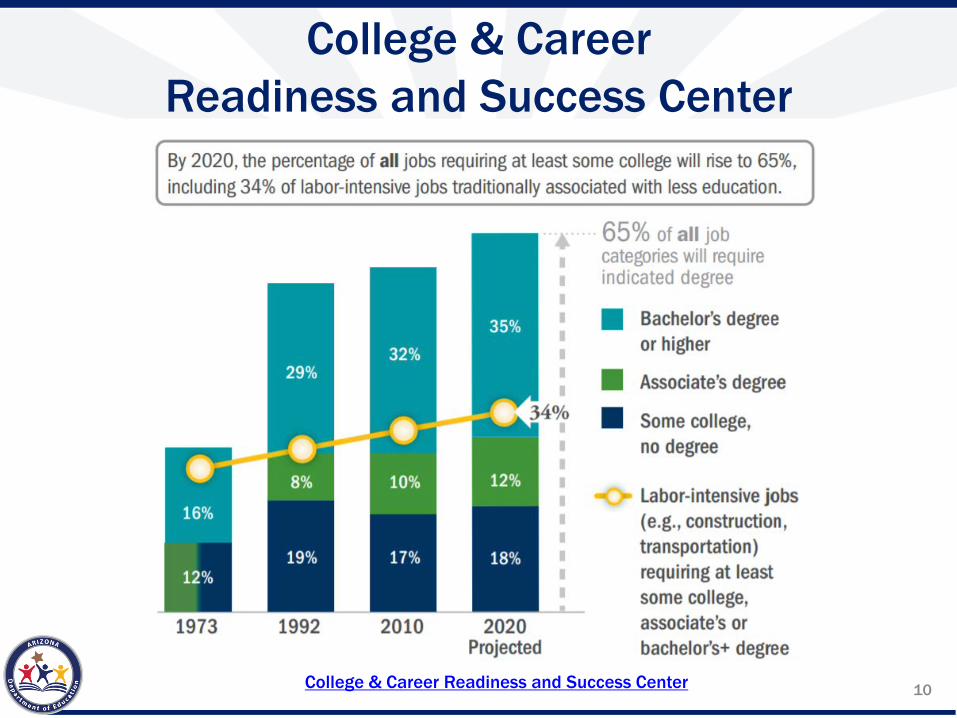
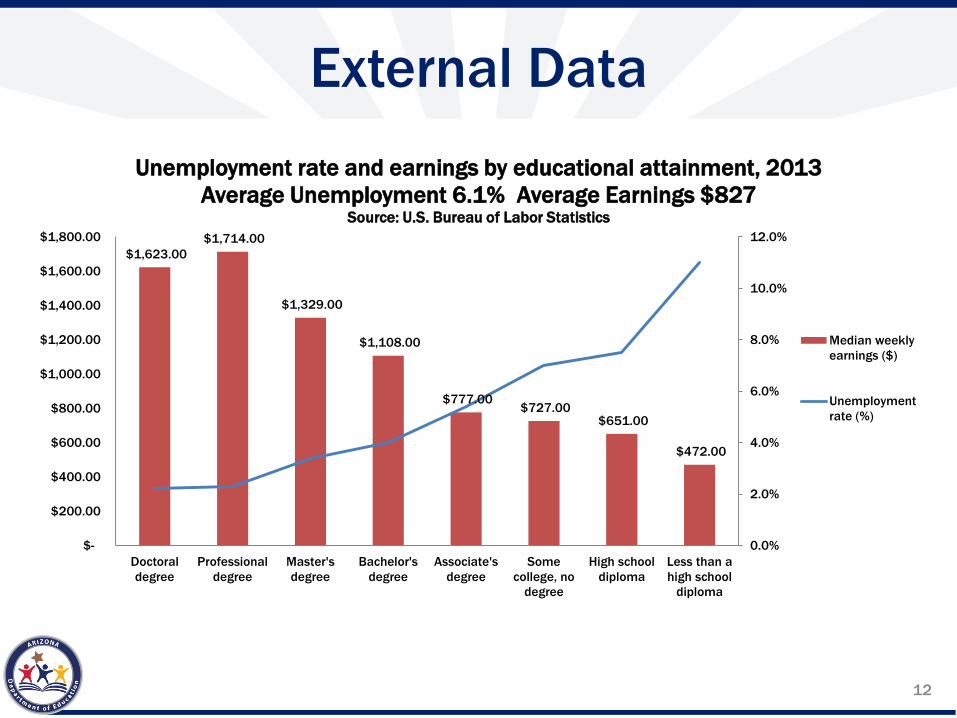

bull
Measurements A B amp C Arizona IDEA Part B SPPAPR Indicator 14 Post-School
Outcomes for School Year Exiters
Measurement A Higher Education
Measurement B Higher Education amp
Competitive Employment
Measurement C Higher Education
Competitive Employment amp Some Other Education Training
or Employment
Not Engaged
2014 23 59 73 27 2015 22 61 75 25
23
59
73
27 22
61
75
25
0
20
40
60
80
100
15
bull
Engagement Rates State Engagement Rates 6332 responded for a 7530 response rate
Enrolled In Higher Not Engaged 250 Education 224
Some Other Employment 56
Enrolled In Other Postsecondary
Competitive Education Or Training Employment 390 80
State
390 224 250
80 56
Enrolled In Higher Competitive Employment Enrolled In Other Some Other Employment Not Engaged Education Postsecondary Education
Or Training
16
Post-School (PSO) Outcomes for School Year Exiters 2014-2015
Tips about Student Engagement You Need To Know
Northern District Perspective
Flagstaff Unified
2016 PSO Survey
Erin Galland and Russ Randall Transition Specialists
Flagstaff Unified School District
bull
Measurements A B amp C Arizona IDEA Part B SPPAPR Indicator 14 Post-School
Outcomes for School Year Exiters
Measurement A Higher Education
Measurement B Higher Education amp
Competitive Employment
Measurement C Higher Education
Competitive Employment amp
Some Other Education Training or Employment
Not Engaged
Flagstaff Unified 24 78 87 13 Districts Greater than 100 Eligible 25 62 76 24
24
78
87
13
25
62
76
24
0
20
40
60
80
100
18
J
bull bull
Engagement Rates Flagstaff Unified Engagement Rates 109 Districts Greater than 100 Eligible
responded for a 916 response rate Engagement Rates 3658 responded for a Not 74 response rate
Engaged Not Enrolled In Enrolled In Engaged 128 Higher Higher
244 Education Education Other 239 254 Employ Other 37
Employ 53
Other Post Other Post Education Education
Or Training Competitive Or Training Competitive 55 Employ 80 Employ
541 369
541 369
244 239 254 128 55 80 37 53
Enrolled In Higher Education
Competitive Employment Enrolled In Other Postsecondary Education
Or Training
Some Other Employment Not Engaged
Flagstaff Unified Districts Greater than 100 Eligible
19
bull bull bull bull
Exit Data Flagstaff Unified Respondents Post-Secondary Outcomes by Exit Type
100
80
60
40
20
0 Aged Out (0) Dropout (21) Graduated (88) Unknown (0)
Not Engaged 00 238 102 00 Some Other Employment 00 95 23 00 Enrolled In Other Postsecondary
Education Or Training 00 95 45 00
Competitive Employment 00 571 534 00 Enrolled In Higher Education 00 00 295 00
20
bull bull bull bull
Exit Data Districts Greater than 100 Eligible Respondents Post-Secondary Outcomes by Exit
Type 100
80
60
40
20
0 Aged Out (0) Dropout (443) Graduated (3215) Unknown (0)
Not Engaged 00 515 207 00 Some Other Employment 00 61 52 00 Enrolled In Other Postsecondary
Education Or Training 00 79 80 00
Competitive Employment 00 316 376 00 Enrolled In Higher Education 00 29 285 00
21
bull bull bull bull
Gender Data Flagstaff Unified Respondents Post-Secondary Outcomes by Gender
Female (41) Male (68) Not Engaged 98 147 Some Other Employment 73 15 Enrolled In Other Postsecondary
Education Or Training 98 29
Competitive Employment 390 632 Enrolled In Higher Education 341 176
0
20
40
60
80
100
22
bull bull bull bull
Gender Data Districts Greater than 100 Eligible Respondents Post-Secondary Outcomes by
Gender 100
80
60
40
20
0 Female (1287) Male (2371)
Not Engaged 256 237 Some Other Employment 54 53 Enrolled In Other Postsecondary
Education Or Training 87 76
Competitive Employment 324 394 Enrolled In Higher Education 279 240
23
Figure 11 Types of accommodations and supports received from postsecondary schools by young adu lts with disabil it ies who had ever enrolled in a postsecondary school and had received these types of assistance
Additional time for tests
Technology
Tutor
Leamingbehavior management support
Additional time for modified assignments
Different test setting
Readerinterpreter in-class aide
Note taker
Written materials
Physical adaptations to classroom
Other testing accommodations
Large printbooks on tape Bra ille mater ials
Social work services
Case management
Independent living supports
Early registration
Other accommodations or supports
0
792 (8 17)
20 40 60 80
Percent of students who received accommodations and supports
100
2011 National Longitudinal Transition Study
2011 National Longitudinal Transition Study 24
Action Planning
bull Spring 2017 to Spring 2018 Planning bull Connecting and Events
bull Connecting students to Earn to Learn and Money Smart bull ldquoCollege Signing Dayrdquo
ndash Connects students to school community and self-disclosure
bull Connecting students to Earn to Learn and Money Smart
bull Training on college accommodations and used Think College Resource Library Transition Team Checklist in all high school IEPs
bull Using Infographic Transition to College What Changes after High School during ParentStudent Meetings
25
bull
Measurements A B amp C Arizona IDEA Part B SPPAPR Indicator 14 Post-School
Outcomes for School Year Exiters
Measurement A Higher Education
Measurement B Higher Education amp
Competitive Employment
Measurement C Higher Education
Competitive Employment amp
Some Other Education Training or Employment
Not Engaged
Flagstaff Unified TSW 23 77 81 19 Flagstaff Unified No TSW 24 79 92 8
23
77 81
19 24
79
92
8
0
20
40
60
80
100
26
bull bull
Engagement Rates Flagstaff Unified TSW Engagement Rates 47 responded for a 959 response rate
Enrolled In Higher Not
Education Engaged 234 191
Some Other Employmen
t 21
Enrolled In Other
Postsecond ary
Education Competitive Or Training Employmen
t 532 21
532 548
234 242 21
Flagstaff Unified No TSW Engagement Rates 62 responded for a 886 response
rate Not Enrolled In
Engaged Higher 81 Education
242 Some Other Employmen
t 48
Enrolled In Other
Postsecond ary Competitive
Education Employmen Or Training t 548
81
191 81 48 81 21
Enrolled In Higher Education
Competitive Employment Enrolled In Other Postsecondary Education
Or Training
Some Other Employment Not Engaged
Flagstaff Unified TSW Flagstaff Unified No TSW
27
bull bull bull bull
Disability Data Flagstaff Unified TSW Respondents Post-Secondary Outcomes by Disability Type
100
80
60
40
20
0 All Other
Disabilities (8) Emotional
Disturbance (12) Intellectual
Disability (2) Specific Learning
Disability (25) Not Engaged 125 167 00 240 Some Other Employment 00 83 00 00 Enrolled In Other Postsecondary
Education Or Training 00 00 00 40
Competitive Employment 750 500 500 480 Enrolled In Higher Education 125 250 500 240
28
bull bull bull bull
Disability Data Flagstaff Unified No TSW Respondents Post-Secondary Outcomes by Disability
Type 100
80
60
40
20
0 All Other
Disabilities (3) Emotional
Disturbance (8) Intellectual
Disability (2) Specific Learning
Disability (49) Not Engaged 00 125 1000 41 Some Other Employment 00 00 00 61 Enrolled In Other Postsecondary
Education Or Training 00 250 00 61
Competitive Employment 667 625 00 551 Enrolled In Higher Education 333 00 00 286
29
bull bull bull bull
Ethnicity Data Flagstaff Unified TSW Respondents Post-Secondary Outcomes by Ethnicity
100
80
60
40
20
0
American Indian or Alaskan
Native (19)
Asian (1)
Black or African
American (3)
Hispanic or Latino
(9)
Multi-racial (0)
Native Hawaiian or Other Pacific
Islander (0)
White (15)
Not Engaged 158 00 333 111 00 00 267 Some Other Employment 53 00 00 00 00 00 00 Enrolled In Other Postsecondary
Education Or Training 00 00 00 111 00 00 00
Competitive Employment 526 1000 667 778 00 00 333 Enrolled In Higher Education 263 00 00 00 00 00 400
30
bull bull bull bull
Ethnicity Data Flagstaff Unified No TSW Respondents Post-Secondary Outcomes by Ethnicity
100
80
60
40
20
0
American Indian or Alaskan
Native (11)
Asian (0)
Black or African
American (3)
Hispanic or Latino
(24)
Multi-racial (1)
Native Hawaiian or Other Pacific
Islander (0)
White (23)
Not Engaged 00 00 00 83 00 00 130 Some Other Employment 91 00 333 00 00 00 43 Enrolled In Other Postsecondary
Education Or Training 00 00 00 167 00 00 43
Competitive Employment 636 00 667 583 00 00 478 Enrolled In Higher Education 273 00 00 167 1000 00 304
31
bull bull bull bull
Gender Data Flagstaff Unified TSW Respondents Post-Secondary Outcomes by Gender
Female (17) Male (30) Not Engaged 235 167 Some Other Employment 59 00 Enrolled In Other Postsecondary
Education Or Training 59 00
Competitive Employment 294 667 Enrolled In Higher Education 353 167
0
20
40
60
80
100
32
bull bull bull bull
Gender Data Flagstaff Unified No TSW Respondents Post-Secondary Outcomes by Gender
Female (24) Male (38) Not Engaged 00 132 Some Other Employment 83 26 Enrolled In Other Postsecondary
Education Or Training 125 53
Competitive Employment 458 605 Enrolled In Higher Education 333 184
0
20
40
60
80
100
33
bull bull bull bull
Exit Data Flagstaff Unified TSW Respondents Post-Secondary Outcomes by Exit Type
100
80
60
40
20
0 Aged Out (0) Dropout (7) Graduated (40) Unknown (0)
Not Engaged 00 286 175 00 Some Other Employment 00 00 25 00 Enrolled In Other Postsecondary
Education Or Training 00 00 25 00
Competitive Employment 00 714 500 00 Enrolled In Higher Education 00 00 275 00
34
bull bull bull bull
Exit Data Flagstaff Unified No TSW Respondents Post-Secondary Outcomes by Exit Type
100
80
60
40
20
0 Aged Out (0) Dropout (14) Graduated (48) Unknown (0)
Not Engaged 00 214 42 00 Some Other Employment 00 143 21 00 Enrolled In Other Postsecondary
Education Or Training 00 143 63 00
Competitive Employment 00 500 563 00 Enrolled In Higher Education 00 00 313 00
35
Reviewing Data
bull Reviewing Data bull TSW Students v Non TSW Students
bull Autism 100 (Non-No Students) bull Emotional Disability 857 (Non-80) bull Emotional Disability (Private Day) 80 (Non-100) bull Mild Intellectual Disability 100 (Non-0) bull Multiple Disabilities 0 (Non-No Students) bull Other Health Impairment 100 (Non-100) bull Specific Learning Disabilities 76 (Non 95) bull Traumatic Brain Injury 100 (Non-No Students)
36
bull bull
Disability Data (Extended Breakdown) Flagstaff Unified TSW Respondents Post-Secondary Outcomes by
Disability Type Engaged vs Not Engaged (Extended)
Autism (1)
Emotional Disability (7)
Emotional Disability (separate facility private school) (5)
Hearing Impairment (0)
Mild Intellectual Disability (2)
Moderate Intellectual Disability (0)
Multiple Disabilities (1)
Multiple Disabilities - Severe Sensory Impairment (0)
Orthopedic Impairment (0)
Other Health Impairment (3)
Severe Intellectual Disability (0)
Specific Learning Disability (25)
SpeechLanguage Impairment (0)
Traumatic Brain Injury (3)
Visual Impairment (0)
1000
857
800
143
200
1000
1000
1000
760 240
1000
Engaged Not Engaged
37
bull bull
Disability Data (Extended Breakdown) Flagstaff Unified No TSW Respondents Post-Secondary Outcomes
by Disability Type Engaged vs Not Engaged (Extended)
Autism (0)
Emotional Disability (5)
Emotional Disability (separate facility private school) (3)
Hearing Impairment (0)
Mild Intellectual Disability (2)
Moderate Intellectual Disability (0)
Multiple Disabilities (0)
Multiple Disabilities - Severe Sensory Impairment (0)
Orthopedic Impairment (0)
Other Health Impairment (3)
Severe Intellectual Disability (0)
Specific Learning Disability (49)
SpeechLanguage Impairment (0)
Traumatic Brain Injury (0)
Visual Impairment (0)
800 200
1000
1000
1000
959 41
Engaged Not Engaged
38
bull bull bull bull
Disability Data (Extended Breakdown) Flagstaff Unified TSW Respondents Post-Secondary Outcomes by
Disability Type (Extended)
Autism (1)
Emotional Disability (7)
Emotional Disability (separate facility private school) (5)
Hearing Impairment (0)
Mild Intellectual Disability (2)
Moderate Intellectual Disability (0)
Multiple Disabilities (1)
Multiple Disabilities - Severe Sensory Impairment (0)
Orthopedic Impairment (0)
Other Health Impairment (3)
Severe Intellectual Disability (0)
Specific Learning Disability (25)
SpeechLanguage Impairment (0)
Traumatic Brain Injury (3)
Visual Impairment (0)
1000
429
500
429
600
500
200
1000
240
333
480
667
40
Enrolled In Higher Education Competitive Employment Enrolled In Other Postsecondary Education Or Training Some Other Employment
39
bull bull bull bull
Disability Data (Extended Breakdown) Flagstaff Unified No TSW Respondents Post-Secondary Outcomes
by Disability Type (Extended)
Autism (0)
Emotional Disability (5)
Emotional Disability (separate facility private school) (3)
Hearing Impairment (0)
Mild Intellectual Disability (2)
Moderate Intellectual Disability (0)
Multiple Disabilities (0)
Multiple Disabilities - Severe Sensory Impairment (0)
Orthopedic Impairment (0)
Other Health Impairment (3)
Severe Intellectual Disability (0)
Specific Learning Disability (49)
SpeechLanguage Impairment (0)
Traumatic Brain Injury (0)
Visual Impairment (0)
600
667
200
333
333 667
286 551 61 61
Enrolled In Higher Education Competitive Employment Enrolled In Other Postsecondary Education Or Training Some Other Employment
40
bull bull
National Longitudinal Transition Study (NLTS2) - 2012
N=305000 Students
Graduation Post-Secondary Paying Job AT 100 81 80 No AT 80 40 51
100
81 8080
40
51
0
20
40
60
80
100
120
National Longitudinal Transition Study 41
Reviewing Data
bull Local AT Data and National Longitudinal Transition Study bull 2012 National Longitudinal Transition Study
bull 809 Students with AT attended higher Ed bull 401 Students who did not receive AT Higher Ed bull 78 of students with high-incidence disabilities reported
receiving AT in high school
bull 2014-2015 AT Loan Library Data bull 144 High School Requests bull Coconino County 19 of all AT Loan Library Requests bull Higher Education in Coconino County 30 bull Higher Education in Arizona 22
42
Local Example bull Spring 2017 to Spring 2018 Planning
bull PSO Data and Not Engaged Students bull Training Staff
bull Training staff to use AT (Assistive Technology) and create AT Implementation Plan
bull Used ldquoA Student Handbook for Choosing and Using ATrdquo bull Providing self-advocacy skills and sense of pride bull Use AT Loan Library and AzTAP Loan Library bull New Apps Clips or CADET for Captioning for all Students
bull Connected High School CTE (Career and Technical Education) Program with College Level CTE Program bull Connecting to Community and self-disclosure
bull Connected Counseling Department and Transition Department (Connecting Community)
43
Inform and align
Multiple-Measure Accountablllty bull Multiple measures
of CCR bull Continuum of
readiness indicators bull Usable data
Well-Rounded Education bull Enriched accelerated
curricula and educational experiences
bull Improved conditions for learning
t State CCR Definition
bull Academic readiness
bull Nonacademic readiness
Inform and allgn
Purposeful Assessment bull Balanced assessment
systems bull Design and delivery for
meaningful results bull Measuring nonacademic
readiness
How PSO Can Improve Programming
College amp Career Readiness and Success Center 44
bull bull
Disability Data (Extended Breakdown) Flagstaff Unified Respondents Post-Secondary Outcomes by
Disability Type Engaged vs Not Engaged (Extended)
Autism (1)
Emotional Disability (12)
Emotional Disability (separate facility private school) (8)
Hearing Impairment (0)
Mild Intellectual Disability (4)
Moderate Intellectual Disability (0)
Multiple Disabilities (1)
Multiple Disabilities - Severe Sensory Impairment (0)
Orthopedic Impairment (0)
Other Health Impairment (6)
Severe Intellectual Disability (0)
Specific Learning Disability (74)
SpeechLanguage Impairment (0)
Traumatic Brain Injury (3)
Visual Impairment (0)
1000
833
875
500
167
125
500
1000
1000
892 108
1000
Engaged Not Engaged
45
bull bull bull bull
Disability Data (Extended Breakdown) Flagstaff Unified Respondents Post-Secondary Outcomes by
Disability Type (Extended)
Autism (1)
Emotional Disability (12)
Emotional Disability (separate facility private school) (8)
Hearing Impairment (0)
Mild Intellectual Disability (4)
Moderate Intellectual Disability (0)
Multiple Disabilities (1)
Multiple Disabilities - Severe Sensory Impairment (0)
Orthopedic Impairment (0)
Other Health Impairment (6)
Severe Intellectual Disability (0)
Specific Learning Disability (74)
SpeechLanguage Impairment (0)
Traumatic Brain Injury (3)
Visual Impairment (0)
1000
250 500
625
83
125 125
250 250
167 833
270 527 54 41
333 667
Enrolled In Higher Education Competitive Employment Enrolled In Other Postsecondary Education Or Training Some Other Employment
46
Post-School (PSO) Outcomes for School Year Exiters 2014-2015
Tips about Student Engagement You Need To Know
Southern District Perspective
State of Arizona 2016 PSO Survey
Jay Johnson Education Program Specialist
PSO Initiatives
Disability Data (Extended Breakdown) Arizona Post-Secondary Outcomes by Disability Type
Engaged vs Not Engaged (Extended)
Autism (455)
Emotional Disability (466)
Emotional Disability (separate facility private school) (116)
Hearing Impairment (57)
Mild Intellectual Disability (316)
Moderate Intellectual Disability (128)
Multiple Disabilities (102)
Multiple Disabilities - Severe Sensory Impairment (28)
Orthopedic Impairment (37)
Other Health Impairment (653)
Severe Intellectual Disability (26)
Specific Learning Disability (3837)
SpeechLanguage Impairment (52)
Traumatic Brain Injury (33)
Visual Impairment (26)
637
646
526
772
554
461
578
429
595
363
354
474
228
446
539
422
571
405
793
500
808
923
758
769
207
500
192
77
242
231
Engaged Not Engaged
48
bull bull bull bull
Disability Data (Extended Breakdown) Arizona Post-Secondary Outcomes by Disability Type (Extended)
Autism (455)
Emotional Disability (466)
Emotional Disability (separate facility private school) (116)
Hearing Impairment (57)
Mild Intellectual Disability (316)
Moderate Intellectual Disability (128)
Multiple Disabilities (102)
Multiple Disabilities - Severe Sensory Impairment (28)
Orthopedic Impairment (37)
Other Health Impairment (653)
Severe Intellectual Disability (26)
Specific Learning Disability (3837)
SpeechLanguage Impairment (52)
Traumatic Brain Injury (33)
Visual Impairment (26)
303
131
149
401
152
73
33
41
86 276 78 86
316 298 105 53
79
23
216
36
241
94
137
36
149
273
147
286
85
70
78
71
378
299
27
400
162
44
27
51
38 346 115
229
538
461
346
60
38
58
364
423
182
192
152
77
61
77
Enrolled In Higher Education Competitive Employment Enrolled In Other Postsecondary Education Or Training Some Other Employment
49
Pride
Self-Advocate o o gt i-i--o o
0
0
0
00 C 0
0
PATH TO DISABILITY
PRIDE
New Insights for Building Disability Pride and Empowering Students with Hidden Disabilities
0 0
0 0
0
0 0
0
PATH OF DISABILITY
SHAME 0
Disability Shame
Positive Student Outcomes
50
Resources
bull Review the student list to see if students can be excluded from having the PSO Survey administered (ie re-enrolled)
bull Grandparentsfriends are great resources
bull Update contact list as much as possible
bull Any parentstudent meeting (ie IEP progress parent conferences)
bull Some districts have used social media to contact hard to reach youth
bull Consider teachertransition specialist stipends
bull Make contact with families as often as possible
bull Email-to-text message
bull Strategies for Increasing Response Rates
bull Strategies for Contacting Hard-to-Find Youth
51
Resources
bull Arizona Department of Education (Search PSO Transitions ECAP AZCIS Arizona Community of Practice on Transition-AZCoPT)
bull Secondary Transition
bull ECAP-Education and Career Action Plan
bull AZCIS-Arizona Career Information System
bull AZCoPT-Arizona Community of Practice On Transition
bull NTACT-National Technical Assistance on Transition
bull Career One Stop (Your Source for Career Exploration)
bull My Futurecom (Figure out whatrsquos next)
52
June through September 2017 Survey Participants
bull 276 PEAs (districts and charter schools) WILL BE included in the reported data
bull Per SAIS the total number of exiters (youth who graduated aged out or dropped out) who ARE eligible to take the PSO Survey = 9701
53
ldquoUnengagedrdquo Characteristics
bull Of the 1584 individuals counted in the non-engaged category 1183 did not attempt any post secondary educationtraining or employment
bull However 401 respondents (25) indicated that they attempted post secondary educationtraining or employment but did not meet the criteria to be counted in an engagement category
bull If those 401 youth who attempted engagement had been successful engagement rate would have increased from 75 to 81
54
PSO Assistance
Contact Information bull Jay Johnson
bull JayJohnsonazedgov
bull PSO E-mail bull PSOInboxazedgov
55

bull
Engagement Rates State Engagement Rates 6332 responded for a 7530 response rate
Enrolled In Higher Not Engaged 250 Education 224
Some Other Employment 56
Enrolled In Other Postsecondary
Competitive Education Or Training Employment 390 80
State
390 224 250
80 56
Enrolled In Higher Competitive Employment Enrolled In Other Some Other Employment Not Engaged Education Postsecondary Education
Or Training
16
Post-School (PSO) Outcomes for School Year Exiters 2014-2015
Tips about Student Engagement You Need To Know
Northern District Perspective
Flagstaff Unified
2016 PSO Survey
Erin Galland and Russ Randall Transition Specialists
Flagstaff Unified School District
bull
Measurements A B amp C Arizona IDEA Part B SPPAPR Indicator 14 Post-School
Outcomes for School Year Exiters
Measurement A Higher Education
Measurement B Higher Education amp
Competitive Employment
Measurement C Higher Education
Competitive Employment amp
Some Other Education Training or Employment
Not Engaged
Flagstaff Unified 24 78 87 13 Districts Greater than 100 Eligible 25 62 76 24
24
78
87
13
25
62
76
24
0
20
40
60
80
100
18
J
bull bull
Engagement Rates Flagstaff Unified Engagement Rates 109 Districts Greater than 100 Eligible
responded for a 916 response rate Engagement Rates 3658 responded for a Not 74 response rate
Engaged Not Enrolled In Enrolled In Engaged 128 Higher Higher
244 Education Education Other 239 254 Employ Other 37
Employ 53
Other Post Other Post Education Education
Or Training Competitive Or Training Competitive 55 Employ 80 Employ
541 369
541 369
244 239 254 128 55 80 37 53
Enrolled In Higher Education
Competitive Employment Enrolled In Other Postsecondary Education
Or Training
Some Other Employment Not Engaged
Flagstaff Unified Districts Greater than 100 Eligible
19
bull bull bull bull
Exit Data Flagstaff Unified Respondents Post-Secondary Outcomes by Exit Type
100
80
60
40
20
0 Aged Out (0) Dropout (21) Graduated (88) Unknown (0)
Not Engaged 00 238 102 00 Some Other Employment 00 95 23 00 Enrolled In Other Postsecondary
Education Or Training 00 95 45 00
Competitive Employment 00 571 534 00 Enrolled In Higher Education 00 00 295 00
20
bull bull bull bull
Exit Data Districts Greater than 100 Eligible Respondents Post-Secondary Outcomes by Exit
Type 100
80
60
40
20
0 Aged Out (0) Dropout (443) Graduated (3215) Unknown (0)
Not Engaged 00 515 207 00 Some Other Employment 00 61 52 00 Enrolled In Other Postsecondary
Education Or Training 00 79 80 00
Competitive Employment 00 316 376 00 Enrolled In Higher Education 00 29 285 00
21
bull bull bull bull
Gender Data Flagstaff Unified Respondents Post-Secondary Outcomes by Gender
Female (41) Male (68) Not Engaged 98 147 Some Other Employment 73 15 Enrolled In Other Postsecondary
Education Or Training 98 29
Competitive Employment 390 632 Enrolled In Higher Education 341 176
0
20
40
60
80
100
22
bull bull bull bull
Gender Data Districts Greater than 100 Eligible Respondents Post-Secondary Outcomes by
Gender 100
80
60
40
20
0 Female (1287) Male (2371)
Not Engaged 256 237 Some Other Employment 54 53 Enrolled In Other Postsecondary
Education Or Training 87 76
Competitive Employment 324 394 Enrolled In Higher Education 279 240
23
Figure 11 Types of accommodations and supports received from postsecondary schools by young adu lts with disabil it ies who had ever enrolled in a postsecondary school and had received these types of assistance
Additional time for tests
Technology
Tutor
Leamingbehavior management support
Additional time for modified assignments
Different test setting
Readerinterpreter in-class aide
Note taker
Written materials
Physical adaptations to classroom
Other testing accommodations
Large printbooks on tape Bra ille mater ials
Social work services
Case management
Independent living supports
Early registration
Other accommodations or supports
0
792 (8 17)
20 40 60 80
Percent of students who received accommodations and supports
100
2011 National Longitudinal Transition Study
2011 National Longitudinal Transition Study 24
Action Planning
bull Spring 2017 to Spring 2018 Planning bull Connecting and Events
bull Connecting students to Earn to Learn and Money Smart bull ldquoCollege Signing Dayrdquo
ndash Connects students to school community and self-disclosure
bull Connecting students to Earn to Learn and Money Smart
bull Training on college accommodations and used Think College Resource Library Transition Team Checklist in all high school IEPs
bull Using Infographic Transition to College What Changes after High School during ParentStudent Meetings
25
bull
Measurements A B amp C Arizona IDEA Part B SPPAPR Indicator 14 Post-School
Outcomes for School Year Exiters
Measurement A Higher Education
Measurement B Higher Education amp
Competitive Employment
Measurement C Higher Education
Competitive Employment amp
Some Other Education Training or Employment
Not Engaged
Flagstaff Unified TSW 23 77 81 19 Flagstaff Unified No TSW 24 79 92 8
23
77 81
19 24
79
92
8
0
20
40
60
80
100
26
bull bull
Engagement Rates Flagstaff Unified TSW Engagement Rates 47 responded for a 959 response rate
Enrolled In Higher Not
Education Engaged 234 191
Some Other Employmen
t 21
Enrolled In Other
Postsecond ary
Education Competitive Or Training Employmen
t 532 21
532 548
234 242 21
Flagstaff Unified No TSW Engagement Rates 62 responded for a 886 response
rate Not Enrolled In
Engaged Higher 81 Education
242 Some Other Employmen
t 48
Enrolled In Other
Postsecond ary Competitive
Education Employmen Or Training t 548
81
191 81 48 81 21
Enrolled In Higher Education
Competitive Employment Enrolled In Other Postsecondary Education
Or Training
Some Other Employment Not Engaged
Flagstaff Unified TSW Flagstaff Unified No TSW
27
bull bull bull bull
Disability Data Flagstaff Unified TSW Respondents Post-Secondary Outcomes by Disability Type
100
80
60
40
20
0 All Other
Disabilities (8) Emotional
Disturbance (12) Intellectual
Disability (2) Specific Learning
Disability (25) Not Engaged 125 167 00 240 Some Other Employment 00 83 00 00 Enrolled In Other Postsecondary
Education Or Training 00 00 00 40
Competitive Employment 750 500 500 480 Enrolled In Higher Education 125 250 500 240
28
bull bull bull bull
Disability Data Flagstaff Unified No TSW Respondents Post-Secondary Outcomes by Disability
Type 100
80
60
40
20
0 All Other
Disabilities (3) Emotional
Disturbance (8) Intellectual
Disability (2) Specific Learning
Disability (49) Not Engaged 00 125 1000 41 Some Other Employment 00 00 00 61 Enrolled In Other Postsecondary
Education Or Training 00 250 00 61
Competitive Employment 667 625 00 551 Enrolled In Higher Education 333 00 00 286
29
bull bull bull bull
Ethnicity Data Flagstaff Unified TSW Respondents Post-Secondary Outcomes by Ethnicity
100
80
60
40
20
0
American Indian or Alaskan
Native (19)
Asian (1)
Black or African
American (3)
Hispanic or Latino
(9)
Multi-racial (0)
Native Hawaiian or Other Pacific
Islander (0)
White (15)
Not Engaged 158 00 333 111 00 00 267 Some Other Employment 53 00 00 00 00 00 00 Enrolled In Other Postsecondary
Education Or Training 00 00 00 111 00 00 00
Competitive Employment 526 1000 667 778 00 00 333 Enrolled In Higher Education 263 00 00 00 00 00 400
30
bull bull bull bull
Ethnicity Data Flagstaff Unified No TSW Respondents Post-Secondary Outcomes by Ethnicity
100
80
60
40
20
0
American Indian or Alaskan
Native (11)
Asian (0)
Black or African
American (3)
Hispanic or Latino
(24)
Multi-racial (1)
Native Hawaiian or Other Pacific
Islander (0)
White (23)
Not Engaged 00 00 00 83 00 00 130 Some Other Employment 91 00 333 00 00 00 43 Enrolled In Other Postsecondary
Education Or Training 00 00 00 167 00 00 43
Competitive Employment 636 00 667 583 00 00 478 Enrolled In Higher Education 273 00 00 167 1000 00 304
31
bull bull bull bull
Gender Data Flagstaff Unified TSW Respondents Post-Secondary Outcomes by Gender
Female (17) Male (30) Not Engaged 235 167 Some Other Employment 59 00 Enrolled In Other Postsecondary
Education Or Training 59 00
Competitive Employment 294 667 Enrolled In Higher Education 353 167
0
20
40
60
80
100
32
bull bull bull bull
Gender Data Flagstaff Unified No TSW Respondents Post-Secondary Outcomes by Gender
Female (24) Male (38) Not Engaged 00 132 Some Other Employment 83 26 Enrolled In Other Postsecondary
Education Or Training 125 53
Competitive Employment 458 605 Enrolled In Higher Education 333 184
0
20
40
60
80
100
33
bull bull bull bull
Exit Data Flagstaff Unified TSW Respondents Post-Secondary Outcomes by Exit Type
100
80
60
40
20
0 Aged Out (0) Dropout (7) Graduated (40) Unknown (0)
Not Engaged 00 286 175 00 Some Other Employment 00 00 25 00 Enrolled In Other Postsecondary
Education Or Training 00 00 25 00
Competitive Employment 00 714 500 00 Enrolled In Higher Education 00 00 275 00
34
bull bull bull bull
Exit Data Flagstaff Unified No TSW Respondents Post-Secondary Outcomes by Exit Type
100
80
60
40
20
0 Aged Out (0) Dropout (14) Graduated (48) Unknown (0)
Not Engaged 00 214 42 00 Some Other Employment 00 143 21 00 Enrolled In Other Postsecondary
Education Or Training 00 143 63 00
Competitive Employment 00 500 563 00 Enrolled In Higher Education 00 00 313 00
35
Reviewing Data
bull Reviewing Data bull TSW Students v Non TSW Students
bull Autism 100 (Non-No Students) bull Emotional Disability 857 (Non-80) bull Emotional Disability (Private Day) 80 (Non-100) bull Mild Intellectual Disability 100 (Non-0) bull Multiple Disabilities 0 (Non-No Students) bull Other Health Impairment 100 (Non-100) bull Specific Learning Disabilities 76 (Non 95) bull Traumatic Brain Injury 100 (Non-No Students)
36
bull bull
Disability Data (Extended Breakdown) Flagstaff Unified TSW Respondents Post-Secondary Outcomes by
Disability Type Engaged vs Not Engaged (Extended)
Autism (1)
Emotional Disability (7)
Emotional Disability (separate facility private school) (5)
Hearing Impairment (0)
Mild Intellectual Disability (2)
Moderate Intellectual Disability (0)
Multiple Disabilities (1)
Multiple Disabilities - Severe Sensory Impairment (0)
Orthopedic Impairment (0)
Other Health Impairment (3)
Severe Intellectual Disability (0)
Specific Learning Disability (25)
SpeechLanguage Impairment (0)
Traumatic Brain Injury (3)
Visual Impairment (0)
1000
857
800
143
200
1000
1000
1000
760 240
1000
Engaged Not Engaged
37
bull bull
Disability Data (Extended Breakdown) Flagstaff Unified No TSW Respondents Post-Secondary Outcomes
by Disability Type Engaged vs Not Engaged (Extended)
Autism (0)
Emotional Disability (5)
Emotional Disability (separate facility private school) (3)
Hearing Impairment (0)
Mild Intellectual Disability (2)
Moderate Intellectual Disability (0)
Multiple Disabilities (0)
Multiple Disabilities - Severe Sensory Impairment (0)
Orthopedic Impairment (0)
Other Health Impairment (3)
Severe Intellectual Disability (0)
Specific Learning Disability (49)
SpeechLanguage Impairment (0)
Traumatic Brain Injury (0)
Visual Impairment (0)
800 200
1000
1000
1000
959 41
Engaged Not Engaged
38
bull bull bull bull
Disability Data (Extended Breakdown) Flagstaff Unified TSW Respondents Post-Secondary Outcomes by
Disability Type (Extended)
Autism (1)
Emotional Disability (7)
Emotional Disability (separate facility private school) (5)
Hearing Impairment (0)
Mild Intellectual Disability (2)
Moderate Intellectual Disability (0)
Multiple Disabilities (1)
Multiple Disabilities - Severe Sensory Impairment (0)
Orthopedic Impairment (0)
Other Health Impairment (3)
Severe Intellectual Disability (0)
Specific Learning Disability (25)
SpeechLanguage Impairment (0)
Traumatic Brain Injury (3)
Visual Impairment (0)
1000
429
500
429
600
500
200
1000
240
333
480
667
40
Enrolled In Higher Education Competitive Employment Enrolled In Other Postsecondary Education Or Training Some Other Employment
39
bull bull bull bull
Disability Data (Extended Breakdown) Flagstaff Unified No TSW Respondents Post-Secondary Outcomes
by Disability Type (Extended)
Autism (0)
Emotional Disability (5)
Emotional Disability (separate facility private school) (3)
Hearing Impairment (0)
Mild Intellectual Disability (2)
Moderate Intellectual Disability (0)
Multiple Disabilities (0)
Multiple Disabilities - Severe Sensory Impairment (0)
Orthopedic Impairment (0)
Other Health Impairment (3)
Severe Intellectual Disability (0)
Specific Learning Disability (49)
SpeechLanguage Impairment (0)
Traumatic Brain Injury (0)
Visual Impairment (0)
600
667
200
333
333 667
286 551 61 61
Enrolled In Higher Education Competitive Employment Enrolled In Other Postsecondary Education Or Training Some Other Employment
40
bull bull
National Longitudinal Transition Study (NLTS2) - 2012
N=305000 Students
Graduation Post-Secondary Paying Job AT 100 81 80 No AT 80 40 51
100
81 8080
40
51
0
20
40
60
80
100
120
National Longitudinal Transition Study 41
Reviewing Data
bull Local AT Data and National Longitudinal Transition Study bull 2012 National Longitudinal Transition Study
bull 809 Students with AT attended higher Ed bull 401 Students who did not receive AT Higher Ed bull 78 of students with high-incidence disabilities reported
receiving AT in high school
bull 2014-2015 AT Loan Library Data bull 144 High School Requests bull Coconino County 19 of all AT Loan Library Requests bull Higher Education in Coconino County 30 bull Higher Education in Arizona 22
42
Local Example bull Spring 2017 to Spring 2018 Planning
bull PSO Data and Not Engaged Students bull Training Staff
bull Training staff to use AT (Assistive Technology) and create AT Implementation Plan
bull Used ldquoA Student Handbook for Choosing and Using ATrdquo bull Providing self-advocacy skills and sense of pride bull Use AT Loan Library and AzTAP Loan Library bull New Apps Clips or CADET for Captioning for all Students
bull Connected High School CTE (Career and Technical Education) Program with College Level CTE Program bull Connecting to Community and self-disclosure
bull Connected Counseling Department and Transition Department (Connecting Community)
43
Inform and align
Multiple-Measure Accountablllty bull Multiple measures
of CCR bull Continuum of
readiness indicators bull Usable data
Well-Rounded Education bull Enriched accelerated
curricula and educational experiences
bull Improved conditions for learning
t State CCR Definition
bull Academic readiness
bull Nonacademic readiness
Inform and allgn
Purposeful Assessment bull Balanced assessment
systems bull Design and delivery for
meaningful results bull Measuring nonacademic
readiness
How PSO Can Improve Programming
College amp Career Readiness and Success Center 44
bull bull
Disability Data (Extended Breakdown) Flagstaff Unified Respondents Post-Secondary Outcomes by
Disability Type Engaged vs Not Engaged (Extended)
Autism (1)
Emotional Disability (12)
Emotional Disability (separate facility private school) (8)
Hearing Impairment (0)
Mild Intellectual Disability (4)
Moderate Intellectual Disability (0)
Multiple Disabilities (1)
Multiple Disabilities - Severe Sensory Impairment (0)
Orthopedic Impairment (0)
Other Health Impairment (6)
Severe Intellectual Disability (0)
Specific Learning Disability (74)
SpeechLanguage Impairment (0)
Traumatic Brain Injury (3)
Visual Impairment (0)
1000
833
875
500
167
125
500
1000
1000
892 108
1000
Engaged Not Engaged
45
bull bull bull bull
Disability Data (Extended Breakdown) Flagstaff Unified Respondents Post-Secondary Outcomes by
Disability Type (Extended)
Autism (1)
Emotional Disability (12)
Emotional Disability (separate facility private school) (8)
Hearing Impairment (0)
Mild Intellectual Disability (4)
Moderate Intellectual Disability (0)
Multiple Disabilities (1)
Multiple Disabilities - Severe Sensory Impairment (0)
Orthopedic Impairment (0)
Other Health Impairment (6)
Severe Intellectual Disability (0)
Specific Learning Disability (74)
SpeechLanguage Impairment (0)
Traumatic Brain Injury (3)
Visual Impairment (0)
1000
250 500
625
83
125 125
250 250
167 833
270 527 54 41
333 667
Enrolled In Higher Education Competitive Employment Enrolled In Other Postsecondary Education Or Training Some Other Employment
46
Post-School (PSO) Outcomes for School Year Exiters 2014-2015
Tips about Student Engagement You Need To Know
Southern District Perspective
State of Arizona 2016 PSO Survey
Jay Johnson Education Program Specialist
PSO Initiatives
Disability Data (Extended Breakdown) Arizona Post-Secondary Outcomes by Disability Type
Engaged vs Not Engaged (Extended)
Autism (455)
Emotional Disability (466)
Emotional Disability (separate facility private school) (116)
Hearing Impairment (57)
Mild Intellectual Disability (316)
Moderate Intellectual Disability (128)
Multiple Disabilities (102)
Multiple Disabilities - Severe Sensory Impairment (28)
Orthopedic Impairment (37)
Other Health Impairment (653)
Severe Intellectual Disability (26)
Specific Learning Disability (3837)
SpeechLanguage Impairment (52)
Traumatic Brain Injury (33)
Visual Impairment (26)
637
646
526
772
554
461
578
429
595
363
354
474
228
446
539
422
571
405
793
500
808
923
758
769
207
500
192
77
242
231
Engaged Not Engaged
48
bull bull bull bull
Disability Data (Extended Breakdown) Arizona Post-Secondary Outcomes by Disability Type (Extended)
Autism (455)
Emotional Disability (466)
Emotional Disability (separate facility private school) (116)
Hearing Impairment (57)
Mild Intellectual Disability (316)
Moderate Intellectual Disability (128)
Multiple Disabilities (102)
Multiple Disabilities - Severe Sensory Impairment (28)
Orthopedic Impairment (37)
Other Health Impairment (653)
Severe Intellectual Disability (26)
Specific Learning Disability (3837)
SpeechLanguage Impairment (52)
Traumatic Brain Injury (33)
Visual Impairment (26)
303
131
149
401
152
73
33
41
86 276 78 86
316 298 105 53
79
23
216
36
241
94
137
36
149
273
147
286
85
70
78
71
378
299
27
400
162
44
27
51
38 346 115
229
538
461
346
60
38
58
364
423
182
192
152
77
61
77
Enrolled In Higher Education Competitive Employment Enrolled In Other Postsecondary Education Or Training Some Other Employment
49
Pride
Self-Advocate o o gt i-i--o o
0
0
0
00 C 0
0
PATH TO DISABILITY
PRIDE
New Insights for Building Disability Pride and Empowering Students with Hidden Disabilities
0 0
0 0
0
0 0
0
PATH OF DISABILITY
SHAME 0
Disability Shame
Positive Student Outcomes
50
Resources
bull Review the student list to see if students can be excluded from having the PSO Survey administered (ie re-enrolled)
bull Grandparentsfriends are great resources
bull Update contact list as much as possible
bull Any parentstudent meeting (ie IEP progress parent conferences)
bull Some districts have used social media to contact hard to reach youth
bull Consider teachertransition specialist stipends
bull Make contact with families as often as possible
bull Email-to-text message
bull Strategies for Increasing Response Rates
bull Strategies for Contacting Hard-to-Find Youth
51
Resources
bull Arizona Department of Education (Search PSO Transitions ECAP AZCIS Arizona Community of Practice on Transition-AZCoPT)
bull Secondary Transition
bull ECAP-Education and Career Action Plan
bull AZCIS-Arizona Career Information System
bull AZCoPT-Arizona Community of Practice On Transition
bull NTACT-National Technical Assistance on Transition
bull Career One Stop (Your Source for Career Exploration)
bull My Futurecom (Figure out whatrsquos next)
52
June through September 2017 Survey Participants
bull 276 PEAs (districts and charter schools) WILL BE included in the reported data
bull Per SAIS the total number of exiters (youth who graduated aged out or dropped out) who ARE eligible to take the PSO Survey = 9701
53
ldquoUnengagedrdquo Characteristics
bull Of the 1584 individuals counted in the non-engaged category 1183 did not attempt any post secondary educationtraining or employment
bull However 401 respondents (25) indicated that they attempted post secondary educationtraining or employment but did not meet the criteria to be counted in an engagement category
bull If those 401 youth who attempted engagement had been successful engagement rate would have increased from 75 to 81
54
PSO Assistance
Contact Information bull Jay Johnson
bull JayJohnsonazedgov
bull PSO E-mail bull PSOInboxazedgov
55

Post-School (PSO) Outcomes for School Year Exiters 2014-2015
Tips about Student Engagement You Need To Know
Northern District Perspective
Flagstaff Unified
2016 PSO Survey
Erin Galland and Russ Randall Transition Specialists
Flagstaff Unified School District
bull
Measurements A B amp C Arizona IDEA Part B SPPAPR Indicator 14 Post-School
Outcomes for School Year Exiters
Measurement A Higher Education
Measurement B Higher Education amp
Competitive Employment
Measurement C Higher Education
Competitive Employment amp
Some Other Education Training or Employment
Not Engaged
Flagstaff Unified 24 78 87 13 Districts Greater than 100 Eligible 25 62 76 24
24
78
87
13
25
62
76
24
0
20
40
60
80
100
18
J
bull bull
Engagement Rates Flagstaff Unified Engagement Rates 109 Districts Greater than 100 Eligible
responded for a 916 response rate Engagement Rates 3658 responded for a Not 74 response rate
Engaged Not Enrolled In Enrolled In Engaged 128 Higher Higher
244 Education Education Other 239 254 Employ Other 37
Employ 53
Other Post Other Post Education Education
Or Training Competitive Or Training Competitive 55 Employ 80 Employ
541 369
541 369
244 239 254 128 55 80 37 53
Enrolled In Higher Education
Competitive Employment Enrolled In Other Postsecondary Education
Or Training
Some Other Employment Not Engaged
Flagstaff Unified Districts Greater than 100 Eligible
19
bull bull bull bull
Exit Data Flagstaff Unified Respondents Post-Secondary Outcomes by Exit Type
100
80
60
40
20
0 Aged Out (0) Dropout (21) Graduated (88) Unknown (0)
Not Engaged 00 238 102 00 Some Other Employment 00 95 23 00 Enrolled In Other Postsecondary
Education Or Training 00 95 45 00
Competitive Employment 00 571 534 00 Enrolled In Higher Education 00 00 295 00
20
bull bull bull bull
Exit Data Districts Greater than 100 Eligible Respondents Post-Secondary Outcomes by Exit
Type 100
80
60
40
20
0 Aged Out (0) Dropout (443) Graduated (3215) Unknown (0)
Not Engaged 00 515 207 00 Some Other Employment 00 61 52 00 Enrolled In Other Postsecondary
Education Or Training 00 79 80 00
Competitive Employment 00 316 376 00 Enrolled In Higher Education 00 29 285 00
21
bull bull bull bull
Gender Data Flagstaff Unified Respondents Post-Secondary Outcomes by Gender
Female (41) Male (68) Not Engaged 98 147 Some Other Employment 73 15 Enrolled In Other Postsecondary
Education Or Training 98 29
Competitive Employment 390 632 Enrolled In Higher Education 341 176
0
20
40
60
80
100
22
bull bull bull bull
Gender Data Districts Greater than 100 Eligible Respondents Post-Secondary Outcomes by
Gender 100
80
60
40
20
0 Female (1287) Male (2371)
Not Engaged 256 237 Some Other Employment 54 53 Enrolled In Other Postsecondary
Education Or Training 87 76
Competitive Employment 324 394 Enrolled In Higher Education 279 240
23
Figure 11 Types of accommodations and supports received from postsecondary schools by young adu lts with disabil it ies who had ever enrolled in a postsecondary school and had received these types of assistance
Additional time for tests
Technology
Tutor
Leamingbehavior management support
Additional time for modified assignments
Different test setting
Readerinterpreter in-class aide
Note taker
Written materials
Physical adaptations to classroom
Other testing accommodations
Large printbooks on tape Bra ille mater ials
Social work services
Case management
Independent living supports
Early registration
Other accommodations or supports
0
792 (8 17)
20 40 60 80
Percent of students who received accommodations and supports
100
2011 National Longitudinal Transition Study
2011 National Longitudinal Transition Study 24
Action Planning
bull Spring 2017 to Spring 2018 Planning bull Connecting and Events
bull Connecting students to Earn to Learn and Money Smart bull ldquoCollege Signing Dayrdquo
ndash Connects students to school community and self-disclosure
bull Connecting students to Earn to Learn and Money Smart
bull Training on college accommodations and used Think College Resource Library Transition Team Checklist in all high school IEPs
bull Using Infographic Transition to College What Changes after High School during ParentStudent Meetings
25
bull
Measurements A B amp C Arizona IDEA Part B SPPAPR Indicator 14 Post-School
Outcomes for School Year Exiters
Measurement A Higher Education
Measurement B Higher Education amp
Competitive Employment
Measurement C Higher Education
Competitive Employment amp
Some Other Education Training or Employment
Not Engaged
Flagstaff Unified TSW 23 77 81 19 Flagstaff Unified No TSW 24 79 92 8
23
77 81
19 24
79
92
8
0
20
40
60
80
100
26
bull bull
Engagement Rates Flagstaff Unified TSW Engagement Rates 47 responded for a 959 response rate
Enrolled In Higher Not
Education Engaged 234 191
Some Other Employmen
t 21
Enrolled In Other
Postsecond ary
Education Competitive Or Training Employmen
t 532 21
532 548
234 242 21
Flagstaff Unified No TSW Engagement Rates 62 responded for a 886 response
rate Not Enrolled In
Engaged Higher 81 Education
242 Some Other Employmen
t 48
Enrolled In Other
Postsecond ary Competitive
Education Employmen Or Training t 548
81
191 81 48 81 21
Enrolled In Higher Education
Competitive Employment Enrolled In Other Postsecondary Education
Or Training
Some Other Employment Not Engaged
Flagstaff Unified TSW Flagstaff Unified No TSW
27
bull bull bull bull
Disability Data Flagstaff Unified TSW Respondents Post-Secondary Outcomes by Disability Type
100
80
60
40
20
0 All Other
Disabilities (8) Emotional
Disturbance (12) Intellectual
Disability (2) Specific Learning
Disability (25) Not Engaged 125 167 00 240 Some Other Employment 00 83 00 00 Enrolled In Other Postsecondary
Education Or Training 00 00 00 40
Competitive Employment 750 500 500 480 Enrolled In Higher Education 125 250 500 240
28
bull bull bull bull
Disability Data Flagstaff Unified No TSW Respondents Post-Secondary Outcomes by Disability
Type 100
80
60
40
20
0 All Other
Disabilities (3) Emotional
Disturbance (8) Intellectual
Disability (2) Specific Learning
Disability (49) Not Engaged 00 125 1000 41 Some Other Employment 00 00 00 61 Enrolled In Other Postsecondary
Education Or Training 00 250 00 61
Competitive Employment 667 625 00 551 Enrolled In Higher Education 333 00 00 286
29
bull bull bull bull
Ethnicity Data Flagstaff Unified TSW Respondents Post-Secondary Outcomes by Ethnicity
100
80
60
40
20
0
American Indian or Alaskan
Native (19)
Asian (1)
Black or African
American (3)
Hispanic or Latino
(9)
Multi-racial (0)
Native Hawaiian or Other Pacific
Islander (0)
White (15)
Not Engaged 158 00 333 111 00 00 267 Some Other Employment 53 00 00 00 00 00 00 Enrolled In Other Postsecondary
Education Or Training 00 00 00 111 00 00 00
Competitive Employment 526 1000 667 778 00 00 333 Enrolled In Higher Education 263 00 00 00 00 00 400
30
bull bull bull bull
Ethnicity Data Flagstaff Unified No TSW Respondents Post-Secondary Outcomes by Ethnicity
100
80
60
40
20
0
American Indian or Alaskan
Native (11)
Asian (0)
Black or African
American (3)
Hispanic or Latino
(24)
Multi-racial (1)
Native Hawaiian or Other Pacific
Islander (0)
White (23)
Not Engaged 00 00 00 83 00 00 130 Some Other Employment 91 00 333 00 00 00 43 Enrolled In Other Postsecondary
Education Or Training 00 00 00 167 00 00 43
Competitive Employment 636 00 667 583 00 00 478 Enrolled In Higher Education 273 00 00 167 1000 00 304
31
bull bull bull bull
Gender Data Flagstaff Unified TSW Respondents Post-Secondary Outcomes by Gender
Female (17) Male (30) Not Engaged 235 167 Some Other Employment 59 00 Enrolled In Other Postsecondary
Education Or Training 59 00
Competitive Employment 294 667 Enrolled In Higher Education 353 167
0
20
40
60
80
100
32
bull bull bull bull
Gender Data Flagstaff Unified No TSW Respondents Post-Secondary Outcomes by Gender
Female (24) Male (38) Not Engaged 00 132 Some Other Employment 83 26 Enrolled In Other Postsecondary
Education Or Training 125 53
Competitive Employment 458 605 Enrolled In Higher Education 333 184
0
20
40
60
80
100
33
bull bull bull bull
Exit Data Flagstaff Unified TSW Respondents Post-Secondary Outcomes by Exit Type
100
80
60
40
20
0 Aged Out (0) Dropout (7) Graduated (40) Unknown (0)
Not Engaged 00 286 175 00 Some Other Employment 00 00 25 00 Enrolled In Other Postsecondary
Education Or Training 00 00 25 00
Competitive Employment 00 714 500 00 Enrolled In Higher Education 00 00 275 00
34
bull bull bull bull
Exit Data Flagstaff Unified No TSW Respondents Post-Secondary Outcomes by Exit Type
100
80
60
40
20
0 Aged Out (0) Dropout (14) Graduated (48) Unknown (0)
Not Engaged 00 214 42 00 Some Other Employment 00 143 21 00 Enrolled In Other Postsecondary
Education Or Training 00 143 63 00
Competitive Employment 00 500 563 00 Enrolled In Higher Education 00 00 313 00
35
Reviewing Data
bull Reviewing Data bull TSW Students v Non TSW Students
bull Autism 100 (Non-No Students) bull Emotional Disability 857 (Non-80) bull Emotional Disability (Private Day) 80 (Non-100) bull Mild Intellectual Disability 100 (Non-0) bull Multiple Disabilities 0 (Non-No Students) bull Other Health Impairment 100 (Non-100) bull Specific Learning Disabilities 76 (Non 95) bull Traumatic Brain Injury 100 (Non-No Students)
36
bull bull
Disability Data (Extended Breakdown) Flagstaff Unified TSW Respondents Post-Secondary Outcomes by
Disability Type Engaged vs Not Engaged (Extended)
Autism (1)
Emotional Disability (7)
Emotional Disability (separate facility private school) (5)
Hearing Impairment (0)
Mild Intellectual Disability (2)
Moderate Intellectual Disability (0)
Multiple Disabilities (1)
Multiple Disabilities - Severe Sensory Impairment (0)
Orthopedic Impairment (0)
Other Health Impairment (3)
Severe Intellectual Disability (0)
Specific Learning Disability (25)
SpeechLanguage Impairment (0)
Traumatic Brain Injury (3)
Visual Impairment (0)
1000
857
800
143
200
1000
1000
1000
760 240
1000
Engaged Not Engaged
37
bull bull
Disability Data (Extended Breakdown) Flagstaff Unified No TSW Respondents Post-Secondary Outcomes
by Disability Type Engaged vs Not Engaged (Extended)
Autism (0)
Emotional Disability (5)
Emotional Disability (separate facility private school) (3)
Hearing Impairment (0)
Mild Intellectual Disability (2)
Moderate Intellectual Disability (0)
Multiple Disabilities (0)
Multiple Disabilities - Severe Sensory Impairment (0)
Orthopedic Impairment (0)
Other Health Impairment (3)
Severe Intellectual Disability (0)
Specific Learning Disability (49)
SpeechLanguage Impairment (0)
Traumatic Brain Injury (0)
Visual Impairment (0)
800 200
1000
1000
1000
959 41
Engaged Not Engaged
38
bull bull bull bull
Disability Data (Extended Breakdown) Flagstaff Unified TSW Respondents Post-Secondary Outcomes by
Disability Type (Extended)
Autism (1)
Emotional Disability (7)
Emotional Disability (separate facility private school) (5)
Hearing Impairment (0)
Mild Intellectual Disability (2)
Moderate Intellectual Disability (0)
Multiple Disabilities (1)
Multiple Disabilities - Severe Sensory Impairment (0)
Orthopedic Impairment (0)
Other Health Impairment (3)
Severe Intellectual Disability (0)
Specific Learning Disability (25)
SpeechLanguage Impairment (0)
Traumatic Brain Injury (3)
Visual Impairment (0)
1000
429
500
429
600
500
200
1000
240
333
480
667
40
Enrolled In Higher Education Competitive Employment Enrolled In Other Postsecondary Education Or Training Some Other Employment
39
bull bull bull bull
Disability Data (Extended Breakdown) Flagstaff Unified No TSW Respondents Post-Secondary Outcomes
by Disability Type (Extended)
Autism (0)
Emotional Disability (5)
Emotional Disability (separate facility private school) (3)
Hearing Impairment (0)
Mild Intellectual Disability (2)
Moderate Intellectual Disability (0)
Multiple Disabilities (0)
Multiple Disabilities - Severe Sensory Impairment (0)
Orthopedic Impairment (0)
Other Health Impairment (3)
Severe Intellectual Disability (0)
Specific Learning Disability (49)
SpeechLanguage Impairment (0)
Traumatic Brain Injury (0)
Visual Impairment (0)
600
667
200
333
333 667
286 551 61 61
Enrolled In Higher Education Competitive Employment Enrolled In Other Postsecondary Education Or Training Some Other Employment
40
bull bull
National Longitudinal Transition Study (NLTS2) - 2012
N=305000 Students
Graduation Post-Secondary Paying Job AT 100 81 80 No AT 80 40 51
100
81 8080
40
51
0
20
40
60
80
100
120
National Longitudinal Transition Study 41
Reviewing Data
bull Local AT Data and National Longitudinal Transition Study bull 2012 National Longitudinal Transition Study
bull 809 Students with AT attended higher Ed bull 401 Students who did not receive AT Higher Ed bull 78 of students with high-incidence disabilities reported
receiving AT in high school
bull 2014-2015 AT Loan Library Data bull 144 High School Requests bull Coconino County 19 of all AT Loan Library Requests bull Higher Education in Coconino County 30 bull Higher Education in Arizona 22
42
Local Example bull Spring 2017 to Spring 2018 Planning
bull PSO Data and Not Engaged Students bull Training Staff
bull Training staff to use AT (Assistive Technology) and create AT Implementation Plan
bull Used ldquoA Student Handbook for Choosing and Using ATrdquo bull Providing self-advocacy skills and sense of pride bull Use AT Loan Library and AzTAP Loan Library bull New Apps Clips or CADET for Captioning for all Students
bull Connected High School CTE (Career and Technical Education) Program with College Level CTE Program bull Connecting to Community and self-disclosure
bull Connected Counseling Department and Transition Department (Connecting Community)
43
Inform and align
Multiple-Measure Accountablllty bull Multiple measures
of CCR bull Continuum of
readiness indicators bull Usable data
Well-Rounded Education bull Enriched accelerated
curricula and educational experiences
bull Improved conditions for learning
t State CCR Definition
bull Academic readiness
bull Nonacademic readiness
Inform and allgn
Purposeful Assessment bull Balanced assessment
systems bull Design and delivery for
meaningful results bull Measuring nonacademic
readiness
How PSO Can Improve Programming
College amp Career Readiness and Success Center 44
bull bull
Disability Data (Extended Breakdown) Flagstaff Unified Respondents Post-Secondary Outcomes by
Disability Type Engaged vs Not Engaged (Extended)
Autism (1)
Emotional Disability (12)
Emotional Disability (separate facility private school) (8)
Hearing Impairment (0)
Mild Intellectual Disability (4)
Moderate Intellectual Disability (0)
Multiple Disabilities (1)
Multiple Disabilities - Severe Sensory Impairment (0)
Orthopedic Impairment (0)
Other Health Impairment (6)
Severe Intellectual Disability (0)
Specific Learning Disability (74)
SpeechLanguage Impairment (0)
Traumatic Brain Injury (3)
Visual Impairment (0)
1000
833
875
500
167
125
500
1000
1000
892 108
1000
Engaged Not Engaged
45
bull bull bull bull
Disability Data (Extended Breakdown) Flagstaff Unified Respondents Post-Secondary Outcomes by
Disability Type (Extended)
Autism (1)
Emotional Disability (12)
Emotional Disability (separate facility private school) (8)
Hearing Impairment (0)
Mild Intellectual Disability (4)
Moderate Intellectual Disability (0)
Multiple Disabilities (1)
Multiple Disabilities - Severe Sensory Impairment (0)
Orthopedic Impairment (0)
Other Health Impairment (6)
Severe Intellectual Disability (0)
Specific Learning Disability (74)
SpeechLanguage Impairment (0)
Traumatic Brain Injury (3)
Visual Impairment (0)
1000
250 500
625
83
125 125
250 250
167 833
270 527 54 41
333 667
Enrolled In Higher Education Competitive Employment Enrolled In Other Postsecondary Education Or Training Some Other Employment
46
Post-School (PSO) Outcomes for School Year Exiters 2014-2015
Tips about Student Engagement You Need To Know
Southern District Perspective
State of Arizona 2016 PSO Survey
Jay Johnson Education Program Specialist
PSO Initiatives
Disability Data (Extended Breakdown) Arizona Post-Secondary Outcomes by Disability Type
Engaged vs Not Engaged (Extended)
Autism (455)
Emotional Disability (466)
Emotional Disability (separate facility private school) (116)
Hearing Impairment (57)
Mild Intellectual Disability (316)
Moderate Intellectual Disability (128)
Multiple Disabilities (102)
Multiple Disabilities - Severe Sensory Impairment (28)
Orthopedic Impairment (37)
Other Health Impairment (653)
Severe Intellectual Disability (26)
Specific Learning Disability (3837)
SpeechLanguage Impairment (52)
Traumatic Brain Injury (33)
Visual Impairment (26)
637
646
526
772
554
461
578
429
595
363
354
474
228
446
539
422
571
405
793
500
808
923
758
769
207
500
192
77
242
231
Engaged Not Engaged
48
bull bull bull bull
Disability Data (Extended Breakdown) Arizona Post-Secondary Outcomes by Disability Type (Extended)
Autism (455)
Emotional Disability (466)
Emotional Disability (separate facility private school) (116)
Hearing Impairment (57)
Mild Intellectual Disability (316)
Moderate Intellectual Disability (128)
Multiple Disabilities (102)
Multiple Disabilities - Severe Sensory Impairment (28)
Orthopedic Impairment (37)
Other Health Impairment (653)
Severe Intellectual Disability (26)
Specific Learning Disability (3837)
SpeechLanguage Impairment (52)
Traumatic Brain Injury (33)
Visual Impairment (26)
303
131
149
401
152
73
33
41
86 276 78 86
316 298 105 53
79
23
216
36
241
94
137
36
149
273
147
286
85
70
78
71
378
299
27
400
162
44
27
51
38 346 115
229
538
461
346
60
38
58
364
423
182
192
152
77
61
77
Enrolled In Higher Education Competitive Employment Enrolled In Other Postsecondary Education Or Training Some Other Employment
49
Pride
Self-Advocate o o gt i-i--o o
0
0
0
00 C 0
0
PATH TO DISABILITY
PRIDE
New Insights for Building Disability Pride and Empowering Students with Hidden Disabilities
0 0
0 0
0
0 0
0
PATH OF DISABILITY
SHAME 0
Disability Shame
Positive Student Outcomes
50
Resources
bull Review the student list to see if students can be excluded from having the PSO Survey administered (ie re-enrolled)
bull Grandparentsfriends are great resources
bull Update contact list as much as possible
bull Any parentstudent meeting (ie IEP progress parent conferences)
bull Some districts have used social media to contact hard to reach youth
bull Consider teachertransition specialist stipends
bull Make contact with families as often as possible
bull Email-to-text message
bull Strategies for Increasing Response Rates
bull Strategies for Contacting Hard-to-Find Youth
51
Resources
bull Arizona Department of Education (Search PSO Transitions ECAP AZCIS Arizona Community of Practice on Transition-AZCoPT)
bull Secondary Transition
bull ECAP-Education and Career Action Plan
bull AZCIS-Arizona Career Information System
bull AZCoPT-Arizona Community of Practice On Transition
bull NTACT-National Technical Assistance on Transition
bull Career One Stop (Your Source for Career Exploration)
bull My Futurecom (Figure out whatrsquos next)
52
June through September 2017 Survey Participants
bull 276 PEAs (districts and charter schools) WILL BE included in the reported data
bull Per SAIS the total number of exiters (youth who graduated aged out or dropped out) who ARE eligible to take the PSO Survey = 9701
53
ldquoUnengagedrdquo Characteristics
bull Of the 1584 individuals counted in the non-engaged category 1183 did not attempt any post secondary educationtraining or employment
bull However 401 respondents (25) indicated that they attempted post secondary educationtraining or employment but did not meet the criteria to be counted in an engagement category
bull If those 401 youth who attempted engagement had been successful engagement rate would have increased from 75 to 81
54
PSO Assistance
Contact Information bull Jay Johnson
bull JayJohnsonazedgov
bull PSO E-mail bull PSOInboxazedgov
55

bull
Measurements A B amp C Arizona IDEA Part B SPPAPR Indicator 14 Post-School
Outcomes for School Year Exiters
Measurement A Higher Education
Measurement B Higher Education amp
Competitive Employment
Measurement C Higher Education
Competitive Employment amp
Some Other Education Training or Employment
Not Engaged
Flagstaff Unified 24 78 87 13 Districts Greater than 100 Eligible 25 62 76 24
24
78
87
13
25
62
76
24
0
20
40
60
80
100
18
J
bull bull
Engagement Rates Flagstaff Unified Engagement Rates 109 Districts Greater than 100 Eligible
responded for a 916 response rate Engagement Rates 3658 responded for a Not 74 response rate
Engaged Not Enrolled In Enrolled In Engaged 128 Higher Higher
244 Education Education Other 239 254 Employ Other 37
Employ 53
Other Post Other Post Education Education
Or Training Competitive Or Training Competitive 55 Employ 80 Employ
541 369
541 369
244 239 254 128 55 80 37 53
Enrolled In Higher Education
Competitive Employment Enrolled In Other Postsecondary Education
Or Training
Some Other Employment Not Engaged
Flagstaff Unified Districts Greater than 100 Eligible
19
bull bull bull bull
Exit Data Flagstaff Unified Respondents Post-Secondary Outcomes by Exit Type
100
80
60
40
20
0 Aged Out (0) Dropout (21) Graduated (88) Unknown (0)
Not Engaged 00 238 102 00 Some Other Employment 00 95 23 00 Enrolled In Other Postsecondary
Education Or Training 00 95 45 00
Competitive Employment 00 571 534 00 Enrolled In Higher Education 00 00 295 00
20
bull bull bull bull
Exit Data Districts Greater than 100 Eligible Respondents Post-Secondary Outcomes by Exit
Type 100
80
60
40
20
0 Aged Out (0) Dropout (443) Graduated (3215) Unknown (0)
Not Engaged 00 515 207 00 Some Other Employment 00 61 52 00 Enrolled In Other Postsecondary
Education Or Training 00 79 80 00
Competitive Employment 00 316 376 00 Enrolled In Higher Education 00 29 285 00
21
bull bull bull bull
Gender Data Flagstaff Unified Respondents Post-Secondary Outcomes by Gender
Female (41) Male (68) Not Engaged 98 147 Some Other Employment 73 15 Enrolled In Other Postsecondary
Education Or Training 98 29
Competitive Employment 390 632 Enrolled In Higher Education 341 176
0
20
40
60
80
100
22
bull bull bull bull
Gender Data Districts Greater than 100 Eligible Respondents Post-Secondary Outcomes by
Gender 100
80
60
40
20
0 Female (1287) Male (2371)
Not Engaged 256 237 Some Other Employment 54 53 Enrolled In Other Postsecondary
Education Or Training 87 76
Competitive Employment 324 394 Enrolled In Higher Education 279 240
23
Figure 11 Types of accommodations and supports received from postsecondary schools by young adu lts with disabil it ies who had ever enrolled in a postsecondary school and had received these types of assistance
Additional time for tests
Technology
Tutor
Leamingbehavior management support
Additional time for modified assignments
Different test setting
Readerinterpreter in-class aide
Note taker
Written materials
Physical adaptations to classroom
Other testing accommodations
Large printbooks on tape Bra ille mater ials
Social work services
Case management
Independent living supports
Early registration
Other accommodations or supports
0
792 (8 17)
20 40 60 80
Percent of students who received accommodations and supports
100
2011 National Longitudinal Transition Study
2011 National Longitudinal Transition Study 24
Action Planning
bull Spring 2017 to Spring 2018 Planning bull Connecting and Events
bull Connecting students to Earn to Learn and Money Smart bull ldquoCollege Signing Dayrdquo
ndash Connects students to school community and self-disclosure
bull Connecting students to Earn to Learn and Money Smart
bull Training on college accommodations and used Think College Resource Library Transition Team Checklist in all high school IEPs
bull Using Infographic Transition to College What Changes after High School during ParentStudent Meetings
25
bull
Measurements A B amp C Arizona IDEA Part B SPPAPR Indicator 14 Post-School
Outcomes for School Year Exiters
Measurement A Higher Education
Measurement B Higher Education amp
Competitive Employment
Measurement C Higher Education
Competitive Employment amp
Some Other Education Training or Employment
Not Engaged
Flagstaff Unified TSW 23 77 81 19 Flagstaff Unified No TSW 24 79 92 8
23
77 81
19 24
79
92
8
0
20
40
60
80
100
26
bull bull
Engagement Rates Flagstaff Unified TSW Engagement Rates 47 responded for a 959 response rate
Enrolled In Higher Not
Education Engaged 234 191
Some Other Employmen
t 21
Enrolled In Other
Postsecond ary
Education Competitive Or Training Employmen
t 532 21
532 548
234 242 21
Flagstaff Unified No TSW Engagement Rates 62 responded for a 886 response
rate Not Enrolled In
Engaged Higher 81 Education
242 Some Other Employmen
t 48
Enrolled In Other
Postsecond ary Competitive
Education Employmen Or Training t 548
81
191 81 48 81 21
Enrolled In Higher Education
Competitive Employment Enrolled In Other Postsecondary Education
Or Training
Some Other Employment Not Engaged
Flagstaff Unified TSW Flagstaff Unified No TSW
27
bull bull bull bull
Disability Data Flagstaff Unified TSW Respondents Post-Secondary Outcomes by Disability Type
100
80
60
40
20
0 All Other
Disabilities (8) Emotional
Disturbance (12) Intellectual
Disability (2) Specific Learning
Disability (25) Not Engaged 125 167 00 240 Some Other Employment 00 83 00 00 Enrolled In Other Postsecondary
Education Or Training 00 00 00 40
Competitive Employment 750 500 500 480 Enrolled In Higher Education 125 250 500 240
28
bull bull bull bull
Disability Data Flagstaff Unified No TSW Respondents Post-Secondary Outcomes by Disability
Type 100
80
60
40
20
0 All Other
Disabilities (3) Emotional
Disturbance (8) Intellectual
Disability (2) Specific Learning
Disability (49) Not Engaged 00 125 1000 41 Some Other Employment 00 00 00 61 Enrolled In Other Postsecondary
Education Or Training 00 250 00 61
Competitive Employment 667 625 00 551 Enrolled In Higher Education 333 00 00 286
29
bull bull bull bull
Ethnicity Data Flagstaff Unified TSW Respondents Post-Secondary Outcomes by Ethnicity
100
80
60
40
20
0
American Indian or Alaskan
Native (19)
Asian (1)
Black or African
American (3)
Hispanic or Latino
(9)
Multi-racial (0)
Native Hawaiian or Other Pacific
Islander (0)
White (15)
Not Engaged 158 00 333 111 00 00 267 Some Other Employment 53 00 00 00 00 00 00 Enrolled In Other Postsecondary
Education Or Training 00 00 00 111 00 00 00
Competitive Employment 526 1000 667 778 00 00 333 Enrolled In Higher Education 263 00 00 00 00 00 400
30
bull bull bull bull
Ethnicity Data Flagstaff Unified No TSW Respondents Post-Secondary Outcomes by Ethnicity
100
80
60
40
20
0
American Indian or Alaskan
Native (11)
Asian (0)
Black or African
American (3)
Hispanic or Latino
(24)
Multi-racial (1)
Native Hawaiian or Other Pacific
Islander (0)
White (23)
Not Engaged 00 00 00 83 00 00 130 Some Other Employment 91 00 333 00 00 00 43 Enrolled In Other Postsecondary
Education Or Training 00 00 00 167 00 00 43
Competitive Employment 636 00 667 583 00 00 478 Enrolled In Higher Education 273 00 00 167 1000 00 304
31
bull bull bull bull
Gender Data Flagstaff Unified TSW Respondents Post-Secondary Outcomes by Gender
Female (17) Male (30) Not Engaged 235 167 Some Other Employment 59 00 Enrolled In Other Postsecondary
Education Or Training 59 00
Competitive Employment 294 667 Enrolled In Higher Education 353 167
0
20
40
60
80
100
32
bull bull bull bull
Gender Data Flagstaff Unified No TSW Respondents Post-Secondary Outcomes by Gender
Female (24) Male (38) Not Engaged 00 132 Some Other Employment 83 26 Enrolled In Other Postsecondary
Education Or Training 125 53
Competitive Employment 458 605 Enrolled In Higher Education 333 184
0
20
40
60
80
100
33
bull bull bull bull
Exit Data Flagstaff Unified TSW Respondents Post-Secondary Outcomes by Exit Type
100
80
60
40
20
0 Aged Out (0) Dropout (7) Graduated (40) Unknown (0)
Not Engaged 00 286 175 00 Some Other Employment 00 00 25 00 Enrolled In Other Postsecondary
Education Or Training 00 00 25 00
Competitive Employment 00 714 500 00 Enrolled In Higher Education 00 00 275 00
34
bull bull bull bull
Exit Data Flagstaff Unified No TSW Respondents Post-Secondary Outcomes by Exit Type
100
80
60
40
20
0 Aged Out (0) Dropout (14) Graduated (48) Unknown (0)
Not Engaged 00 214 42 00 Some Other Employment 00 143 21 00 Enrolled In Other Postsecondary
Education Or Training 00 143 63 00
Competitive Employment 00 500 563 00 Enrolled In Higher Education 00 00 313 00
35
Reviewing Data
bull Reviewing Data bull TSW Students v Non TSW Students
bull Autism 100 (Non-No Students) bull Emotional Disability 857 (Non-80) bull Emotional Disability (Private Day) 80 (Non-100) bull Mild Intellectual Disability 100 (Non-0) bull Multiple Disabilities 0 (Non-No Students) bull Other Health Impairment 100 (Non-100) bull Specific Learning Disabilities 76 (Non 95) bull Traumatic Brain Injury 100 (Non-No Students)
36
bull bull
Disability Data (Extended Breakdown) Flagstaff Unified TSW Respondents Post-Secondary Outcomes by
Disability Type Engaged vs Not Engaged (Extended)
Autism (1)
Emotional Disability (7)
Emotional Disability (separate facility private school) (5)
Hearing Impairment (0)
Mild Intellectual Disability (2)
Moderate Intellectual Disability (0)
Multiple Disabilities (1)
Multiple Disabilities - Severe Sensory Impairment (0)
Orthopedic Impairment (0)
Other Health Impairment (3)
Severe Intellectual Disability (0)
Specific Learning Disability (25)
SpeechLanguage Impairment (0)
Traumatic Brain Injury (3)
Visual Impairment (0)
1000
857
800
143
200
1000
1000
1000
760 240
1000
Engaged Not Engaged
37
bull bull
Disability Data (Extended Breakdown) Flagstaff Unified No TSW Respondents Post-Secondary Outcomes
by Disability Type Engaged vs Not Engaged (Extended)
Autism (0)
Emotional Disability (5)
Emotional Disability (separate facility private school) (3)
Hearing Impairment (0)
Mild Intellectual Disability (2)
Moderate Intellectual Disability (0)
Multiple Disabilities (0)
Multiple Disabilities - Severe Sensory Impairment (0)
Orthopedic Impairment (0)
Other Health Impairment (3)
Severe Intellectual Disability (0)
Specific Learning Disability (49)
SpeechLanguage Impairment (0)
Traumatic Brain Injury (0)
Visual Impairment (0)
800 200
1000
1000
1000
959 41
Engaged Not Engaged
38
bull bull bull bull
Disability Data (Extended Breakdown) Flagstaff Unified TSW Respondents Post-Secondary Outcomes by
Disability Type (Extended)
Autism (1)
Emotional Disability (7)
Emotional Disability (separate facility private school) (5)
Hearing Impairment (0)
Mild Intellectual Disability (2)
Moderate Intellectual Disability (0)
Multiple Disabilities (1)
Multiple Disabilities - Severe Sensory Impairment (0)
Orthopedic Impairment (0)
Other Health Impairment (3)
Severe Intellectual Disability (0)
Specific Learning Disability (25)
SpeechLanguage Impairment (0)
Traumatic Brain Injury (3)
Visual Impairment (0)
1000
429
500
429
600
500
200
1000
240
333
480
667
40
Enrolled In Higher Education Competitive Employment Enrolled In Other Postsecondary Education Or Training Some Other Employment
39
bull bull bull bull
Disability Data (Extended Breakdown) Flagstaff Unified No TSW Respondents Post-Secondary Outcomes
by Disability Type (Extended)
Autism (0)
Emotional Disability (5)
Emotional Disability (separate facility private school) (3)
Hearing Impairment (0)
Mild Intellectual Disability (2)
Moderate Intellectual Disability (0)
Multiple Disabilities (0)
Multiple Disabilities - Severe Sensory Impairment (0)
Orthopedic Impairment (0)
Other Health Impairment (3)
Severe Intellectual Disability (0)
Specific Learning Disability (49)
SpeechLanguage Impairment (0)
Traumatic Brain Injury (0)
Visual Impairment (0)
600
667
200
333
333 667
286 551 61 61
Enrolled In Higher Education Competitive Employment Enrolled In Other Postsecondary Education Or Training Some Other Employment
40
bull bull
National Longitudinal Transition Study (NLTS2) - 2012
N=305000 Students
Graduation Post-Secondary Paying Job AT 100 81 80 No AT 80 40 51
100
81 8080
40
51
0
20
40
60
80
100
120
National Longitudinal Transition Study 41
Reviewing Data
bull Local AT Data and National Longitudinal Transition Study bull 2012 National Longitudinal Transition Study
bull 809 Students with AT attended higher Ed bull 401 Students who did not receive AT Higher Ed bull 78 of students with high-incidence disabilities reported
receiving AT in high school
bull 2014-2015 AT Loan Library Data bull 144 High School Requests bull Coconino County 19 of all AT Loan Library Requests bull Higher Education in Coconino County 30 bull Higher Education in Arizona 22
42
Local Example bull Spring 2017 to Spring 2018 Planning
bull PSO Data and Not Engaged Students bull Training Staff
bull Training staff to use AT (Assistive Technology) and create AT Implementation Plan
bull Used ldquoA Student Handbook for Choosing and Using ATrdquo bull Providing self-advocacy skills and sense of pride bull Use AT Loan Library and AzTAP Loan Library bull New Apps Clips or CADET for Captioning for all Students
bull Connected High School CTE (Career and Technical Education) Program with College Level CTE Program bull Connecting to Community and self-disclosure
bull Connected Counseling Department and Transition Department (Connecting Community)
43
Inform and align
Multiple-Measure Accountablllty bull Multiple measures
of CCR bull Continuum of
readiness indicators bull Usable data
Well-Rounded Education bull Enriched accelerated
curricula and educational experiences
bull Improved conditions for learning
t State CCR Definition
bull Academic readiness
bull Nonacademic readiness
Inform and allgn
Purposeful Assessment bull Balanced assessment
systems bull Design and delivery for
meaningful results bull Measuring nonacademic
readiness
How PSO Can Improve Programming
College amp Career Readiness and Success Center 44
bull bull
Disability Data (Extended Breakdown) Flagstaff Unified Respondents Post-Secondary Outcomes by
Disability Type Engaged vs Not Engaged (Extended)
Autism (1)
Emotional Disability (12)
Emotional Disability (separate facility private school) (8)
Hearing Impairment (0)
Mild Intellectual Disability (4)
Moderate Intellectual Disability (0)
Multiple Disabilities (1)
Multiple Disabilities - Severe Sensory Impairment (0)
Orthopedic Impairment (0)
Other Health Impairment (6)
Severe Intellectual Disability (0)
Specific Learning Disability (74)
SpeechLanguage Impairment (0)
Traumatic Brain Injury (3)
Visual Impairment (0)
1000
833
875
500
167
125
500
1000
1000
892 108
1000
Engaged Not Engaged
45
bull bull bull bull
Disability Data (Extended Breakdown) Flagstaff Unified Respondents Post-Secondary Outcomes by
Disability Type (Extended)
Autism (1)
Emotional Disability (12)
Emotional Disability (separate facility private school) (8)
Hearing Impairment (0)
Mild Intellectual Disability (4)
Moderate Intellectual Disability (0)
Multiple Disabilities (1)
Multiple Disabilities - Severe Sensory Impairment (0)
Orthopedic Impairment (0)
Other Health Impairment (6)
Severe Intellectual Disability (0)
Specific Learning Disability (74)
SpeechLanguage Impairment (0)
Traumatic Brain Injury (3)
Visual Impairment (0)
1000
250 500
625
83
125 125
250 250
167 833
270 527 54 41
333 667
Enrolled In Higher Education Competitive Employment Enrolled In Other Postsecondary Education Or Training Some Other Employment
46
Post-School (PSO) Outcomes for School Year Exiters 2014-2015
Tips about Student Engagement You Need To Know
Southern District Perspective
State of Arizona 2016 PSO Survey
Jay Johnson Education Program Specialist
PSO Initiatives
Disability Data (Extended Breakdown) Arizona Post-Secondary Outcomes by Disability Type
Engaged vs Not Engaged (Extended)
Autism (455)
Emotional Disability (466)
Emotional Disability (separate facility private school) (116)
Hearing Impairment (57)
Mild Intellectual Disability (316)
Moderate Intellectual Disability (128)
Multiple Disabilities (102)
Multiple Disabilities - Severe Sensory Impairment (28)
Orthopedic Impairment (37)
Other Health Impairment (653)
Severe Intellectual Disability (26)
Specific Learning Disability (3837)
SpeechLanguage Impairment (52)
Traumatic Brain Injury (33)
Visual Impairment (26)
637
646
526
772
554
461
578
429
595
363
354
474
228
446
539
422
571
405
793
500
808
923
758
769
207
500
192
77
242
231
Engaged Not Engaged
48
bull bull bull bull
Disability Data (Extended Breakdown) Arizona Post-Secondary Outcomes by Disability Type (Extended)
Autism (455)
Emotional Disability (466)
Emotional Disability (separate facility private school) (116)
Hearing Impairment (57)
Mild Intellectual Disability (316)
Moderate Intellectual Disability (128)
Multiple Disabilities (102)
Multiple Disabilities - Severe Sensory Impairment (28)
Orthopedic Impairment (37)
Other Health Impairment (653)
Severe Intellectual Disability (26)
Specific Learning Disability (3837)
SpeechLanguage Impairment (52)
Traumatic Brain Injury (33)
Visual Impairment (26)
303
131
149
401
152
73
33
41
86 276 78 86
316 298 105 53
79
23
216
36
241
94
137
36
149
273
147
286
85
70
78
71
378
299
27
400
162
44
27
51
38 346 115
229
538
461
346
60
38
58
364
423
182
192
152
77
61
77
Enrolled In Higher Education Competitive Employment Enrolled In Other Postsecondary Education Or Training Some Other Employment
49
Pride
Self-Advocate o o gt i-i--o o
0
0
0
00 C 0
0
PATH TO DISABILITY
PRIDE
New Insights for Building Disability Pride and Empowering Students with Hidden Disabilities
0 0
0 0
0
0 0
0
PATH OF DISABILITY
SHAME 0
Disability Shame
Positive Student Outcomes
50
Resources
bull Review the student list to see if students can be excluded from having the PSO Survey administered (ie re-enrolled)
bull Grandparentsfriends are great resources
bull Update contact list as much as possible
bull Any parentstudent meeting (ie IEP progress parent conferences)
bull Some districts have used social media to contact hard to reach youth
bull Consider teachertransition specialist stipends
bull Make contact with families as often as possible
bull Email-to-text message
bull Strategies for Increasing Response Rates
bull Strategies for Contacting Hard-to-Find Youth
51
Resources
bull Arizona Department of Education (Search PSO Transitions ECAP AZCIS Arizona Community of Practice on Transition-AZCoPT)
bull Secondary Transition
bull ECAP-Education and Career Action Plan
bull AZCIS-Arizona Career Information System
bull AZCoPT-Arizona Community of Practice On Transition
bull NTACT-National Technical Assistance on Transition
bull Career One Stop (Your Source for Career Exploration)
bull My Futurecom (Figure out whatrsquos next)
52
June through September 2017 Survey Participants
bull 276 PEAs (districts and charter schools) WILL BE included in the reported data
bull Per SAIS the total number of exiters (youth who graduated aged out or dropped out) who ARE eligible to take the PSO Survey = 9701
53
ldquoUnengagedrdquo Characteristics
bull Of the 1584 individuals counted in the non-engaged category 1183 did not attempt any post secondary educationtraining or employment
bull However 401 respondents (25) indicated that they attempted post secondary educationtraining or employment but did not meet the criteria to be counted in an engagement category
bull If those 401 youth who attempted engagement had been successful engagement rate would have increased from 75 to 81
54
PSO Assistance
Contact Information bull Jay Johnson
bull JayJohnsonazedgov
bull PSO E-mail bull PSOInboxazedgov
55

bull bull bull bull
Exit Data Districts Greater than 100 Eligible Respondents Post-Secondary Outcomes by Exit
Type 100
80
60
40
20
0 Aged Out (0) Dropout (443) Graduated (3215) Unknown (0)
Not Engaged 00 515 207 00 Some Other Employment 00 61 52 00 Enrolled In Other Postsecondary
Education Or Training 00 79 80 00
Competitive Employment 00 316 376 00 Enrolled In Higher Education 00 29 285 00
21
bull bull bull bull
Gender Data Flagstaff Unified Respondents Post-Secondary Outcomes by Gender
Female (41) Male (68) Not Engaged 98 147 Some Other Employment 73 15 Enrolled In Other Postsecondary
Education Or Training 98 29
Competitive Employment 390 632 Enrolled In Higher Education 341 176
0
20
40
60
80
100
22
bull bull bull bull
Gender Data Districts Greater than 100 Eligible Respondents Post-Secondary Outcomes by
Gender 100
80
60
40
20
0 Female (1287) Male (2371)
Not Engaged 256 237 Some Other Employment 54 53 Enrolled In Other Postsecondary
Education Or Training 87 76
Competitive Employment 324 394 Enrolled In Higher Education 279 240
23
Figure 11 Types of accommodations and supports received from postsecondary schools by young adu lts with disabil it ies who had ever enrolled in a postsecondary school and had received these types of assistance
Additional time for tests
Technology
Tutor
Leamingbehavior management support
Additional time for modified assignments
Different test setting
Readerinterpreter in-class aide
Note taker
Written materials
Physical adaptations to classroom
Other testing accommodations
Large printbooks on tape Bra ille mater ials
Social work services
Case management
Independent living supports
Early registration
Other accommodations or supports
0
792 (8 17)
20 40 60 80
Percent of students who received accommodations and supports
100
2011 National Longitudinal Transition Study
2011 National Longitudinal Transition Study 24
Action Planning
bull Spring 2017 to Spring 2018 Planning bull Connecting and Events
bull Connecting students to Earn to Learn and Money Smart bull ldquoCollege Signing Dayrdquo
ndash Connects students to school community and self-disclosure
bull Connecting students to Earn to Learn and Money Smart
bull Training on college accommodations and used Think College Resource Library Transition Team Checklist in all high school IEPs
bull Using Infographic Transition to College What Changes after High School during ParentStudent Meetings
25
bull
Measurements A B amp C Arizona IDEA Part B SPPAPR Indicator 14 Post-School
Outcomes for School Year Exiters
Measurement A Higher Education
Measurement B Higher Education amp
Competitive Employment
Measurement C Higher Education
Competitive Employment amp
Some Other Education Training or Employment
Not Engaged
Flagstaff Unified TSW 23 77 81 19 Flagstaff Unified No TSW 24 79 92 8
23
77 81
19 24
79
92
8
0
20
40
60
80
100
26
bull bull
Engagement Rates Flagstaff Unified TSW Engagement Rates 47 responded for a 959 response rate
Enrolled In Higher Not
Education Engaged 234 191
Some Other Employmen
t 21
Enrolled In Other
Postsecond ary
Education Competitive Or Training Employmen
t 532 21
532 548
234 242 21
Flagstaff Unified No TSW Engagement Rates 62 responded for a 886 response
rate Not Enrolled In
Engaged Higher 81 Education
242 Some Other Employmen
t 48
Enrolled In Other
Postsecond ary Competitive
Education Employmen Or Training t 548
81
191 81 48 81 21
Enrolled In Higher Education
Competitive Employment Enrolled In Other Postsecondary Education
Or Training
Some Other Employment Not Engaged
Flagstaff Unified TSW Flagstaff Unified No TSW
27
bull bull bull bull
Disability Data Flagstaff Unified TSW Respondents Post-Secondary Outcomes by Disability Type
100
80
60
40
20
0 All Other
Disabilities (8) Emotional
Disturbance (12) Intellectual
Disability (2) Specific Learning
Disability (25) Not Engaged 125 167 00 240 Some Other Employment 00 83 00 00 Enrolled In Other Postsecondary
Education Or Training 00 00 00 40
Competitive Employment 750 500 500 480 Enrolled In Higher Education 125 250 500 240
28
bull bull bull bull
Disability Data Flagstaff Unified No TSW Respondents Post-Secondary Outcomes by Disability
Type 100
80
60
40
20
0 All Other
Disabilities (3) Emotional
Disturbance (8) Intellectual
Disability (2) Specific Learning
Disability (49) Not Engaged 00 125 1000 41 Some Other Employment 00 00 00 61 Enrolled In Other Postsecondary
Education Or Training 00 250 00 61
Competitive Employment 667 625 00 551 Enrolled In Higher Education 333 00 00 286
29
bull bull bull bull
Ethnicity Data Flagstaff Unified TSW Respondents Post-Secondary Outcomes by Ethnicity
100
80
60
40
20
0
American Indian or Alaskan
Native (19)
Asian (1)
Black or African
American (3)
Hispanic or Latino
(9)
Multi-racial (0)
Native Hawaiian or Other Pacific
Islander (0)
White (15)
Not Engaged 158 00 333 111 00 00 267 Some Other Employment 53 00 00 00 00 00 00 Enrolled In Other Postsecondary
Education Or Training 00 00 00 111 00 00 00
Competitive Employment 526 1000 667 778 00 00 333 Enrolled In Higher Education 263 00 00 00 00 00 400
30
bull bull bull bull
Ethnicity Data Flagstaff Unified No TSW Respondents Post-Secondary Outcomes by Ethnicity
100
80
60
40
20
0
American Indian or Alaskan
Native (11)
Asian (0)
Black or African
American (3)
Hispanic or Latino
(24)
Multi-racial (1)
Native Hawaiian or Other Pacific
Islander (0)
White (23)
Not Engaged 00 00 00 83 00 00 130 Some Other Employment 91 00 333 00 00 00 43 Enrolled In Other Postsecondary
Education Or Training 00 00 00 167 00 00 43
Competitive Employment 636 00 667 583 00 00 478 Enrolled In Higher Education 273 00 00 167 1000 00 304
31
bull bull bull bull
Gender Data Flagstaff Unified TSW Respondents Post-Secondary Outcomes by Gender
Female (17) Male (30) Not Engaged 235 167 Some Other Employment 59 00 Enrolled In Other Postsecondary
Education Or Training 59 00
Competitive Employment 294 667 Enrolled In Higher Education 353 167
0
20
40
60
80
100
32
bull bull bull bull
Gender Data Flagstaff Unified No TSW Respondents Post-Secondary Outcomes by Gender
Female (24) Male (38) Not Engaged 00 132 Some Other Employment 83 26 Enrolled In Other Postsecondary
Education Or Training 125 53
Competitive Employment 458 605 Enrolled In Higher Education 333 184
0
20
40
60
80
100
33
bull bull bull bull
Exit Data Flagstaff Unified TSW Respondents Post-Secondary Outcomes by Exit Type
100
80
60
40
20
0 Aged Out (0) Dropout (7) Graduated (40) Unknown (0)
Not Engaged 00 286 175 00 Some Other Employment 00 00 25 00 Enrolled In Other Postsecondary
Education Or Training 00 00 25 00
Competitive Employment 00 714 500 00 Enrolled In Higher Education 00 00 275 00
34
bull bull bull bull
Exit Data Flagstaff Unified No TSW Respondents Post-Secondary Outcomes by Exit Type
100
80
60
40
20
0 Aged Out (0) Dropout (14) Graduated (48) Unknown (0)
Not Engaged 00 214 42 00 Some Other Employment 00 143 21 00 Enrolled In Other Postsecondary
Education Or Training 00 143 63 00
Competitive Employment 00 500 563 00 Enrolled In Higher Education 00 00 313 00
35
Reviewing Data
bull Reviewing Data bull TSW Students v Non TSW Students
bull Autism 100 (Non-No Students) bull Emotional Disability 857 (Non-80) bull Emotional Disability (Private Day) 80 (Non-100) bull Mild Intellectual Disability 100 (Non-0) bull Multiple Disabilities 0 (Non-No Students) bull Other Health Impairment 100 (Non-100) bull Specific Learning Disabilities 76 (Non 95) bull Traumatic Brain Injury 100 (Non-No Students)
36
bull bull
Disability Data (Extended Breakdown) Flagstaff Unified TSW Respondents Post-Secondary Outcomes by
Disability Type Engaged vs Not Engaged (Extended)
Autism (1)
Emotional Disability (7)
Emotional Disability (separate facility private school) (5)
Hearing Impairment (0)
Mild Intellectual Disability (2)
Moderate Intellectual Disability (0)
Multiple Disabilities (1)
Multiple Disabilities - Severe Sensory Impairment (0)
Orthopedic Impairment (0)
Other Health Impairment (3)
Severe Intellectual Disability (0)
Specific Learning Disability (25)
SpeechLanguage Impairment (0)
Traumatic Brain Injury (3)
Visual Impairment (0)
1000
857
800
143
200
1000
1000
1000
760 240
1000
Engaged Not Engaged
37
bull bull
Disability Data (Extended Breakdown) Flagstaff Unified No TSW Respondents Post-Secondary Outcomes
by Disability Type Engaged vs Not Engaged (Extended)
Autism (0)
Emotional Disability (5)
Emotional Disability (separate facility private school) (3)
Hearing Impairment (0)
Mild Intellectual Disability (2)
Moderate Intellectual Disability (0)
Multiple Disabilities (0)
Multiple Disabilities - Severe Sensory Impairment (0)
Orthopedic Impairment (0)
Other Health Impairment (3)
Severe Intellectual Disability (0)
Specific Learning Disability (49)
SpeechLanguage Impairment (0)
Traumatic Brain Injury (0)
Visual Impairment (0)
800 200
1000
1000
1000
959 41
Engaged Not Engaged
38
bull bull bull bull
Disability Data (Extended Breakdown) Flagstaff Unified TSW Respondents Post-Secondary Outcomes by
Disability Type (Extended)
Autism (1)
Emotional Disability (7)
Emotional Disability (separate facility private school) (5)
Hearing Impairment (0)
Mild Intellectual Disability (2)
Moderate Intellectual Disability (0)
Multiple Disabilities (1)
Multiple Disabilities - Severe Sensory Impairment (0)
Orthopedic Impairment (0)
Other Health Impairment (3)
Severe Intellectual Disability (0)
Specific Learning Disability (25)
SpeechLanguage Impairment (0)
Traumatic Brain Injury (3)
Visual Impairment (0)
1000
429
500
429
600
500
200
1000
240
333
480
667
40
Enrolled In Higher Education Competitive Employment Enrolled In Other Postsecondary Education Or Training Some Other Employment
39
bull bull bull bull
Disability Data (Extended Breakdown) Flagstaff Unified No TSW Respondents Post-Secondary Outcomes
by Disability Type (Extended)
Autism (0)
Emotional Disability (5)
Emotional Disability (separate facility private school) (3)
Hearing Impairment (0)
Mild Intellectual Disability (2)
Moderate Intellectual Disability (0)
Multiple Disabilities (0)
Multiple Disabilities - Severe Sensory Impairment (0)
Orthopedic Impairment (0)
Other Health Impairment (3)
Severe Intellectual Disability (0)
Specific Learning Disability (49)
SpeechLanguage Impairment (0)
Traumatic Brain Injury (0)
Visual Impairment (0)
600
667
200
333
333 667
286 551 61 61
Enrolled In Higher Education Competitive Employment Enrolled In Other Postsecondary Education Or Training Some Other Employment
40
bull bull
National Longitudinal Transition Study (NLTS2) - 2012
N=305000 Students
Graduation Post-Secondary Paying Job AT 100 81 80 No AT 80 40 51
100
81 8080
40
51
0
20
40
60
80
100
120
National Longitudinal Transition Study 41
Reviewing Data
bull Local AT Data and National Longitudinal Transition Study bull 2012 National Longitudinal Transition Study
bull 809 Students with AT attended higher Ed bull 401 Students who did not receive AT Higher Ed bull 78 of students with high-incidence disabilities reported
receiving AT in high school
bull 2014-2015 AT Loan Library Data bull 144 High School Requests bull Coconino County 19 of all AT Loan Library Requests bull Higher Education in Coconino County 30 bull Higher Education in Arizona 22
42
Local Example bull Spring 2017 to Spring 2018 Planning
bull PSO Data and Not Engaged Students bull Training Staff
bull Training staff to use AT (Assistive Technology) and create AT Implementation Plan
bull Used ldquoA Student Handbook for Choosing and Using ATrdquo bull Providing self-advocacy skills and sense of pride bull Use AT Loan Library and AzTAP Loan Library bull New Apps Clips or CADET for Captioning for all Students
bull Connected High School CTE (Career and Technical Education) Program with College Level CTE Program bull Connecting to Community and self-disclosure
bull Connected Counseling Department and Transition Department (Connecting Community)
43
Inform and align
Multiple-Measure Accountablllty bull Multiple measures
of CCR bull Continuum of
readiness indicators bull Usable data
Well-Rounded Education bull Enriched accelerated
curricula and educational experiences
bull Improved conditions for learning
t State CCR Definition
bull Academic readiness
bull Nonacademic readiness
Inform and allgn
Purposeful Assessment bull Balanced assessment
systems bull Design and delivery for
meaningful results bull Measuring nonacademic
readiness
How PSO Can Improve Programming
College amp Career Readiness and Success Center 44
bull bull
Disability Data (Extended Breakdown) Flagstaff Unified Respondents Post-Secondary Outcomes by
Disability Type Engaged vs Not Engaged (Extended)
Autism (1)
Emotional Disability (12)
Emotional Disability (separate facility private school) (8)
Hearing Impairment (0)
Mild Intellectual Disability (4)
Moderate Intellectual Disability (0)
Multiple Disabilities (1)
Multiple Disabilities - Severe Sensory Impairment (0)
Orthopedic Impairment (0)
Other Health Impairment (6)
Severe Intellectual Disability (0)
Specific Learning Disability (74)
SpeechLanguage Impairment (0)
Traumatic Brain Injury (3)
Visual Impairment (0)
1000
833
875
500
167
125
500
1000
1000
892 108
1000
Engaged Not Engaged
45
bull bull bull bull
Disability Data (Extended Breakdown) Flagstaff Unified Respondents Post-Secondary Outcomes by
Disability Type (Extended)
Autism (1)
Emotional Disability (12)
Emotional Disability (separate facility private school) (8)
Hearing Impairment (0)
Mild Intellectual Disability (4)
Moderate Intellectual Disability (0)
Multiple Disabilities (1)
Multiple Disabilities - Severe Sensory Impairment (0)
Orthopedic Impairment (0)
Other Health Impairment (6)
Severe Intellectual Disability (0)
Specific Learning Disability (74)
SpeechLanguage Impairment (0)
Traumatic Brain Injury (3)
Visual Impairment (0)
1000
250 500
625
83
125 125
250 250
167 833
270 527 54 41
333 667
Enrolled In Higher Education Competitive Employment Enrolled In Other Postsecondary Education Or Training Some Other Employment
46
Post-School (PSO) Outcomes for School Year Exiters 2014-2015
Tips about Student Engagement You Need To Know
Southern District Perspective
State of Arizona 2016 PSO Survey
Jay Johnson Education Program Specialist
PSO Initiatives
Disability Data (Extended Breakdown) Arizona Post-Secondary Outcomes by Disability Type
Engaged vs Not Engaged (Extended)
Autism (455)
Emotional Disability (466)
Emotional Disability (separate facility private school) (116)
Hearing Impairment (57)
Mild Intellectual Disability (316)
Moderate Intellectual Disability (128)
Multiple Disabilities (102)
Multiple Disabilities - Severe Sensory Impairment (28)
Orthopedic Impairment (37)
Other Health Impairment (653)
Severe Intellectual Disability (26)
Specific Learning Disability (3837)
SpeechLanguage Impairment (52)
Traumatic Brain Injury (33)
Visual Impairment (26)
637
646
526
772
554
461
578
429
595
363
354
474
228
446
539
422
571
405
793
500
808
923
758
769
207
500
192
77
242
231
Engaged Not Engaged
48
bull bull bull bull
Disability Data (Extended Breakdown) Arizona Post-Secondary Outcomes by Disability Type (Extended)
Autism (455)
Emotional Disability (466)
Emotional Disability (separate facility private school) (116)
Hearing Impairment (57)
Mild Intellectual Disability (316)
Moderate Intellectual Disability (128)
Multiple Disabilities (102)
Multiple Disabilities - Severe Sensory Impairment (28)
Orthopedic Impairment (37)
Other Health Impairment (653)
Severe Intellectual Disability (26)
Specific Learning Disability (3837)
SpeechLanguage Impairment (52)
Traumatic Brain Injury (33)
Visual Impairment (26)
303
131
149
401
152
73
33
41
86 276 78 86
316 298 105 53
79
23
216
36
241
94
137
36
149
273
147
286
85
70
78
71
378
299
27
400
162
44
27
51
38 346 115
229
538
461
346
60
38
58
364
423
182
192
152
77
61
77
Enrolled In Higher Education Competitive Employment Enrolled In Other Postsecondary Education Or Training Some Other Employment
49
Pride
Self-Advocate o o gt i-i--o o
0
0
0
00 C 0
0
PATH TO DISABILITY
PRIDE
New Insights for Building Disability Pride and Empowering Students with Hidden Disabilities
0 0
0 0
0
0 0
0
PATH OF DISABILITY
SHAME 0
Disability Shame
Positive Student Outcomes
50
Resources
bull Review the student list to see if students can be excluded from having the PSO Survey administered (ie re-enrolled)
bull Grandparentsfriends are great resources
bull Update contact list as much as possible
bull Any parentstudent meeting (ie IEP progress parent conferences)
bull Some districts have used social media to contact hard to reach youth
bull Consider teachertransition specialist stipends
bull Make contact with families as often as possible
bull Email-to-text message
bull Strategies for Increasing Response Rates
bull Strategies for Contacting Hard-to-Find Youth
51
Resources
bull Arizona Department of Education (Search PSO Transitions ECAP AZCIS Arizona Community of Practice on Transition-AZCoPT)
bull Secondary Transition
bull ECAP-Education and Career Action Plan
bull AZCIS-Arizona Career Information System
bull AZCoPT-Arizona Community of Practice On Transition
bull NTACT-National Technical Assistance on Transition
bull Career One Stop (Your Source for Career Exploration)
bull My Futurecom (Figure out whatrsquos next)
52
June through September 2017 Survey Participants
bull 276 PEAs (districts and charter schools) WILL BE included in the reported data
bull Per SAIS the total number of exiters (youth who graduated aged out or dropped out) who ARE eligible to take the PSO Survey = 9701
53
ldquoUnengagedrdquo Characteristics
bull Of the 1584 individuals counted in the non-engaged category 1183 did not attempt any post secondary educationtraining or employment
bull However 401 respondents (25) indicated that they attempted post secondary educationtraining or employment but did not meet the criteria to be counted in an engagement category
bull If those 401 youth who attempted engagement had been successful engagement rate would have increased from 75 to 81
54
PSO Assistance
Contact Information bull Jay Johnson
bull JayJohnsonazedgov
bull PSO E-mail bull PSOInboxazedgov
55
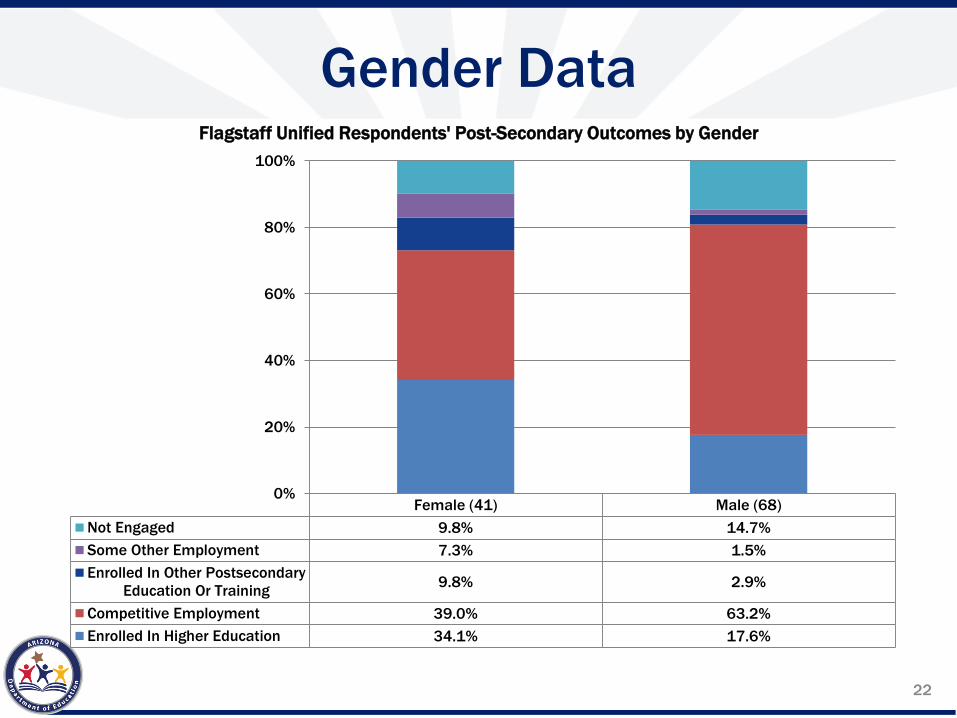
bull bull bull bull
Gender Data Flagstaff Unified Respondents Post-Secondary Outcomes by Gender
Female (41) Male (68) Not Engaged 98 147 Some Other Employment 73 15 Enrolled In Other Postsecondary
Education Or Training 98 29
Competitive Employment 390 632 Enrolled In Higher Education 341 176
0
20
40
60
80
100
22
bull bull bull bull
Gender Data Districts Greater than 100 Eligible Respondents Post-Secondary Outcomes by
Gender 100
80
60
40
20
0 Female (1287) Male (2371)
Not Engaged 256 237 Some Other Employment 54 53 Enrolled In Other Postsecondary
Education Or Training 87 76
Competitive Employment 324 394 Enrolled In Higher Education 279 240
23
Figure 11 Types of accommodations and supports received from postsecondary schools by young adu lts with disabil it ies who had ever enrolled in a postsecondary school and had received these types of assistance
Additional time for tests
Technology
Tutor
Leamingbehavior management support
Additional time for modified assignments
Different test setting
Readerinterpreter in-class aide
Note taker
Written materials
Physical adaptations to classroom
Other testing accommodations
Large printbooks on tape Bra ille mater ials
Social work services
Case management
Independent living supports
Early registration
Other accommodations or supports
0
792 (8 17)
20 40 60 80
Percent of students who received accommodations and supports
100
2011 National Longitudinal Transition Study
2011 National Longitudinal Transition Study 24
Action Planning
bull Spring 2017 to Spring 2018 Planning bull Connecting and Events
bull Connecting students to Earn to Learn and Money Smart bull ldquoCollege Signing Dayrdquo
ndash Connects students to school community and self-disclosure
bull Connecting students to Earn to Learn and Money Smart
bull Training on college accommodations and used Think College Resource Library Transition Team Checklist in all high school IEPs
bull Using Infographic Transition to College What Changes after High School during ParentStudent Meetings
25
bull
Measurements A B amp C Arizona IDEA Part B SPPAPR Indicator 14 Post-School
Outcomes for School Year Exiters
Measurement A Higher Education
Measurement B Higher Education amp
Competitive Employment
Measurement C Higher Education
Competitive Employment amp
Some Other Education Training or Employment
Not Engaged
Flagstaff Unified TSW 23 77 81 19 Flagstaff Unified No TSW 24 79 92 8
23
77 81
19 24
79
92
8
0
20
40
60
80
100
26
bull bull
Engagement Rates Flagstaff Unified TSW Engagement Rates 47 responded for a 959 response rate
Enrolled In Higher Not
Education Engaged 234 191
Some Other Employmen
t 21
Enrolled In Other
Postsecond ary
Education Competitive Or Training Employmen
t 532 21
532 548
234 242 21
Flagstaff Unified No TSW Engagement Rates 62 responded for a 886 response
rate Not Enrolled In
Engaged Higher 81 Education
242 Some Other Employmen
t 48
Enrolled In Other
Postsecond ary Competitive
Education Employmen Or Training t 548
81
191 81 48 81 21
Enrolled In Higher Education
Competitive Employment Enrolled In Other Postsecondary Education
Or Training
Some Other Employment Not Engaged
Flagstaff Unified TSW Flagstaff Unified No TSW
27
bull bull bull bull
Disability Data Flagstaff Unified TSW Respondents Post-Secondary Outcomes by Disability Type
100
80
60
40
20
0 All Other
Disabilities (8) Emotional
Disturbance (12) Intellectual
Disability (2) Specific Learning
Disability (25) Not Engaged 125 167 00 240 Some Other Employment 00 83 00 00 Enrolled In Other Postsecondary
Education Or Training 00 00 00 40
Competitive Employment 750 500 500 480 Enrolled In Higher Education 125 250 500 240
28
bull bull bull bull
Disability Data Flagstaff Unified No TSW Respondents Post-Secondary Outcomes by Disability
Type 100
80
60
40
20
0 All Other
Disabilities (3) Emotional
Disturbance (8) Intellectual
Disability (2) Specific Learning
Disability (49) Not Engaged 00 125 1000 41 Some Other Employment 00 00 00 61 Enrolled In Other Postsecondary
Education Or Training 00 250 00 61
Competitive Employment 667 625 00 551 Enrolled In Higher Education 333 00 00 286
29
bull bull bull bull
Ethnicity Data Flagstaff Unified TSW Respondents Post-Secondary Outcomes by Ethnicity
100
80
60
40
20
0
American Indian or Alaskan
Native (19)
Asian (1)
Black or African
American (3)
Hispanic or Latino
(9)
Multi-racial (0)
Native Hawaiian or Other Pacific
Islander (0)
White (15)
Not Engaged 158 00 333 111 00 00 267 Some Other Employment 53 00 00 00 00 00 00 Enrolled In Other Postsecondary
Education Or Training 00 00 00 111 00 00 00
Competitive Employment 526 1000 667 778 00 00 333 Enrolled In Higher Education 263 00 00 00 00 00 400
30
bull bull bull bull
Ethnicity Data Flagstaff Unified No TSW Respondents Post-Secondary Outcomes by Ethnicity
100
80
60
40
20
0
American Indian or Alaskan
Native (11)
Asian (0)
Black or African
American (3)
Hispanic or Latino
(24)
Multi-racial (1)
Native Hawaiian or Other Pacific
Islander (0)
White (23)
Not Engaged 00 00 00 83 00 00 130 Some Other Employment 91 00 333 00 00 00 43 Enrolled In Other Postsecondary
Education Or Training 00 00 00 167 00 00 43
Competitive Employment 636 00 667 583 00 00 478 Enrolled In Higher Education 273 00 00 167 1000 00 304
31
bull bull bull bull
Gender Data Flagstaff Unified TSW Respondents Post-Secondary Outcomes by Gender
Female (17) Male (30) Not Engaged 235 167 Some Other Employment 59 00 Enrolled In Other Postsecondary
Education Or Training 59 00
Competitive Employment 294 667 Enrolled In Higher Education 353 167
0
20
40
60
80
100
32
bull bull bull bull
Gender Data Flagstaff Unified No TSW Respondents Post-Secondary Outcomes by Gender
Female (24) Male (38) Not Engaged 00 132 Some Other Employment 83 26 Enrolled In Other Postsecondary
Education Or Training 125 53
Competitive Employment 458 605 Enrolled In Higher Education 333 184
0
20
40
60
80
100
33
bull bull bull bull
Exit Data Flagstaff Unified TSW Respondents Post-Secondary Outcomes by Exit Type
100
80
60
40
20
0 Aged Out (0) Dropout (7) Graduated (40) Unknown (0)
Not Engaged 00 286 175 00 Some Other Employment 00 00 25 00 Enrolled In Other Postsecondary
Education Or Training 00 00 25 00
Competitive Employment 00 714 500 00 Enrolled In Higher Education 00 00 275 00
34
bull bull bull bull
Exit Data Flagstaff Unified No TSW Respondents Post-Secondary Outcomes by Exit Type
100
80
60
40
20
0 Aged Out (0) Dropout (14) Graduated (48) Unknown (0)
Not Engaged 00 214 42 00 Some Other Employment 00 143 21 00 Enrolled In Other Postsecondary
Education Or Training 00 143 63 00
Competitive Employment 00 500 563 00 Enrolled In Higher Education 00 00 313 00
35
Reviewing Data
bull Reviewing Data bull TSW Students v Non TSW Students
bull Autism 100 (Non-No Students) bull Emotional Disability 857 (Non-80) bull Emotional Disability (Private Day) 80 (Non-100) bull Mild Intellectual Disability 100 (Non-0) bull Multiple Disabilities 0 (Non-No Students) bull Other Health Impairment 100 (Non-100) bull Specific Learning Disabilities 76 (Non 95) bull Traumatic Brain Injury 100 (Non-No Students)
36
bull bull
Disability Data (Extended Breakdown) Flagstaff Unified TSW Respondents Post-Secondary Outcomes by
Disability Type Engaged vs Not Engaged (Extended)
Autism (1)
Emotional Disability (7)
Emotional Disability (separate facility private school) (5)
Hearing Impairment (0)
Mild Intellectual Disability (2)
Moderate Intellectual Disability (0)
Multiple Disabilities (1)
Multiple Disabilities - Severe Sensory Impairment (0)
Orthopedic Impairment (0)
Other Health Impairment (3)
Severe Intellectual Disability (0)
Specific Learning Disability (25)
SpeechLanguage Impairment (0)
Traumatic Brain Injury (3)
Visual Impairment (0)
1000
857
800
143
200
1000
1000
1000
760 240
1000
Engaged Not Engaged
37
bull bull
Disability Data (Extended Breakdown) Flagstaff Unified No TSW Respondents Post-Secondary Outcomes
by Disability Type Engaged vs Not Engaged (Extended)
Autism (0)
Emotional Disability (5)
Emotional Disability (separate facility private school) (3)
Hearing Impairment (0)
Mild Intellectual Disability (2)
Moderate Intellectual Disability (0)
Multiple Disabilities (0)
Multiple Disabilities - Severe Sensory Impairment (0)
Orthopedic Impairment (0)
Other Health Impairment (3)
Severe Intellectual Disability (0)
Specific Learning Disability (49)
SpeechLanguage Impairment (0)
Traumatic Brain Injury (0)
Visual Impairment (0)
800 200
1000
1000
1000
959 41
Engaged Not Engaged
38
bull bull bull bull
Disability Data (Extended Breakdown) Flagstaff Unified TSW Respondents Post-Secondary Outcomes by
Disability Type (Extended)
Autism (1)
Emotional Disability (7)
Emotional Disability (separate facility private school) (5)
Hearing Impairment (0)
Mild Intellectual Disability (2)
Moderate Intellectual Disability (0)
Multiple Disabilities (1)
Multiple Disabilities - Severe Sensory Impairment (0)
Orthopedic Impairment (0)
Other Health Impairment (3)
Severe Intellectual Disability (0)
Specific Learning Disability (25)
SpeechLanguage Impairment (0)
Traumatic Brain Injury (3)
Visual Impairment (0)
1000
429
500
429
600
500
200
1000
240
333
480
667
40
Enrolled In Higher Education Competitive Employment Enrolled In Other Postsecondary Education Or Training Some Other Employment
39
bull bull bull bull
Disability Data (Extended Breakdown) Flagstaff Unified No TSW Respondents Post-Secondary Outcomes
by Disability Type (Extended)
Autism (0)
Emotional Disability (5)
Emotional Disability (separate facility private school) (3)
Hearing Impairment (0)
Mild Intellectual Disability (2)
Moderate Intellectual Disability (0)
Multiple Disabilities (0)
Multiple Disabilities - Severe Sensory Impairment (0)
Orthopedic Impairment (0)
Other Health Impairment (3)
Severe Intellectual Disability (0)
Specific Learning Disability (49)
SpeechLanguage Impairment (0)
Traumatic Brain Injury (0)
Visual Impairment (0)
600
667
200
333
333 667
286 551 61 61
Enrolled In Higher Education Competitive Employment Enrolled In Other Postsecondary Education Or Training Some Other Employment
40
bull bull
National Longitudinal Transition Study (NLTS2) - 2012
N=305000 Students
Graduation Post-Secondary Paying Job AT 100 81 80 No AT 80 40 51
100
81 8080
40
51
0
20
40
60
80
100
120
National Longitudinal Transition Study 41
Reviewing Data
bull Local AT Data and National Longitudinal Transition Study bull 2012 National Longitudinal Transition Study
bull 809 Students with AT attended higher Ed bull 401 Students who did not receive AT Higher Ed bull 78 of students with high-incidence disabilities reported
receiving AT in high school
bull 2014-2015 AT Loan Library Data bull 144 High School Requests bull Coconino County 19 of all AT Loan Library Requests bull Higher Education in Coconino County 30 bull Higher Education in Arizona 22
42
Local Example bull Spring 2017 to Spring 2018 Planning
bull PSO Data and Not Engaged Students bull Training Staff
bull Training staff to use AT (Assistive Technology) and create AT Implementation Plan
bull Used ldquoA Student Handbook for Choosing and Using ATrdquo bull Providing self-advocacy skills and sense of pride bull Use AT Loan Library and AzTAP Loan Library bull New Apps Clips or CADET for Captioning for all Students
bull Connected High School CTE (Career and Technical Education) Program with College Level CTE Program bull Connecting to Community and self-disclosure
bull Connected Counseling Department and Transition Department (Connecting Community)
43
Inform and align
Multiple-Measure Accountablllty bull Multiple measures
of CCR bull Continuum of
readiness indicators bull Usable data
Well-Rounded Education bull Enriched accelerated
curricula and educational experiences
bull Improved conditions for learning
t State CCR Definition
bull Academic readiness
bull Nonacademic readiness
Inform and allgn
Purposeful Assessment bull Balanced assessment
systems bull Design and delivery for
meaningful results bull Measuring nonacademic
readiness
How PSO Can Improve Programming
College amp Career Readiness and Success Center 44
bull bull
Disability Data (Extended Breakdown) Flagstaff Unified Respondents Post-Secondary Outcomes by
Disability Type Engaged vs Not Engaged (Extended)
Autism (1)
Emotional Disability (12)
Emotional Disability (separate facility private school) (8)
Hearing Impairment (0)
Mild Intellectual Disability (4)
Moderate Intellectual Disability (0)
Multiple Disabilities (1)
Multiple Disabilities - Severe Sensory Impairment (0)
Orthopedic Impairment (0)
Other Health Impairment (6)
Severe Intellectual Disability (0)
Specific Learning Disability (74)
SpeechLanguage Impairment (0)
Traumatic Brain Injury (3)
Visual Impairment (0)
1000
833
875
500
167
125
500
1000
1000
892 108
1000
Engaged Not Engaged
45
bull bull bull bull
Disability Data (Extended Breakdown) Flagstaff Unified Respondents Post-Secondary Outcomes by
Disability Type (Extended)
Autism (1)
Emotional Disability (12)
Emotional Disability (separate facility private school) (8)
Hearing Impairment (0)
Mild Intellectual Disability (4)
Moderate Intellectual Disability (0)
Multiple Disabilities (1)
Multiple Disabilities - Severe Sensory Impairment (0)
Orthopedic Impairment (0)
Other Health Impairment (6)
Severe Intellectual Disability (0)
Specific Learning Disability (74)
SpeechLanguage Impairment (0)
Traumatic Brain Injury (3)
Visual Impairment (0)
1000
250 500
625
83
125 125
250 250
167 833
270 527 54 41
333 667
Enrolled In Higher Education Competitive Employment Enrolled In Other Postsecondary Education Or Training Some Other Employment
46
Post-School (PSO) Outcomes for School Year Exiters 2014-2015
Tips about Student Engagement You Need To Know
Southern District Perspective
State of Arizona 2016 PSO Survey
Jay Johnson Education Program Specialist
PSO Initiatives
Disability Data (Extended Breakdown) Arizona Post-Secondary Outcomes by Disability Type
Engaged vs Not Engaged (Extended)
Autism (455)
Emotional Disability (466)
Emotional Disability (separate facility private school) (116)
Hearing Impairment (57)
Mild Intellectual Disability (316)
Moderate Intellectual Disability (128)
Multiple Disabilities (102)
Multiple Disabilities - Severe Sensory Impairment (28)
Orthopedic Impairment (37)
Other Health Impairment (653)
Severe Intellectual Disability (26)
Specific Learning Disability (3837)
SpeechLanguage Impairment (52)
Traumatic Brain Injury (33)
Visual Impairment (26)
637
646
526
772
554
461
578
429
595
363
354
474
228
446
539
422
571
405
793
500
808
923
758
769
207
500
192
77
242
231
Engaged Not Engaged
48
bull bull bull bull
Disability Data (Extended Breakdown) Arizona Post-Secondary Outcomes by Disability Type (Extended)
Autism (455)
Emotional Disability (466)
Emotional Disability (separate facility private school) (116)
Hearing Impairment (57)
Mild Intellectual Disability (316)
Moderate Intellectual Disability (128)
Multiple Disabilities (102)
Multiple Disabilities - Severe Sensory Impairment (28)
Orthopedic Impairment (37)
Other Health Impairment (653)
Severe Intellectual Disability (26)
Specific Learning Disability (3837)
SpeechLanguage Impairment (52)
Traumatic Brain Injury (33)
Visual Impairment (26)
303
131
149
401
152
73
33
41
86 276 78 86
316 298 105 53
79
23
216
36
241
94
137
36
149
273
147
286
85
70
78
71
378
299
27
400
162
44
27
51
38 346 115
229
538
461
346
60
38
58
364
423
182
192
152
77
61
77
Enrolled In Higher Education Competitive Employment Enrolled In Other Postsecondary Education Or Training Some Other Employment
49
Pride
Self-Advocate o o gt i-i--o o
0
0
0
00 C 0
0
PATH TO DISABILITY
PRIDE
New Insights for Building Disability Pride and Empowering Students with Hidden Disabilities
0 0
0 0
0
0 0
0
PATH OF DISABILITY
SHAME 0
Disability Shame
Positive Student Outcomes
50
Resources
bull Review the student list to see if students can be excluded from having the PSO Survey administered (ie re-enrolled)
bull Grandparentsfriends are great resources
bull Update contact list as much as possible
bull Any parentstudent meeting (ie IEP progress parent conferences)
bull Some districts have used social media to contact hard to reach youth
bull Consider teachertransition specialist stipends
bull Make contact with families as often as possible
bull Email-to-text message
bull Strategies for Increasing Response Rates
bull Strategies for Contacting Hard-to-Find Youth
51
Resources
bull Arizona Department of Education (Search PSO Transitions ECAP AZCIS Arizona Community of Practice on Transition-AZCoPT)
bull Secondary Transition
bull ECAP-Education and Career Action Plan
bull AZCIS-Arizona Career Information System
bull AZCoPT-Arizona Community of Practice On Transition
bull NTACT-National Technical Assistance on Transition
bull Career One Stop (Your Source for Career Exploration)
bull My Futurecom (Figure out whatrsquos next)
52
June through September 2017 Survey Participants
bull 276 PEAs (districts and charter schools) WILL BE included in the reported data
bull Per SAIS the total number of exiters (youth who graduated aged out or dropped out) who ARE eligible to take the PSO Survey = 9701
53
ldquoUnengagedrdquo Characteristics
bull Of the 1584 individuals counted in the non-engaged category 1183 did not attempt any post secondary educationtraining or employment
bull However 401 respondents (25) indicated that they attempted post secondary educationtraining or employment but did not meet the criteria to be counted in an engagement category
bull If those 401 youth who attempted engagement had been successful engagement rate would have increased from 75 to 81
54
PSO Assistance
Contact Information bull Jay Johnson
bull JayJohnsonazedgov
bull PSO E-mail bull PSOInboxazedgov
55
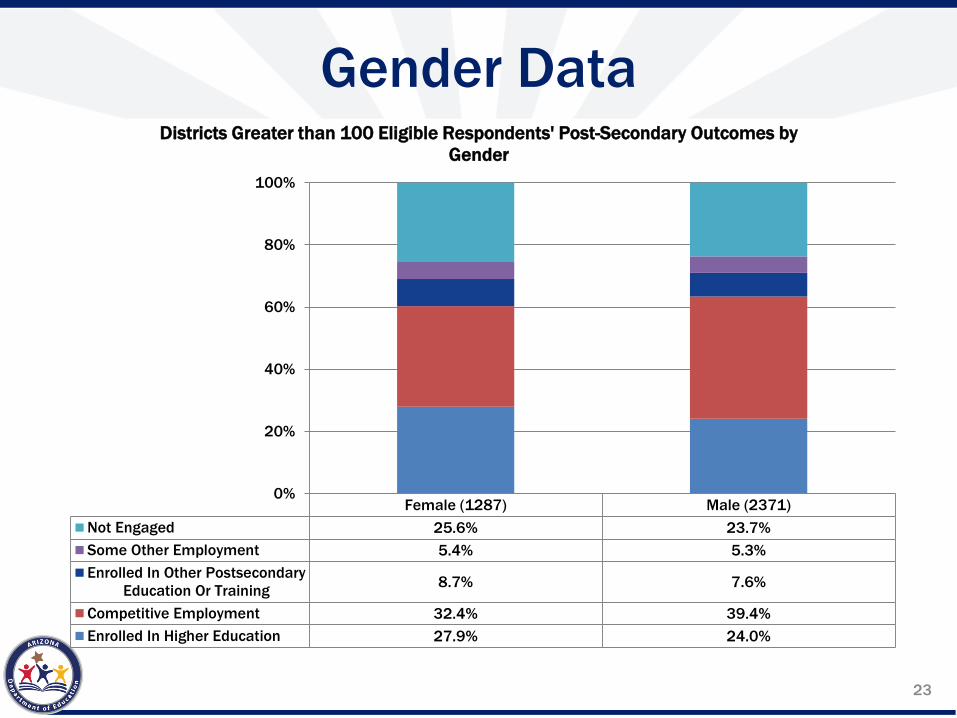
bull bull bull bull
Gender Data Districts Greater than 100 Eligible Respondents Post-Secondary Outcomes by
Gender 100
80
60
40
20
0 Female (1287) Male (2371)
Not Engaged 256 237 Some Other Employment 54 53 Enrolled In Other Postsecondary
Education Or Training 87 76
Competitive Employment 324 394 Enrolled In Higher Education 279 240
23
Figure 11 Types of accommodations and supports received from postsecondary schools by young adu lts with disabil it ies who had ever enrolled in a postsecondary school and had received these types of assistance
Additional time for tests
Technology
Tutor
Leamingbehavior management support
Additional time for modified assignments
Different test setting
Readerinterpreter in-class aide
Note taker
Written materials
Physical adaptations to classroom
Other testing accommodations
Large printbooks on tape Bra ille mater ials
Social work services
Case management
Independent living supports
Early registration
Other accommodations or supports
0
792 (8 17)
20 40 60 80
Percent of students who received accommodations and supports
100
2011 National Longitudinal Transition Study
2011 National Longitudinal Transition Study 24
Action Planning
bull Spring 2017 to Spring 2018 Planning bull Connecting and Events
bull Connecting students to Earn to Learn and Money Smart bull ldquoCollege Signing Dayrdquo
ndash Connects students to school community and self-disclosure
bull Connecting students to Earn to Learn and Money Smart
bull Training on college accommodations and used Think College Resource Library Transition Team Checklist in all high school IEPs
bull Using Infographic Transition to College What Changes after High School during ParentStudent Meetings
25
bull
Measurements A B amp C Arizona IDEA Part B SPPAPR Indicator 14 Post-School
Outcomes for School Year Exiters
Measurement A Higher Education
Measurement B Higher Education amp
Competitive Employment
Measurement C Higher Education
Competitive Employment amp
Some Other Education Training or Employment
Not Engaged
Flagstaff Unified TSW 23 77 81 19 Flagstaff Unified No TSW 24 79 92 8
23
77 81
19 24
79
92
8
0
20
40
60
80
100
26
bull bull
Engagement Rates Flagstaff Unified TSW Engagement Rates 47 responded for a 959 response rate
Enrolled In Higher Not
Education Engaged 234 191
Some Other Employmen
t 21
Enrolled In Other
Postsecond ary
Education Competitive Or Training Employmen
t 532 21
532 548
234 242 21
Flagstaff Unified No TSW Engagement Rates 62 responded for a 886 response
rate Not Enrolled In
Engaged Higher 81 Education
242 Some Other Employmen
t 48
Enrolled In Other
Postsecond ary Competitive
Education Employmen Or Training t 548
81
191 81 48 81 21
Enrolled In Higher Education
Competitive Employment Enrolled In Other Postsecondary Education
Or Training
Some Other Employment Not Engaged
Flagstaff Unified TSW Flagstaff Unified No TSW
27
bull bull bull bull
Disability Data Flagstaff Unified TSW Respondents Post-Secondary Outcomes by Disability Type
100
80
60
40
20
0 All Other
Disabilities (8) Emotional
Disturbance (12) Intellectual
Disability (2) Specific Learning
Disability (25) Not Engaged 125 167 00 240 Some Other Employment 00 83 00 00 Enrolled In Other Postsecondary
Education Or Training 00 00 00 40
Competitive Employment 750 500 500 480 Enrolled In Higher Education 125 250 500 240
28
bull bull bull bull
Disability Data Flagstaff Unified No TSW Respondents Post-Secondary Outcomes by Disability
Type 100
80
60
40
20
0 All Other
Disabilities (3) Emotional
Disturbance (8) Intellectual
Disability (2) Specific Learning
Disability (49) Not Engaged 00 125 1000 41 Some Other Employment 00 00 00 61 Enrolled In Other Postsecondary
Education Or Training 00 250 00 61
Competitive Employment 667 625 00 551 Enrolled In Higher Education 333 00 00 286
29
bull bull bull bull
Ethnicity Data Flagstaff Unified TSW Respondents Post-Secondary Outcomes by Ethnicity
100
80
60
40
20
0
American Indian or Alaskan
Native (19)
Asian (1)
Black or African
American (3)
Hispanic or Latino
(9)
Multi-racial (0)
Native Hawaiian or Other Pacific
Islander (0)
White (15)
Not Engaged 158 00 333 111 00 00 267 Some Other Employment 53 00 00 00 00 00 00 Enrolled In Other Postsecondary
Education Or Training 00 00 00 111 00 00 00
Competitive Employment 526 1000 667 778 00 00 333 Enrolled In Higher Education 263 00 00 00 00 00 400
30
bull bull bull bull
Ethnicity Data Flagstaff Unified No TSW Respondents Post-Secondary Outcomes by Ethnicity
100
80
60
40
20
0
American Indian or Alaskan
Native (11)
Asian (0)
Black or African
American (3)
Hispanic or Latino
(24)
Multi-racial (1)
Native Hawaiian or Other Pacific
Islander (0)
White (23)
Not Engaged 00 00 00 83 00 00 130 Some Other Employment 91 00 333 00 00 00 43 Enrolled In Other Postsecondary
Education Or Training 00 00 00 167 00 00 43
Competitive Employment 636 00 667 583 00 00 478 Enrolled In Higher Education 273 00 00 167 1000 00 304
31
bull bull bull bull
Gender Data Flagstaff Unified TSW Respondents Post-Secondary Outcomes by Gender
Female (17) Male (30) Not Engaged 235 167 Some Other Employment 59 00 Enrolled In Other Postsecondary
Education Or Training 59 00
Competitive Employment 294 667 Enrolled In Higher Education 353 167
0
20
40
60
80
100
32
bull bull bull bull
Gender Data Flagstaff Unified No TSW Respondents Post-Secondary Outcomes by Gender
Female (24) Male (38) Not Engaged 00 132 Some Other Employment 83 26 Enrolled In Other Postsecondary
Education Or Training 125 53
Competitive Employment 458 605 Enrolled In Higher Education 333 184
0
20
40
60
80
100
33
bull bull bull bull
Exit Data Flagstaff Unified TSW Respondents Post-Secondary Outcomes by Exit Type
100
80
60
40
20
0 Aged Out (0) Dropout (7) Graduated (40) Unknown (0)
Not Engaged 00 286 175 00 Some Other Employment 00 00 25 00 Enrolled In Other Postsecondary
Education Or Training 00 00 25 00
Competitive Employment 00 714 500 00 Enrolled In Higher Education 00 00 275 00
34
bull bull bull bull
Exit Data Flagstaff Unified No TSW Respondents Post-Secondary Outcomes by Exit Type
100
80
60
40
20
0 Aged Out (0) Dropout (14) Graduated (48) Unknown (0)
Not Engaged 00 214 42 00 Some Other Employment 00 143 21 00 Enrolled In Other Postsecondary
Education Or Training 00 143 63 00
Competitive Employment 00 500 563 00 Enrolled In Higher Education 00 00 313 00
35
Reviewing Data
bull Reviewing Data bull TSW Students v Non TSW Students
bull Autism 100 (Non-No Students) bull Emotional Disability 857 (Non-80) bull Emotional Disability (Private Day) 80 (Non-100) bull Mild Intellectual Disability 100 (Non-0) bull Multiple Disabilities 0 (Non-No Students) bull Other Health Impairment 100 (Non-100) bull Specific Learning Disabilities 76 (Non 95) bull Traumatic Brain Injury 100 (Non-No Students)
36
bull bull
Disability Data (Extended Breakdown) Flagstaff Unified TSW Respondents Post-Secondary Outcomes by
Disability Type Engaged vs Not Engaged (Extended)
Autism (1)
Emotional Disability (7)
Emotional Disability (separate facility private school) (5)
Hearing Impairment (0)
Mild Intellectual Disability (2)
Moderate Intellectual Disability (0)
Multiple Disabilities (1)
Multiple Disabilities - Severe Sensory Impairment (0)
Orthopedic Impairment (0)
Other Health Impairment (3)
Severe Intellectual Disability (0)
Specific Learning Disability (25)
SpeechLanguage Impairment (0)
Traumatic Brain Injury (3)
Visual Impairment (0)
1000
857
800
143
200
1000
1000
1000
760 240
1000
Engaged Not Engaged
37
bull bull
Disability Data (Extended Breakdown) Flagstaff Unified No TSW Respondents Post-Secondary Outcomes
by Disability Type Engaged vs Not Engaged (Extended)
Autism (0)
Emotional Disability (5)
Emotional Disability (separate facility private school) (3)
Hearing Impairment (0)
Mild Intellectual Disability (2)
Moderate Intellectual Disability (0)
Multiple Disabilities (0)
Multiple Disabilities - Severe Sensory Impairment (0)
Orthopedic Impairment (0)
Other Health Impairment (3)
Severe Intellectual Disability (0)
Specific Learning Disability (49)
SpeechLanguage Impairment (0)
Traumatic Brain Injury (0)
Visual Impairment (0)
800 200
1000
1000
1000
959 41
Engaged Not Engaged
38
bull bull bull bull
Disability Data (Extended Breakdown) Flagstaff Unified TSW Respondents Post-Secondary Outcomes by
Disability Type (Extended)
Autism (1)
Emotional Disability (7)
Emotional Disability (separate facility private school) (5)
Hearing Impairment (0)
Mild Intellectual Disability (2)
Moderate Intellectual Disability (0)
Multiple Disabilities (1)
Multiple Disabilities - Severe Sensory Impairment (0)
Orthopedic Impairment (0)
Other Health Impairment (3)
Severe Intellectual Disability (0)
Specific Learning Disability (25)
SpeechLanguage Impairment (0)
Traumatic Brain Injury (3)
Visual Impairment (0)
1000
429
500
429
600
500
200
1000
240
333
480
667
40
Enrolled In Higher Education Competitive Employment Enrolled In Other Postsecondary Education Or Training Some Other Employment
39
bull bull bull bull
Disability Data (Extended Breakdown) Flagstaff Unified No TSW Respondents Post-Secondary Outcomes
by Disability Type (Extended)
Autism (0)
Emotional Disability (5)
Emotional Disability (separate facility private school) (3)
Hearing Impairment (0)
Mild Intellectual Disability (2)
Moderate Intellectual Disability (0)
Multiple Disabilities (0)
Multiple Disabilities - Severe Sensory Impairment (0)
Orthopedic Impairment (0)
Other Health Impairment (3)
Severe Intellectual Disability (0)
Specific Learning Disability (49)
SpeechLanguage Impairment (0)
Traumatic Brain Injury (0)
Visual Impairment (0)
600
667
200
333
333 667
286 551 61 61
Enrolled In Higher Education Competitive Employment Enrolled In Other Postsecondary Education Or Training Some Other Employment
40
bull bull
National Longitudinal Transition Study (NLTS2) - 2012
N=305000 Students
Graduation Post-Secondary Paying Job AT 100 81 80 No AT 80 40 51
100
81 8080
40
51
0
20
40
60
80
100
120
National Longitudinal Transition Study 41
Reviewing Data
bull Local AT Data and National Longitudinal Transition Study bull 2012 National Longitudinal Transition Study
bull 809 Students with AT attended higher Ed bull 401 Students who did not receive AT Higher Ed bull 78 of students with high-incidence disabilities reported
receiving AT in high school
bull 2014-2015 AT Loan Library Data bull 144 High School Requests bull Coconino County 19 of all AT Loan Library Requests bull Higher Education in Coconino County 30 bull Higher Education in Arizona 22
42
Local Example bull Spring 2017 to Spring 2018 Planning
bull PSO Data and Not Engaged Students bull Training Staff
bull Training staff to use AT (Assistive Technology) and create AT Implementation Plan
bull Used ldquoA Student Handbook for Choosing and Using ATrdquo bull Providing self-advocacy skills and sense of pride bull Use AT Loan Library and AzTAP Loan Library bull New Apps Clips or CADET for Captioning for all Students
bull Connected High School CTE (Career and Technical Education) Program with College Level CTE Program bull Connecting to Community and self-disclosure
bull Connected Counseling Department and Transition Department (Connecting Community)
43
Inform and align
Multiple-Measure Accountablllty bull Multiple measures
of CCR bull Continuum of
readiness indicators bull Usable data
Well-Rounded Education bull Enriched accelerated
curricula and educational experiences
bull Improved conditions for learning
t State CCR Definition
bull Academic readiness
bull Nonacademic readiness
Inform and allgn
Purposeful Assessment bull Balanced assessment
systems bull Design and delivery for
meaningful results bull Measuring nonacademic
readiness
How PSO Can Improve Programming
College amp Career Readiness and Success Center 44
bull bull
Disability Data (Extended Breakdown) Flagstaff Unified Respondents Post-Secondary Outcomes by
Disability Type Engaged vs Not Engaged (Extended)
Autism (1)
Emotional Disability (12)
Emotional Disability (separate facility private school) (8)
Hearing Impairment (0)
Mild Intellectual Disability (4)
Moderate Intellectual Disability (0)
Multiple Disabilities (1)
Multiple Disabilities - Severe Sensory Impairment (0)
Orthopedic Impairment (0)
Other Health Impairment (6)
Severe Intellectual Disability (0)
Specific Learning Disability (74)
SpeechLanguage Impairment (0)
Traumatic Brain Injury (3)
Visual Impairment (0)
1000
833
875
500
167
125
500
1000
1000
892 108
1000
Engaged Not Engaged
45
bull bull bull bull
Disability Data (Extended Breakdown) Flagstaff Unified Respondents Post-Secondary Outcomes by
Disability Type (Extended)
Autism (1)
Emotional Disability (12)
Emotional Disability (separate facility private school) (8)
Hearing Impairment (0)
Mild Intellectual Disability (4)
Moderate Intellectual Disability (0)
Multiple Disabilities (1)
Multiple Disabilities - Severe Sensory Impairment (0)
Orthopedic Impairment (0)
Other Health Impairment (6)
Severe Intellectual Disability (0)
Specific Learning Disability (74)
SpeechLanguage Impairment (0)
Traumatic Brain Injury (3)
Visual Impairment (0)
1000
250 500
625
83
125 125
250 250
167 833
270 527 54 41
333 667
Enrolled In Higher Education Competitive Employment Enrolled In Other Postsecondary Education Or Training Some Other Employment
46
Post-School (PSO) Outcomes for School Year Exiters 2014-2015
Tips about Student Engagement You Need To Know
Southern District Perspective
State of Arizona 2016 PSO Survey
Jay Johnson Education Program Specialist
PSO Initiatives
Disability Data (Extended Breakdown) Arizona Post-Secondary Outcomes by Disability Type
Engaged vs Not Engaged (Extended)
Autism (455)
Emotional Disability (466)
Emotional Disability (separate facility private school) (116)
Hearing Impairment (57)
Mild Intellectual Disability (316)
Moderate Intellectual Disability (128)
Multiple Disabilities (102)
Multiple Disabilities - Severe Sensory Impairment (28)
Orthopedic Impairment (37)
Other Health Impairment (653)
Severe Intellectual Disability (26)
Specific Learning Disability (3837)
SpeechLanguage Impairment (52)
Traumatic Brain Injury (33)
Visual Impairment (26)
637
646
526
772
554
461
578
429
595
363
354
474
228
446
539
422
571
405
793
500
808
923
758
769
207
500
192
77
242
231
Engaged Not Engaged
48
bull bull bull bull
Disability Data (Extended Breakdown) Arizona Post-Secondary Outcomes by Disability Type (Extended)
Autism (455)
Emotional Disability (466)
Emotional Disability (separate facility private school) (116)
Hearing Impairment (57)
Mild Intellectual Disability (316)
Moderate Intellectual Disability (128)
Multiple Disabilities (102)
Multiple Disabilities - Severe Sensory Impairment (28)
Orthopedic Impairment (37)
Other Health Impairment (653)
Severe Intellectual Disability (26)
Specific Learning Disability (3837)
SpeechLanguage Impairment (52)
Traumatic Brain Injury (33)
Visual Impairment (26)
303
131
149
401
152
73
33
41
86 276 78 86
316 298 105 53
79
23
216
36
241
94
137
36
149
273
147
286
85
70
78
71
378
299
27
400
162
44
27
51
38 346 115
229
538
461
346
60
38
58
364
423
182
192
152
77
61
77
Enrolled In Higher Education Competitive Employment Enrolled In Other Postsecondary Education Or Training Some Other Employment
49
Pride
Self-Advocate o o gt i-i--o o
0
0
0
00 C 0
0
PATH TO DISABILITY
PRIDE
New Insights for Building Disability Pride and Empowering Students with Hidden Disabilities
0 0
0 0
0
0 0
0
PATH OF DISABILITY
SHAME 0
Disability Shame
Positive Student Outcomes
50
Resources
bull Review the student list to see if students can be excluded from having the PSO Survey administered (ie re-enrolled)
bull Grandparentsfriends are great resources
bull Update contact list as much as possible
bull Any parentstudent meeting (ie IEP progress parent conferences)
bull Some districts have used social media to contact hard to reach youth
bull Consider teachertransition specialist stipends
bull Make contact with families as often as possible
bull Email-to-text message
bull Strategies for Increasing Response Rates
bull Strategies for Contacting Hard-to-Find Youth
51
Resources
bull Arizona Department of Education (Search PSO Transitions ECAP AZCIS Arizona Community of Practice on Transition-AZCoPT)
bull Secondary Transition
bull ECAP-Education and Career Action Plan
bull AZCIS-Arizona Career Information System
bull AZCoPT-Arizona Community of Practice On Transition
bull NTACT-National Technical Assistance on Transition
bull Career One Stop (Your Source for Career Exploration)
bull My Futurecom (Figure out whatrsquos next)
52
June through September 2017 Survey Participants
bull 276 PEAs (districts and charter schools) WILL BE included in the reported data
bull Per SAIS the total number of exiters (youth who graduated aged out or dropped out) who ARE eligible to take the PSO Survey = 9701
53
ldquoUnengagedrdquo Characteristics
bull Of the 1584 individuals counted in the non-engaged category 1183 did not attempt any post secondary educationtraining or employment
bull However 401 respondents (25) indicated that they attempted post secondary educationtraining or employment but did not meet the criteria to be counted in an engagement category
bull If those 401 youth who attempted engagement had been successful engagement rate would have increased from 75 to 81
54
PSO Assistance
Contact Information bull Jay Johnson
bull JayJohnsonazedgov
bull PSO E-mail bull PSOInboxazedgov
55
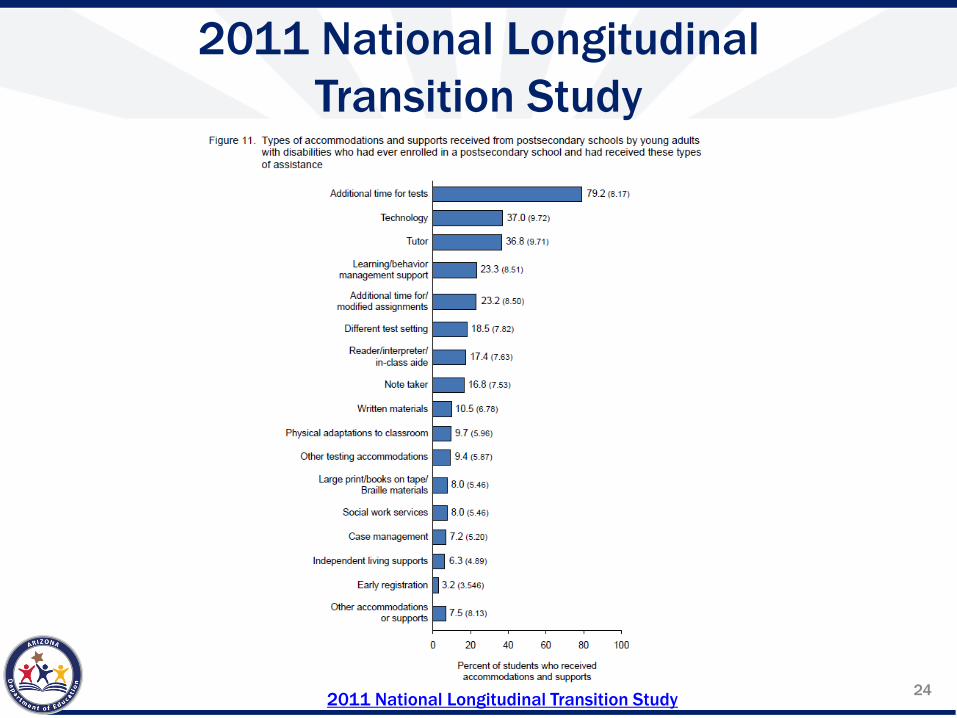
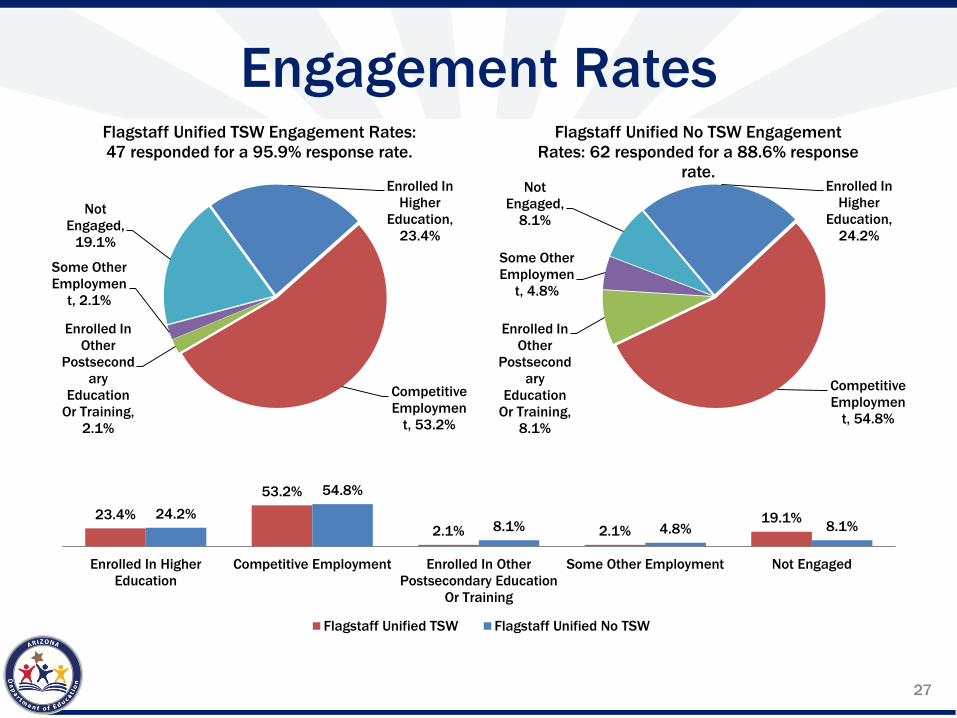
bull bull
Engagement Rates Flagstaff Unified TSW Engagement Rates 47 responded for a 959 response rate
Enrolled In Higher Not
Education Engaged 234 191
Some Other Employmen
t 21
Enrolled In Other
Postsecond ary
Education Competitive Or Training Employmen
t 532 21
532 548
234 242 21
Flagstaff Unified No TSW Engagement Rates 62 responded for a 886 response
rate Not Enrolled In
Engaged Higher 81 Education
242 Some Other Employmen
t 48
Enrolled In Other
Postsecond ary Competitive
Education Employmen Or Training t 548
81
191 81 48 81 21
Enrolled In Higher Education
Competitive Employment Enrolled In Other Postsecondary Education
Or Training
Some Other Employment Not Engaged
Flagstaff Unified TSW Flagstaff Unified No TSW
27
bull bull bull bull
Disability Data Flagstaff Unified TSW Respondents Post-Secondary Outcomes by Disability Type
100
80
60
40
20
0 All Other
Disabilities (8) Emotional
Disturbance (12) Intellectual
Disability (2) Specific Learning
Disability (25) Not Engaged 125 167 00 240 Some Other Employment 00 83 00 00 Enrolled In Other Postsecondary
Education Or Training 00 00 00 40
Competitive Employment 750 500 500 480 Enrolled In Higher Education 125 250 500 240
28
bull bull bull bull
Disability Data Flagstaff Unified No TSW Respondents Post-Secondary Outcomes by Disability
Type 100
80
60
40
20
0 All Other
Disabilities (3) Emotional
Disturbance (8) Intellectual
Disability (2) Specific Learning
Disability (49) Not Engaged 00 125 1000 41 Some Other Employment 00 00 00 61 Enrolled In Other Postsecondary
Education Or Training 00 250 00 61
Competitive Employment 667 625 00 551 Enrolled In Higher Education 333 00 00 286
29
bull bull bull bull
Ethnicity Data Flagstaff Unified TSW Respondents Post-Secondary Outcomes by Ethnicity
100
80
60
40
20
0
American Indian or Alaskan
Native (19)
Asian (1)
Black or African
American (3)
Hispanic or Latino
(9)
Multi-racial (0)
Native Hawaiian or Other Pacific
Islander (0)
White (15)
Not Engaged 158 00 333 111 00 00 267 Some Other Employment 53 00 00 00 00 00 00 Enrolled In Other Postsecondary
Education Or Training 00 00 00 111 00 00 00
Competitive Employment 526 1000 667 778 00 00 333 Enrolled In Higher Education 263 00 00 00 00 00 400
30
bull bull bull bull
Ethnicity Data Flagstaff Unified No TSW Respondents Post-Secondary Outcomes by Ethnicity
100
80
60
40
20
0
American Indian or Alaskan
Native (11)
Asian (0)
Black or African
American (3)
Hispanic or Latino
(24)
Multi-racial (1)
Native Hawaiian or Other Pacific
Islander (0)
White (23)
Not Engaged 00 00 00 83 00 00 130 Some Other Employment 91 00 333 00 00 00 43 Enrolled In Other Postsecondary
Education Or Training 00 00 00 167 00 00 43
Competitive Employment 636 00 667 583 00 00 478 Enrolled In Higher Education 273 00 00 167 1000 00 304
31
bull bull bull bull
Gender Data Flagstaff Unified TSW Respondents Post-Secondary Outcomes by Gender
Female (17) Male (30) Not Engaged 235 167 Some Other Employment 59 00 Enrolled In Other Postsecondary
Education Or Training 59 00
Competitive Employment 294 667 Enrolled In Higher Education 353 167
0
20
40
60
80
100
32
bull bull bull bull
Gender Data Flagstaff Unified No TSW Respondents Post-Secondary Outcomes by Gender
Female (24) Male (38) Not Engaged 00 132 Some Other Employment 83 26 Enrolled In Other Postsecondary
Education Or Training 125 53
Competitive Employment 458 605 Enrolled In Higher Education 333 184
0
20
40
60
80
100
33
bull bull bull bull
Exit Data Flagstaff Unified TSW Respondents Post-Secondary Outcomes by Exit Type
100
80
60
40
20
0 Aged Out (0) Dropout (7) Graduated (40) Unknown (0)
Not Engaged 00 286 175 00 Some Other Employment 00 00 25 00 Enrolled In Other Postsecondary
Education Or Training 00 00 25 00
Competitive Employment 00 714 500 00 Enrolled In Higher Education 00 00 275 00
34
bull bull bull bull
Exit Data Flagstaff Unified No TSW Respondents Post-Secondary Outcomes by Exit Type
100
80
60
40
20
0 Aged Out (0) Dropout (14) Graduated (48) Unknown (0)
Not Engaged 00 214 42 00 Some Other Employment 00 143 21 00 Enrolled In Other Postsecondary
Education Or Training 00 143 63 00
Competitive Employment 00 500 563 00 Enrolled In Higher Education 00 00 313 00
35
Reviewing Data
bull Reviewing Data bull TSW Students v Non TSW Students
bull Autism 100 (Non-No Students) bull Emotional Disability 857 (Non-80) bull Emotional Disability (Private Day) 80 (Non-100) bull Mild Intellectual Disability 100 (Non-0) bull Multiple Disabilities 0 (Non-No Students) bull Other Health Impairment 100 (Non-100) bull Specific Learning Disabilities 76 (Non 95) bull Traumatic Brain Injury 100 (Non-No Students)
36
bull bull
Disability Data (Extended Breakdown) Flagstaff Unified TSW Respondents Post-Secondary Outcomes by
Disability Type Engaged vs Not Engaged (Extended)
Autism (1)
Emotional Disability (7)
Emotional Disability (separate facility private school) (5)
Hearing Impairment (0)
Mild Intellectual Disability (2)
Moderate Intellectual Disability (0)
Multiple Disabilities (1)
Multiple Disabilities - Severe Sensory Impairment (0)
Orthopedic Impairment (0)
Other Health Impairment (3)
Severe Intellectual Disability (0)
Specific Learning Disability (25)
SpeechLanguage Impairment (0)
Traumatic Brain Injury (3)
Visual Impairment (0)
1000
857
800
143
200
1000
1000
1000
760 240
1000
Engaged Not Engaged
37
bull bull
Disability Data (Extended Breakdown) Flagstaff Unified No TSW Respondents Post-Secondary Outcomes
by Disability Type Engaged vs Not Engaged (Extended)
Autism (0)
Emotional Disability (5)
Emotional Disability (separate facility private school) (3)
Hearing Impairment (0)
Mild Intellectual Disability (2)
Moderate Intellectual Disability (0)
Multiple Disabilities (0)
Multiple Disabilities - Severe Sensory Impairment (0)
Orthopedic Impairment (0)
Other Health Impairment (3)
Severe Intellectual Disability (0)
Specific Learning Disability (49)
SpeechLanguage Impairment (0)
Traumatic Brain Injury (0)
Visual Impairment (0)
800 200
1000
1000
1000
959 41
Engaged Not Engaged
38
bull bull bull bull
Disability Data (Extended Breakdown) Flagstaff Unified TSW Respondents Post-Secondary Outcomes by
Disability Type (Extended)
Autism (1)
Emotional Disability (7)
Emotional Disability (separate facility private school) (5)
Hearing Impairment (0)
Mild Intellectual Disability (2)
Moderate Intellectual Disability (0)
Multiple Disabilities (1)
Multiple Disabilities - Severe Sensory Impairment (0)
Orthopedic Impairment (0)
Other Health Impairment (3)
Severe Intellectual Disability (0)
Specific Learning Disability (25)
SpeechLanguage Impairment (0)
Traumatic Brain Injury (3)
Visual Impairment (0)
1000
429
500
429
600
500
200
1000
240
333
480
667
40
Enrolled In Higher Education Competitive Employment Enrolled In Other Postsecondary Education Or Training Some Other Employment
39
bull bull bull bull
Disability Data (Extended Breakdown) Flagstaff Unified No TSW Respondents Post-Secondary Outcomes
by Disability Type (Extended)
Autism (0)
Emotional Disability (5)
Emotional Disability (separate facility private school) (3)
Hearing Impairment (0)
Mild Intellectual Disability (2)
Moderate Intellectual Disability (0)
Multiple Disabilities (0)
Multiple Disabilities - Severe Sensory Impairment (0)
Orthopedic Impairment (0)
Other Health Impairment (3)
Severe Intellectual Disability (0)
Specific Learning Disability (49)
SpeechLanguage Impairment (0)
Traumatic Brain Injury (0)
Visual Impairment (0)
600
667
200
333
333 667
286 551 61 61
Enrolled In Higher Education Competitive Employment Enrolled In Other Postsecondary Education Or Training Some Other Employment
40
bull bull
National Longitudinal Transition Study (NLTS2) - 2012
N=305000 Students
Graduation Post-Secondary Paying Job AT 100 81 80 No AT 80 40 51
100
81 8080
40
51
0
20
40
60
80
100
120
National Longitudinal Transition Study 41
Reviewing Data
bull Local AT Data and National Longitudinal Transition Study bull 2012 National Longitudinal Transition Study
bull 809 Students with AT attended higher Ed bull 401 Students who did not receive AT Higher Ed bull 78 of students with high-incidence disabilities reported
receiving AT in high school
bull 2014-2015 AT Loan Library Data bull 144 High School Requests bull Coconino County 19 of all AT Loan Library Requests bull Higher Education in Coconino County 30 bull Higher Education in Arizona 22
42
Local Example bull Spring 2017 to Spring 2018 Planning
bull PSO Data and Not Engaged Students bull Training Staff
bull Training staff to use AT (Assistive Technology) and create AT Implementation Plan
bull Used ldquoA Student Handbook for Choosing and Using ATrdquo bull Providing self-advocacy skills and sense of pride bull Use AT Loan Library and AzTAP Loan Library bull New Apps Clips or CADET for Captioning for all Students
bull Connected High School CTE (Career and Technical Education) Program with College Level CTE Program bull Connecting to Community and self-disclosure
bull Connected Counseling Department and Transition Department (Connecting Community)
43
Inform and align
Multiple-Measure Accountablllty bull Multiple measures
of CCR bull Continuum of
readiness indicators bull Usable data
Well-Rounded Education bull Enriched accelerated
curricula and educational experiences
bull Improved conditions for learning
t State CCR Definition
bull Academic readiness
bull Nonacademic readiness
Inform and allgn
Purposeful Assessment bull Balanced assessment
systems bull Design and delivery for
meaningful results bull Measuring nonacademic
readiness
How PSO Can Improve Programming
College amp Career Readiness and Success Center 44
bull bull
Disability Data (Extended Breakdown) Flagstaff Unified Respondents Post-Secondary Outcomes by
Disability Type Engaged vs Not Engaged (Extended)
Autism (1)
Emotional Disability (12)
Emotional Disability (separate facility private school) (8)
Hearing Impairment (0)
Mild Intellectual Disability (4)
Moderate Intellectual Disability (0)
Multiple Disabilities (1)
Multiple Disabilities - Severe Sensory Impairment (0)
Orthopedic Impairment (0)
Other Health Impairment (6)
Severe Intellectual Disability (0)
Specific Learning Disability (74)
SpeechLanguage Impairment (0)
Traumatic Brain Injury (3)
Visual Impairment (0)
1000
833
875
500
167
125
500
1000
1000
892 108
1000
Engaged Not Engaged
45
bull bull bull bull
Disability Data (Extended Breakdown) Flagstaff Unified Respondents Post-Secondary Outcomes by
Disability Type (Extended)
Autism (1)
Emotional Disability (12)
Emotional Disability (separate facility private school) (8)
Hearing Impairment (0)
Mild Intellectual Disability (4)
Moderate Intellectual Disability (0)
Multiple Disabilities (1)
Multiple Disabilities - Severe Sensory Impairment (0)
Orthopedic Impairment (0)
Other Health Impairment (6)
Severe Intellectual Disability (0)
Specific Learning Disability (74)
SpeechLanguage Impairment (0)
Traumatic Brain Injury (3)
Visual Impairment (0)
1000
250 500
625
83
125 125
250 250
167 833
270 527 54 41
333 667
Enrolled In Higher Education Competitive Employment Enrolled In Other Postsecondary Education Or Training Some Other Employment
46
Post-School (PSO) Outcomes for School Year Exiters 2014-2015
Tips about Student Engagement You Need To Know
Southern District Perspective
State of Arizona 2016 PSO Survey
Jay Johnson Education Program Specialist
PSO Initiatives
Disability Data (Extended Breakdown) Arizona Post-Secondary Outcomes by Disability Type
Engaged vs Not Engaged (Extended)
Autism (455)
Emotional Disability (466)
Emotional Disability (separate facility private school) (116)
Hearing Impairment (57)
Mild Intellectual Disability (316)
Moderate Intellectual Disability (128)
Multiple Disabilities (102)
Multiple Disabilities - Severe Sensory Impairment (28)
Orthopedic Impairment (37)
Other Health Impairment (653)
Severe Intellectual Disability (26)
Specific Learning Disability (3837)
SpeechLanguage Impairment (52)
Traumatic Brain Injury (33)
Visual Impairment (26)
637
646
526
772
554
461
578
429
595
363
354
474
228
446
539
422
571
405
793
500
808
923
758
769
207
500
192
77
242
231
Engaged Not Engaged
48
bull bull bull bull
Disability Data (Extended Breakdown) Arizona Post-Secondary Outcomes by Disability Type (Extended)
Autism (455)
Emotional Disability (466)
Emotional Disability (separate facility private school) (116)
Hearing Impairment (57)
Mild Intellectual Disability (316)
Moderate Intellectual Disability (128)
Multiple Disabilities (102)
Multiple Disabilities - Severe Sensory Impairment (28)
Orthopedic Impairment (37)
Other Health Impairment (653)
Severe Intellectual Disability (26)
Specific Learning Disability (3837)
SpeechLanguage Impairment (52)
Traumatic Brain Injury (33)
Visual Impairment (26)
303
131
149
401
152
73
33
41
86 276 78 86
316 298 105 53
79
23
216
36
241
94
137
36
149
273
147
286
85
70
78
71
378
299
27
400
162
44
27
51
38 346 115
229
538
461
346
60
38
58
364
423
182
192
152
77
61
77
Enrolled In Higher Education Competitive Employment Enrolled In Other Postsecondary Education Or Training Some Other Employment
49
Pride
Self-Advocate o o gt i-i--o o
0
0
0
00 C 0
0
PATH TO DISABILITY
PRIDE
New Insights for Building Disability Pride and Empowering Students with Hidden Disabilities
0 0
0 0
0
0 0
0
PATH OF DISABILITY
SHAME 0
Disability Shame
Positive Student Outcomes
50
Resources
bull Review the student list to see if students can be excluded from having the PSO Survey administered (ie re-enrolled)
bull Grandparentsfriends are great resources
bull Update contact list as much as possible
bull Any parentstudent meeting (ie IEP progress parent conferences)
bull Some districts have used social media to contact hard to reach youth
bull Consider teachertransition specialist stipends
bull Make contact with families as often as possible
bull Email-to-text message
bull Strategies for Increasing Response Rates
bull Strategies for Contacting Hard-to-Find Youth
51
Resources
bull Arizona Department of Education (Search PSO Transitions ECAP AZCIS Arizona Community of Practice on Transition-AZCoPT)
bull Secondary Transition
bull ECAP-Education and Career Action Plan
bull AZCIS-Arizona Career Information System
bull AZCoPT-Arizona Community of Practice On Transition
bull NTACT-National Technical Assistance on Transition
bull Career One Stop (Your Source for Career Exploration)
bull My Futurecom (Figure out whatrsquos next)
52
June through September 2017 Survey Participants
bull 276 PEAs (districts and charter schools) WILL BE included in the reported data
bull Per SAIS the total number of exiters (youth who graduated aged out or dropped out) who ARE eligible to take the PSO Survey = 9701
53
ldquoUnengagedrdquo Characteristics
bull Of the 1584 individuals counted in the non-engaged category 1183 did not attempt any post secondary educationtraining or employment
bull However 401 respondents (25) indicated that they attempted post secondary educationtraining or employment but did not meet the criteria to be counted in an engagement category
bull If those 401 youth who attempted engagement had been successful engagement rate would have increased from 75 to 81
54
PSO Assistance
Contact Information bull Jay Johnson
bull JayJohnsonazedgov
bull PSO E-mail bull PSOInboxazedgov
55
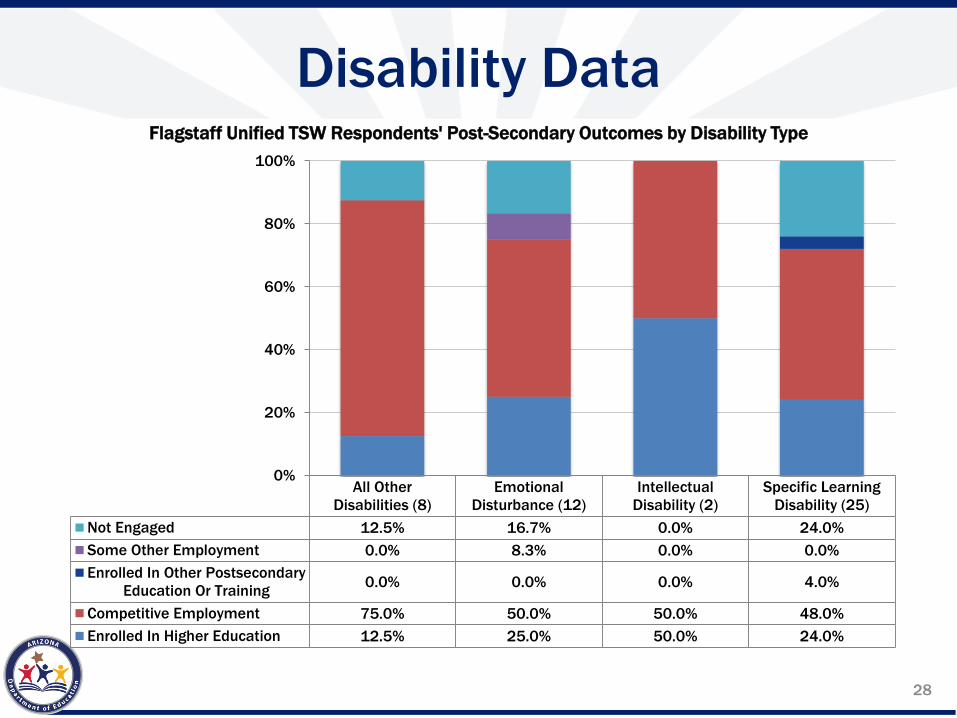
bull bull bull bull
Gender Data Flagstaff Unified TSW Respondents Post-Secondary Outcomes by Gender
Female (17) Male (30) Not Engaged 235 167 Some Other Employment 59 00 Enrolled In Other Postsecondary
Education Or Training 59 00
Competitive Employment 294 667 Enrolled In Higher Education 353 167
0
20
40
60
80
100
32
bull bull bull bull
Gender Data Flagstaff Unified No TSW Respondents Post-Secondary Outcomes by Gender
Female (24) Male (38) Not Engaged 00 132 Some Other Employment 83 26 Enrolled In Other Postsecondary
Education Or Training 125 53
Competitive Employment 458 605 Enrolled In Higher Education 333 184
0
20
40
60
80
100
33
bull bull bull bull
Exit Data Flagstaff Unified TSW Respondents Post-Secondary Outcomes by Exit Type
100
80
60
40
20
0 Aged Out (0) Dropout (7) Graduated (40) Unknown (0)
Not Engaged 00 286 175 00 Some Other Employment 00 00 25 00 Enrolled In Other Postsecondary
Education Or Training 00 00 25 00
Competitive Employment 00 714 500 00 Enrolled In Higher Education 00 00 275 00
34
bull bull bull bull
Exit Data Flagstaff Unified No TSW Respondents Post-Secondary Outcomes by Exit Type
100
80
60
40
20
0 Aged Out (0) Dropout (14) Graduated (48) Unknown (0)
Not Engaged 00 214 42 00 Some Other Employment 00 143 21 00 Enrolled In Other Postsecondary
Education Or Training 00 143 63 00
Competitive Employment 00 500 563 00 Enrolled In Higher Education 00 00 313 00
35
Reviewing Data
bull Reviewing Data bull TSW Students v Non TSW Students
bull Autism 100 (Non-No Students) bull Emotional Disability 857 (Non-80) bull Emotional Disability (Private Day) 80 (Non-100) bull Mild Intellectual Disability 100 (Non-0) bull Multiple Disabilities 0 (Non-No Students) bull Other Health Impairment 100 (Non-100) bull Specific Learning Disabilities 76 (Non 95) bull Traumatic Brain Injury 100 (Non-No Students)
36
bull bull
Disability Data (Extended Breakdown) Flagstaff Unified TSW Respondents Post-Secondary Outcomes by
Disability Type Engaged vs Not Engaged (Extended)
Autism (1)
Emotional Disability (7)
Emotional Disability (separate facility private school) (5)
Hearing Impairment (0)
Mild Intellectual Disability (2)
Moderate Intellectual Disability (0)
Multiple Disabilities (1)
Multiple Disabilities - Severe Sensory Impairment (0)
Orthopedic Impairment (0)
Other Health Impairment (3)
Severe Intellectual Disability (0)
Specific Learning Disability (25)
SpeechLanguage Impairment (0)
Traumatic Brain Injury (3)
Visual Impairment (0)
1000
857
800
143
200
1000
1000
1000
760 240
1000
Engaged Not Engaged
37
bull bull
Disability Data (Extended Breakdown) Flagstaff Unified No TSW Respondents Post-Secondary Outcomes
by Disability Type Engaged vs Not Engaged (Extended)
Autism (0)
Emotional Disability (5)
Emotional Disability (separate facility private school) (3)
Hearing Impairment (0)
Mild Intellectual Disability (2)
Moderate Intellectual Disability (0)
Multiple Disabilities (0)
Multiple Disabilities - Severe Sensory Impairment (0)
Orthopedic Impairment (0)
Other Health Impairment (3)
Severe Intellectual Disability (0)
Specific Learning Disability (49)
SpeechLanguage Impairment (0)
Traumatic Brain Injury (0)
Visual Impairment (0)
800 200
1000
1000
1000
959 41
Engaged Not Engaged
38
bull bull bull bull
Disability Data (Extended Breakdown) Flagstaff Unified TSW Respondents Post-Secondary Outcomes by
Disability Type (Extended)
Autism (1)
Emotional Disability (7)
Emotional Disability (separate facility private school) (5)
Hearing Impairment (0)
Mild Intellectual Disability (2)
Moderate Intellectual Disability (0)
Multiple Disabilities (1)
Multiple Disabilities - Severe Sensory Impairment (0)
Orthopedic Impairment (0)
Other Health Impairment (3)
Severe Intellectual Disability (0)
Specific Learning Disability (25)
SpeechLanguage Impairment (0)
Traumatic Brain Injury (3)
Visual Impairment (0)
1000
429
500
429
600
500
200
1000
240
333
480
667
40
Enrolled In Higher Education Competitive Employment Enrolled In Other Postsecondary Education Or Training Some Other Employment
39
bull bull bull bull
Disability Data (Extended Breakdown) Flagstaff Unified No TSW Respondents Post-Secondary Outcomes
by Disability Type (Extended)
Autism (0)
Emotional Disability (5)
Emotional Disability (separate facility private school) (3)
Hearing Impairment (0)
Mild Intellectual Disability (2)
Moderate Intellectual Disability (0)
Multiple Disabilities (0)
Multiple Disabilities - Severe Sensory Impairment (0)
Orthopedic Impairment (0)
Other Health Impairment (3)
Severe Intellectual Disability (0)
Specific Learning Disability (49)
SpeechLanguage Impairment (0)
Traumatic Brain Injury (0)
Visual Impairment (0)
600
667
200
333
333 667
286 551 61 61
Enrolled In Higher Education Competitive Employment Enrolled In Other Postsecondary Education Or Training Some Other Employment
40
bull bull
National Longitudinal Transition Study (NLTS2) - 2012
N=305000 Students
Graduation Post-Secondary Paying Job AT 100 81 80 No AT 80 40 51
100
81 8080
40
51
0
20
40
60
80
100
120
National Longitudinal Transition Study 41
Reviewing Data
bull Local AT Data and National Longitudinal Transition Study bull 2012 National Longitudinal Transition Study
bull 809 Students with AT attended higher Ed bull 401 Students who did not receive AT Higher Ed bull 78 of students with high-incidence disabilities reported
receiving AT in high school
bull 2014-2015 AT Loan Library Data bull 144 High School Requests bull Coconino County 19 of all AT Loan Library Requests bull Higher Education in Coconino County 30 bull Higher Education in Arizona 22
42
Local Example bull Spring 2017 to Spring 2018 Planning
bull PSO Data and Not Engaged Students bull Training Staff
bull Training staff to use AT (Assistive Technology) and create AT Implementation Plan
bull Used ldquoA Student Handbook for Choosing and Using ATrdquo bull Providing self-advocacy skills and sense of pride bull Use AT Loan Library and AzTAP Loan Library bull New Apps Clips or CADET for Captioning for all Students
bull Connected High School CTE (Career and Technical Education) Program with College Level CTE Program bull Connecting to Community and self-disclosure
bull Connected Counseling Department and Transition Department (Connecting Community)
43
Inform and align
Multiple-Measure Accountablllty bull Multiple measures
of CCR bull Continuum of
readiness indicators bull Usable data
Well-Rounded Education bull Enriched accelerated
curricula and educational experiences
bull Improved conditions for learning
t State CCR Definition
bull Academic readiness
bull Nonacademic readiness
Inform and allgn
Purposeful Assessment bull Balanced assessment
systems bull Design and delivery for
meaningful results bull Measuring nonacademic
readiness
How PSO Can Improve Programming
College amp Career Readiness and Success Center 44
bull bull
Disability Data (Extended Breakdown) Flagstaff Unified Respondents Post-Secondary Outcomes by
Disability Type Engaged vs Not Engaged (Extended)
Autism (1)
Emotional Disability (12)
Emotional Disability (separate facility private school) (8)
Hearing Impairment (0)
Mild Intellectual Disability (4)
Moderate Intellectual Disability (0)
Multiple Disabilities (1)
Multiple Disabilities - Severe Sensory Impairment (0)
Orthopedic Impairment (0)
Other Health Impairment (6)
Severe Intellectual Disability (0)
Specific Learning Disability (74)
SpeechLanguage Impairment (0)
Traumatic Brain Injury (3)
Visual Impairment (0)
1000
833
875
500
167
125
500
1000
1000
892 108
1000
Engaged Not Engaged
45
bull bull bull bull
Disability Data (Extended Breakdown) Flagstaff Unified Respondents Post-Secondary Outcomes by
Disability Type (Extended)
Autism (1)
Emotional Disability (12)
Emotional Disability (separate facility private school) (8)
Hearing Impairment (0)
Mild Intellectual Disability (4)
Moderate Intellectual Disability (0)
Multiple Disabilities (1)
Multiple Disabilities - Severe Sensory Impairment (0)
Orthopedic Impairment (0)
Other Health Impairment (6)
Severe Intellectual Disability (0)
Specific Learning Disability (74)
SpeechLanguage Impairment (0)
Traumatic Brain Injury (3)
Visual Impairment (0)
1000
250 500
625
83
125 125
250 250
167 833
270 527 54 41
333 667
Enrolled In Higher Education Competitive Employment Enrolled In Other Postsecondary Education Or Training Some Other Employment
46
Post-School (PSO) Outcomes for School Year Exiters 2014-2015
Tips about Student Engagement You Need To Know
Southern District Perspective
State of Arizona 2016 PSO Survey
Jay Johnson Education Program Specialist
PSO Initiatives
Disability Data (Extended Breakdown) Arizona Post-Secondary Outcomes by Disability Type
Engaged vs Not Engaged (Extended)
Autism (455)
Emotional Disability (466)
Emotional Disability (separate facility private school) (116)
Hearing Impairment (57)
Mild Intellectual Disability (316)
Moderate Intellectual Disability (128)
Multiple Disabilities (102)
Multiple Disabilities - Severe Sensory Impairment (28)
Orthopedic Impairment (37)
Other Health Impairment (653)
Severe Intellectual Disability (26)
Specific Learning Disability (3837)
SpeechLanguage Impairment (52)
Traumatic Brain Injury (33)
Visual Impairment (26)
637
646
526
772
554
461
578
429
595
363
354
474
228
446
539
422
571
405
793
500
808
923
758
769
207
500
192
77
242
231
Engaged Not Engaged
48
bull bull bull bull
Disability Data (Extended Breakdown) Arizona Post-Secondary Outcomes by Disability Type (Extended)
Autism (455)
Emotional Disability (466)
Emotional Disability (separate facility private school) (116)
Hearing Impairment (57)
Mild Intellectual Disability (316)
Moderate Intellectual Disability (128)
Multiple Disabilities (102)
Multiple Disabilities - Severe Sensory Impairment (28)
Orthopedic Impairment (37)
Other Health Impairment (653)
Severe Intellectual Disability (26)
Specific Learning Disability (3837)
SpeechLanguage Impairment (52)
Traumatic Brain Injury (33)
Visual Impairment (26)
303
131
149
401
152
73
33
41
86 276 78 86
316 298 105 53
79
23
216
36
241
94
137
36
149
273
147
286
85
70
78
71
378
299
27
400
162
44
27
51
38 346 115
229
538
461
346
60
38
58
364
423
182
192
152
77
61
77
Enrolled In Higher Education Competitive Employment Enrolled In Other Postsecondary Education Or Training Some Other Employment
49
Pride
Self-Advocate o o gt i-i--o o
0
0
0
00 C 0
0
PATH TO DISABILITY
PRIDE
New Insights for Building Disability Pride and Empowering Students with Hidden Disabilities
0 0
0 0
0
0 0
0
PATH OF DISABILITY
SHAME 0
Disability Shame
Positive Student Outcomes
50
Resources
bull Review the student list to see if students can be excluded from having the PSO Survey administered (ie re-enrolled)
bull Grandparentsfriends are great resources
bull Update contact list as much as possible
bull Any parentstudent meeting (ie IEP progress parent conferences)
bull Some districts have used social media to contact hard to reach youth
bull Consider teachertransition specialist stipends
bull Make contact with families as often as possible
bull Email-to-text message
bull Strategies for Increasing Response Rates
bull Strategies for Contacting Hard-to-Find Youth
51
Resources
bull Arizona Department of Education (Search PSO Transitions ECAP AZCIS Arizona Community of Practice on Transition-AZCoPT)
bull Secondary Transition
bull ECAP-Education and Career Action Plan
bull AZCIS-Arizona Career Information System
bull AZCoPT-Arizona Community of Practice On Transition
bull NTACT-National Technical Assistance on Transition
bull Career One Stop (Your Source for Career Exploration)
bull My Futurecom (Figure out whatrsquos next)
52
June through September 2017 Survey Participants
bull 276 PEAs (districts and charter schools) WILL BE included in the reported data
bull Per SAIS the total number of exiters (youth who graduated aged out or dropped out) who ARE eligible to take the PSO Survey = 9701
53
ldquoUnengagedrdquo Characteristics
bull Of the 1584 individuals counted in the non-engaged category 1183 did not attempt any post secondary educationtraining or employment
bull However 401 respondents (25) indicated that they attempted post secondary educationtraining or employment but did not meet the criteria to be counted in an engagement category
bull If those 401 youth who attempted engagement had been successful engagement rate would have increased from 75 to 81
54
PSO Assistance
Contact Information bull Jay Johnson
bull JayJohnsonazedgov
bull PSO E-mail bull PSOInboxazedgov
55
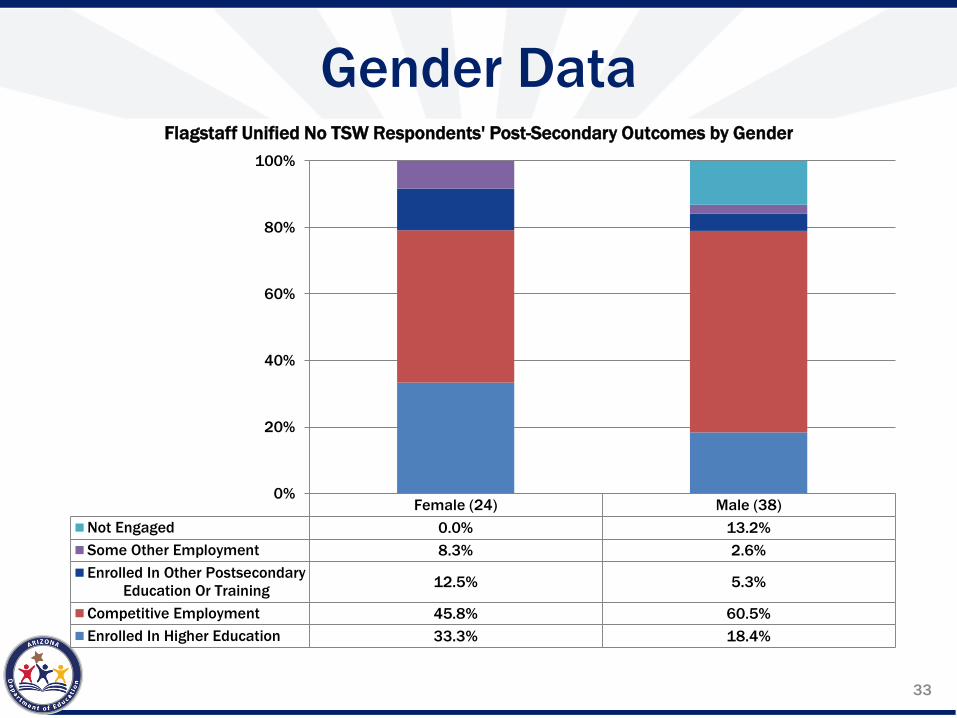
bull bull bull bull
Exit Data Flagstaff Unified TSW Respondents Post-Secondary Outcomes by Exit Type
100
80
60
40
20
0 Aged Out (0) Dropout (7) Graduated (40) Unknown (0)
Not Engaged 00 286 175 00 Some Other Employment 00 00 25 00 Enrolled In Other Postsecondary
Education Or Training 00 00 25 00
Competitive Employment 00 714 500 00 Enrolled In Higher Education 00 00 275 00
34
bull bull bull bull
Exit Data Flagstaff Unified No TSW Respondents Post-Secondary Outcomes by Exit Type
100
80
60
40
20
0 Aged Out (0) Dropout (14) Graduated (48) Unknown (0)
Not Engaged 00 214 42 00 Some Other Employment 00 143 21 00 Enrolled In Other Postsecondary
Education Or Training 00 143 63 00
Competitive Employment 00 500 563 00 Enrolled In Higher Education 00 00 313 00
35
Reviewing Data
bull Reviewing Data bull TSW Students v Non TSW Students
bull Autism 100 (Non-No Students) bull Emotional Disability 857 (Non-80) bull Emotional Disability (Private Day) 80 (Non-100) bull Mild Intellectual Disability 100 (Non-0) bull Multiple Disabilities 0 (Non-No Students) bull Other Health Impairment 100 (Non-100) bull Specific Learning Disabilities 76 (Non 95) bull Traumatic Brain Injury 100 (Non-No Students)
36
bull bull
Disability Data (Extended Breakdown) Flagstaff Unified TSW Respondents Post-Secondary Outcomes by
Disability Type Engaged vs Not Engaged (Extended)
Autism (1)
Emotional Disability (7)
Emotional Disability (separate facility private school) (5)
Hearing Impairment (0)
Mild Intellectual Disability (2)
Moderate Intellectual Disability (0)
Multiple Disabilities (1)
Multiple Disabilities - Severe Sensory Impairment (0)
Orthopedic Impairment (0)
Other Health Impairment (3)
Severe Intellectual Disability (0)
Specific Learning Disability (25)
SpeechLanguage Impairment (0)
Traumatic Brain Injury (3)
Visual Impairment (0)
1000
857
800
143
200
1000
1000
1000
760 240
1000
Engaged Not Engaged
37
bull bull
Disability Data (Extended Breakdown) Flagstaff Unified No TSW Respondents Post-Secondary Outcomes
by Disability Type Engaged vs Not Engaged (Extended)
Autism (0)
Emotional Disability (5)
Emotional Disability (separate facility private school) (3)
Hearing Impairment (0)
Mild Intellectual Disability (2)
Moderate Intellectual Disability (0)
Multiple Disabilities (0)
Multiple Disabilities - Severe Sensory Impairment (0)
Orthopedic Impairment (0)
Other Health Impairment (3)
Severe Intellectual Disability (0)
Specific Learning Disability (49)
SpeechLanguage Impairment (0)
Traumatic Brain Injury (0)
Visual Impairment (0)
800 200
1000
1000
1000
959 41
Engaged Not Engaged
38
bull bull bull bull
Disability Data (Extended Breakdown) Flagstaff Unified TSW Respondents Post-Secondary Outcomes by
Disability Type (Extended)
Autism (1)
Emotional Disability (7)
Emotional Disability (separate facility private school) (5)
Hearing Impairment (0)
Mild Intellectual Disability (2)
Moderate Intellectual Disability (0)
Multiple Disabilities (1)
Multiple Disabilities - Severe Sensory Impairment (0)
Orthopedic Impairment (0)
Other Health Impairment (3)
Severe Intellectual Disability (0)
Specific Learning Disability (25)
SpeechLanguage Impairment (0)
Traumatic Brain Injury (3)
Visual Impairment (0)
1000
429
500
429
600
500
200
1000
240
333
480
667
40
Enrolled In Higher Education Competitive Employment Enrolled In Other Postsecondary Education Or Training Some Other Employment
39
bull bull bull bull
Disability Data (Extended Breakdown) Flagstaff Unified No TSW Respondents Post-Secondary Outcomes
by Disability Type (Extended)
Autism (0)
Emotional Disability (5)
Emotional Disability (separate facility private school) (3)
Hearing Impairment (0)
Mild Intellectual Disability (2)
Moderate Intellectual Disability (0)
Multiple Disabilities (0)
Multiple Disabilities - Severe Sensory Impairment (0)
Orthopedic Impairment (0)
Other Health Impairment (3)
Severe Intellectual Disability (0)
Specific Learning Disability (49)
SpeechLanguage Impairment (0)
Traumatic Brain Injury (0)
Visual Impairment (0)
600
667
200
333
333 667
286 551 61 61
Enrolled In Higher Education Competitive Employment Enrolled In Other Postsecondary Education Or Training Some Other Employment
40
bull bull
National Longitudinal Transition Study (NLTS2) - 2012
N=305000 Students
Graduation Post-Secondary Paying Job AT 100 81 80 No AT 80 40 51
100
81 8080
40
51
0
20
40
60
80
100
120
National Longitudinal Transition Study 41
Reviewing Data
bull Local AT Data and National Longitudinal Transition Study bull 2012 National Longitudinal Transition Study
bull 809 Students with AT attended higher Ed bull 401 Students who did not receive AT Higher Ed bull 78 of students with high-incidence disabilities reported
receiving AT in high school
bull 2014-2015 AT Loan Library Data bull 144 High School Requests bull Coconino County 19 of all AT Loan Library Requests bull Higher Education in Coconino County 30 bull Higher Education in Arizona 22
42
Local Example bull Spring 2017 to Spring 2018 Planning
bull PSO Data and Not Engaged Students bull Training Staff
bull Training staff to use AT (Assistive Technology) and create AT Implementation Plan
bull Used ldquoA Student Handbook for Choosing and Using ATrdquo bull Providing self-advocacy skills and sense of pride bull Use AT Loan Library and AzTAP Loan Library bull New Apps Clips or CADET for Captioning for all Students
bull Connected High School CTE (Career and Technical Education) Program with College Level CTE Program bull Connecting to Community and self-disclosure
bull Connected Counseling Department and Transition Department (Connecting Community)
43
Inform and align
Multiple-Measure Accountablllty bull Multiple measures
of CCR bull Continuum of
readiness indicators bull Usable data
Well-Rounded Education bull Enriched accelerated
curricula and educational experiences
bull Improved conditions for learning
t State CCR Definition
bull Academic readiness
bull Nonacademic readiness
Inform and allgn
Purposeful Assessment bull Balanced assessment
systems bull Design and delivery for
meaningful results bull Measuring nonacademic
readiness
How PSO Can Improve Programming
College amp Career Readiness and Success Center 44
bull bull
Disability Data (Extended Breakdown) Flagstaff Unified Respondents Post-Secondary Outcomes by
Disability Type Engaged vs Not Engaged (Extended)
Autism (1)
Emotional Disability (12)
Emotional Disability (separate facility private school) (8)
Hearing Impairment (0)
Mild Intellectual Disability (4)
Moderate Intellectual Disability (0)
Multiple Disabilities (1)
Multiple Disabilities - Severe Sensory Impairment (0)
Orthopedic Impairment (0)
Other Health Impairment (6)
Severe Intellectual Disability (0)
Specific Learning Disability (74)
SpeechLanguage Impairment (0)
Traumatic Brain Injury (3)
Visual Impairment (0)
1000
833
875
500
167
125
500
1000
1000
892 108
1000
Engaged Not Engaged
45
bull bull bull bull
Disability Data (Extended Breakdown) Flagstaff Unified Respondents Post-Secondary Outcomes by
Disability Type (Extended)
Autism (1)
Emotional Disability (12)
Emotional Disability (separate facility private school) (8)
Hearing Impairment (0)
Mild Intellectual Disability (4)
Moderate Intellectual Disability (0)
Multiple Disabilities (1)
Multiple Disabilities - Severe Sensory Impairment (0)
Orthopedic Impairment (0)
Other Health Impairment (6)
Severe Intellectual Disability (0)
Specific Learning Disability (74)
SpeechLanguage Impairment (0)
Traumatic Brain Injury (3)
Visual Impairment (0)
1000
250 500
625
83
125 125
250 250
167 833
270 527 54 41
333 667
Enrolled In Higher Education Competitive Employment Enrolled In Other Postsecondary Education Or Training Some Other Employment
46
Post-School (PSO) Outcomes for School Year Exiters 2014-2015
Tips about Student Engagement You Need To Know
Southern District Perspective
State of Arizona 2016 PSO Survey
Jay Johnson Education Program Specialist
PSO Initiatives
Disability Data (Extended Breakdown) Arizona Post-Secondary Outcomes by Disability Type
Engaged vs Not Engaged (Extended)
Autism (455)
Emotional Disability (466)
Emotional Disability (separate facility private school) (116)
Hearing Impairment (57)
Mild Intellectual Disability (316)
Moderate Intellectual Disability (128)
Multiple Disabilities (102)
Multiple Disabilities - Severe Sensory Impairment (28)
Orthopedic Impairment (37)
Other Health Impairment (653)
Severe Intellectual Disability (26)
Specific Learning Disability (3837)
SpeechLanguage Impairment (52)
Traumatic Brain Injury (33)
Visual Impairment (26)
637
646
526
772
554
461
578
429
595
363
354
474
228
446
539
422
571
405
793
500
808
923
758
769
207
500
192
77
242
231
Engaged Not Engaged
48
bull bull bull bull
Disability Data (Extended Breakdown) Arizona Post-Secondary Outcomes by Disability Type (Extended)
Autism (455)
Emotional Disability (466)
Emotional Disability (separate facility private school) (116)
Hearing Impairment (57)
Mild Intellectual Disability (316)
Moderate Intellectual Disability (128)
Multiple Disabilities (102)
Multiple Disabilities - Severe Sensory Impairment (28)
Orthopedic Impairment (37)
Other Health Impairment (653)
Severe Intellectual Disability (26)
Specific Learning Disability (3837)
SpeechLanguage Impairment (52)
Traumatic Brain Injury (33)
Visual Impairment (26)
303
131
149
401
152
73
33
41
86 276 78 86
316 298 105 53
79
23
216
36
241
94
137
36
149
273
147
286
85
70
78
71
378
299
27
400
162
44
27
51
38 346 115
229
538
461
346
60
38
58
364
423
182
192
152
77
61
77
Enrolled In Higher Education Competitive Employment Enrolled In Other Postsecondary Education Or Training Some Other Employment
49
Pride
Self-Advocate o o gt i-i--o o
0
0
0
00 C 0
0
PATH TO DISABILITY
PRIDE
New Insights for Building Disability Pride and Empowering Students with Hidden Disabilities
0 0
0 0
0
0 0
0
PATH OF DISABILITY
SHAME 0
Disability Shame
Positive Student Outcomes
50
Resources
bull Review the student list to see if students can be excluded from having the PSO Survey administered (ie re-enrolled)
bull Grandparentsfriends are great resources
bull Update contact list as much as possible
bull Any parentstudent meeting (ie IEP progress parent conferences)
bull Some districts have used social media to contact hard to reach youth
bull Consider teachertransition specialist stipends
bull Make contact with families as often as possible
bull Email-to-text message
bull Strategies for Increasing Response Rates
bull Strategies for Contacting Hard-to-Find Youth
51
Resources
bull Arizona Department of Education (Search PSO Transitions ECAP AZCIS Arizona Community of Practice on Transition-AZCoPT)
bull Secondary Transition
bull ECAP-Education and Career Action Plan
bull AZCIS-Arizona Career Information System
bull AZCoPT-Arizona Community of Practice On Transition
bull NTACT-National Technical Assistance on Transition
bull Career One Stop (Your Source for Career Exploration)
bull My Futurecom (Figure out whatrsquos next)
52
June through September 2017 Survey Participants
bull 276 PEAs (districts and charter schools) WILL BE included in the reported data
bull Per SAIS the total number of exiters (youth who graduated aged out or dropped out) who ARE eligible to take the PSO Survey = 9701
53
ldquoUnengagedrdquo Characteristics
bull Of the 1584 individuals counted in the non-engaged category 1183 did not attempt any post secondary educationtraining or employment
bull However 401 respondents (25) indicated that they attempted post secondary educationtraining or employment but did not meet the criteria to be counted in an engagement category
bull If those 401 youth who attempted engagement had been successful engagement rate would have increased from 75 to 81
54
PSO Assistance
Contact Information bull Jay Johnson
bull JayJohnsonazedgov
bull PSO E-mail bull PSOInboxazedgov
55
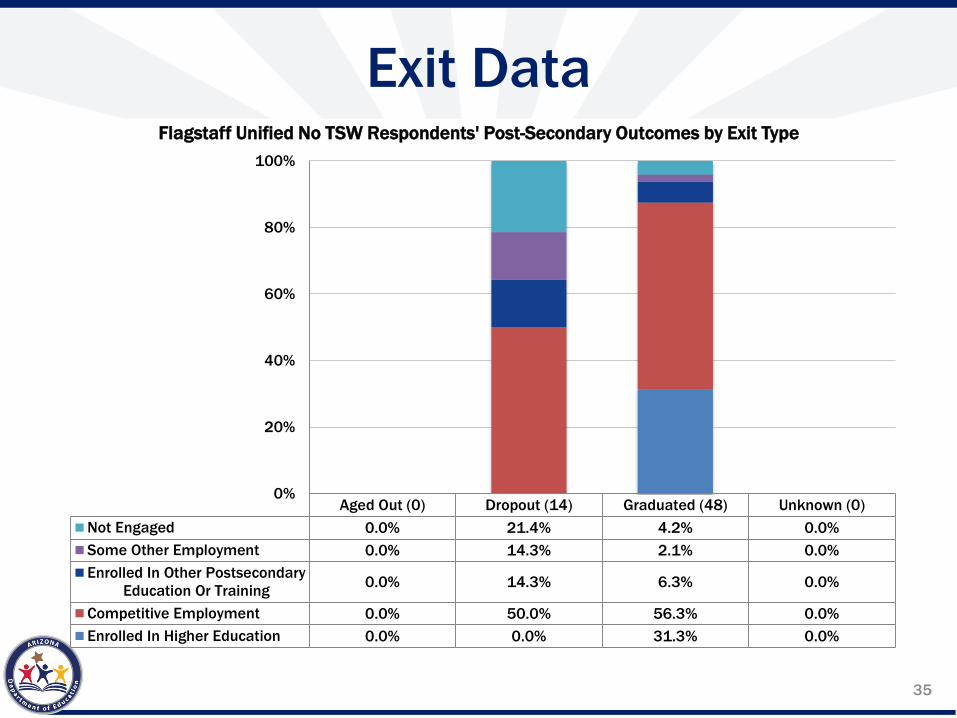
bull bull bull bull
Exit Data Flagstaff Unified No TSW Respondents Post-Secondary Outcomes by Exit Type
100
80
60
40
20
0 Aged Out (0) Dropout (14) Graduated (48) Unknown (0)
Not Engaged 00 214 42 00 Some Other Employment 00 143 21 00 Enrolled In Other Postsecondary
Education Or Training 00 143 63 00
Competitive Employment 00 500 563 00 Enrolled In Higher Education 00 00 313 00
35
Reviewing Data
bull Reviewing Data bull TSW Students v Non TSW Students
bull Autism 100 (Non-No Students) bull Emotional Disability 857 (Non-80) bull Emotional Disability (Private Day) 80 (Non-100) bull Mild Intellectual Disability 100 (Non-0) bull Multiple Disabilities 0 (Non-No Students) bull Other Health Impairment 100 (Non-100) bull Specific Learning Disabilities 76 (Non 95) bull Traumatic Brain Injury 100 (Non-No Students)
36
bull bull
Disability Data (Extended Breakdown) Flagstaff Unified TSW Respondents Post-Secondary Outcomes by
Disability Type Engaged vs Not Engaged (Extended)
Autism (1)
Emotional Disability (7)
Emotional Disability (separate facility private school) (5)
Hearing Impairment (0)
Mild Intellectual Disability (2)
Moderate Intellectual Disability (0)
Multiple Disabilities (1)
Multiple Disabilities - Severe Sensory Impairment (0)
Orthopedic Impairment (0)
Other Health Impairment (3)
Severe Intellectual Disability (0)
Specific Learning Disability (25)
SpeechLanguage Impairment (0)
Traumatic Brain Injury (3)
Visual Impairment (0)
1000
857
800
143
200
1000
1000
1000
760 240
1000
Engaged Not Engaged
37
bull bull
Disability Data (Extended Breakdown) Flagstaff Unified No TSW Respondents Post-Secondary Outcomes
by Disability Type Engaged vs Not Engaged (Extended)
Autism (0)
Emotional Disability (5)
Emotional Disability (separate facility private school) (3)
Hearing Impairment (0)
Mild Intellectual Disability (2)
Moderate Intellectual Disability (0)
Multiple Disabilities (0)
Multiple Disabilities - Severe Sensory Impairment (0)
Orthopedic Impairment (0)
Other Health Impairment (3)
Severe Intellectual Disability (0)
Specific Learning Disability (49)
SpeechLanguage Impairment (0)
Traumatic Brain Injury (0)
Visual Impairment (0)
800 200
1000
1000
1000
959 41
Engaged Not Engaged
38
bull bull bull bull
Disability Data (Extended Breakdown) Flagstaff Unified TSW Respondents Post-Secondary Outcomes by
Disability Type (Extended)
Autism (1)
Emotional Disability (7)
Emotional Disability (separate facility private school) (5)
Hearing Impairment (0)
Mild Intellectual Disability (2)
Moderate Intellectual Disability (0)
Multiple Disabilities (1)
Multiple Disabilities - Severe Sensory Impairment (0)
Orthopedic Impairment (0)
Other Health Impairment (3)
Severe Intellectual Disability (0)
Specific Learning Disability (25)
SpeechLanguage Impairment (0)
Traumatic Brain Injury (3)
Visual Impairment (0)
1000
429
500
429
600
500
200
1000
240
333
480
667
40
Enrolled In Higher Education Competitive Employment Enrolled In Other Postsecondary Education Or Training Some Other Employment
39
bull bull bull bull
Disability Data (Extended Breakdown) Flagstaff Unified No TSW Respondents Post-Secondary Outcomes
by Disability Type (Extended)
Autism (0)
Emotional Disability (5)
Emotional Disability (separate facility private school) (3)
Hearing Impairment (0)
Mild Intellectual Disability (2)
Moderate Intellectual Disability (0)
Multiple Disabilities (0)
Multiple Disabilities - Severe Sensory Impairment (0)
Orthopedic Impairment (0)
Other Health Impairment (3)
Severe Intellectual Disability (0)
Specific Learning Disability (49)
SpeechLanguage Impairment (0)
Traumatic Brain Injury (0)
Visual Impairment (0)
600
667
200
333
333 667
286 551 61 61
Enrolled In Higher Education Competitive Employment Enrolled In Other Postsecondary Education Or Training Some Other Employment
40
bull bull
National Longitudinal Transition Study (NLTS2) - 2012
N=305000 Students
Graduation Post-Secondary Paying Job AT 100 81 80 No AT 80 40 51
100
81 8080
40
51
0
20
40
60
80
100
120
National Longitudinal Transition Study 41
Reviewing Data
bull Local AT Data and National Longitudinal Transition Study bull 2012 National Longitudinal Transition Study
bull 809 Students with AT attended higher Ed bull 401 Students who did not receive AT Higher Ed bull 78 of students with high-incidence disabilities reported
receiving AT in high school
bull 2014-2015 AT Loan Library Data bull 144 High School Requests bull Coconino County 19 of all AT Loan Library Requests bull Higher Education in Coconino County 30 bull Higher Education in Arizona 22
42
Local Example bull Spring 2017 to Spring 2018 Planning
bull PSO Data and Not Engaged Students bull Training Staff
bull Training staff to use AT (Assistive Technology) and create AT Implementation Plan
bull Used ldquoA Student Handbook for Choosing and Using ATrdquo bull Providing self-advocacy skills and sense of pride bull Use AT Loan Library and AzTAP Loan Library bull New Apps Clips or CADET for Captioning for all Students
bull Connected High School CTE (Career and Technical Education) Program with College Level CTE Program bull Connecting to Community and self-disclosure
bull Connected Counseling Department and Transition Department (Connecting Community)
43
Inform and align
Multiple-Measure Accountablllty bull Multiple measures
of CCR bull Continuum of
readiness indicators bull Usable data
Well-Rounded Education bull Enriched accelerated
curricula and educational experiences
bull Improved conditions for learning
t State CCR Definition
bull Academic readiness
bull Nonacademic readiness
Inform and allgn
Purposeful Assessment bull Balanced assessment
systems bull Design and delivery for
meaningful results bull Measuring nonacademic
readiness
How PSO Can Improve Programming
College amp Career Readiness and Success Center 44
bull bull
Disability Data (Extended Breakdown) Flagstaff Unified Respondents Post-Secondary Outcomes by
Disability Type Engaged vs Not Engaged (Extended)
Autism (1)
Emotional Disability (12)
Emotional Disability (separate facility private school) (8)
Hearing Impairment (0)
Mild Intellectual Disability (4)
Moderate Intellectual Disability (0)
Multiple Disabilities (1)
Multiple Disabilities - Severe Sensory Impairment (0)
Orthopedic Impairment (0)
Other Health Impairment (6)
Severe Intellectual Disability (0)
Specific Learning Disability (74)
SpeechLanguage Impairment (0)
Traumatic Brain Injury (3)
Visual Impairment (0)
1000
833
875
500
167
125
500
1000
1000
892 108
1000
Engaged Not Engaged
45
bull bull bull bull
Disability Data (Extended Breakdown) Flagstaff Unified Respondents Post-Secondary Outcomes by
Disability Type (Extended)
Autism (1)
Emotional Disability (12)
Emotional Disability (separate facility private school) (8)
Hearing Impairment (0)
Mild Intellectual Disability (4)
Moderate Intellectual Disability (0)
Multiple Disabilities (1)
Multiple Disabilities - Severe Sensory Impairment (0)
Orthopedic Impairment (0)
Other Health Impairment (6)
Severe Intellectual Disability (0)
Specific Learning Disability (74)
SpeechLanguage Impairment (0)
Traumatic Brain Injury (3)
Visual Impairment (0)
1000
250 500
625
83
125 125
250 250
167 833
270 527 54 41
333 667
Enrolled In Higher Education Competitive Employment Enrolled In Other Postsecondary Education Or Training Some Other Employment
46
Post-School (PSO) Outcomes for School Year Exiters 2014-2015
Tips about Student Engagement You Need To Know
Southern District Perspective
State of Arizona 2016 PSO Survey
Jay Johnson Education Program Specialist
PSO Initiatives
Disability Data (Extended Breakdown) Arizona Post-Secondary Outcomes by Disability Type
Engaged vs Not Engaged (Extended)
Autism (455)
Emotional Disability (466)
Emotional Disability (separate facility private school) (116)
Hearing Impairment (57)
Mild Intellectual Disability (316)
Moderate Intellectual Disability (128)
Multiple Disabilities (102)
Multiple Disabilities - Severe Sensory Impairment (28)
Orthopedic Impairment (37)
Other Health Impairment (653)
Severe Intellectual Disability (26)
Specific Learning Disability (3837)
SpeechLanguage Impairment (52)
Traumatic Brain Injury (33)
Visual Impairment (26)
637
646
526
772
554
461
578
429
595
363
354
474
228
446
539
422
571
405
793
500
808
923
758
769
207
500
192
77
242
231
Engaged Not Engaged
48
bull bull bull bull
Disability Data (Extended Breakdown) Arizona Post-Secondary Outcomes by Disability Type (Extended)
Autism (455)
Emotional Disability (466)
Emotional Disability (separate facility private school) (116)
Hearing Impairment (57)
Mild Intellectual Disability (316)
Moderate Intellectual Disability (128)
Multiple Disabilities (102)
Multiple Disabilities - Severe Sensory Impairment (28)
Orthopedic Impairment (37)
Other Health Impairment (653)
Severe Intellectual Disability (26)
Specific Learning Disability (3837)
SpeechLanguage Impairment (52)
Traumatic Brain Injury (33)
Visual Impairment (26)
303
131
149
401
152
73
33
41
86 276 78 86
316 298 105 53
79
23
216
36
241
94
137
36
149
273
147
286
85
70
78
71
378
299
27
400
162
44
27
51
38 346 115
229
538
461
346
60
38
58
364
423
182
192
152
77
61
77
Enrolled In Higher Education Competitive Employment Enrolled In Other Postsecondary Education Or Training Some Other Employment
49
Pride
Self-Advocate o o gt i-i--o o
0
0
0
00 C 0
0
PATH TO DISABILITY
PRIDE
New Insights for Building Disability Pride and Empowering Students with Hidden Disabilities
0 0
0 0
0
0 0
0
PATH OF DISABILITY
SHAME 0
Disability Shame
Positive Student Outcomes
50
Resources
bull Review the student list to see if students can be excluded from having the PSO Survey administered (ie re-enrolled)
bull Grandparentsfriends are great resources
bull Update contact list as much as possible
bull Any parentstudent meeting (ie IEP progress parent conferences)
bull Some districts have used social media to contact hard to reach youth
bull Consider teachertransition specialist stipends
bull Make contact with families as often as possible
bull Email-to-text message
bull Strategies for Increasing Response Rates
bull Strategies for Contacting Hard-to-Find Youth
51
Resources
bull Arizona Department of Education (Search PSO Transitions ECAP AZCIS Arizona Community of Practice on Transition-AZCoPT)
bull Secondary Transition
bull ECAP-Education and Career Action Plan
bull AZCIS-Arizona Career Information System
bull AZCoPT-Arizona Community of Practice On Transition
bull NTACT-National Technical Assistance on Transition
bull Career One Stop (Your Source for Career Exploration)
bull My Futurecom (Figure out whatrsquos next)
52
June through September 2017 Survey Participants
bull 276 PEAs (districts and charter schools) WILL BE included in the reported data
bull Per SAIS the total number of exiters (youth who graduated aged out or dropped out) who ARE eligible to take the PSO Survey = 9701
53
ldquoUnengagedrdquo Characteristics
bull Of the 1584 individuals counted in the non-engaged category 1183 did not attempt any post secondary educationtraining or employment
bull However 401 respondents (25) indicated that they attempted post secondary educationtraining or employment but did not meet the criteria to be counted in an engagement category
bull If those 401 youth who attempted engagement had been successful engagement rate would have increased from 75 to 81
54
PSO Assistance
Contact Information bull Jay Johnson
bull JayJohnsonazedgov
bull PSO E-mail bull PSOInboxazedgov
55

Reviewing Data
bull Reviewing Data bull TSW Students v Non TSW Students
bull Autism 100 (Non-No Students) bull Emotional Disability 857 (Non-80) bull Emotional Disability (Private Day) 80 (Non-100) bull Mild Intellectual Disability 100 (Non-0) bull Multiple Disabilities 0 (Non-No Students) bull Other Health Impairment 100 (Non-100) bull Specific Learning Disabilities 76 (Non 95) bull Traumatic Brain Injury 100 (Non-No Students)
36
bull bull
Disability Data (Extended Breakdown) Flagstaff Unified TSW Respondents Post-Secondary Outcomes by
Disability Type Engaged vs Not Engaged (Extended)
Autism (1)
Emotional Disability (7)
Emotional Disability (separate facility private school) (5)
Hearing Impairment (0)
Mild Intellectual Disability (2)
Moderate Intellectual Disability (0)
Multiple Disabilities (1)
Multiple Disabilities - Severe Sensory Impairment (0)
Orthopedic Impairment (0)
Other Health Impairment (3)
Severe Intellectual Disability (0)
Specific Learning Disability (25)
SpeechLanguage Impairment (0)
Traumatic Brain Injury (3)
Visual Impairment (0)
1000
857
800
143
200
1000
1000
1000
760 240
1000
Engaged Not Engaged
37
bull bull
Disability Data (Extended Breakdown) Flagstaff Unified No TSW Respondents Post-Secondary Outcomes
by Disability Type Engaged vs Not Engaged (Extended)
Autism (0)
Emotional Disability (5)
Emotional Disability (separate facility private school) (3)
Hearing Impairment (0)
Mild Intellectual Disability (2)
Moderate Intellectual Disability (0)
Multiple Disabilities (0)
Multiple Disabilities - Severe Sensory Impairment (0)
Orthopedic Impairment (0)
Other Health Impairment (3)
Severe Intellectual Disability (0)
Specific Learning Disability (49)
SpeechLanguage Impairment (0)
Traumatic Brain Injury (0)
Visual Impairment (0)
800 200
1000
1000
1000
959 41
Engaged Not Engaged
38
bull bull bull bull
Disability Data (Extended Breakdown) Flagstaff Unified TSW Respondents Post-Secondary Outcomes by
Disability Type (Extended)
Autism (1)
Emotional Disability (7)
Emotional Disability (separate facility private school) (5)
Hearing Impairment (0)
Mild Intellectual Disability (2)
Moderate Intellectual Disability (0)
Multiple Disabilities (1)
Multiple Disabilities - Severe Sensory Impairment (0)
Orthopedic Impairment (0)
Other Health Impairment (3)
Severe Intellectual Disability (0)
Specific Learning Disability (25)
SpeechLanguage Impairment (0)
Traumatic Brain Injury (3)
Visual Impairment (0)
1000
429
500
429
600
500
200
1000
240
333
480
667
40
Enrolled In Higher Education Competitive Employment Enrolled In Other Postsecondary Education Or Training Some Other Employment
39
bull bull bull bull
Disability Data (Extended Breakdown) Flagstaff Unified No TSW Respondents Post-Secondary Outcomes
by Disability Type (Extended)
Autism (0)
Emotional Disability (5)
Emotional Disability (separate facility private school) (3)
Hearing Impairment (0)
Mild Intellectual Disability (2)
Moderate Intellectual Disability (0)
Multiple Disabilities (0)
Multiple Disabilities - Severe Sensory Impairment (0)
Orthopedic Impairment (0)
Other Health Impairment (3)
Severe Intellectual Disability (0)
Specific Learning Disability (49)
SpeechLanguage Impairment (0)
Traumatic Brain Injury (0)
Visual Impairment (0)
600
667
200
333
333 667
286 551 61 61
Enrolled In Higher Education Competitive Employment Enrolled In Other Postsecondary Education Or Training Some Other Employment
40
bull bull
National Longitudinal Transition Study (NLTS2) - 2012
N=305000 Students
Graduation Post-Secondary Paying Job AT 100 81 80 No AT 80 40 51
100
81 8080
40
51
0
20
40
60
80
100
120
National Longitudinal Transition Study 41
Reviewing Data
bull Local AT Data and National Longitudinal Transition Study bull 2012 National Longitudinal Transition Study
bull 809 Students with AT attended higher Ed bull 401 Students who did not receive AT Higher Ed bull 78 of students with high-incidence disabilities reported
receiving AT in high school
bull 2014-2015 AT Loan Library Data bull 144 High School Requests bull Coconino County 19 of all AT Loan Library Requests bull Higher Education in Coconino County 30 bull Higher Education in Arizona 22
42
Local Example bull Spring 2017 to Spring 2018 Planning
bull PSO Data and Not Engaged Students bull Training Staff
bull Training staff to use AT (Assistive Technology) and create AT Implementation Plan
bull Used ldquoA Student Handbook for Choosing and Using ATrdquo bull Providing self-advocacy skills and sense of pride bull Use AT Loan Library and AzTAP Loan Library bull New Apps Clips or CADET for Captioning for all Students
bull Connected High School CTE (Career and Technical Education) Program with College Level CTE Program bull Connecting to Community and self-disclosure
bull Connected Counseling Department and Transition Department (Connecting Community)
43
Inform and align
Multiple-Measure Accountablllty bull Multiple measures
of CCR bull Continuum of
readiness indicators bull Usable data
Well-Rounded Education bull Enriched accelerated
curricula and educational experiences
bull Improved conditions for learning
t State CCR Definition
bull Academic readiness
bull Nonacademic readiness
Inform and allgn
Purposeful Assessment bull Balanced assessment
systems bull Design and delivery for
meaningful results bull Measuring nonacademic
readiness
How PSO Can Improve Programming
College amp Career Readiness and Success Center 44
bull bull
Disability Data (Extended Breakdown) Flagstaff Unified Respondents Post-Secondary Outcomes by
Disability Type Engaged vs Not Engaged (Extended)
Autism (1)
Emotional Disability (12)
Emotional Disability (separate facility private school) (8)
Hearing Impairment (0)
Mild Intellectual Disability (4)
Moderate Intellectual Disability (0)
Multiple Disabilities (1)
Multiple Disabilities - Severe Sensory Impairment (0)
Orthopedic Impairment (0)
Other Health Impairment (6)
Severe Intellectual Disability (0)
Specific Learning Disability (74)
SpeechLanguage Impairment (0)
Traumatic Brain Injury (3)
Visual Impairment (0)
1000
833
875
500
167
125
500
1000
1000
892 108
1000
Engaged Not Engaged
45
bull bull bull bull
Disability Data (Extended Breakdown) Flagstaff Unified Respondents Post-Secondary Outcomes by
Disability Type (Extended)
Autism (1)
Emotional Disability (12)
Emotional Disability (separate facility private school) (8)
Hearing Impairment (0)
Mild Intellectual Disability (4)
Moderate Intellectual Disability (0)
Multiple Disabilities (1)
Multiple Disabilities - Severe Sensory Impairment (0)
Orthopedic Impairment (0)
Other Health Impairment (6)
Severe Intellectual Disability (0)
Specific Learning Disability (74)
SpeechLanguage Impairment (0)
Traumatic Brain Injury (3)
Visual Impairment (0)
1000
250 500
625
83
125 125
250 250
167 833
270 527 54 41
333 667
Enrolled In Higher Education Competitive Employment Enrolled In Other Postsecondary Education Or Training Some Other Employment
46
Post-School (PSO) Outcomes for School Year Exiters 2014-2015
Tips about Student Engagement You Need To Know
Southern District Perspective
State of Arizona 2016 PSO Survey
Jay Johnson Education Program Specialist
PSO Initiatives
Disability Data (Extended Breakdown) Arizona Post-Secondary Outcomes by Disability Type
Engaged vs Not Engaged (Extended)
Autism (455)
Emotional Disability (466)
Emotional Disability (separate facility private school) (116)
Hearing Impairment (57)
Mild Intellectual Disability (316)
Moderate Intellectual Disability (128)
Multiple Disabilities (102)
Multiple Disabilities - Severe Sensory Impairment (28)
Orthopedic Impairment (37)
Other Health Impairment (653)
Severe Intellectual Disability (26)
Specific Learning Disability (3837)
SpeechLanguage Impairment (52)
Traumatic Brain Injury (33)
Visual Impairment (26)
637
646
526
772
554
461
578
429
595
363
354
474
228
446
539
422
571
405
793
500
808
923
758
769
207
500
192
77
242
231
Engaged Not Engaged
48
bull bull bull bull
Disability Data (Extended Breakdown) Arizona Post-Secondary Outcomes by Disability Type (Extended)
Autism (455)
Emotional Disability (466)
Emotional Disability (separate facility private school) (116)
Hearing Impairment (57)
Mild Intellectual Disability (316)
Moderate Intellectual Disability (128)
Multiple Disabilities (102)
Multiple Disabilities - Severe Sensory Impairment (28)
Orthopedic Impairment (37)
Other Health Impairment (653)
Severe Intellectual Disability (26)
Specific Learning Disability (3837)
SpeechLanguage Impairment (52)
Traumatic Brain Injury (33)
Visual Impairment (26)
303
131
149
401
152
73
33
41
86 276 78 86
316 298 105 53
79
23
216
36
241
94
137
36
149
273
147
286
85
70
78
71
378
299
27
400
162
44
27
51
38 346 115
229
538
461
346
60
38
58
364
423
182
192
152
77
61
77
Enrolled In Higher Education Competitive Employment Enrolled In Other Postsecondary Education Or Training Some Other Employment
49
Pride
Self-Advocate o o gt i-i--o o
0
0
0
00 C 0
0
PATH TO DISABILITY
PRIDE
New Insights for Building Disability Pride and Empowering Students with Hidden Disabilities
0 0
0 0
0
0 0
0
PATH OF DISABILITY
SHAME 0
Disability Shame
Positive Student Outcomes
50
Resources
bull Review the student list to see if students can be excluded from having the PSO Survey administered (ie re-enrolled)
bull Grandparentsfriends are great resources
bull Update contact list as much as possible
bull Any parentstudent meeting (ie IEP progress parent conferences)
bull Some districts have used social media to contact hard to reach youth
bull Consider teachertransition specialist stipends
bull Make contact with families as often as possible
bull Email-to-text message
bull Strategies for Increasing Response Rates
bull Strategies for Contacting Hard-to-Find Youth
51
Resources
bull Arizona Department of Education (Search PSO Transitions ECAP AZCIS Arizona Community of Practice on Transition-AZCoPT)
bull Secondary Transition
bull ECAP-Education and Career Action Plan
bull AZCIS-Arizona Career Information System
bull AZCoPT-Arizona Community of Practice On Transition
bull NTACT-National Technical Assistance on Transition
bull Career One Stop (Your Source for Career Exploration)
bull My Futurecom (Figure out whatrsquos next)
52
June through September 2017 Survey Participants
bull 276 PEAs (districts and charter schools) WILL BE included in the reported data
bull Per SAIS the total number of exiters (youth who graduated aged out or dropped out) who ARE eligible to take the PSO Survey = 9701
53
ldquoUnengagedrdquo Characteristics
bull Of the 1584 individuals counted in the non-engaged category 1183 did not attempt any post secondary educationtraining or employment
bull However 401 respondents (25) indicated that they attempted post secondary educationtraining or employment but did not meet the criteria to be counted in an engagement category
bull If those 401 youth who attempted engagement had been successful engagement rate would have increased from 75 to 81
54
PSO Assistance
Contact Information bull Jay Johnson
bull JayJohnsonazedgov
bull PSO E-mail bull PSOInboxazedgov
55

bull bull
Disability Data (Extended Breakdown) Flagstaff Unified TSW Respondents Post-Secondary Outcomes by
Disability Type Engaged vs Not Engaged (Extended)
Autism (1)
Emotional Disability (7)
Emotional Disability (separate facility private school) (5)
Hearing Impairment (0)
Mild Intellectual Disability (2)
Moderate Intellectual Disability (0)
Multiple Disabilities (1)
Multiple Disabilities - Severe Sensory Impairment (0)
Orthopedic Impairment (0)
Other Health Impairment (3)
Severe Intellectual Disability (0)
Specific Learning Disability (25)
SpeechLanguage Impairment (0)
Traumatic Brain Injury (3)
Visual Impairment (0)
1000
857
800
143
200
1000
1000
1000
760 240
1000
Engaged Not Engaged
37
bull bull
Disability Data (Extended Breakdown) Flagstaff Unified No TSW Respondents Post-Secondary Outcomes
by Disability Type Engaged vs Not Engaged (Extended)
Autism (0)
Emotional Disability (5)
Emotional Disability (separate facility private school) (3)
Hearing Impairment (0)
Mild Intellectual Disability (2)
Moderate Intellectual Disability (0)
Multiple Disabilities (0)
Multiple Disabilities - Severe Sensory Impairment (0)
Orthopedic Impairment (0)
Other Health Impairment (3)
Severe Intellectual Disability (0)
Specific Learning Disability (49)
SpeechLanguage Impairment (0)
Traumatic Brain Injury (0)
Visual Impairment (0)
800 200
1000
1000
1000
959 41
Engaged Not Engaged
38
bull bull bull bull
Disability Data (Extended Breakdown) Flagstaff Unified TSW Respondents Post-Secondary Outcomes by
Disability Type (Extended)
Autism (1)
Emotional Disability (7)
Emotional Disability (separate facility private school) (5)
Hearing Impairment (0)
Mild Intellectual Disability (2)
Moderate Intellectual Disability (0)
Multiple Disabilities (1)
Multiple Disabilities - Severe Sensory Impairment (0)
Orthopedic Impairment (0)
Other Health Impairment (3)
Severe Intellectual Disability (0)
Specific Learning Disability (25)
SpeechLanguage Impairment (0)
Traumatic Brain Injury (3)
Visual Impairment (0)
1000
429
500
429
600
500
200
1000
240
333
480
667
40
Enrolled In Higher Education Competitive Employment Enrolled In Other Postsecondary Education Or Training Some Other Employment
39
bull bull bull bull
Disability Data (Extended Breakdown) Flagstaff Unified No TSW Respondents Post-Secondary Outcomes
by Disability Type (Extended)
Autism (0)
Emotional Disability (5)
Emotional Disability (separate facility private school) (3)
Hearing Impairment (0)
Mild Intellectual Disability (2)
Moderate Intellectual Disability (0)
Multiple Disabilities (0)
Multiple Disabilities - Severe Sensory Impairment (0)
Orthopedic Impairment (0)
Other Health Impairment (3)
Severe Intellectual Disability (0)
Specific Learning Disability (49)
SpeechLanguage Impairment (0)
Traumatic Brain Injury (0)
Visual Impairment (0)
600
667
200
333
333 667
286 551 61 61
Enrolled In Higher Education Competitive Employment Enrolled In Other Postsecondary Education Or Training Some Other Employment
40
bull bull
National Longitudinal Transition Study (NLTS2) - 2012
N=305000 Students
Graduation Post-Secondary Paying Job AT 100 81 80 No AT 80 40 51
100
81 8080
40
51
0
20
40
60
80
100
120
National Longitudinal Transition Study 41
Reviewing Data
bull Local AT Data and National Longitudinal Transition Study bull 2012 National Longitudinal Transition Study
bull 809 Students with AT attended higher Ed bull 401 Students who did not receive AT Higher Ed bull 78 of students with high-incidence disabilities reported
receiving AT in high school
bull 2014-2015 AT Loan Library Data bull 144 High School Requests bull Coconino County 19 of all AT Loan Library Requests bull Higher Education in Coconino County 30 bull Higher Education in Arizona 22
42
Local Example bull Spring 2017 to Spring 2018 Planning
bull PSO Data and Not Engaged Students bull Training Staff
bull Training staff to use AT (Assistive Technology) and create AT Implementation Plan
bull Used ldquoA Student Handbook for Choosing and Using ATrdquo bull Providing self-advocacy skills and sense of pride bull Use AT Loan Library and AzTAP Loan Library bull New Apps Clips or CADET for Captioning for all Students
bull Connected High School CTE (Career and Technical Education) Program with College Level CTE Program bull Connecting to Community and self-disclosure
bull Connected Counseling Department and Transition Department (Connecting Community)
43
Inform and align
Multiple-Measure Accountablllty bull Multiple measures
of CCR bull Continuum of
readiness indicators bull Usable data
Well-Rounded Education bull Enriched accelerated
curricula and educational experiences
bull Improved conditions for learning
t State CCR Definition
bull Academic readiness
bull Nonacademic readiness
Inform and allgn
Purposeful Assessment bull Balanced assessment
systems bull Design and delivery for
meaningful results bull Measuring nonacademic
readiness
How PSO Can Improve Programming
College amp Career Readiness and Success Center 44
bull bull
Disability Data (Extended Breakdown) Flagstaff Unified Respondents Post-Secondary Outcomes by
Disability Type Engaged vs Not Engaged (Extended)
Autism (1)
Emotional Disability (12)
Emotional Disability (separate facility private school) (8)
Hearing Impairment (0)
Mild Intellectual Disability (4)
Moderate Intellectual Disability (0)
Multiple Disabilities (1)
Multiple Disabilities - Severe Sensory Impairment (0)
Orthopedic Impairment (0)
Other Health Impairment (6)
Severe Intellectual Disability (0)
Specific Learning Disability (74)
SpeechLanguage Impairment (0)
Traumatic Brain Injury (3)
Visual Impairment (0)
1000
833
875
500
167
125
500
1000
1000
892 108
1000
Engaged Not Engaged
45
bull bull bull bull
Disability Data (Extended Breakdown) Flagstaff Unified Respondents Post-Secondary Outcomes by
Disability Type (Extended)
Autism (1)
Emotional Disability (12)
Emotional Disability (separate facility private school) (8)
Hearing Impairment (0)
Mild Intellectual Disability (4)
Moderate Intellectual Disability (0)
Multiple Disabilities (1)
Multiple Disabilities - Severe Sensory Impairment (0)
Orthopedic Impairment (0)
Other Health Impairment (6)
Severe Intellectual Disability (0)
Specific Learning Disability (74)
SpeechLanguage Impairment (0)
Traumatic Brain Injury (3)
Visual Impairment (0)
1000
250 500
625
83
125 125
250 250
167 833
270 527 54 41
333 667
Enrolled In Higher Education Competitive Employment Enrolled In Other Postsecondary Education Or Training Some Other Employment
46
Post-School (PSO) Outcomes for School Year Exiters 2014-2015
Tips about Student Engagement You Need To Know
Southern District Perspective
State of Arizona 2016 PSO Survey
Jay Johnson Education Program Specialist
PSO Initiatives
Disability Data (Extended Breakdown) Arizona Post-Secondary Outcomes by Disability Type
Engaged vs Not Engaged (Extended)
Autism (455)
Emotional Disability (466)
Emotional Disability (separate facility private school) (116)
Hearing Impairment (57)
Mild Intellectual Disability (316)
Moderate Intellectual Disability (128)
Multiple Disabilities (102)
Multiple Disabilities - Severe Sensory Impairment (28)
Orthopedic Impairment (37)
Other Health Impairment (653)
Severe Intellectual Disability (26)
Specific Learning Disability (3837)
SpeechLanguage Impairment (52)
Traumatic Brain Injury (33)
Visual Impairment (26)
637
646
526
772
554
461
578
429
595
363
354
474
228
446
539
422
571
405
793
500
808
923
758
769
207
500
192
77
242
231
Engaged Not Engaged
48
bull bull bull bull
Disability Data (Extended Breakdown) Arizona Post-Secondary Outcomes by Disability Type (Extended)
Autism (455)
Emotional Disability (466)
Emotional Disability (separate facility private school) (116)
Hearing Impairment (57)
Mild Intellectual Disability (316)
Moderate Intellectual Disability (128)
Multiple Disabilities (102)
Multiple Disabilities - Severe Sensory Impairment (28)
Orthopedic Impairment (37)
Other Health Impairment (653)
Severe Intellectual Disability (26)
Specific Learning Disability (3837)
SpeechLanguage Impairment (52)
Traumatic Brain Injury (33)
Visual Impairment (26)
303
131
149
401
152
73
33
41
86 276 78 86
316 298 105 53
79
23
216
36
241
94
137
36
149
273
147
286
85
70
78
71
378
299
27
400
162
44
27
51
38 346 115
229
538
461
346
60
38
58
364
423
182
192
152
77
61
77
Enrolled In Higher Education Competitive Employment Enrolled In Other Postsecondary Education Or Training Some Other Employment
49
Pride
Self-Advocate o o gt i-i--o o
0
0
0
00 C 0
0
PATH TO DISABILITY
PRIDE
New Insights for Building Disability Pride and Empowering Students with Hidden Disabilities
0 0
0 0
0
0 0
0
PATH OF DISABILITY
SHAME 0
Disability Shame
Positive Student Outcomes
50
Resources
bull Review the student list to see if students can be excluded from having the PSO Survey administered (ie re-enrolled)
bull Grandparentsfriends are great resources
bull Update contact list as much as possible
bull Any parentstudent meeting (ie IEP progress parent conferences)
bull Some districts have used social media to contact hard to reach youth
bull Consider teachertransition specialist stipends
bull Make contact with families as often as possible
bull Email-to-text message
bull Strategies for Increasing Response Rates
bull Strategies for Contacting Hard-to-Find Youth
51
Resources
bull Arizona Department of Education (Search PSO Transitions ECAP AZCIS Arizona Community of Practice on Transition-AZCoPT)
bull Secondary Transition
bull ECAP-Education and Career Action Plan
bull AZCIS-Arizona Career Information System
bull AZCoPT-Arizona Community of Practice On Transition
bull NTACT-National Technical Assistance on Transition
bull Career One Stop (Your Source for Career Exploration)
bull My Futurecom (Figure out whatrsquos next)
52
June through September 2017 Survey Participants
bull 276 PEAs (districts and charter schools) WILL BE included in the reported data
bull Per SAIS the total number of exiters (youth who graduated aged out or dropped out) who ARE eligible to take the PSO Survey = 9701
53
ldquoUnengagedrdquo Characteristics
bull Of the 1584 individuals counted in the non-engaged category 1183 did not attempt any post secondary educationtraining or employment
bull However 401 respondents (25) indicated that they attempted post secondary educationtraining or employment but did not meet the criteria to be counted in an engagement category
bull If those 401 youth who attempted engagement had been successful engagement rate would have increased from 75 to 81
54
PSO Assistance
Contact Information bull Jay Johnson
bull JayJohnsonazedgov
bull PSO E-mail bull PSOInboxazedgov
55
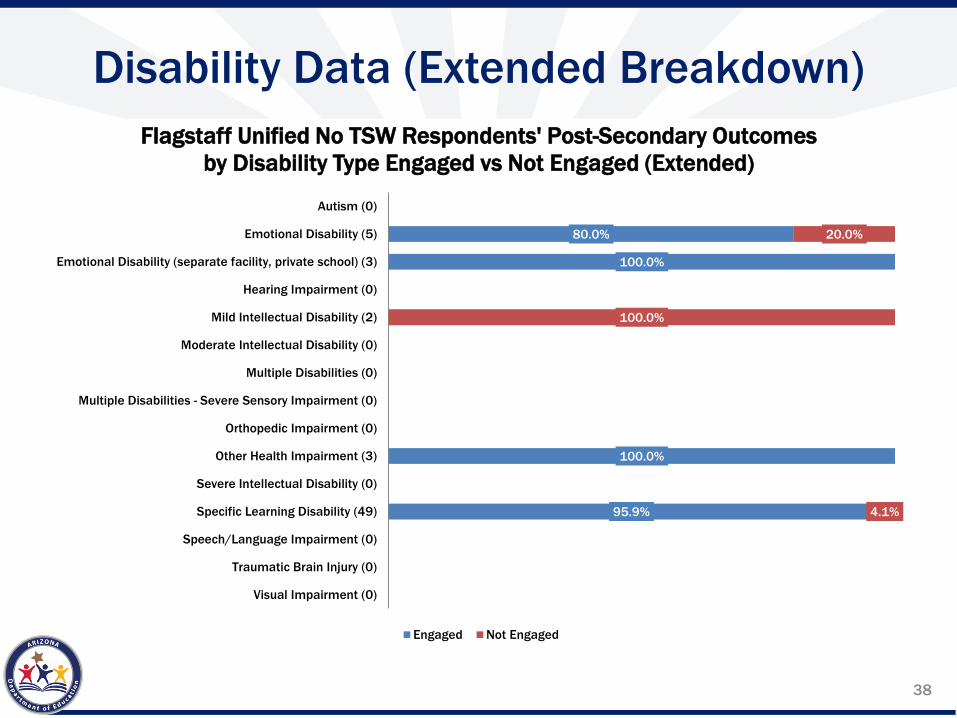
bull bull
Disability Data (Extended Breakdown) Flagstaff Unified No TSW Respondents Post-Secondary Outcomes
by Disability Type Engaged vs Not Engaged (Extended)
Autism (0)
Emotional Disability (5)
Emotional Disability (separate facility private school) (3)
Hearing Impairment (0)
Mild Intellectual Disability (2)
Moderate Intellectual Disability (0)
Multiple Disabilities (0)
Multiple Disabilities - Severe Sensory Impairment (0)
Orthopedic Impairment (0)
Other Health Impairment (3)
Severe Intellectual Disability (0)
Specific Learning Disability (49)
SpeechLanguage Impairment (0)
Traumatic Brain Injury (0)
Visual Impairment (0)
800 200
1000
1000
1000
959 41
Engaged Not Engaged
38
bull bull bull bull
Disability Data (Extended Breakdown) Flagstaff Unified TSW Respondents Post-Secondary Outcomes by
Disability Type (Extended)
Autism (1)
Emotional Disability (7)
Emotional Disability (separate facility private school) (5)
Hearing Impairment (0)
Mild Intellectual Disability (2)
Moderate Intellectual Disability (0)
Multiple Disabilities (1)
Multiple Disabilities - Severe Sensory Impairment (0)
Orthopedic Impairment (0)
Other Health Impairment (3)
Severe Intellectual Disability (0)
Specific Learning Disability (25)
SpeechLanguage Impairment (0)
Traumatic Brain Injury (3)
Visual Impairment (0)
1000
429
500
429
600
500
200
1000
240
333
480
667
40
Enrolled In Higher Education Competitive Employment Enrolled In Other Postsecondary Education Or Training Some Other Employment
39
bull bull bull bull
Disability Data (Extended Breakdown) Flagstaff Unified No TSW Respondents Post-Secondary Outcomes
by Disability Type (Extended)
Autism (0)
Emotional Disability (5)
Emotional Disability (separate facility private school) (3)
Hearing Impairment (0)
Mild Intellectual Disability (2)
Moderate Intellectual Disability (0)
Multiple Disabilities (0)
Multiple Disabilities - Severe Sensory Impairment (0)
Orthopedic Impairment (0)
Other Health Impairment (3)
Severe Intellectual Disability (0)
Specific Learning Disability (49)
SpeechLanguage Impairment (0)
Traumatic Brain Injury (0)
Visual Impairment (0)
600
667
200
333
333 667
286 551 61 61
Enrolled In Higher Education Competitive Employment Enrolled In Other Postsecondary Education Or Training Some Other Employment
40
bull bull
National Longitudinal Transition Study (NLTS2) - 2012
N=305000 Students
Graduation Post-Secondary Paying Job AT 100 81 80 No AT 80 40 51
100
81 8080
40
51
0
20
40
60
80
100
120
National Longitudinal Transition Study 41
Reviewing Data
bull Local AT Data and National Longitudinal Transition Study bull 2012 National Longitudinal Transition Study
bull 809 Students with AT attended higher Ed bull 401 Students who did not receive AT Higher Ed bull 78 of students with high-incidence disabilities reported
receiving AT in high school
bull 2014-2015 AT Loan Library Data bull 144 High School Requests bull Coconino County 19 of all AT Loan Library Requests bull Higher Education in Coconino County 30 bull Higher Education in Arizona 22
42
Local Example bull Spring 2017 to Spring 2018 Planning
bull PSO Data and Not Engaged Students bull Training Staff
bull Training staff to use AT (Assistive Technology) and create AT Implementation Plan
bull Used ldquoA Student Handbook for Choosing and Using ATrdquo bull Providing self-advocacy skills and sense of pride bull Use AT Loan Library and AzTAP Loan Library bull New Apps Clips or CADET for Captioning for all Students
bull Connected High School CTE (Career and Technical Education) Program with College Level CTE Program bull Connecting to Community and self-disclosure
bull Connected Counseling Department and Transition Department (Connecting Community)
43
Inform and align
Multiple-Measure Accountablllty bull Multiple measures
of CCR bull Continuum of
readiness indicators bull Usable data
Well-Rounded Education bull Enriched accelerated
curricula and educational experiences
bull Improved conditions for learning
t State CCR Definition
bull Academic readiness
bull Nonacademic readiness
Inform and allgn
Purposeful Assessment bull Balanced assessment
systems bull Design and delivery for
meaningful results bull Measuring nonacademic
readiness
How PSO Can Improve Programming
College amp Career Readiness and Success Center 44
bull bull
Disability Data (Extended Breakdown) Flagstaff Unified Respondents Post-Secondary Outcomes by
Disability Type Engaged vs Not Engaged (Extended)
Autism (1)
Emotional Disability (12)
Emotional Disability (separate facility private school) (8)
Hearing Impairment (0)
Mild Intellectual Disability (4)
Moderate Intellectual Disability (0)
Multiple Disabilities (1)
Multiple Disabilities - Severe Sensory Impairment (0)
Orthopedic Impairment (0)
Other Health Impairment (6)
Severe Intellectual Disability (0)
Specific Learning Disability (74)
SpeechLanguage Impairment (0)
Traumatic Brain Injury (3)
Visual Impairment (0)
1000
833
875
500
167
125
500
1000
1000
892 108
1000
Engaged Not Engaged
45
bull bull bull bull
Disability Data (Extended Breakdown) Flagstaff Unified Respondents Post-Secondary Outcomes by
Disability Type (Extended)
Autism (1)
Emotional Disability (12)
Emotional Disability (separate facility private school) (8)
Hearing Impairment (0)
Mild Intellectual Disability (4)
Moderate Intellectual Disability (0)
Multiple Disabilities (1)
Multiple Disabilities - Severe Sensory Impairment (0)
Orthopedic Impairment (0)
Other Health Impairment (6)
Severe Intellectual Disability (0)
Specific Learning Disability (74)
SpeechLanguage Impairment (0)
Traumatic Brain Injury (3)
Visual Impairment (0)
1000
250 500
625
83
125 125
250 250
167 833
270 527 54 41
333 667
Enrolled In Higher Education Competitive Employment Enrolled In Other Postsecondary Education Or Training Some Other Employment
46
Post-School (PSO) Outcomes for School Year Exiters 2014-2015
Tips about Student Engagement You Need To Know
Southern District Perspective
State of Arizona 2016 PSO Survey
Jay Johnson Education Program Specialist
PSO Initiatives
Disability Data (Extended Breakdown) Arizona Post-Secondary Outcomes by Disability Type
Engaged vs Not Engaged (Extended)
Autism (455)
Emotional Disability (466)
Emotional Disability (separate facility private school) (116)
Hearing Impairment (57)
Mild Intellectual Disability (316)
Moderate Intellectual Disability (128)
Multiple Disabilities (102)
Multiple Disabilities - Severe Sensory Impairment (28)
Orthopedic Impairment (37)
Other Health Impairment (653)
Severe Intellectual Disability (26)
Specific Learning Disability (3837)
SpeechLanguage Impairment (52)
Traumatic Brain Injury (33)
Visual Impairment (26)
637
646
526
772
554
461
578
429
595
363
354
474
228
446
539
422
571
405
793
500
808
923
758
769
207
500
192
77
242
231
Engaged Not Engaged
48
bull bull bull bull
Disability Data (Extended Breakdown) Arizona Post-Secondary Outcomes by Disability Type (Extended)
Autism (455)
Emotional Disability (466)
Emotional Disability (separate facility private school) (116)
Hearing Impairment (57)
Mild Intellectual Disability (316)
Moderate Intellectual Disability (128)
Multiple Disabilities (102)
Multiple Disabilities - Severe Sensory Impairment (28)
Orthopedic Impairment (37)
Other Health Impairment (653)
Severe Intellectual Disability (26)
Specific Learning Disability (3837)
SpeechLanguage Impairment (52)
Traumatic Brain Injury (33)
Visual Impairment (26)
303
131
149
401
152
73
33
41
86 276 78 86
316 298 105 53
79
23
216
36
241
94
137
36
149
273
147
286
85
70
78
71
378
299
27
400
162
44
27
51
38 346 115
229
538
461
346
60
38
58
364
423
182
192
152
77
61
77
Enrolled In Higher Education Competitive Employment Enrolled In Other Postsecondary Education Or Training Some Other Employment
49
Pride
Self-Advocate o o gt i-i--o o
0
0
0
00 C 0
0
PATH TO DISABILITY
PRIDE
New Insights for Building Disability Pride and Empowering Students with Hidden Disabilities
0 0
0 0
0
0 0
0
PATH OF DISABILITY
SHAME 0
Disability Shame
Positive Student Outcomes
50
Resources
bull Review the student list to see if students can be excluded from having the PSO Survey administered (ie re-enrolled)
bull Grandparentsfriends are great resources
bull Update contact list as much as possible
bull Any parentstudent meeting (ie IEP progress parent conferences)
bull Some districts have used social media to contact hard to reach youth
bull Consider teachertransition specialist stipends
bull Make contact with families as often as possible
bull Email-to-text message
bull Strategies for Increasing Response Rates
bull Strategies for Contacting Hard-to-Find Youth
51
Resources
bull Arizona Department of Education (Search PSO Transitions ECAP AZCIS Arizona Community of Practice on Transition-AZCoPT)
bull Secondary Transition
bull ECAP-Education and Career Action Plan
bull AZCIS-Arizona Career Information System
bull AZCoPT-Arizona Community of Practice On Transition
bull NTACT-National Technical Assistance on Transition
bull Career One Stop (Your Source for Career Exploration)
bull My Futurecom (Figure out whatrsquos next)
52
June through September 2017 Survey Participants
bull 276 PEAs (districts and charter schools) WILL BE included in the reported data
bull Per SAIS the total number of exiters (youth who graduated aged out or dropped out) who ARE eligible to take the PSO Survey = 9701
53
ldquoUnengagedrdquo Characteristics
bull Of the 1584 individuals counted in the non-engaged category 1183 did not attempt any post secondary educationtraining or employment
bull However 401 respondents (25) indicated that they attempted post secondary educationtraining or employment but did not meet the criteria to be counted in an engagement category
bull If those 401 youth who attempted engagement had been successful engagement rate would have increased from 75 to 81
54
PSO Assistance
Contact Information bull Jay Johnson
bull JayJohnsonazedgov
bull PSO E-mail bull PSOInboxazedgov
55
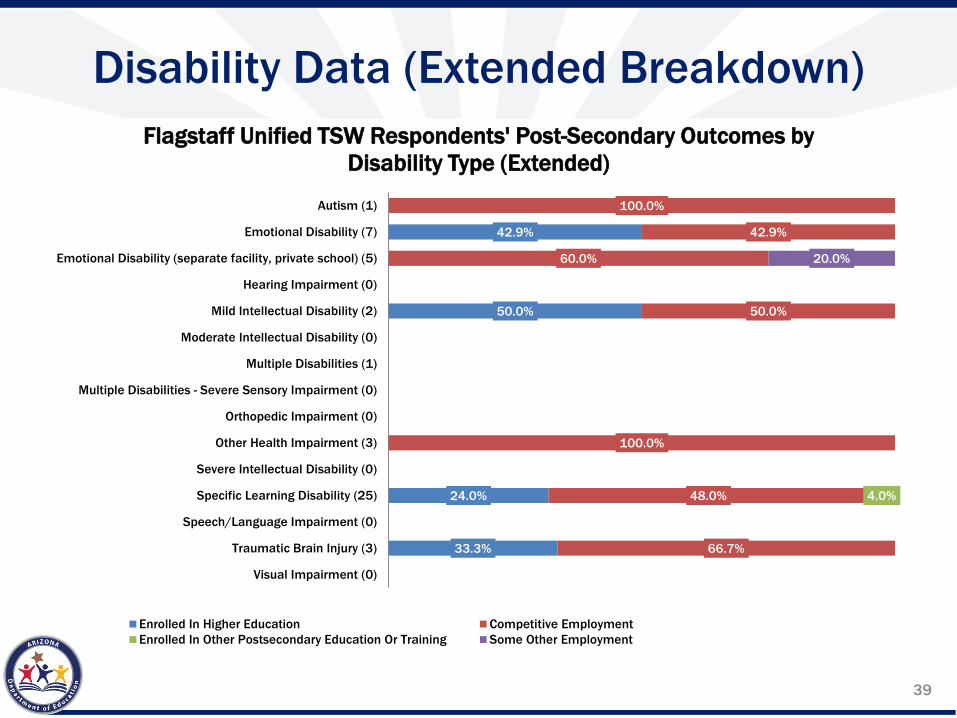
bull bull bull bull
Disability Data (Extended Breakdown) Flagstaff Unified No TSW Respondents Post-Secondary Outcomes
by Disability Type (Extended)
Autism (0)
Emotional Disability (5)
Emotional Disability (separate facility private school) (3)
Hearing Impairment (0)
Mild Intellectual Disability (2)
Moderate Intellectual Disability (0)
Multiple Disabilities (0)
Multiple Disabilities - Severe Sensory Impairment (0)
Orthopedic Impairment (0)
Other Health Impairment (3)
Severe Intellectual Disability (0)
Specific Learning Disability (49)
SpeechLanguage Impairment (0)
Traumatic Brain Injury (0)
Visual Impairment (0)
600
667
200
333
333 667
286 551 61 61
Enrolled In Higher Education Competitive Employment Enrolled In Other Postsecondary Education Or Training Some Other Employment
40
bull bull
National Longitudinal Transition Study (NLTS2) - 2012
N=305000 Students
Graduation Post-Secondary Paying Job AT 100 81 80 No AT 80 40 51
100
81 8080
40
51
0
20
40
60
80
100
120
National Longitudinal Transition Study 41
Reviewing Data
bull Local AT Data and National Longitudinal Transition Study bull 2012 National Longitudinal Transition Study
bull 809 Students with AT attended higher Ed bull 401 Students who did not receive AT Higher Ed bull 78 of students with high-incidence disabilities reported
receiving AT in high school
bull 2014-2015 AT Loan Library Data bull 144 High School Requests bull Coconino County 19 of all AT Loan Library Requests bull Higher Education in Coconino County 30 bull Higher Education in Arizona 22
42
Local Example bull Spring 2017 to Spring 2018 Planning
bull PSO Data and Not Engaged Students bull Training Staff
bull Training staff to use AT (Assistive Technology) and create AT Implementation Plan
bull Used ldquoA Student Handbook for Choosing and Using ATrdquo bull Providing self-advocacy skills and sense of pride bull Use AT Loan Library and AzTAP Loan Library bull New Apps Clips or CADET for Captioning for all Students
bull Connected High School CTE (Career and Technical Education) Program with College Level CTE Program bull Connecting to Community and self-disclosure
bull Connected Counseling Department and Transition Department (Connecting Community)
43
Inform and align
Multiple-Measure Accountablllty bull Multiple measures
of CCR bull Continuum of
readiness indicators bull Usable data
Well-Rounded Education bull Enriched accelerated
curricula and educational experiences
bull Improved conditions for learning
t State CCR Definition
bull Academic readiness
bull Nonacademic readiness
Inform and allgn
Purposeful Assessment bull Balanced assessment
systems bull Design and delivery for
meaningful results bull Measuring nonacademic
readiness
How PSO Can Improve Programming
College amp Career Readiness and Success Center 44
bull bull
Disability Data (Extended Breakdown) Flagstaff Unified Respondents Post-Secondary Outcomes by
Disability Type Engaged vs Not Engaged (Extended)
Autism (1)
Emotional Disability (12)
Emotional Disability (separate facility private school) (8)
Hearing Impairment (0)
Mild Intellectual Disability (4)
Moderate Intellectual Disability (0)
Multiple Disabilities (1)
Multiple Disabilities - Severe Sensory Impairment (0)
Orthopedic Impairment (0)
Other Health Impairment (6)
Severe Intellectual Disability (0)
Specific Learning Disability (74)
SpeechLanguage Impairment (0)
Traumatic Brain Injury (3)
Visual Impairment (0)
1000
833
875
500
167
125
500
1000
1000
892 108
1000
Engaged Not Engaged
45
bull bull bull bull
Disability Data (Extended Breakdown) Flagstaff Unified Respondents Post-Secondary Outcomes by
Disability Type (Extended)
Autism (1)
Emotional Disability (12)
Emotional Disability (separate facility private school) (8)
Hearing Impairment (0)
Mild Intellectual Disability (4)
Moderate Intellectual Disability (0)
Multiple Disabilities (1)
Multiple Disabilities - Severe Sensory Impairment (0)
Orthopedic Impairment (0)
Other Health Impairment (6)
Severe Intellectual Disability (0)
Specific Learning Disability (74)
SpeechLanguage Impairment (0)
Traumatic Brain Injury (3)
Visual Impairment (0)
1000
250 500
625
83
125 125
250 250
167 833
270 527 54 41
333 667
Enrolled In Higher Education Competitive Employment Enrolled In Other Postsecondary Education Or Training Some Other Employment
46
Post-School (PSO) Outcomes for School Year Exiters 2014-2015
Tips about Student Engagement You Need To Know
Southern District Perspective
State of Arizona 2016 PSO Survey
Jay Johnson Education Program Specialist
PSO Initiatives
Disability Data (Extended Breakdown) Arizona Post-Secondary Outcomes by Disability Type
Engaged vs Not Engaged (Extended)
Autism (455)
Emotional Disability (466)
Emotional Disability (separate facility private school) (116)
Hearing Impairment (57)
Mild Intellectual Disability (316)
Moderate Intellectual Disability (128)
Multiple Disabilities (102)
Multiple Disabilities - Severe Sensory Impairment (28)
Orthopedic Impairment (37)
Other Health Impairment (653)
Severe Intellectual Disability (26)
Specific Learning Disability (3837)
SpeechLanguage Impairment (52)
Traumatic Brain Injury (33)
Visual Impairment (26)
637
646
526
772
554
461
578
429
595
363
354
474
228
446
539
422
571
405
793
500
808
923
758
769
207
500
192
77
242
231
Engaged Not Engaged
48
bull bull bull bull
Disability Data (Extended Breakdown) Arizona Post-Secondary Outcomes by Disability Type (Extended)
Autism (455)
Emotional Disability (466)
Emotional Disability (separate facility private school) (116)
Hearing Impairment (57)
Mild Intellectual Disability (316)
Moderate Intellectual Disability (128)
Multiple Disabilities (102)
Multiple Disabilities - Severe Sensory Impairment (28)
Orthopedic Impairment (37)
Other Health Impairment (653)
Severe Intellectual Disability (26)
Specific Learning Disability (3837)
SpeechLanguage Impairment (52)
Traumatic Brain Injury (33)
Visual Impairment (26)
303
131
149
401
152
73
33
41
86 276 78 86
316 298 105 53
79
23
216
36
241
94
137
36
149
273
147
286
85
70
78
71
378
299
27
400
162
44
27
51
38 346 115
229
538
461
346
60
38
58
364
423
182
192
152
77
61
77
Enrolled In Higher Education Competitive Employment Enrolled In Other Postsecondary Education Or Training Some Other Employment
49
Pride
Self-Advocate o o gt i-i--o o
0
0
0
00 C 0
0
PATH TO DISABILITY
PRIDE
New Insights for Building Disability Pride and Empowering Students with Hidden Disabilities
0 0
0 0
0
0 0
0
PATH OF DISABILITY
SHAME 0
Disability Shame
Positive Student Outcomes
50
Resources
bull Review the student list to see if students can be excluded from having the PSO Survey administered (ie re-enrolled)
bull Grandparentsfriends are great resources
bull Update contact list as much as possible
bull Any parentstudent meeting (ie IEP progress parent conferences)
bull Some districts have used social media to contact hard to reach youth
bull Consider teachertransition specialist stipends
bull Make contact with families as often as possible
bull Email-to-text message
bull Strategies for Increasing Response Rates
bull Strategies for Contacting Hard-to-Find Youth
51
Resources
bull Arizona Department of Education (Search PSO Transitions ECAP AZCIS Arizona Community of Practice on Transition-AZCoPT)
bull Secondary Transition
bull ECAP-Education and Career Action Plan
bull AZCIS-Arizona Career Information System
bull AZCoPT-Arizona Community of Practice On Transition
bull NTACT-National Technical Assistance on Transition
bull Career One Stop (Your Source for Career Exploration)
bull My Futurecom (Figure out whatrsquos next)
52
June through September 2017 Survey Participants
bull 276 PEAs (districts and charter schools) WILL BE included in the reported data
bull Per SAIS the total number of exiters (youth who graduated aged out or dropped out) who ARE eligible to take the PSO Survey = 9701
53
ldquoUnengagedrdquo Characteristics
bull Of the 1584 individuals counted in the non-engaged category 1183 did not attempt any post secondary educationtraining or employment
bull However 401 respondents (25) indicated that they attempted post secondary educationtraining or employment but did not meet the criteria to be counted in an engagement category
bull If those 401 youth who attempted engagement had been successful engagement rate would have increased from 75 to 81
54
PSO Assistance
Contact Information bull Jay Johnson
bull JayJohnsonazedgov
bull PSO E-mail bull PSOInboxazedgov
55

bull bull
National Longitudinal Transition Study (NLTS2) - 2012
N=305000 Students
Graduation Post-Secondary Paying Job AT 100 81 80 No AT 80 40 51
100
81 8080
40
51
0
20
40
60
80
100
120
National Longitudinal Transition Study 41
Reviewing Data
bull Local AT Data and National Longitudinal Transition Study bull 2012 National Longitudinal Transition Study
bull 809 Students with AT attended higher Ed bull 401 Students who did not receive AT Higher Ed bull 78 of students with high-incidence disabilities reported
receiving AT in high school
bull 2014-2015 AT Loan Library Data bull 144 High School Requests bull Coconino County 19 of all AT Loan Library Requests bull Higher Education in Coconino County 30 bull Higher Education in Arizona 22
42
Local Example bull Spring 2017 to Spring 2018 Planning
bull PSO Data and Not Engaged Students bull Training Staff
bull Training staff to use AT (Assistive Technology) and create AT Implementation Plan
bull Used ldquoA Student Handbook for Choosing and Using ATrdquo bull Providing self-advocacy skills and sense of pride bull Use AT Loan Library and AzTAP Loan Library bull New Apps Clips or CADET for Captioning for all Students
bull Connected High School CTE (Career and Technical Education) Program with College Level CTE Program bull Connecting to Community and self-disclosure
bull Connected Counseling Department and Transition Department (Connecting Community)
43
Inform and align
Multiple-Measure Accountablllty bull Multiple measures
of CCR bull Continuum of
readiness indicators bull Usable data
Well-Rounded Education bull Enriched accelerated
curricula and educational experiences
bull Improved conditions for learning
t State CCR Definition
bull Academic readiness
bull Nonacademic readiness
Inform and allgn
Purposeful Assessment bull Balanced assessment
systems bull Design and delivery for
meaningful results bull Measuring nonacademic
readiness
How PSO Can Improve Programming
College amp Career Readiness and Success Center 44
bull bull
Disability Data (Extended Breakdown) Flagstaff Unified Respondents Post-Secondary Outcomes by
Disability Type Engaged vs Not Engaged (Extended)
Autism (1)
Emotional Disability (12)
Emotional Disability (separate facility private school) (8)
Hearing Impairment (0)
Mild Intellectual Disability (4)
Moderate Intellectual Disability (0)
Multiple Disabilities (1)
Multiple Disabilities - Severe Sensory Impairment (0)
Orthopedic Impairment (0)
Other Health Impairment (6)
Severe Intellectual Disability (0)
Specific Learning Disability (74)
SpeechLanguage Impairment (0)
Traumatic Brain Injury (3)
Visual Impairment (0)
1000
833
875
500
167
125
500
1000
1000
892 108
1000
Engaged Not Engaged
45
bull bull bull bull
Disability Data (Extended Breakdown) Flagstaff Unified Respondents Post-Secondary Outcomes by
Disability Type (Extended)
Autism (1)
Emotional Disability (12)
Emotional Disability (separate facility private school) (8)
Hearing Impairment (0)
Mild Intellectual Disability (4)
Moderate Intellectual Disability (0)
Multiple Disabilities (1)
Multiple Disabilities - Severe Sensory Impairment (0)
Orthopedic Impairment (0)
Other Health Impairment (6)
Severe Intellectual Disability (0)
Specific Learning Disability (74)
SpeechLanguage Impairment (0)
Traumatic Brain Injury (3)
Visual Impairment (0)
1000
250 500
625
83
125 125
250 250
167 833
270 527 54 41
333 667
Enrolled In Higher Education Competitive Employment Enrolled In Other Postsecondary Education Or Training Some Other Employment
46
Post-School (PSO) Outcomes for School Year Exiters 2014-2015
Tips about Student Engagement You Need To Know
Southern District Perspective
State of Arizona 2016 PSO Survey
Jay Johnson Education Program Specialist
PSO Initiatives
Disability Data (Extended Breakdown) Arizona Post-Secondary Outcomes by Disability Type
Engaged vs Not Engaged (Extended)
Autism (455)
Emotional Disability (466)
Emotional Disability (separate facility private school) (116)
Hearing Impairment (57)
Mild Intellectual Disability (316)
Moderate Intellectual Disability (128)
Multiple Disabilities (102)
Multiple Disabilities - Severe Sensory Impairment (28)
Orthopedic Impairment (37)
Other Health Impairment (653)
Severe Intellectual Disability (26)
Specific Learning Disability (3837)
SpeechLanguage Impairment (52)
Traumatic Brain Injury (33)
Visual Impairment (26)
637
646
526
772
554
461
578
429
595
363
354
474
228
446
539
422
571
405
793
500
808
923
758
769
207
500
192
77
242
231
Engaged Not Engaged
48
bull bull bull bull
Disability Data (Extended Breakdown) Arizona Post-Secondary Outcomes by Disability Type (Extended)
Autism (455)
Emotional Disability (466)
Emotional Disability (separate facility private school) (116)
Hearing Impairment (57)
Mild Intellectual Disability (316)
Moderate Intellectual Disability (128)
Multiple Disabilities (102)
Multiple Disabilities - Severe Sensory Impairment (28)
Orthopedic Impairment (37)
Other Health Impairment (653)
Severe Intellectual Disability (26)
Specific Learning Disability (3837)
SpeechLanguage Impairment (52)
Traumatic Brain Injury (33)
Visual Impairment (26)
303
131
149
401
152
73
33
41
86 276 78 86
316 298 105 53
79
23
216
36
241
94
137
36
149
273
147
286
85
70
78
71
378
299
27
400
162
44
27
51
38 346 115
229
538
461
346
60
38
58
364
423
182
192
152
77
61
77
Enrolled In Higher Education Competitive Employment Enrolled In Other Postsecondary Education Or Training Some Other Employment
49
Pride
Self-Advocate o o gt i-i--o o
0
0
0
00 C 0
0
PATH TO DISABILITY
PRIDE
New Insights for Building Disability Pride and Empowering Students with Hidden Disabilities
0 0
0 0
0
0 0
0
PATH OF DISABILITY
SHAME 0
Disability Shame
Positive Student Outcomes
50
Resources
bull Review the student list to see if students can be excluded from having the PSO Survey administered (ie re-enrolled)
bull Grandparentsfriends are great resources
bull Update contact list as much as possible
bull Any parentstudent meeting (ie IEP progress parent conferences)
bull Some districts have used social media to contact hard to reach youth
bull Consider teachertransition specialist stipends
bull Make contact with families as often as possible
bull Email-to-text message
bull Strategies for Increasing Response Rates
bull Strategies for Contacting Hard-to-Find Youth
51
Resources
bull Arizona Department of Education (Search PSO Transitions ECAP AZCIS Arizona Community of Practice on Transition-AZCoPT)
bull Secondary Transition
bull ECAP-Education and Career Action Plan
bull AZCIS-Arizona Career Information System
bull AZCoPT-Arizona Community of Practice On Transition
bull NTACT-National Technical Assistance on Transition
bull Career One Stop (Your Source for Career Exploration)
bull My Futurecom (Figure out whatrsquos next)
52
June through September 2017 Survey Participants
bull 276 PEAs (districts and charter schools) WILL BE included in the reported data
bull Per SAIS the total number of exiters (youth who graduated aged out or dropped out) who ARE eligible to take the PSO Survey = 9701
53
ldquoUnengagedrdquo Characteristics
bull Of the 1584 individuals counted in the non-engaged category 1183 did not attempt any post secondary educationtraining or employment
bull However 401 respondents (25) indicated that they attempted post secondary educationtraining or employment but did not meet the criteria to be counted in an engagement category
bull If those 401 youth who attempted engagement had been successful engagement rate would have increased from 75 to 81
54
PSO Assistance
Contact Information bull Jay Johnson
bull JayJohnsonazedgov
bull PSO E-mail bull PSOInboxazedgov
55
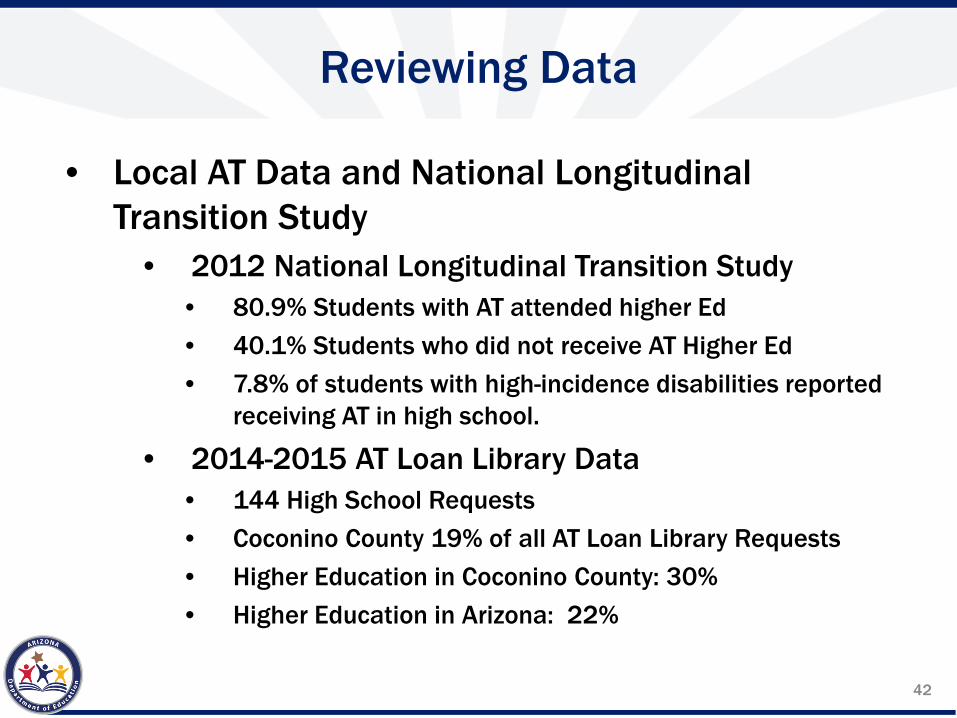
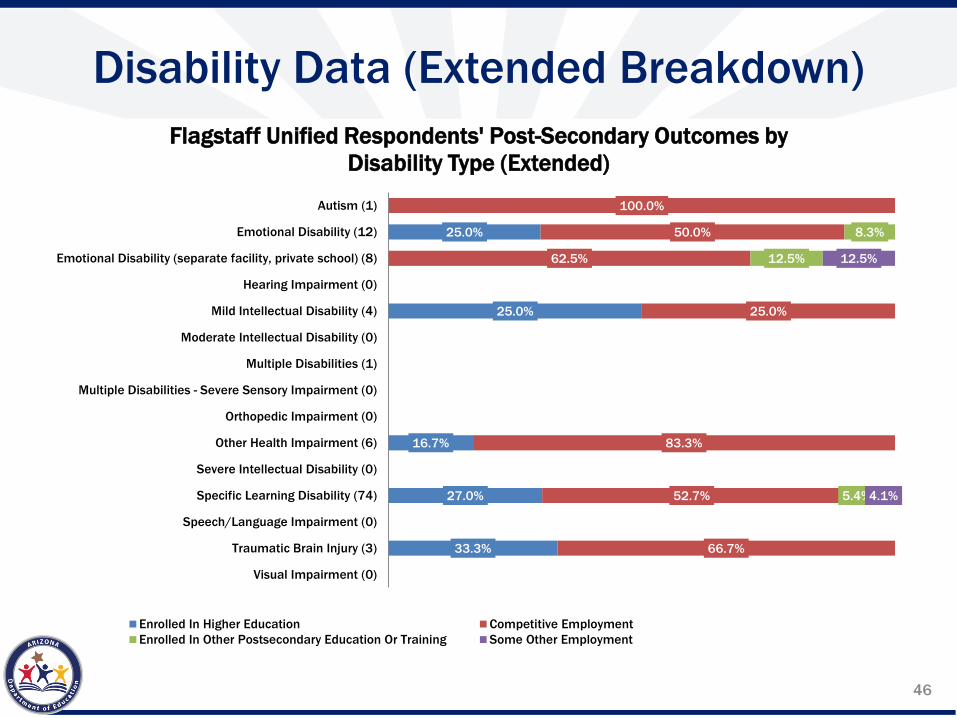
bull bull bull bull
Disability Data (Extended Breakdown) Flagstaff Unified Respondents Post-Secondary Outcomes by
Disability Type (Extended)
Autism (1)
Emotional Disability (12)
Emotional Disability (separate facility private school) (8)
Hearing Impairment (0)
Mild Intellectual Disability (4)
Moderate Intellectual Disability (0)
Multiple Disabilities (1)
Multiple Disabilities - Severe Sensory Impairment (0)
Orthopedic Impairment (0)
Other Health Impairment (6)
Severe Intellectual Disability (0)
Specific Learning Disability (74)
SpeechLanguage Impairment (0)
Traumatic Brain Injury (3)
Visual Impairment (0)
1000
250 500
625
83
125 125
250 250
167 833
270 527 54 41
333 667
Enrolled In Higher Education Competitive Employment Enrolled In Other Postsecondary Education Or Training Some Other Employment
46
Post-School (PSO) Outcomes for School Year Exiters 2014-2015
Tips about Student Engagement You Need To Know
Southern District Perspective
State of Arizona 2016 PSO Survey
Jay Johnson Education Program Specialist
PSO Initiatives
Disability Data (Extended Breakdown) Arizona Post-Secondary Outcomes by Disability Type
Engaged vs Not Engaged (Extended)
Autism (455)
Emotional Disability (466)
Emotional Disability (separate facility private school) (116)
Hearing Impairment (57)
Mild Intellectual Disability (316)
Moderate Intellectual Disability (128)
Multiple Disabilities (102)
Multiple Disabilities - Severe Sensory Impairment (28)
Orthopedic Impairment (37)
Other Health Impairment (653)
Severe Intellectual Disability (26)
Specific Learning Disability (3837)
SpeechLanguage Impairment (52)
Traumatic Brain Injury (33)
Visual Impairment (26)
637
646
526
772
554
461
578
429
595
363
354
474
228
446
539
422
571
405
793
500
808
923
758
769
207
500
192
77
242
231
Engaged Not Engaged
48
bull bull bull bull
Disability Data (Extended Breakdown) Arizona Post-Secondary Outcomes by Disability Type (Extended)
Autism (455)
Emotional Disability (466)
Emotional Disability (separate facility private school) (116)
Hearing Impairment (57)
Mild Intellectual Disability (316)
Moderate Intellectual Disability (128)
Multiple Disabilities (102)
Multiple Disabilities - Severe Sensory Impairment (28)
Orthopedic Impairment (37)
Other Health Impairment (653)
Severe Intellectual Disability (26)
Specific Learning Disability (3837)
SpeechLanguage Impairment (52)
Traumatic Brain Injury (33)
Visual Impairment (26)
303
131
149
401
152
73
33
41
86 276 78 86
316 298 105 53
79
23
216
36
241
94
137
36
149
273
147
286
85
70
78
71
378
299
27
400
162
44
27
51
38 346 115
229
538
461
346
60
38
58
364
423
182
192
152
77
61
77
Enrolled In Higher Education Competitive Employment Enrolled In Other Postsecondary Education Or Training Some Other Employment
49
Pride
Self-Advocate o o gt i-i--o o
0
0
0
00 C 0
0
PATH TO DISABILITY
PRIDE
New Insights for Building Disability Pride and Empowering Students with Hidden Disabilities
0 0
0 0
0
0 0
0
PATH OF DISABILITY
SHAME 0
Disability Shame
Positive Student Outcomes
50
Resources
bull Review the student list to see if students can be excluded from having the PSO Survey administered (ie re-enrolled)
bull Grandparentsfriends are great resources
bull Update contact list as much as possible
bull Any parentstudent meeting (ie IEP progress parent conferences)
bull Some districts have used social media to contact hard to reach youth
bull Consider teachertransition specialist stipends
bull Make contact with families as often as possible
bull Email-to-text message
bull Strategies for Increasing Response Rates
bull Strategies for Contacting Hard-to-Find Youth
51
Resources
bull Arizona Department of Education (Search PSO Transitions ECAP AZCIS Arizona Community of Practice on Transition-AZCoPT)
bull Secondary Transition
bull ECAP-Education and Career Action Plan
bull AZCIS-Arizona Career Information System
bull AZCoPT-Arizona Community of Practice On Transition
bull NTACT-National Technical Assistance on Transition
bull Career One Stop (Your Source for Career Exploration)
bull My Futurecom (Figure out whatrsquos next)
52
June through September 2017 Survey Participants
bull 276 PEAs (districts and charter schools) WILL BE included in the reported data
bull Per SAIS the total number of exiters (youth who graduated aged out or dropped out) who ARE eligible to take the PSO Survey = 9701
53
ldquoUnengagedrdquo Characteristics
bull Of the 1584 individuals counted in the non-engaged category 1183 did not attempt any post secondary educationtraining or employment
bull However 401 respondents (25) indicated that they attempted post secondary educationtraining or employment but did not meet the criteria to be counted in an engagement category
bull If those 401 youth who attempted engagement had been successful engagement rate would have increased from 75 to 81
54
PSO Assistance
Contact Information bull Jay Johnson
bull JayJohnsonazedgov
bull PSO E-mail bull PSOInboxazedgov
55
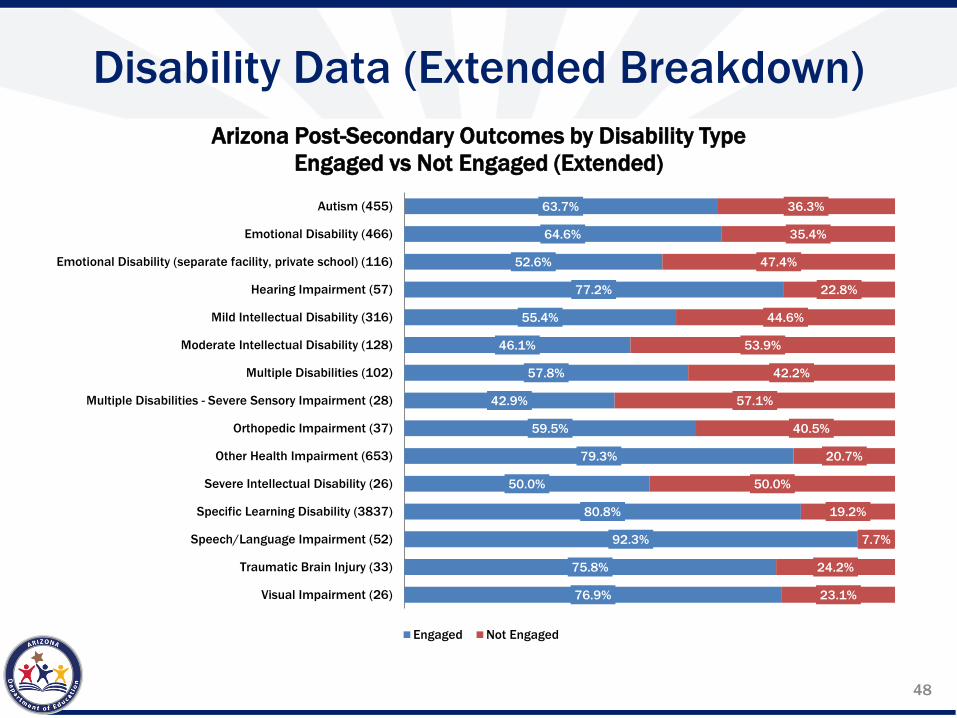

Resources
bull Arizona Department of Education (Search PSO Transitions ECAP AZCIS Arizona Community of Practice on Transition-AZCoPT)
bull Secondary Transition
bull ECAP-Education and Career Action Plan
bull AZCIS-Arizona Career Information System
bull AZCoPT-Arizona Community of Practice On Transition
bull NTACT-National Technical Assistance on Transition
bull Career One Stop (Your Source for Career Exploration)
bull My Futurecom (Figure out whatrsquos next)
52
June through September 2017 Survey Participants
bull 276 PEAs (districts and charter schools) WILL BE included in the reported data
bull Per SAIS the total number of exiters (youth who graduated aged out or dropped out) who ARE eligible to take the PSO Survey = 9701
53
ldquoUnengagedrdquo Characteristics
bull Of the 1584 individuals counted in the non-engaged category 1183 did not attempt any post secondary educationtraining or employment
bull However 401 respondents (25) indicated that they attempted post secondary educationtraining or employment but did not meet the criteria to be counted in an engagement category
bull If those 401 youth who attempted engagement had been successful engagement rate would have increased from 75 to 81
54
PSO Assistance
Contact Information bull Jay Johnson
bull JayJohnsonazedgov
bull PSO E-mail bull PSOInboxazedgov
55

PSO Assistance
Contact Information bull Jay Johnson
bull JayJohnsonazedgov
bull PSO E-mail bull PSOInboxazedgov
55
Recommended