POLLUTION PREVENTION STUDIES IN THETEXTILE WET PROCESSING INDUSTRY
Submitted by:Ms. Ilse Hendrickx, Graduate Research Assistant
andGregory D. Boardman, Associate Professor
Department of Civil EngineeringVPI&SU
Blacksburg, Virginia 24061
Submitted to:
Department of Environmental QualityOffice of Pollution Prevention
629 E. Main StreetRichmond, Virginia 23240
May 1995

POLLUTION PREVENTION STUDIES IN THETEXTILE WET PROCESSING INDUSTRY
Ilse Hendrickx and Gregory BoardmanDepartment of Civil Engineering
VPI&SUBlacksburg, Virginia 24061
ABSTRACT
The objective of this study was to investigate pollution prevention (P2)opportunities in the textile wet processing industry. This industry uses vast amounts ofwater, energy and chemicals. P2 audits were conducted at four textile companies. Thecompanies were located in Virginia and included: a denim and soft wash laundry; afiberglass yarn processing plant; a cotton fabric dyeing and printing plant; and a nylonyarn dyeing and finishing plant.
Each company was visited several times. Information about the operations,consumption of water, energy and chemicals were obtained by interviewing personnel.Information about wastewater characteristics, permit applications, water treatment anddisposal records were obtained from the plant’s records. Wastewater samples from severaloperations were analyzed for COD, DOC, color, TSS, pH and temperature. Lead, copper,zinc and chromium concentrations were also determined.
The collected information was used to make recommendations to the managementof each plant concerning possible implementations. Reusing non-contact cooling waterat the fiberglass processing plant will reduce the water consumption by 76% and resultsin a savings of $99,400 per year, if an additional chilling unit is not needed. There wereseveral possibilities to reduce the consumption of water, energy and chemicals at thecotton dyeing and printing mill. Implementing counter-current flow between bleachwashers will save $ 154,000 per year due to reduced consumption of water and energy.The savings will be $ 336,000 per year if the existing washers are replaced by moreefficient washers. Improving the wash schedules and communication with clients at thelaundry will reduce the consumption of water and chemicals. Dyebath reuse and counter-current flow of rinse waters were recommended for the nylon yam dyeing and finishingm i l l .

ACKNOWLEDGEMENTS
The authors would like to acknowledge the financial support and guidanceprovided by the Office of Pollution Prevention of the Virginia Department ofEnvironmental Quality (DEQ) for this study. We would also very much like to thankthe kind and considerate personnel of the textile companies that participated in thisstudy.
. . .111


CHAPTER 1: INTRODUCTION
Dyes and auxiliary chemicals used in textile mills are developed to be resistant to
environmental influences. As a result, they are hard to remove from wastewater
generated during the dyeing processes. The best way to reduce the impact of these dyes
and chemicals on the environment is by reducing the amount released for treatment.
Furthermore, conventional waste treatment often causes only a transfer of waste from one
phase to another. Treatment usually results in the generation of solids, sometimes
hazardous, which are buried in a landfill. Disposal of waste in a landfill can result in
groundwater contamination, gas formation and problems with odors. In other words,
waste treatment is not necessarily a cure. As regulations’ become more stringent,
companies are forced toward more technologically sophisticated treatment methods. This
results in an increased cost for waste management and sometimes forces companies to go
out of business. More and more companies realize that reducing the waste at the source
is necessary to reduce the cost of treatment.
In 1990, Congress passed the Pollution Prevention Act. This act reaffirms the
federal objective of the Emergency Planning and Community Right-To-Know Act (Title
III of SARA of 1986).
Pollution prevention (P2) is defined as those measures that eliminate or reduce
pollution prior to off-site recycling or treatment. Pollution prevention does not only
reduce water pollution, but also minimizes the release of pollutants to land and air. In
the Pollution Prevention Act, the Congress defines a multimedia waste management
hierarchy. Source reduction stands at the top of the waste management hierarchy and is
followed by reuse and on-site recycling. Off-site recycling is not considered a pollution
prevention measure. Treatment and safe disposal are listed at the bottom of the hierarchy
(Smith, 1989a).
Reducing the volume of waste released through P2 can be accomplished by
conservation and more efficient use of resources. Source reduction can be achieved by
1

the following techniques: optimization/conservation of chemicals, chemical substitution,
process modification, equipment modification and improved maintenance and
housekeeping.
The objective of this research was to investigate pollution prevention opportunities
in the textile wet processing industry. This was achieved through an extensive literature
review and P2 audits performed at textile companies. In the literature review, the
different textile wet processing operations are briefly discussed, and a description of
various source reduction techniques is provided. Many articles were found that provide
examples of source reduction measures successfully implemented at textile mills. These
articles were used to clarify the concepts and benefits associated with P2.
In the second part of the study, P2 audits were conducted at four textile mills.
The companies included in this study cover a wide range of plants in the textile wet
processing industry. The mills are all located in Virginia and include:
1.
2.
3.
A stone and soft washing laundry. This laundry washes denim products,
cotton apparel and hats.
A large fiberglass processing plant. The mill receives fiberglass yarn,
weaves it into a woven fabric, and applies special finishes.
A large cotton printing, dyeing and finishing facility. Pure cotton and
polyester/cotton blend fabric are received from weaving mills all over
the world.
4. A nylon yarn dyeing and finishing facility. The processed yarn is used for
the production of industrial carpets.
Each plant was visited several times over the course of the P2 audit. The study
was conducted by touring the production facility of the plant, interviewing employees,
observing daily operations and reviewing existing information. Wastewater samples of
several operations were analyzed to evaluate the possibility of reusing or recycling water.
2

Most of the mills in this study use large amounts of energy for drying operations and the
production of steam and hot water. As a result, large amounts of energy are lost through
stacks and wastewater-s. Where possible, heat recovery opportunities were investigated.
The information collected at the plants was used to make recommendations to
management concerning the possible implementations of P2 measures.
3

CHAPTER 2: LITERATURE REVIEW
2.1 TEXTILE PROCESSING
The textile industry includes a variety of processes ranging from the manufacture
of synthetic fibers and fabric production to retail sales. The first step in the production
of a textile product is the manufacture of fibers or, in the case of natural fibers, the
manipulation of these fibers into useful fibers. Afterward, the fibers are turned into yarn
by spinning or texturing. preparation, dyeing and finishing can be done on yarn or on
the textile product obtained through knitting, weaving, and non-woven techniques. The
last step is the fabrication of a finished product.
The preparation, dyeing and finishing of textile products consume large amounts
of energy, chemicals and water. These wet-processing operations require the use of
several chemical baths that, often at elevated temperature, give the desired characteristics
to the yam or fabric. This section describes the different wet-processing techniques used
in the production of cotton fabric. The same techniques are used when other types of
fiber are processed, but differences will occur in the amount of raw materials required.
Cotton has been chosen for this literature review because 70% by weight of the fibers
processed in the United States are cotton fibers. Furthermore, processing natural fibers
requires more processing than manufactured fibers. It is important to know that
significant differences exist between mills processing the same fabric using the same
techniques. For example, one mill might operate its rinsing baths at a higher temperature
than another mill thereby reducing the water consumption.
2.1.1 Cotton
The sequence for cotton wet processing is schematically represented in Figure 2.1
(Snowden-Swan, 1995). These processes are usually done in batch, continuous or semi-
4

continuous systems. In batch systems, the machine is loaded with a fixed amount of
fabric, chemical solutions are added, and the process is conducted. After processing, the
chemical bath is discharged, and the fabric is washed. Subsequent processing is usually
done in the same machine. In continuous systems, the chemical mix is placed in pans,
and the fabric runs through the machine continuously.
Figure 2.1: Sequence for Textile Wet Processing (Snowden-Swan, 1995).
Cotton wet processing can be divided into three steps. Preparation removes all the
natural impurities from the cotton and chemical residuals from previous processing.
Natural impurities include waxes, oils, proteins, mineral matter and residuals seeds. The
cotton contains a significant amount of contaminants resulting from the widespread use
of fertilizers, insecticides and fungicides. Previous knitting or weaving processes leave

residuals of knitting oils and sizing chemicals on the surface of the cotton fibers. All
these impurities must be removed before dyeing, because they can interfere with the
dyeing process. Insufficient preparation can result in an uneven dyeing, can cause
spotting or can even damage the fabric permanently.
Sizing
During sizing, chemicals are applied to the yam before the production of a woven
fabric. Substances such as starch, polyvinyl alcohol (PVA), polyvinyl acetate,
carboxymethyl cellulose (CMC) and gums enhance the tensile strength and smoothness
of the warp yarn so it can withstand the mechanical forces during weaving. The
commonly used sizing materials for cotton are starch, polyvinyl alcohol (PVA), and
carboxymethyl cellulose (CMC). Yams used for the production of knitted fabric are
usually treated with waxes or lubricants. (Jones, 1973)
Singeing
Singeing is a processing step that removes surface fibers from woven fabric.
These surface fibers form small fiber balls on the cloth after being washed several times.
Many different systems are available but usually the goods pass through gas-fired burners
at high speed. For woven materials, this is the first processing step. (Dickinson, 1986)
Desizing
After the weaving process, the sizes have to be removed from the fabric because
they interfere with subsequent processing steps. Sizes have, in general, a high biological
oxygen demand (BOD) and will contribute significantly to the waste load of the mill’s
effluent. In 1990, W. B. Achwal reported that waste stream of the desizing operation can
contribute up to 50% of the total pollution load of a mill’s wastewater.
Three methods frequently used in textile processing are acid desizing, enzyme
desizing, and oxidative desizing. The goal of these different methods is to hydrolyze the
6

starch. Unlike starch, synthetic starches stay intact during desizing, can be recovered and
reused. ( Correia et al, 1994)
Scouring is typically performed in an alkaline solution and high temperature
environment. The removal of natural impurities is based upon saponification at high pH.
Soaps and detergents added during scouring may precipitate with calcium, magnesium and
iron(3+) if present. These metals are therefore removed by the addition of reducing and
sequestering agents. The sequesterants will form strong complexes with calcium,
magnesium and iron (2+) at high pH. The reducing agents are added to reduce Fe3+ to
Fe2+. The removal of natural impurities can be done in a single process or can be
combined with desizing and/or bleaching. The use of sequestering and reducing agents
can be avoided when softened water is used. Scouring is usually the first step in the
processing of knitted goods and will remove the knitting oils which were applied to the
yarn prior to knitting. (Jones, 1973)
Bleaching
Almost all fabric containing cellulosics are being bleached to remove the natural
colored matter. Three chemicals are commonly used: hydrogen peroxide, sodium
hypochlorite and sodium chlorite. In sodium hypochlorite bleaching, the washed, and
scoured fabric is passed through a dilute sodium hypochlorite bath for impregnation
(saturator) and stored in a J-box or a large pit. After bleaching, the goods are washed and
treated with antichlor (NaHSO3) to remove any traces of bleach. Bleaching with sodium
chlorite is most efficient at pH 4.02. However, chlorine dioxide, a gas with a low
threshold limit value for inhalation, is formed at this pH. Sufficient care must be taken
to protect operators from chlorine dioxide fumes. Hydrogen peroxide bleaching is carried
out under alkaline conditions. As a result, scouring and peroxide bleaching can often be
conducted in one step. During peroxide bleaching, stabilizers are added for two reasons.
7

Stabilizers inactivate metal impurities that may cause catalytic decomposition of hydrogen
peroxide. They also act as buffers. A stabilizer frequently used is colloidal sodium
silicate. (Dickinson, 1986)
Mercerization is the treatment of pure cotton fabrics or yarn with a strong caustic
soda solution to improve strength, dye substantivity, strength and smoothness. Sufficient
washing is required after this step to remove any traces of caustic soda. (Correia et al,
1994)
Dyes can be divided into three classes based on their method of application. Fiber
reactive dyes react with functional groups in the fibers. This class includes acid, basic,
reactive, direct and mordant dyes. Reactive dyes are anionic dyes that form covalent
bonds with the hydroxyl groups in the cellulose. Acid dyes contain sulfonic groups.
These dyes are rarely used in cotton dyeing, but are commonly used on nylon and wool.
They attach to organic fibers under acidic conditions. Direct dyes are often used in cotton
dyeing. They are applied to the yam under neutral conditions. Mordant dyes are acid
dyes Which are reacted with a metal salt prior to dyeing. The second class of dyes needs
chemical reaction before application. Vat dyes are soluble in their reduced form. They
are made insoluble by oxidation after they are applied to organic fibers. Sulfur dyes are
also made insoluble through oxidation. The third dye class are special dyes such as
disperse, solvent, and natural dyes and pigments. Disperse dyes are water insoluble and
are used for most synthetic fibers. They contain anthraquinone or azo groups. Solvent
dyes have an improved solubility in solvents. Pigments are set to the fabric by an
adhesive. Dyes most commonly applied to cotton are reactive and direct dyes.
Cotton/polyester goods are dyed using reactive or direct dyes for the cotton portion of the
fabric and disperse dyes for the polyester. (Needles, 1986)
8

Like pretreatment, dyeing can be done in the batch or continuous mode.
Continuous dyeing is carried out by passing the fabric through a dyebath of sufficient
length. The dye is then fixed onto the fabric by steaming. Subsequently, the fabric is
washed to remove excess dye. Batch processes include beam, package, jig, and jet
dyeing. Pad-batch dyeing is a specialized technique for the application of reactive dyes
to cellulosic fibers. (Marchall, 1986)
Polyester and cotton have different characteristics and thus have different affinities
for different dye types. The two materials are therefore considered separately with respect
to dyeing operations. Due to the hydrophobic character of polyester, dyeing of this
material is enhanced by using water insoluble disperse dyes. These dyes are held in
suspension by a dispersant. In a typical batch dyeing sequence, the polyester is dyed at
elevated temperature. The machine is then cooled, and the exhausted dyebath is dropped
at the highest possible temperature. The machine is refilled with reactive dye solution
to dye the cotton portion of the fabric. After completion of the dyeing process the excess
dye is removed by dye-extraction and/or washing. (Marshall, 1986)
In printing, the print paste is very thick and viscous to prevent the migration of
the dye in the fabric. This makes it possible to create a pattern of colors on the fabric.
The paste is transferred onto the fabric using a rotary screen, flat screen or engraved rolls.
Other printing techniques use heat to transfer the dye to the fabric. When the different
colors are applied to the fabric, it is dried at high temperature to set the colors on the
fabric. (Needles, 1986)
Several auxiliary chemicals are added to the bath during the dyeing processes.
These chemicals can be divided into two groups: commodity chemicals and specialty
chemicals. Specialty chemicals are mixtures which have an unknown composition due
to proprietary information. The mixtures are often developed to solve problems specific
to the process. Some specialty chemicals are developed to counteract or enhance the
effects of other chemicals. In other cases, the specialty chemicals cause side effects that
are detrimental to the overall process. For example, wetting agents are often added to
9

preparation and dyeing steps to ensure penetration of chemicals. These wetting agents
contain surfactants which can result in excessive foaming. As a result, defoamers are
added to the chemical bath. A good example of a commodity chemical is sodium
hydroxide which is added to the dyebath when cotton is dyed with reactive dyes. The
presence of hydroxide ions opens the structure of the cotton. Salts are added to dyebaths,
because they will retard the rate of dyeing. This results in a more even dyeing. Other
chemicals commonly added are carriers, water softening chemicals, sequestering agents,
wetting agents and reducing agents. Table 2.1 gives a listing of chemicals often used
in the different processing steps. (Smith, 1989a)
Finishing operations change the properties of the fabric or yarn. They can increase
the softness, luster, and durability of textiles. Finishing can also improve the water
repelling and flame resistant properties of the fabric. The characteristics of textiles can
be altered by physical techniques (dry finishing processes) or by application of chemicals
(wet finishing processes). Luster can be added by both physical and chemical methods.
Characteristics like flame or water repellency can only be obtained by wet finishing.
(Needles, 1986)
2.1.2 Fiberglass
Fibers made from glass are completely inorganic and are used in a wide range of
industrial and aerospace applications. Fiberglass fabric is also used in cases where the
use of heat and flame resistant material is mandatory.
Glass fibers are essentially undyeable and special techniques must be applied if
dyeing is required. The fibers or fabric can be sized with a protein that is then
insolubilized and dyed with protein dyes. Under acidic conditions, the amino groups on
the proteins are present as NH3+ groups. These functional groups react with acid,reactive,
10

Table 2.1: Auxiliary Chemicals Used in Textile Wet Processing (Correia, 1994).
Description Composition Function Processing step
salts
Acids
Bases
Buffers
Sequestering agentsChelates
Surface active agents
Oxidizing agents
Reducing agents
Carriers
Sodium chloridesodium sulphate
Acetic acidSulfuric acid
Sodium hydroxidesodium carbonate
Phosphate
EDTA
Anionic, cationic andnon ionic
Hydrogen peroxideSodium nitrite
Sodium hydrosulphiteSodium sulphide
Phenyl phenols
Neutralize zeta potentialof the fiber, retarder
pH control
pH control
pH control
Complex hardnessRetarder
softenersDisperse dyesRegular dye applicationWetting agentsEmulsifiers
Insolubilize dyes
Solubilize dyesRemove unreacted dyes
Enhance absorption
Dyeing
PreparationDyeingFinishing
Dyeing
Dyeing
Dyeing
mordant and direct dyes. Another technique used for dyeing fiberglass fabric
is coronizing. This involves preheating the goods to temperature above 625OF to remove
all organic residues. Afterward, the fabric is dyed using pigments. (Needles, 1986)
2.1.3 Denim Processing
Denim is a woven fabric made from cotton. The warp yam is dyed before the
cotton is woven into denim. The fill or weft yarn, which is inserted in-between warp
yarn during weaving, is often not dyed. In the 1960’s and 1970’s some consumers wore
11

their new jeans wet to obtain a great fit. To achieve the aged look, new jeans were
bleached in buckets or washed up to 15 times before being worn for the first time. Since
the early 1980’s, these characteristics are given to the apparel in the factory or industrial
laundries. (Kessels and Sulzer, 1989)
The finishing processes give the following characteristics to the jeans (Scott
1990):
1. Remove the size that was applied to the garment during weaving.
2. Give the fabric the worn, abraded and aged look.
3. Stabilize shrinkage.
4. Soften the denim.
5. Remove color to a tone that is currently in fashion.
There are four basic forms of finishing processes in denim manufacturing. All
garments are prewashed to strip the sizing agents. This operation involves the use of an
enzyme stripper and alkaline detergent, a clear water rinse and one or more softeners.
The result is a soft, dark blue jeans that is preshrunk.
Some dark indigo color can be removed by the addition of sodium hypochlorite
during washing. The resulting color will range from light blue to almost white depending
on the amount of bleach added. After bleaching, the jeans are rinsed and treated with
antichlor to remove any traces of bleach. (Kron, 1998)
The use of bleach in denim finishing will remove some indigo but will not give
the apparel the worn, abraded look. The addition of stones will highlight the seams and
pockets and thus produce the same effect as long-term use. The size of the pumice stones
used in this process varies from gram size to stones with a diameter of 2”. This process
is labor intensive, because the pumice stones have to be removed from the pockets of
each pair of jeans. A worn look can also be achieved when adding certain enzymes to
the wash water. Laundry operators actually prefer to use enzymes. The stones put wear
12

and tear on the washing machines and create problems with TSS in the mill’s effluent.
However, many denim laundries, are commission laundries and their washing procedures
are dictated by the customer. They only use pumice stones when the customer asks for
them. (Olson, 1988)
In acid washing, the washers are filled with jeans and bleach soaked pumice
stones. This will create light spots when the stones touch the garments. The addition of
anticlor will stop the action of the bleach after the stones are removed from the washer.
(Greer and Turner, 1983)
Jeans finishing requires large amounts of water, energy and chemicals since the
garments are washed in small amounts. Also, each wash is followed by one or more
clear rinses. A typical denim finishing sequence is given in Table 2.2. This table also
gives a list of chemicals commonly used in the different washes. Other chemicals are
often added to improve the procedure. For example, some enzymes work optimally at
a slightly acidic pH.
2.2 WASTEWATER CHARACTERISTICS
Provost (1992) agreed with Smith (1989b) to divide waste in four different types:
hard-to-treat, highly dispersible, hazardous and toxic, and large volume wastes. Each of
these four waste types can be found in the textile industry, and they all have their specific
characteristics. Treatment is easiest if each waste is considered separately before being
combined.
Difficult-to-treat wastes may include dyes, metals, phenols, toxic compounds
and/or phosphates. This type of waste is resistant to conventional biological treatment,
can pass through the treatment system and end up in the receiving stream where it
sometimes causes toxic effects. It is therefore important to minimize through chemical
substitution the use of chemicals which result in difficult-to-treat wastes. If no useful
substitute can be found for the problem chemical(s), the chemical(s) should be reused,
13

Table 2.2: Typical Sequence Used in Denim Laundries.
washing step Chemicals
Prewash E n z y m e d e t e r g e n tRinse
BleachingRinse
Antichlor washRinse
Stone-washingRinse
Softener
sodium hypochlorite, detergent
Disodium thiosulfate
Stones and enzymes
Fabric softener
recycled or segregated from the main waste stream and treated separately.
Examples of highly dispersible wastes are lint, print paste and solvents. Lint and
print pastes can clog up pipes and pumps. Lint is easily removed by screens and/or
filters. Binders present in the print paste form gels and clog up drains. Normally, print
paste does not cause toxicity problems, but it does put a high organic load on the
treatment system. Problems associated with print paste can be reduced by making paste
in quantity only sufficient for a given job. Excess print paste can be recovered in the
concentrated form for recycle or reuse. For example, the water used to clean the rotary
print screens can be collected and used as makeup water for a water-based print of the
same color. The excess print paste can be treated with the solids removed from the
biological treatment system. Other highly dispersible wastes, like solvents, have value
and can be recovered through distillation, which reduces the costs of disposal and
purchasing new solvent.
Toxic and hazardous wastes are essentially hard-to-treat wastes. Smith separated
them from hard-to-treat wastes because of their potential environmental impact. They
include metals, chlorinated solvents, and non-biodegradable surfactants. The usage of
these chemicals should be avoided if possible and if used, they should be kept out of the
wastesteam through segregation. It is easier to treat wastes in their most concentrated
14

form. Metals can often be precipitated through the addition of chemicals. It is more
costs effective to treat a small concentrated waste stream than to treat the large combined
waste stream.
Large volume wastes can be found in any textile mill. They include wastewater
from the preparation of the substrate, rinsing and washing after dyeing operations and
waste from batch dyeing operations. These wastes are not heavily contaminated but can
put a burden on the hydraulic load of the treatment system. The volume discharged can
be reduced through reuse and recycling, process modifications and equipment changes.
2.3 POLLUTION PREVENTION OPPORTUNITIES
Source reduction assessment involves the analysis of the textile wet processing
operations to reveal measures that minimize substrate, chemical, water and energy
consumption. Substitution of chemicals, process modifications and technology changes
can increase the treatability of the wastewater and can also reduce the pollution load.
Good housekeeping and raw material control can help to solve certain problems. An
overview of pollution prevention techniques is given in Figure 2.2. In the EPA’s pollution
prevention hierarchy, off-site recycling is considered as treatment and not as pollution
prevention technique. This ‘section gives a description of different pollution prevention
techniques. Case studies are included to clarify the techniques. Pollution prevention may
result in several benefits for the textile processor, including:
1. loss reduction
2. reduction of chemical, water and energy consumption, thereby resulting in
savings, sometimes even increased production
3. reduced liability for waste produced
4. improved compliance with regulations
15

2.3.1 Raw Material Control
Raw materials used in the textile industry include processing water, dyes, process
chemicals (auxiliary chemicals) and substrate (yarn, fabric, etc.). These materials can
contain several contaminants. Some impurities, like traces of metals in dyes and in
auxiliary chemicals, result in undesirable wastes and/or in the use of extra chemicals. The
presence of calcium and magnesium in the scouring bath results in insufficient scouring.
Sequesterants added to this bath will form strong complexes with calcium, magnesium
and iron, and therefore improve scouring. Softening water through ion exchange
achieves the same effect and reduces the amount of sequestering and reducing agents
used.
Quality control of chemicals under consideration or chemicals used in the plant
minimizes hazardous waste generation. Quality control should be done on each shipment
of chemicals and can be achieved without a large capital investment. A good practice is
to compare each shipment with an established standard. The following set of simple tests,
developed by Smith (1987), is performed on a standard, and the results are kept on file.
The same tests are then conducted on each shipment of the chemical and the results
compared with these of the standard. Any significant variation in quality will be detected.
1. check the pH of the sample with paper or a pH-meter (checking the pH of
non-aqueous solution does not give useful results).
2. check the viscosity with Zahn cup.
3. check the density with hydrometer.
4. note the color and clarity visually.
5. note odor .
6. for clear liquids, check the index of refraction with handheld refractometer.
The above set of tests will detect variations in product quality. Some variations
16

Figure 2.2: Overview of Pollution Prevention Techniques.
are caused by a change in formulation of the product. Smith (1987) reported a chemical
manufacturer sold drums of decyl alcohol ethoxylate wetting agents and drums containing
a resinous fixative. Drums containing resinous fixative were mislabeled and sold as
wetting agent. This resulted in massive dye spots and reworks at the mill that used this
chemical in direct dyebaths. The mislabeling would have been detected by raw material
control.
Chemical prescreening does not only reduce the production of hazardous waste but
reduces the generation of offquality products and improves the consistency between
different runs. Defective goods have a lower market value than first quality products.
The repair techniques are often expensive and do not guarantee first quality products.
Table 2.3 shows typical textile quality levels. The first step in minimizing the production
17

of offquality products is a consistent quality of process chemicals and other raw
materials.
Table 2.3: Textile Quality Levels (Smith, 1987 a).
BleachDyedPrinted
% Perfect % Seconds Unmerchandizable90-92 2-4 upto6%85-87 5-8 up to 8%78-82 6-10 Up to 12%
2.3.2 Maintenance and Housekeeping
Substantial waste reduction can be realized through good housekeeping and
maintenance. Most improvements in maintenance and housekeeping are simple and
inexpensive. Often the difficulty in improving housekeeping practices is motivation of
the operating personnel. It is not easy to change habits that have developed over several
years. The best way to tackle this problem is to making workers aware of, and
periodically reinforce, the consequences of bad habits. For example, making employees
realize how much water goes down the drain due to a leaking valve or a running hose can
significantly reduce the daily water consumption. (Jones, 1973)
In England, the Water Authorities estimated the water supply losses due to broken
valves, leakages, etc. In 1977, Holme reported that losses vary from 6-44% of the total
water supply, with an average of 25%.
Spills are often the result of poor housekeeping. Accidental spills, making excess
chemical mixes and making up the wrong chemical mix not only cost the company
money, but put an unnecessary burden on the wastewater treatment system (EPA, 1978).
Good organization is also important for the improvement of housekeeping
practices. Formulations should be mixed near the point of application. This will prevent
18

the use of excessive piping to transport the chemical mix from the mix tanks to the pad
pans. The chemicals in the mix tanks, piping and pad pans have to be treated and
disposed of at the end of a run. Batch dumps of these strong chemical mixes can
contribute significantly to the strength of the waste stream even when the amount
discharged is small. It is therefore important to keep good records of the size of each run
and the amount of mix dumped after the run. This will help to accurately predict the
exact amount of mix needed.
Properly maintained equipment results in good machinery performance and
accurately predict , reduces the number of reworks and off-quality products. Leaks and
spills due to badly maintained equipment will also be reduced.
2.3.3 Water Conservation
Beckmann and Pflug (1980) reported that the average water consumption in a
textile mill was 150 to 200 m3 per metric ton of finished goods in 1980. In that same
year, costs for water supply and wastewater treatment accounted for 4.3% of the total wet
processing costs (Beckmann and Pflug, 1980). It is, according to Smith (1989 c), not
unusual to find situations where a 10% to 30% reduction in water use can be achieved
without major investments. Common situations where water is unnessarily consumed
include hoses left running, broken or missing valves, cooling water that is running while
machines are not in use, and-defective toilets and water coolers.
Studies have shown that the amount of water used per pound of fabric will vary
with the weight of the fabric, process, equipment type and dyestuff. Table 2.4 gives the
water usage in cotton wet processing operations. This table shows that the water usage
in the dyeing operation depends on the type of dye used.
P r e p a r a t i o nWastewater can be recycled in continuous preparation processes. The waste
19

stream in these processes is continuous and fairly constant in characteristics. The effluent
from the desize J-box can be used to makeup the desize mix. Wash water from the
caustic washer can be reused in the desize washer. The caustic present in this water will
enhance the removal of sizing chemicals. Batch operation processes do not easily allow
for water recycling. When trying to reuse wastewater in batch operations, storage
facilities for the reusable wastewater must be provided. Other problems associated with
the reuse of wastewater from batch bleaching and scouring are the non-continuous
character of the waste stream and the higher liquor ratios (Smith, 1986 a).
Supplying only the needed amount of water to a machine and reducing the number
of throughputs can result in significant water savings. Evans (1982) investigated
possibilities to reduce water and energy consumption in a open width bleach range. This
preparation train consists of 3 stages: desizing, scouring and peroxide bleaching. The
water consumption in these stages can be reduced by flow reduction and counter current
flow. Reducing the water consumption will also reduce the energy consumption since the
temperature of the water used varies from 150°F to 190°F. The bleach washers can be
20

operated at a temperature of 150°F - 160oF. The desize and caustic washers must be
operated at 180oF-190oF. The viscosity of the materials in these two washers increases
quickly with decreasing temperature. The results of Evans’ work are shown in Table 2.5.
Table 2.5 Water and Energy Savings Available by Process Changes (Evans, 1982).
In counter current washing, the water flows in the direction opposite to the fabric.
As a result, the least contaminated water contacts the cleanest fabric. Table 2.5 shows
that the technique can result in significant savings. Many mills use counter current flow
in continuous preparation processes. This technique: can also be used for rinsing after
dyeing procedures.
Another case study (EPA, 1978) described process changes made in a single stage
bleach range processing 65/35 polyester/cotton knit goods in rope form. The unit
consisted of a saturator, J-box with wet heel and six box washers. Acetic acid was added
to the last two washers to neutralize the fabric. The bleach washers operated at a flow
of 30-40 gallons per minute (gpm) between 170 and 19OoF. The fabric leaving the fourth
washer had a caustic concentration of 0.025 % at a flowrate of 40 gpm. Reducing the
flow to 15 gpm increased the concentration of caustic to 0.033 %. The concentration of
21

caustic in the fabric’ was not changed when the temperature of the water was lowered
from 205°F to 145oF. As a result of the experiments the water temperature was lowered
to 140- 160°F and the flow rate to 20-25 GPM. These measures resulted in significant
water and energy savings.
In another mill caustic scoured cotton yarn packages were batch washed by a 10
minute hot running rinse followed by a 10 minute cold running rinse. Full-scale
experiments were performed to optimize the process. The experiments revealed that the
same fabric quality was obtained by a 3 minute hot running rinse by a 3 minute cold
running rinse. (EPA, 1978)
The amount of water used in many fabric pretreatment operations is often preset
to treat the most difficult cloth processed. As a result, large amounts of water are wasted
when cleaner/easier fabric is treated (Cooper, 1978). Besides this, good preparation is
essential to achieve good dyeing. There is a tendency in the textile industry to use more
water than necessary when removing chemicals during rinsing. An effective way to
discover if the right amount of water is used, is reducing the water flow slowly, for
example by 10% increments. The procedure is monitored closely to detect when not
enough water is used. At this point, the water level has to be increased by 10%. If this
procedure is followed for each type of fabric processed, significant water savings can be
achieved.
Surveys conducted in Europe between 1966 and 1975 showed a marked decrease
in the water consumption of the textile wet processing. This decrease was the result of
increased costs of water supply and effluent treatment. The water consumption was
reduced by 50% by improving the efficiency of processes, by minimizing excessive
rinsing and by controlling fractures and leaks. (Park, et al., 1984)
DyeingTable 2.6 gives the water consumption and typical liquor ratio for different dyeing
machines. The liquor ratio is the ratio of the amount of liquor (in pounds) in the exhaust
22

dyebath to the amount of fabric (in pounds). This ratio varies according to the machine
type. Low liquor ratio dyeing machines have been developed to save water. However,
the largest quantities of water in dyeing operations are not used in the dyebath but in
subsequent rinsing. The liquor ratio does not reflect the amount of water used during
rinsing. It is therefore not necessary true that a dye machine with a low liquor ratio has
a low overall water use (Smith, 1986)
The amount of water used during rinsing depends on the dyeclass, and the type
and weight of the fabric. Dürig pointed out in 1981 that the dyeclass, fabric and desired
effects determine the dye equipment used and thus the amount of water required for
rinsing. It is sometimes possible to achieve the same shades with dyes of two different
dye classes. Each of the dye classes requires different dye techniques, chemicals, energy
and equipment. All these factors and the pollution load of the procedures must be taken
into consideration when comparing different techniques.
The effectiveness of washes increases directly with the volume of water being used
but it increases with the power of the number of washes. It is therefore more effective
to conduct several washes with a small amount of water than to wash the fabric once with
a large volume of water. Removing all the excess water before the next portion of wash
water is added to the fabric will prevent excessive contamination of the wash water (EPA,
1978).
Rapid inverse dyeing (RID) is a dye technique that is successfully used in dyeing
polyester/cotton blends using disperse and fiber reactive dyes. In the normal dyeing
procedure the polyester is dyed with disperse dyes at elevated temperatures. The fabric
is then washed to remove all traces of dye and acetic acid. The machine is refilled with
reactive dye solution to dye the cotton portion of the fabric. After completion of the
dyeing process the excess dye is removed by dye-extraction and rinsing. In RID the
cotton is dyed first with reactive dyes. The acidic disperse dyebath is used as a wash for
the fiber reactive dyes. This technique reduces the water and energy consumption. The
duration of the dye cycle is also reduced. (Smith, 1986)
23

The non-contact cooling water used in finishing and dyeing operations is often
discharged to the drain. This water can be use as makeup water for the boiler and as
processing water in operations that do not required drinking water quality. (Cooper, 1978)
It is also possible to reuse this water as non-contact cooling water after heat
exchange. Cooling water should be segregated from the other waste stream if reuse is not
possible since it unnecessarily increases the hydraulic load of the treatment system.
Solvent Processing
Many research projects in the textile industry were conducted during the seventies
to investigated the possibility of solvent preparation, dyeing and finishing. Interest in
solvent processing remained low due to the lack of suitable dyes, auxiliary and specialty
chemicals Holme, 1977). Another influencing factor were the environmental laws that
regulate emissions from solvents. Kothe (1973) investigated polyester fiber dyeing by
an exhaust method from perchloroethylene. He investigated the use of 1100 dyes. Only
one dye gave a color yield greater than 50%.
24

Use of Reclaimed Water
The required quality of water used in textile wet processing operations is
controversial. The industry uses water of drinking water quality although several
processes do not require water of this quality. Several articles discussed the use of
reclaimed water. McKee and Wolf (1966) reported that high quality water is required for
bleaching to prevent staining of the fabric. The water should be colorless with a low
concentration of iron, manganese and calcium. Another researcher, Harker (1980),
reported the successful use of a sandfiltered, chlorinated activated sludge effluent in a mill
in Yorkshire. This company produces high quality blazers and no differences were
observed between fabric processed with water of drinking water quality and fabric
prepared with reclaimed water.
Inoua and co-workers investigated in 1977 the use of reclaimed water for scouring,
bleaching and dyeing of cotton, wool and synthetic fibers. The types of water used in the
full-scale experiments were municipal water, water after flocculation, sedimentation and
sand filtration of biologically treated wastewater and the same water after activated carbon
absorption. Slight differences were observed in the effects of the different water sources
on various fibers but these effects were not considered significant.
Tworeck (1984) used municipal supply water and water from the Athlone
wastewater treatment plant in his experiments. The treatment plant consisted of an
activated sludge reactor followed by sandfilters, prechlorination, activated carbon
absorption and chlorine disinfection. He compared the effects of sandfiltered water and
final ‘effluent water on the fabric with water of drinking water quality. The water was
used in fabric preparation, dyeing and finishing of polyester, nylon, a cotton/nylon blend,
wool and other polyester and nylon blends. The reclaimed water had slight effects on the
dyeing of the fabric but they were fully acceptable to the mill.
Goodman and Porter (1980) investigated the influence of water conservation and
recycling on the water and energy consumption in a typical continuous preparation range.
The results of their investigation is shown in Table 2.7. They also discussed the effects
25

Table 2.7: Influence of Conservation and Recycling on the Water and Energy Consumption in a typical ContinuousPreparation Operation (Goodman and Porter, 1980).
Process Modification water consumption gpd Average processtemperature, oF
No conservation 346,000 165 274Temperature increase and 194,000 195 202water reductionMultiple use of water 158,000 195 165water recycled after 43,000 195 45ultrafiltration
of impurities in process water on chemicals and fabric performance. Most wastewater
leaving a textile mill needs treatment before reuse is possible. However, there are waste
streams that can be reused directly. Table 2.8 gives an overview of the impurities
commonly found in textile wastewater and the tolerability of these impurities in reclaimed
water. Chemical optimization and substitution of chemicals can result in significant
reduction of pollution load and can even make water reclamation possible.
Table 2.8: Impurities Commonly Found in Textile Mill Wastewater (Goodman and Porter, 1980).
26

2.3.4 Chemical Optimization and Conservation
In many mills, chemical are applied in excessive and unnecessary amounts. The
use of chemicals can often be reduced without any significant effects on the quality of
the product. Chemicals that are often overused include cleaning agents, surfactants,
defoamers, lubricants, carriers and other chemical specialties. Sometimes chemicals arc
added to counteract the negative effects of other chemicals. Instead of adding more
chemicals to the bath, the offending chemicals should be substituted with a chemical(s)
with fewer harmful effects.
Smith wrote in 1989 a series of articles about source reduction. He gave a good
example of specialty chemical misuse in the first article of this series. A problem
associated with most dyeclasses is the uneven dyeing of the fabric. This can be solved
by the addition of leveling agents and retarders. However, the use of these chemicals
results in a lower exhaustion of the dyebath and thus in a higher usage of dyes. An even
and level exhaustion of the dyebath can be obtained by optimization of the dyebath
temperature. As a result of the temperature control, the use of leveling agents, retarders
and dyes will be reduced. The color in the effluent will also be lower.
Trying to avoid spillage and preparing precise quantities of chemical mixes will
not only conserve water but, more importantly, will reduce the strength of the wastewater.
It is very important to adjust the chemical mix to the weight, type and style of the fabric
being run. For example, it happens that the quantity of chemicals used in continuous
bleach ranges is set to treat the most difficult fabric. Consequently, chemicals are wasted
when an easier fabric is processed.
Control equipment will help to optimize the chemical dosage in continuous
processes. In these operations, the concentrations of the critical chemicals in the bath are
periodically checked. If the concentration of the chemical is either too low or too high,
the operator will adjust the feed. Poor results will occur when the concentration of the
chemical is too low. As a result, reworks arc often necessary. However, when the
27

concentration of the chemical is too high the fabric can be damaged permanently. There
is equipment on the market that maintains the chemical concentration of the bath at
predetermined levels. Installation of such automatic chemical feed can result in
significant savings due to lower chemical costs, fewer reworks and less damaged fabric.
During continuous bleaching, caustic and hydrogen peroxide are added to the saturators
of the bleach range by constant feed pumps. The operator takes a sample from the
saturator and titrates it to an endpoint thereby finding the correct concentration of
hydrogen peroxide and sodium hydroxide. The pumping rate of the pumps is then
adjusted to compensate for any deviation from the desired level. An automated chemical
feeder constantly determines the bath concentration and adjusts the chemical concentration
to the desired level. (EPA, 1978)
Most water used in preparation and dyeing processes is softened. This is often
achieved by adding chemicals to the water that form strong complexes with hardness ions.
A more environmentally friendly way to soften water is ion exchange. There are also
processes that are less efficient when softened water is used. Hall (1982) reports that
enzyme desizing and non-chlorine bleaching operations will improve in water with a high
hardness.
Cook (1990a) reported that FMC Corp. investigated the use of hydrogen peroxide
in denim finishing. According to FMC Corp. hydrogen peroxide can, when used with
some auxiliary chemicals, replace the chemicals that are currently used to desize and
decolor denim apparel. The new process is supposed to be cost effective, environmentally
safe and has additional quality advantages.
2.3.5 Chemical Substitution
The total quantity of chemicals used in textile mills varies from 10% to over 100%
of the weight of the cloth. Many chemicals currently used in the textile industry
influence the aquatic life of the receiving stream. Sometimes these chemicals can be
28

substituted by other chemicals. This is not always easy due to the lack of information
about BOD data and aquatic toxicity of the chemicals and due to the proprietary nature
of specialty chemicals. A recommendation many mills get is to substitute low BOD
chemicals for chemicals with a high BOD. These low BOD chemicals will help to reduce
the waste load of the mill’s effluent. However, little is known about the long term effects
of these products. It is possible that a low 5-day BOD value means that the chemical is
resistant to conventional biological treatment and that it might influence aquatic life.
Sizes
The substitution of synthetic sizing materials for starch (50% BOD) in cotton
processing will reduce the waste load of the mill (Jones, 1973). Unlike starch, synthetic
sizing agents pass the desizing process unchanged and can be recovered and reused.
However, when recovery is not practiced, the sizing chemicals end up in the effluent.
The biodegradability of Polyvinyl Alcohol (PVA) is currently under discussion. Some
researchers, such as Achwal (1990) report problems degrading PVA. Others are able to
degrade PVA in a conventional activated sludge system (Porter et al., 1976). Another
problem associated with PVA is its solubility in water. PVA is applied to the fabric in
a 10% concentration by weight in the feed solution. Large quantities of water are
required for PVA desizing due to the low solubility of PVA. As a result, the desize
effluent contains less than 1 % PVA by weight. If this PVA is recovered and reused in
sizing, it must be concentrated to a solution having a PVA concentration of 10 % by
weight. (Cook, 1990)
Currently new sizing chemicals arc under development The technique used in the
development is called Interpenetrating Polymer’ Network Technology (IPNT). Each
polymer consists of a large number of monomers that must react with each other to form
the polymer. The new technique allows molecules, that under normal condition do not
react, in the same polymer. The result is a hybrid polymer that has the characteristics of
both monomers. The ideal size is a polymer that provide high weaving efficiency and
29

4cetic acid
dissolves readily in water (Cook, 1990 b).
Snowden-Swan (1995) reported substitution enzymes by H2O2 for starch desizing.
The results in a lower BOD in the effluent since starch is degraded to CO, and water
when hydrogen peroxide is used. Starch hydrolyses to anhydroglucose when using
amylase enzymes. Another desizing method involves the use of enzymes developed for
the home laundry industry. As a result, starch is degrade to ethanol. Ethanol has a lower
BOD then anhydroglucose and can be used as fuel.
Each dye class produces a waste with specific characteristics. An overview of
problems related to specific types of dye is given in Table 2.9. Sometimes, dyes causing
specific problems can be replaced by dyes from another class. This is not always a good
solution since auxiliary chemicals can also cause problems.
Table 2.9: Overview of Problems Related to Specific Dye Classes.
Dye class
Pigments
Vat/sulfur dyesFiber reactive dyes
Direct dyesMordant dyes
Constituent causing problems
Acrylic bindersMetalsRedox agents (metals)Alkali
s a l tLow exhaust of dyebathM e t a l s
Problem
High TSSToxicityToxicityHigh pHsalt concernsHigh colorToxicity
Acetic acid is used in a variety of textile processes. It is, for example, used to
30

lower the pH when dyeing polyester with disperse dyes. The substitution of formic acid
for acetic acid can reduce the waste load of the mill significantly. Acetic acid has a BOD
equivalent of 0.64 lb/lb whereas the BOD equivalent of formic acid is only 0.12 lb/lb.
Eighty-five percent of the BOD load of a dyeing procedure using acetic acid can come
from the acid (Jones, 1973). The substitution of formic acid for acetic acid can also
result in cost reduction due to the lower weight equivalent of formic acid and its higher
purity. Organic acids like acetic acid can also be substituted by mineral acid but they
increase the salt content of the waste stream.
Major problems in the textile industry arc associated with surfactants, emulsifiers
and dispersants. Surfactants are widely used in the industry and can be found in almost
every chemical specialty to improve the solubility/dispersibility of the chemical in water.
Surfactants are used to ensure even and rapid wetting of the fabric and to improve
penetration of chemicals and dyes. Surfactants improve fabric wetting because they
reduce the surface tension. It is this characteristic that makes surfactants toxic to aquatic
life. The toxicity of the surfactant is strongly influenced by its biodegradability.
31

Table 2.10: Relative Toxicity of Surfactants in Untreated Wastewater (Moore, 1987)
Surfactant class Surfactant Acute 48 hours static LC5O forDaphnia pulex, ppm
nonionic Nonyl phenol alcohol (AP) 13
Diethanol cocoamide (DEC) 2
Linear alcohol ethoxylate (LEA) 5
Anionic Dodecyl benzene sulfonic acid (DDBSA) 20
sodium lauryl sulfate (SLS) 28
Cationic
Sulfated ethoxylated alcohol (SEA) 20
Tallow amine ethoxylate (TAE), 15 mol E-O 6
Tallow amine ethoxylate (TAB), 150 mol E-O 66
Alkyl dimethyl benzyl ammonium chloride (ADBAC) 4
Several research groups investigated the biodegradability and toxicity of
surfactants (Achwal, 1990, Kravetz, 1983, and Moore, 1987). When evaluating two
different surfactants, it is important to consider both the toxicity and biodegradability of
the chemicals. A good example of this ‘is the difference between nonyl phenol ethoxylate
(AP) and linear alcohol ethoxylate (LEA). Nonyl phenol ethoxylate has highly branched
chains. The relative toxicity of these and other surfactants in untreated solutions is
represented in Table 2.10. The table shows that there is considerable variation in the
relative toxicity of the different surfactants.
The toxicity of AP in the untreated effluent is much lower than the toxicity of
LAE. The results are completely different when the toxicity of AP and LAE are
measured in treated effluents. These treated effluents showed no sign&ant toxicity due
to LEA, but substantial toxicity for AP. The explanation is the difference in the
biodegradability of the two chemicals. The more linear a chemical, the greater its
biodegradability. Nonyl phenol alcohol was degraded by 25% whereas LEA was
completely degraded under the same conditions. Even when the toxicity of LEA before
treatment was much higher then the toxicity of AP, the biodegradability of LEA resulted
32

in the complete removal of LEA. As a result, the treated effluent showed no toxicity for
LEA and a significant toxicity for AP. The toxicity problem related to AP can thus be
solved by substituting LEA. This substitution has a few drawbacks, however. The
greater biodegradability of LEA results in an increase in BOD5. This is something many
mills, and especially mills discharging to a POTW, want to avoid. Alkyl phenol
ethoxylates, like AP, are often used by the industry because they foam less than fatty
alcohol ethoxylates (FAE). Fatty alcohol ethoxylates, like LEA, have lower wetting
power, detergency, alkali stability and result in a more stable foam. (Kravetz, 1983).
Achwal, reported in 1990 that new surfactants were developed with the same efficiency
as AP or better. An extra benefit of these products is that they are completely
biodegradable.
Case Study
The city of Mount Airy in Surry County, NC uses a trickling filter to treat the
municipal waste. The effluent of the treatment plant failed toxicity tests. Analysis of the
treatment plant effluent showed high concentrations of metals (copper and zinc) and alkyl
phenol ethoxylates. Each of the textile mills discharging to the town’s sewer was asked
to review the chemicals they used and to minimize the use of chemicals that were
harmful to aquatic life. Within two months, the effluent from the POTW passed toxicity
tests. (Smith, 1989b).
Urea is frequently used in printing with reactive dyes. This chemical brings
several benefits to reactive dye printing. It increases the solubility of the reactive dye in
the print paste, improves the color yield, and the levelness and smoothness of the printed
area. On the other side, urea drastically increases the nitrogen content of the wastewater
‘and can cause problems in the treatment system. Provost (1992) investigated three
alternatives:
33

1. flash age printing
2. substitution of urea for an alternate chemical
3. mechanical application of moisture prior to steaming
In flash age printing, the print paste does not contain alkali or urea After the
cloth is printed and dried, it is overpadded with high concentrations of caustic and
electrolytes or with caustic soda and sodium silicate. Complete chemical substitution of
urea is not yet possible, but ICI Colors investigated the substitution of urea in print
pastes. Currently, in printing 100% cotton fabric with reactive dyes 100 g/kg urea is used
in the print paste. ICI Colors investigations showed that this urea dose does not always
give the best color yields. Several trials showed that for most ICI reactive dye print
recipes, the optimum dose was 50-75 g/kg. If dicyandiamide was added to the recipe in
a dose of 15 g/kg, the urea dosage could be reduced to 0-40 g/kg. The color yield for
the two recipes mentioned above were similar. The amount of dicyandiamide could even
be reduced to 10 g/kg without effects on the color yield. The third possibility for urea
substitution currently investigated is mechanical moisture application systems. This
investigation is in an early stage and the results are not yet known. (Provost, 1992)
Phosphates are used in buffers, builders for scouring, water conditioners,
surfactants and flame retarders. In all these cases, except flame retarding finishes,
substitutes can be found for the phosphate containing chemicals. If the use of phosphates
is required, batch dumps of the chemical bath should be avoided.
Solvents
Solvents can cause significant problems in wastewater treatment. Although solvent
processing has lost its at&action since the 1970’s, there still are many uses for solvents
in the textile industry. Some examples of solvent emulsions include scouring agents and
34

dye carriers for polyester. In these cases, the solvents are auxiliary chemicals that will
evaporate as VOC’s when the fabric is dried. They can end up in the wastewater stream
during batch dumps, leaks and spills.
Non-aqueous solvents are used for machinery cleaning, degreasers and laboratory
experiments. Disposal of these solvents with the wastewater should be avoided because
of the toxicity of many solvents. Small equipment parts can be cleaned in a special
container so that the contaminated solvent can be collected in a solvent recovery bottle
for collection and proper disposal. (Smith, 1986)
Different types of solvents should be collected in separate bottles. ‘This will
reduce the disposal costs and will simplify recovery of the solvent. Solvent processing
and cleaning can reduce the pollution load of the wastewater. The pollutants in the
solvent are collected as a slurry at the solvent recovery unit. (Cooper, 1978)
Metals
Metals found in a mill’s effluent come from many sources. They are used in
several textile processes and sometimes metals are brought into the mill’s operations by
the fabric itself or as impurities from chemical specialties and metal parts of equipment.
Metals are used as (Smith, 1989b):
a. oxidizing and reducing agents
b. copper after treatment for direct dyes
c. organometallic finishes
d. essential ingredient in dyes
Metal concentrations of over 75 ppm are found in raw cotton fibers. The metal levels
found in cotton yarn or fabric entering the mill can be even higher due to metal
contamination from sizing agents, water and processing equipment. Metals found in raw
materials, and in the mill’s source water will frequently cause undesirable effects and can
35

even damage the fabric. Besides these effects, metals will contaminate the wastewater
and can inhibit biological treatment. There are certain dyes in which metals are an
integral part of the dye molecule. A list of some dyes containing metals is shown in
Table 2.11. This table shows that many of these dyes are either blue or green. The use
of these dyes should be limited and, where possible, dyes not containing metals should
be substituted for metal containing dyes. For example, copper-free vat dyes can be used
for dyeing 100% cotton fabrics materials without any loss of quality. If it is not possible
to use dyes that do not contain metals, maximal dye exhaustion should be provided by
optimizing the dyebath temperature, pH and concentration of auxiliary chemicals (Smith,
1989 b).
Table 2.11: Examples of Frequently used Metal Containing Dyes (Smith, 1989 b).
Dye Metal
Vat Blue 29 cobaltIngrain Blue 14 NickelIngrain Blue 13 CopperDirect Blue 87 CopperAcid Blue 249 CopperPigment Blue 15 CopperPigment Green 7 copperSolvent Blue 25 copperSolvent Blue 55 Copper
DyePigment Blue 15Ingrain Blue 5Direct Blue 86Pigment Blue 17Ingrain Blue 1Pigment Green 37Ingrain Green 3Solvent Blue 24Reactive Blue 7
Dichromate has been used for the oxidation of vat dyes until the 1960’s. The
chrome levels in some mills was therefore very high. Chromium had to be removed
before biological treatment of the waste was possible. Currently, peroxide oxidizers or
periodate are used.
36

in the open width one stage bleaching process. The wastewater production is reduced
by 90 gal/min. The three Tensitrol washers have a total water use of 95 gal/min at
190°F. The reduced consumption of hot water will also cut the energy requirements.
Currently, more efficient washers are available with a total water use of approximately
40 gal/min. The chemical costs increased and chemical feeders need to be redesigned.
DyeingAs previously mentioned, a dyebath contains many other chemicals besides dyes.
During dyeing, some of these chemicals will exhaust onto the fabric whereas others
remain in the dyebath. Recovery of these chemicals will reduce chemical usage, and thus,
the strength of the wastewater. Commercial dispersed dyestuffs contain dispersants as
naphtaline sulfonic acid. During dyeing the dye exhausts onto the fabric but the
dispersant stays in the dyebath (Smith., 1986a). Dispersants and other auxiliary chemicals
can be recovered by dyebath reuse, a technique that will be explained in more detail later
on in this chapter (Pickford, 1981).
The auxiliary chemicals are major contributors to the BOD of the waste since
large amounts of these products stay in the dyebath and because some of these products
can exert a high BOD. It is therefore very important to minimize the use of these
chemicals and/or to find chemicals with a lower BOD. However, care must be taken not
to substitute surfactants with a high BOD with chemicals which have a lower BOD but
a higher aquatic toxicity.
Pad Batch Dyeing
In pad batch dyeing, the prepared, dry fabric is impregnated with a cold solution
of reactive dye and alkali. The excess liquor is squeezed from the fabric as it leaves
through the padding trough. The wet fabric is stored on rolls at ambient temperature for
fixation during a period of 2 to 48 hours. To prevent evaporation of the dye solution, the
rolls are covered with a polyethylene film. The dyed goods are dried after washing off
38

unfixed dye. (Fox and Sumner, 1986)
The general rule is that the amount of salt and other auxiliary chemicals added to
the bath is less than in conventional batch dyeing. Often, the addition of these chemicals
can be omitted completely. The addition of alkali is necessary to promote sufficient
exhaustion of the dyebath and to promote reaction between the dye and cotton. It is no
surprise that cold pad batch dyeing results in chemical, water and energy savings.
Snowden-Swan (1995)said that the chemical use can be reduced up to 80% compared to
atmospheric becks. Becks are vessels used for dyeing fabric in rope form. They can be
operated at atmospheric pressure or at elevated pressure. The water consumption of cold-
pad-batch dyeing with beam afterwashing is less than 2 gal/lb. The water use for
atmospheric becks using the same reactive dyes is 20 gallons per pound of dyed fabric.
The energy consumption was reduced from 9000 BTU/lb to 2000 BTU/lb.
Uniform preparation of the fabric is required to obtain good quality dyeing in cold
pad dyeing. The fabric should not contain any traces of natural oils, waxes, or sizing
chemicals since they will interfere with dyeing.
2.4 RECYCLE, REUSE AND RECOVERY
When the reduction of chemicals is not possible, it might be possible to recover
some chemicals. For example, an exhausted dyebath still contains a large amount of
auxiliary chemicals. In other cases, sodium hydroxide, synthetic sizes or heat can be
recovered.
2.4.1 Recovery of Acetate and Acetone
A manufacturer of lace uses acetate yarn to stabilize the lace during processing.
Afterward, the acetate yarn is dissolved in acetone. The acetone/acetate solution is sold
to an acetate producer who separates the acetone and acetate. The acetate is reused to
39

make acetate fibers and the acetone is purified. The manufacturer gets the acetate fibers
and the purified acetone, but pays only for the separation process (Smith, 1986a).
2.4.2 Heat Recovery
There is great potential in the textile industry for heat recovery. Many textile
processes require hot water but the heat in the waste stream of these operations is not
recovered. A heat exchanger can be used to transfer the heat of the wastewater to the
incoming feed water.
A carpet company installed a heat reclamation system before 1957. The unit
raises the incoming water from 55OF to lOOoF. The initial investment was approximately
$10,000. The total savings for the company are $4.6 million over 30 years. Operating
this 48,000 gallons per hour (gph) system for 80 hours/week, 50 weeks/year saved the
company $ 750,000 in 1989 at a fuel cost of $0.95/gallon (Smith, 1989c).
Russell Corp. reduced excess hot water from its bleachery. The hot water was
generated by a system that required condensate and flash steam to be cooled by
circulating it in a tube heat exchanger. Therefore, the excess hot water had to be dumped.
The company installed pressure regulating valves that control the return of the condensate
at 15 psi. This system reduced the amount of condensate that flashes into steam and
allows the condensate to be returned at a higher temperature. The result was an annual
water savings of 140,000 gallons. Each increase of 10°F of boiler feed water resulted in
1% fuel savings. The savings are reported to be $1,000 per day (Huffman, 1986).
Evans (1982) described energy and water saving opportunities in bleaching. A
reduction in water temperature of lOoF from 180°F to 170°F in the bleach washers can
result in energy savings of 250 lb steam/hr. The temperature of the water in bleach
washers in many mills is about 150-160°F.
Burch et al (1982) developed a system for the recovery of energy and water from
waste streams. Most recovery systems involve a heat recovery system but the wastewater
40

is still discharged. The wastewater is vaporized at low pressure. The result is essentially
pure steam which is condensed. The refrigerant used in the heat pump operates at high
temperatures (202-225°F). Significant cuts in water consumption and energy were
reported. The system has a payback period of less than two years when only the costs
of supply water and energy are taken into consideration.
2.4.3 Size Recovery
Sizing chemicals are used in large amounts in mills processing woven fabric. In
fact, they represent the largest group of chemicals used in the textile industry. The
recovery of these chemicals has great pollution prevention opportunities. Some materials,
like starch, are degraded which makes their recovery impossible. This is why some mills
change to synthetic sizing agents like polyvinyl alcohol and carboxymethyl cellulose.
Synthetic sizes pass the desiring process unchanged and can be recovered by
ultrafiltration (UF) systems. The recovery of size is mostly only practiced in vertically
integrated mills. Mills that buy woven fabric do not invest in size recovery equipment
since they do not have the benefit of the recovered material. On the other side, synthetic
sizes are more expensive than starch-like chemicals. Mills that weave the yarn but do not
desize it after the weaving process, do not buy the more expensive synthetic sizes. This
is one example of a situation where an arrangement between two mills resulted in benefits
for both parties. (Snowden-Swan, 1995 and Cook, 1990).
Gaston County installed an ultrafiltration system for the recovery of PVA. The
net recovery that takes loomshedding, washer and UF efficiency into consideration is 80-
85%. The equipment costs, including installation, were $1,275,000. The payback period
is 9 months when 2.5 million lb PVA is used each year and the cost of virgin PVA is $1
per lb (Grizzle, 1982).
Polyvinyl alcohol can also be reclaimed by vacuum extraction. Currently, vacuum
extraction is widely used to remove water from fabric before drying. Perkins (1987)
41

reported that drying requirements can be lowered by more than 50% on some fabrics by
extraction of unbound water before drying. He also investigated the recovery of PVA by
vacuum extraction. This was done by either saturating the fabric with water in a desize
saturator or by spraying the fabric. Afterwards, the cloth passed through a vacuum
extractor. The recoverability of the PVA depended on its viscosity and water solubility.
The temperature of the water was also an important factor. He reported a recovery of
53% of the size from 50/50 polyester/cotton at a vacuum of 15 inches of mercury.
2.4.4 Caustic Recovery
Mercerizing is a preparation step of cotton and cotton blends which uses a
concentrated solution of sodium hydroxide (more than 20%). The recovery of caustic
in this step is very practical since mercerizing is a continuous operation which makes the
characteristics of its waste stream are fairly constant. A good recovery system can
recover up to 98% of the caustic (Snowden-Swan). In another type of mercerizing, the
fabric is treated with liquid ammonia. The ammonia is captured as gas, recovered and
reused (Smith, 1986). The benefits of caustic recovery are a reduced alkalinity of the
wastewater and reduced chemical consumption.
2.4.5 Dyebath Reuse
Dyebath reconstitution and reuse is an at&active process due to cost reduction,
energy savings and pollution reduction. Dyebath reuse has been used for many dyes and
materials. This section will discuss the procedure and will give examples where the
technique has been used successfully.
Batch dyeing is inefficient in the ‘use of chemicals, energy and water. The
amount of auxiliary chemicals used varies from a few percent to over 100% on the weight
of the fabric. Most of these chemicals do not absorb into the fabric and increase the
42

waste load of the mill’s effluent. Dye quantities are often only a few percent of the
weight of the fabric. By reconstituting and reusing dyebaths, the efficiency of batch
dyeing can be increased, and the use of chemicals, water and energy can be reduced
significantly. No articles discussing dyebath reuse in continuous dyeing have been found.
This could be feasible if the dyebath can be stored until the same material is dyed with
the same dye formula or if it can be reused to dye the same material to a different shade.
Bergenthal et al, (1985) suggested the following procedure for dyebathreconstitution:
1. Store the exhausted dyebath. The exhausted dyebath can be pumped into a holding
tank where it is analyzed and reconstituted. In the meantime the fabric is rinsed in the
dye machine. The same can be achieved with two identical dye machines. One machine
is preparing the yam or fabric for dyeing while the other machine is dyeing the material.
After dyeing, the dye solution of the second machine is pumped to the first machine for
analysis and reconstitution. The second machine will be after-rinsing the fabric while
machine 1 is in its dye cycle. Another alternative is to remove the fabric from the dye
machine after dyeing and leave the exhausted dyebath in the dye machine for analysis and
reconstitution. This eliminates the need for holding tanks.
SIS of the dyebath for residential chemicals. Dyestuff that is not exhausted from
the dyebath can be measured by a spectrophotometer. If the dyebath is cloudy, extraction
methods should be used. Most auxiliary chemicals will not be removed from the dyebath.
The makeup quantity can be estimated or can be determined analytically. According to
Smith (1985), estimation of the losses is, in most cases, sufficient. Tincher et al. (1981)
have developed a computer program that can help to determine the amount of auxiliary
chemicals and dyes needed to reconstitute the dyebath.
43


Case Studies
A company is reported to use dyebath reuse when dyeing nylon pantyhose with
rotary paddle dye machines. The company currently practiced the technique on 95% of
its rotary paddle machines at two of its plants. Another pollution prevention technique
used at the plant was the reuse of the final softener as prescour for the next batch of
pantyhoses. (Cook, 1983)
Another mill instituted dyebath reuse when dyeing nylon carpets with disperse
dyes in becks. The company experienced problems with the build up of surfactants in
succeeding reuse cycles. The result was a slightly lower dye exhaustion of the baths.
The problem was solved by slightly increasing the dye concentration in subsequent baths.
The projected annual savings were $115,000. (Cook, 1983)
Bigelow-Sanford, Inc. performs batch dyeing operations on nylon carpet. The
pilot study included two grades of nylon and six shades for each grade. Two multi-shade
dyeings were performed and consisted of six and ten dyeings. All shades were first
quality. A one week full-scale study conducted with the same nylon grades and same dyes

resulted in savings of $0.025/ carpet. The projected annual savings were $30,000 per
dye machine modified for dyebath reuse (Bergenthal, et al., 1985).
In 1981, Tincher et al. reported the reuse of dyebaths when Nomex non-woven
fabric was dyed in jet dyeing machines. Nomex requires large quantities of expensive*
auxiliary chemicals. As a result, large volumes of a high strength wastewater are
produced. The results showed that dyebath reuse saved 25 cents/lb of fabric processed
when the dyebath was reused ten times. Demonstration dyeings were conducted at a plant
that performed on average 875 dyecycles/yr on jet dyeing machines. The annual savings
were expected to be over $110,000. The capital cost for analysis equipment, pumps and
piping was only $15,000. As a result of the dyebath reuse, the quantity of spent dye
liquor discharged per year dropped from 500,000 gallons to 140,000 gallons.
Pilot scale studies of atmospheric disperse dyeing of nylon carpet, nylon
pantyhoses and pressure dyeing of polyester yam packages were reported in 1978 by
Cook and Tincher. All reconstitutions resulted in first quality products. The dyebaths
were used for five to ten dyeings, but had to be dropped when using a light shade after
a dark shade. The savings in water, chemicals and energy were significant.
Limitations
The success of dyebath reuse depends upon the type of dye and fabric. The
easiest dyes to be reused for a limited number of dyecycles due to the buildup of
impurities. Chemicals used in pretreatment steps and impurities from the fabric can
accumulate in the dyebath. ‘Impurities can also be present in auxiliary chemicals added
to the dyebath. Some of these impurities can retard the dyeing process or can cause
spotting. Cook and Tincher reported in 1978 that, when dyeing pantyhoses with disperse
dyes, a dulling of the shade occurred in the tenth dyecycle. According to these
researchers, the number of dyecycles can be increased by passing part of the exhausted
dyebath through a ultrafiltration unit. This will lower the buildup of impurities.
Aftertreatment of the fabric with chemicals is required when dyeing with reactive,
46

vat and sulphur dyes. As a result, storage equipment is required to hold the exhausted
dyebath when the dyed fabric is aftertreated. This increases the equipment cost and the
quantity of water required for cleaning. (Beckmann et al., 1983). Dyebath analysis is
difficult when using reactive dyes because spectrophotometry can not differentiate
between hydrolyzed and intact dyes (Snowden-Swan, 1995).
2.5 DENIM LAUNDRY WASTEWATER TREATMENT
Denim laundry wastewater can be extremely variable in its characteristics. The
TSS can be high due to the use of pumice stones in the washing processes. The organic
loading of the wastewater comes in large part from the first wash cycle. This wash cycle
removes sizes and other chemicals used in previous processing. The BOD, : COD ratio
of the wastewater is typically in the range 1:4 - 1:2 (Ward 1993). The high quantities
of chemicals used in the different processing steps will contribute to the TDS of the
wastewater. Heavy metal levels can be toxic to micro organisms. However, denim
laundry wastewater is not considered toxic by the EPA and most of the laundries in the
United States do not have a pretreatment system. Many will be forced to treat their
wastewater to some extent in the near future because local POTW's can not handle the
high loading of the wastewater.
Ellis Corp. conducted pilot scale studies at a blue jeans manufacturing plant that
included a prewashing facility. The company had problems with BOD, TSS and
manganese. The pilot-scale study included a vibrating strainer, inclined plate clarifier,
dissolved air flotation (DAF) unit and sand filter. Organic polymers and lime added to
the wastewater before the DAF improved the removal of solids and manganese. Some
small pumice stones collected at the bottom of the DAF unit and were removed by a
scraper. The DAF unit was able to remove 60% of the BOD and COD, and most of the
solids. Manganese levels were reduced to acceptable levels. Waste collected in the
different treatment steps was dewatered with a rotary drum, vacuum filter. The volume
47

of the sludge was reduced 3.5 times. The second phase of the study concerned the
potential reuse of the treated effluent. It was estimated that 50% of the water could be
reused without further treatment. Use of ultrafiltration and reversed osmosis membranes
would make it possible to reuse an additional 25% . (Davis, 1991)
Ward reported in 1993 that membrane filtration of denim laundry wastewater
produced water that can be recycled. Recycling 60-70% of a laundry’s effluent was
possible. The membrane concentrate needs further treatment before it is discharged to
the sewer. He recommended the use of a screen to remove lint and large stones. Pumice
stones escaping the screen had a low density due to their porosity and could be remove
in a DAF unit. The BOD loading of the wastewater was reduced through biological
treatment. Removal of color was achieved through absorption of dyes on the
microorganisms. Further color reduction was possible by DAF, coagulation and
sedimentation, chemical oxidation, membrane filtration and carbon adsorption. Membrane
filtration and carbon adsorption of the complete stream is costly and should only be used
as a polishing step after biological treatment.
A major jeans manufacturer installed a two-step wastewater treatment system.
Settleable solids were removed in a sedimentation clarifier after equal&ion of the waste.
A DAF unit removed floatable solids, oils and greases. Chemicals added to the water
before the DAF unit improved removal of solids. The second phase of the wastewater
treatment system included the use of reverse osmosis membrane systems. The treated
wastewater was of drinking water quality and could be reused as process water. (Davis,
1990). According to Davis, recycling wastewater becomes economically attractive if
water and sewer charges are over $5 per 1000 gallons.
2.6 CASE STUDIES
In the previous sections of this chapter the different parts of pollution prevention
were discussed. Each section also contained a number of case studies that applied to that
48

technique. This section discusses two pollution prevention audits conducted at textile
mills. (EPA, 1991).
2.6.1 Burke Mills, Inc. Valdese, North Carolina.
This company processes texturized polyesters and produces high twist filament
yarn for sewing thread and neckwear emblems. The mill includes a dyehouse for spun
yam, filament yarn and stretch nylon.
The company uses l,l,l-trichloroethane to clean the yarn pretreatment machinery.
Proper disposal of the solvent costs $650 per 55 gallon drum. In 1985, the company
decided to purchase the 1,l,1-TCE in 3,000 gallon shipments instead of 55 gallon drums.
A distillation unit was purchased for $ 6,500. The unit was able to reclaim more then
90% of the solvent. As a result, the amount of solvent that had to be disposed of dropped
from 5,400 to 55 gallon a year. The total annual savings were reported as $99,964 with
a payback period of less than one month. The bulk purchase of 1,l,1-TCE saves the
company $11,330 per year. Housekeeping was improved through central distribution of
the solvent that resulted in safer conditions and improved control over the chemical.
The solid waste produced at Burke Mills, Inc. was significantly reduced through
recycling plastic cylindrical tubes, dirty and excess yam and cardboard. The excess and
dirty yarn is sold to a company that chops the yam and uses it as stuffing material.
Approximately 100 tons of yarn are sold for recycling every year. The non-reusable
plastic yarn tubes are sold to the supplier. There the tubes were melted and reformed into
new yam tubes.
2.6.2 Amital Spinning Corporation, New Bern, North Carolina.
Amital Spinning Corp. produces acrylic yam for the sweater industry. Ninety
percent of the yam is dyed at the company. Batch dyeing of yarn results in the largest
49

waste stream: 320,000 gallons per day for the processing of 12 batches of yarn. In 1988,
the company’s monthly water supply and disposal bill is $26,000.
The management decided to reuse non-contact cooling water and process water.
The non-contact cooling water is reused for the preparation of the dyebath if its
temperature is 140oF or more. The non-contact cooling water with a temperature below
140oF is pumped into a tank and reused as non-contact cooling water. An altimeter is
installed in the tank to control the pump and keep the water level in the tank at 17 to 21
feet. The cooling system runs on recycled water when available and switches to city water
when the water level in the tank is too low.
Through dyebath reuse, the mill manages to reuse the contact water and chemicals.
The exhausted dyebath is pumped back into preparation tanks. Here, the chemicals are
replenished. Water is added to replace the water lost through evaporation and absorption
onto the fabric. The water source for this is the non-contact cooling water with a
temperature of 140°F or above.
The reuse of non-contact cooling water and process water has resulted in a 60%
reduction of water use and wastewater generation, but has not affected the quality. The
water use dropped to 102,000 gpd for processing 20 batches. The average water supply
and disposal bill was $13,000/month, a 50% decrease. The payback period was less then
30 days due to reduced water costs and increased production.
50

CHAPTER 3: METHODS AND MATERIALS
3.1 APPROACH
This research was conducted by working closely with four different textile wet
processing plants located in Virginia. The plants included:
- Plant 1: A denim stone washing and bleaching facility. This laundry washes
cotton shirts, socks and hats, in addition to denim.
- Plant 2: A glass fiber processing plant. The mill receives fiberglass yam and
converts it to a woven fabric to which special finishes are applied.
- Plant 3: A cotton and polyester/cotton dyeing and printing mill. Pure cotton
and polyester/cotton blend fabric are received from weaving mills all over
the world.
- Plant 4: Nylon yarn dyeing and finishing facility. The processed yarn is
used for the production of industrial carpets.
Each plant was visited several times over the course of this project (7/15/94 -
3/3l/95. During the first visit, the production facility of the plant was toured, and a set
of forms was given to the person responsible for environmental issues. A copy of these
forms can be found in Appendix A. The forms were developed to provide information
about the pollution prevention and waste minimization techniques currently practiced at
the plant. The basic format for these worksheets was taken from the EPA publication,
“Facility Pollution Prevention Guide” (1992).
During the next visits, employees operating machinery and management personnel
were interviewed to identify points in the manufacturing process where pollution
prevention (P2) techniques might be successful. The operations were observed for 2 to
4 hours in Plant 2, and 3, and 24 hours in Plants 1, and 4. The number of visits
51

depended on the situation at the mill. Some facilities had a significant collection of
wastewater quality data, computerized inventory and purchase files, flow measurements
and/or flow estimates of the different wastewater sources. These facilities required fewer
visits.
Wastewater samples of each of the mill’s operations were taken and analyzed for
chemical oxygen demand (COD), dissolved organic carbon (DOC), color, total suspended
solids (TSS), pH and temperature. Lead, copper, zinc, nickel, and chromium levels were
also determined. All the analyses were performed according to Standard Methods for the
Examination of Water und Wastewater (1991). The information collected was then used
to set up a material balance for each unit operation. Other information collected included
water and air permit applications, wastewater analyses, water and sewage bills, etc. A list
of all the information obtained at each plant is given in Table 3.1. The physico-chemical
treatability wastewater from Plants 1 and 4 was tested using the jar test method. A short
term biological treatability study was performed for Plant 4.
This information was used with the material balances to make recommendations
to the mill’s management concerning possible implementation of P2 options. The
technical feasibility of the ideas was discussed with management personnel of each mill.
An economic analysis of proposed changes was developed as the last step for some
options.
3.2 BATCH BIOLOGICAL STUDY
A short term biological study was conducted using wastewater from the nylon yarn
dyeing and printing facility (Plant 4). Both aerobic and anaerobic reactors were used in
this experiment. Mixed liquor (17 1) of the POTW’s activated sludge system was aerated
constantly in a batch activated sludge reactor and feed was added two times per day. The
reactor operated at an hydraulic retention time (HRT) of three days and a mixed liquor
volatile suspended solids concentration of 3,000 mg/l. A 2.4 liter bottle was filled with
52

mixed liquor from the POTW’s anaerobic digester. The MLVSS of the anaerobic reactor
was 10,000 mg/l. The bottle was closed with a rubber stopper, and purged with N2 gas.
Twice a day, feed solution was added to the anaerobic digester. The HRT of the reactor
was 3 days. During the acclimation period the concentration of the textile waste in both
the anaerobic and aerobic reactor feeds was increased by 10% per day. The sludge was
allowed to acclimate to the textile wastewater over a period of 10 days.
Table 3.1: Information Collected at Participating Mills (Harries, 1994)
Design Information
Environmental Information
Raw Material Data
Other Information
Process Mow DiagramsProcess DescriptionMaterial BalanceWastewater Analysis DataWater Permit ApplicationAir Permit ApplicationDisposal RecordsMaterial Safety and Data ShutsRaw Material Inventory recordsChemical UsageGas and/or Coal BillRequired Water QualityTreatment and Disposal CostsWater and Sewer Charges
The biological treatability experiment was performed by filling 300 ml BOD
bottles with a mixture of anaerobic or aerobic sludge, municipal waste and textile waste.
The experiment was set up so that there were four sets of bottles. Each set contained a
different amount of textile and municipal waste, approximately 3,000 mg/l MLVSS and
250 ml wastewater. The anaerobic bottles were closed with rubber stoppers, and the
aerobic bottles were aerated by means of porous air stones. After 2,4,6,10 and 14 days,
biodegradation was checked by measuring the COD, TSS,
53

Nitrogen and phosphorus were added to the reactors according to the percentage
of textile waste in each reactor. It was assumed that the textile wastewater did not
contain any phosphorus and nitrogen. Ammonium mono basic phosphate (NH4H2PO4)
was added to satisfy the nitrogen and phosphorus demand of the sludge. The amount
added to each bottle is given in Table 3.2.
3.3 COAGULATION EXPERIMENTS
The coagulation experiments were performed in a jar test. A measured amount
of coagulant was added to 500 ml sample and mixed at 100 rpm for 1 min. The mixing
speed was then lowered to 30 rpm, and mixing was continued for 29 min. The samples
were then allowed to settle 1 for 30 min. A sample of the supernatant was analyzed for
total suspended solids and color. The coagulants used for the different plants are given
in Table 3.3.
54

Table 3.3: Coagulants Used in the Jar Tests.
Denim laundry Inorganic chemicals Al2(SO4)3 , FeCl3
Cationic polymers Selfloc 1438
Al220
577C
Nylon dyeing and processing plant inorganic chemicals Al2(SO4)3 , FeCl3
Cationic polymer Selfloc 1438
Al220
577C
Anionic polymer A130
3.4 ANALYTICAL PROCEDURES
The color in American Dye Manufacturers Institute (ADMI) units was measured
using a Bausch and Lomb, Spectronic 20 spectrophotometer (1.0 cm pathlength) for
samples from Plants 1 and 2. The color in water samples from the other plants was
measured using a Beckman DU Series 600 spectrophotometer (1 .0 cm pathlength). After
filtration of the sample with a 1.2µm glass microfiber filter and adjustment of the pH of
the samples to 7.6, the percent transmittance was measured at 590 nm, 540 nm and 438
nm. Distilled water blanks were used for 100% transmittance.
The DOC was analyzed using a Dohrmann, DC-80, total organic carbon analyzer.
The samples were aerated to remove inorganic CO2 after filtration with a 1.2 µm glass
microfiber filter and acidification (pH < 2). Depending on the expected organic carbon
concentration, a 40 µl (400 - 2000 mg C/l), a 200 µl (10 - 400 mg C/l) or a 1 ml (0 -
10 mg C/l) syringe was used to inject the samples into the DOC analyzer.
Total suspended solids (TSS) were measured according to Section C of Standard
55

Methods for the Examination of Water and Wastewater (1991). A measured amount of
sample was pipetted onto a glass microfiber filter with a pore size 1.5 µm and dried at
103o C for 1 hour. Before weighing, the samples were placed in a desiccator and allowed
to cool for 10 min.
The pH was measured using a Fisher, Accumet pH meter, model 610A. The pH
meter was calibrated with pH 7 and pH 4 buffers before the pH of samples was measured.
For the measurement of the metals, a Perking Elder, atomic absorption
spectrophotometer, model 5l00PC, was used. Each sample was filtered using a glass
microfiber filter with 12 µm pores and acidified with HNO3 to pH below 2.
The COD of the samples was determined after making proper dilutions. The
closed reflux, titrimetric method was used. The digestion period was two hours. A
description of the method can be found in Standard Methods for the Examination of
Water and Wastewater (199 1).
56

CHAPTER 4. DENIM LAUNDRY
4.1 PROCESS DESCRIPTION
The different washes performed at this laundry include Super Soft Wash, Sand
Wash, Stone Wash and Simulated Stone Wash. Each wash consists of a number of wash
cycles. Among the different wash cycles are: desize, stone wash, sand wash, enzyme
wash, bleaching, antichlor, softener, and dye fixation. Each wash cycle is always
followed by a clear rinse to remove chemicals. The number of possible combinations and
the variation in sequence of the wash cycles results in over 300 different wash procedures.
The variability in the production process is further increased because the laundry does
commission work for several textile mills. Each mill has its own style and shades which
is reflected in the use of different chemicals, duration of washes, etc. Figure 4.1 gives
an overview of the wash procedures. Rinses are not included in the schematic diagram,
but an understanding of when garmentsare rinsed can be gleaned from the text below and
Table 4.4.
A Super Soft Wash consists of three wash cycles. The first cycle removes the size
and unfixed dye. This cycle is followed by a clear rinse and a wash cycle containing
softener. Sometimes, a second rinse and another softener cycle are part of the wash
formulation. Most other wash procedures involve the removal of size in the first cycle.
The next cycle is usually a bleach cycle to remove some of the unfixed dye. Bleach can
be used separately or together with sand or pumice stones. Bleaching is a very delicate
process since the strength of the bleach can change. The washer operator has a sample
of the bleached garment. (S)he will wet this sample and visually match the color of the
sample with the color of the clothes in the washer. The use of sand, stones and/or
enzymes gives the garment a worn and aged look. In a Simulated Stone Wash, the aged
and worn look is obtained by the action of enzymes. A sodium bisulfite cycle follows
the enzyme wash cycle to neutralize the action of the enzymes. A Simulated Stone
57

Wash can also include a bleach cycle.
Figure 4.1: Process Flow Diagram of the Super Soft and Stone Washing Laundry.
Sometimes, the dyes are not fixed onto the fabric when the apparel arrives at the
laundry. The first step in this wash (dye fixation) is the addition of a fixative to the wash
water. The clothes are dried after the wash procedure and extraction of excess liquor.
This ensures proper fixation of the dyes. The garments are then loaded back into the
washer to remove the chemicals and for further processing.
After the wash procedure, the clothes are dried and sorted according to size. The
clothes are then shipped to the manufacture in large cardboard boxes or are finished after
being dried in one of the two dryers. Finishing includes inspection, ironing, and tagging.
These clothes are shipped to stores in small boxes.
58
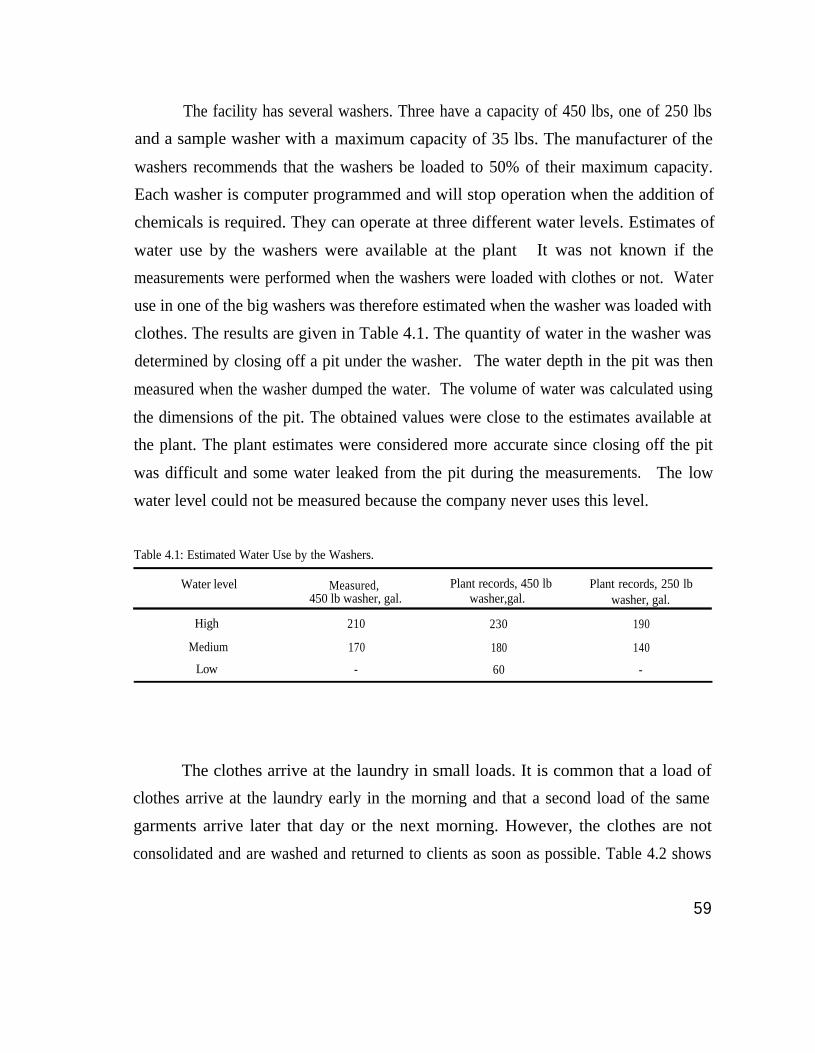
The facility has several washers. Three have a capacity of 450 lbs, one of 250 lbs
and a sample washer with a maximum capacity of 35 lbs. The manufacturer of the
washers recommends that the washers be loaded to 50% of their maximum capacity.
Each washer is computer programmed and will stop operation when the addition of
chemicals is required. They can operate at three different water levels. Estimates of
water use by the washers were available at the plant It was not known if the
measurements were performed when the washers were loaded with clothes or not. Water
use in one of the big washers was therefore estimated when the washer was loaded with
clothes. The results are given in Table 4.1. The quantity of water in the washer was
determined by closing off a pit under the washer. The water depth in the pit was then
measured when the washer dumped the water. The volume of water was calculated using
the dimensions of the pit. The obtained values were close to the estimates available at
the plant. The plant estimates were considered more accurate since closing off the pit
was difficult and some water leaked from the pit during the measurements. The low
water level could not be measured because the company never uses this level.
Table 4.1: Estimated Water Use by the Washers.
Water level
High
Medium
Low
Measured,450 lb washer, gal.
210
170
-
Plant records, 450 lb Plant records, 250 lbwasher,gal. washer, gal.
230 190
180 140
60 -
The clothes arrive at the laundry in small loads. It is common that a load of
clothes arrive at the laundry early in the morning and that a second load of the same
garments arrive later that day or the next morning. However, the clothes are not
consolidated and are washed and returned to clients as soon as possible. Table 4.2 shows
59

the number of wash formulae, the total weight of clothes washed and the number of loads
of a specific wash formulation in a single day at the plant.
Table 43: Reduction Schedule at the Denim Laundry.
Wash cycle Total load, lb
Soft Wash # 1 845
Number of loads washed
6
Soft Wash # 2 660
Soft Wash # 3 516
Soft Wash # 4 702
Soft Wash # 5 672
Soft Wash # 6 353
Soft Wash # 7 511
Soft Wash # 8 447
Soft Wash # 9 575
Soft Wash # 10 632
Simulated Stone Wash 336 2
The facility has two dryers. Hot air for the two dryers is provided through heat
exchange. One heat exchanger heats up the air circulating the dryers by steam produced
in the boiler. Condensate water is returned to the boiler. The source waters are hard, and
large quantities of water softening chemicals are added to the boiler.
4.2 WATER SOURCE
The facility has two different fresh water sources, groundwater from on site well
and municipal water. The well pump is designed to deliver 18,000 gallons in 13 hours.
The remaining water demand is supplied by a 2-inch water line from the town. The well
water flows into three interconnecting fresh water tanks. If the water level in these tanks
60

Table 4.4: Characteristics of the Spent Washwater of a Simulated Stone Wash.
Wash cycle
Desize
Rinse
Enzyme
Rinse
Bleach
Rinse
Antichlor
Rinse
Softener
Rinse
softener
mg/l
2,773
479
922
186
322
96
49
17
55
24
25
C O D Color Conductivity pH Temperature TSS TDSmg/l ADMI mmho oC mg/l mg/l
3,580 1,902 1 .78 8.8 62 468 6,932
1,225 438 0.44 8.1 59 122 988
4,930 1,202 0.44 6.0 51 197 1,503
445 358 1.28 9.8 58 151 1,205
288 153 5.70 8.5 67 130 4,758
294 199 1.15 7.1 52 105 963
243 131 1.61 5.9 67 78 1,374
68 70 0.43 6.3 66 72 372
225 200 0.71 8.8 72 86 696
79 99 0.23 8.1 55 63 277
85 29 0.20 8.0 53 105 161
Table 4.5: Characteristics of Spent Washwater of a Super Soft Wash.
Wash cycle
Desize
softener
mg/l
247.2
156.5
CODmg/l
957
464
Color
64
125
Conductivitymmho
0.41
0.20
pH
9.18
7.62
Temperature TSS TDSOC mg/l mg/l
61.1 18 526
63.0 11 219
63

This water contains chemicals from the previous wash. It should therefore be possible
to reuse this water as wash water in the next batch, using the same technique as in
dyebath reuse. In other words, the clear rinse following the enzyme wash contains
enzymes and auxiliary chemicals used in the enzyme wash. It is, in theory, possible to
transfer this water into a holding tank, add the required chemicals and reuse it in the
enzyme wash of the next batch. However, Table 4.4 shows that the clear rinse water
following the enzyme wash also contained a significant amount of color. If colored water
is used as process water it is likely to stain the white pockets of the jeans. It is not
known at what level color is acceptable. It is recommended that the company investigate
which color level is acceptable. This will make it possible to determine which spent
washwaters can be reused directly and which waters need pretreatment.
4.4 WASH SCHEDULES
During some visits, the washers were cleaned when washing light colored apparel
after darker colors by filling the washers with hot water. Some detergent was added to
the washer. The washer was then operated for 10 to 20 minutes. Sometimes this
procedure was repeated. The decision to clean the washers and the number of times the
washer was cleaned depended completely on the judgement of the washer operator. One
day, the same dark clothes were washed during the first and the second shift. The first
shift operator decided to clean the washers two times. The second shift operator cleaned
the washer only once. Therefore, each large washer was cleaned three times since these
clothes were washed in all three large washers. The total water consumption for the
cleaning operations was approximately 3,000 gallons. The problem was that part of the
wash load arrived early that day, and the second part in the afternoon. If all the
clothes were washed in the second shift, the water consumption for cleaning would have
been 900 gallons.
On another day, the washers were cleaned several times and there was no
64

consistency in the cleaning of the washers. For example, one washer was cleaned when
white clothes were washed after beige clothes. The exact same sequence of wash
procedures in another washer did not result in cleaning. Washing navy blue clothes after
red colored garments also required cleaning whereas washing beige clothes after navy
blue clothes did not. The total number of washer cleanings performed that day was 11.
Better organization of the washes could have reduced the number of washer cleanings to
three if the dark clothes were washed in all three large washers. The dark colored
garments could have been washed in one washer due to the small load of each color.
This would have reduced the number of cleanings from eleven to one. The water savings
were sufficient to do three to five batches of a Super Soft Wash.
Efforts should be made to determine when cleaning the washers is required and
the number of cleanings. According to the management, holding the clothes to better
organize the washings is not possible because the customers want their clothes returned
quickly. Better communication with clients will perhaps allow for better organ&ion of
wash schedules, savings of water, chemicals, energy, and reduce the potential for errors.
The company should consider offering a reduction in cost to clients who can be more
flexible in when clothes must be returned. It is likely that being able to better schedule
the washing of dark and light clothes and similar types of clothes will result in a savings
of wash water and clean-up waters.
4.5. BLEACH QUALITY
The supplier of the bleach delivers bleach with a specific gravity (S.G.) of 1.2.
The bleach has a concentration of 15% by weight. The washer operators noticed that they
needed longer bleach cycles to match the shade of the sample when the bleach storage
tank was almost empty. This led them to believe that the strength of the bleach decreased
over time. Also,’ the strength of the bleach varied with each delivery. Scott (1990)
reported the same problem. The management of the laundry has made efforts to find a
65

practical method to check the strength of the bleach. However, they have not found a
usable method.
A company in England checked the strength of their bleach by testing the specific
gravity using a hydrometer (Scott, 1990). The strength of the of bleach was determined
with a graph that gave the bleach strength as a function of the specific gravity. The same
method can be used at this plant to detect variations in the bleach strength. This will
allow to adjust the volume of bleach needed.
4.6 PRETREATMENT
As mentioned before, the results of the spent wastewater analysis (Table 4.4 and
4.5) show that some water can probably be reused without pretreatment. Other
wastewater will need some treatment before reuse is possible. Some
coagulation/flocculation/sedimentation experiments were therefore performed on this
wastewater. The wastewater used for these experiments was collected as a grab sample
of combined wastewater. The sample was taken before the 200 mesh screen After
flowing through the screen, the wastewater is chlorinated, stored and then discharged to
the sewer.
4.6.1 FILTRATION
A known amount of wastewater was filtered using filters of different pore sizes.
The method used to determine the amount of solids retained on the filters was the same
as used for the determination of TSS. The color of the filtrate was determined after
adjusting the pH of the filtrate to pH 7.6. The transmittance of light through the samples
was determined at 438 nm, 540 nm, and 590 nm. A value for the color was then
calculated using the equations used to calculated the color in American Dye
Manufacturers Institute (ADMI) units. If the sample was filtered with a 1.2 µm filter, the
66

color of the filtrate could have been expressed in ADMI units.
The experimental results are given in Table 4.6 and in Figure 4.2. The results also
show that a significant amount of color is associated with the solids on the filtrate.
Interpolation of these results shows that 40% of the solids would be retained by a filter
with 1 µm pores.
Table 4.6: Results of Filtration Experiment.
Filter Pore size Filter type Color Cumulative solids % Solidsµm ADMI removal. mg/l retained
25 Whatman 4 1,777 14 0.85
11 Whatman 1 1,727 29 1.77
8 Whatman 2 1,713 68 4.15
1.5 Whatman 934-AH 809 362 22
0.8 Gelman GN-4 589 760 46
0.45 Gelman GN-6 257 1,640 100
The breakdown of solids used in stonewashing produces a wastewater high
it solids. The 200 mesh screen is reported to remove 8 to 10 tons of lint, solids and grit
in one week when many stonewashing cycles are performed. The number of
stonewashing cycles performed during the period of this study was low, and no data to
support this removal are available. However, Young (1990) reported that wastewater
from stonewashing operations can have a concentration of suspended solids of up to 2,000
mg/l after passing through a 80 mesh stainless steel shaker screen. Davis (1991)
recommended the removals of solids by sedimentation or flotation after the addition of
chemicals. Therefore, jar tests were performed to investigate the removal of color and
TSS. The coagulants used included FeCl3, alum, Al220, Selfloc 1438 and 577C. Selfloc
1438 and 577C are cationic polymers. Al220 is a cationic polymer that contains alum
polyamine. Only alum and 577C gave promising results and are included in the

discussion.
Figure 4.2: Color and Cumulative Suspended Solids Content after Filtration.
4.6.2 Coagulation with Alum
The initial TSS and color of the wastewater was 362 mg/l and 807 ADMI,
respectively. The formation of flocs was visually observed at a dose of 200 mg/l and
higher. Table 4.7 and Figure 4.3 show that 200 mg/l alum is the best concentration of
those considered for the removal of solids. The TSS at alum concentrations below 200
mg/l was higher than the TSS of the control. For example, the TSS was 315 and 520
mg/l at 50 and 100 mg/l alum. Poor sedimentation was visually observed in jars with an
alum concentration of 200 mg/l or higher.
68

Table 4.7: Coagulation with Alum at pH = 6.
Alum dose True colormg/l ADMI
raw wastewater 807
0 807
Apparent color
1,873
Suspended solidsmg/l
362
236
20 1,172 1,836 280
50 794 1,828 315
100 600 1,725 520
200 516 1,001 145
400 578 1,193 159
figure 43: Coagulation with Alum at pH = 6.
Once the best alum dose was determined, the influence of the pH on coagulation
was investigated. The results are shown in Table..4.8 and Figure 4.4. Comparison of
Figures 4.3 and 4.4 show that the solids concentration in the supernatant at pH 6 is very
69

different in both experiments. This can be explained by the collection of unsettled flocs
when a sample was taken for the determination of TSS.
Table 4.8: Coagulation with Alum (200 mg/l) at Different pH levels.
pH
6.2
3
4
5
6
7
8
True colorADMI
807
397
405
271
385
431
534
Apparent color
1,804
695
842
1,430
1,077
1.384
suspended solidsmg/l
362
350
190
267
358
293
343
4.6.3 Coagulation with a Cationic polymer, 577C
The results of this jar test are shown in Table 4.9 and Figure 4.5. Only a few
very large, unsettleable flocs were formed at all concentrations. These flocs were so large
that they were not disturbed when collecting supernatant for TSS determination.
4.7 RECOMMENDATIONS
Efforts should be made to determine when cleaning the washers is necessary.
Large quantities of water are currently wasted by leaving this decision to the washer
operator. The number of washer cleanings can probably also be reduced by improved
communication with the clients and by giving a cost break to clients who can allow more
time for the return of their materials. This would allow the company to better schedule
the order of washes from light to dark clothes, thereby reducing the amount of clean-up
70

1600
3 4 5 6 7 8pH
Figure 4.4: Coagulation with Alum (200 mg/l) at Different pH Levels.
Table 4.9: Coagulation with Cationic Polymer 577C, pH = 7.
Polymer dosemg/l
True colorADMI
Apparent color Suspended solidsmg/l
raw wastewater 807 - 362
0 755 2,051 173
2 775 1,885 127
4 708 1,846 118
1O 613 1,723 167
20 552 1,854 200
50 321 2,146 250
time and rinse waters required to manage a miscellaneous assortment of light and dark
garments. The chemical feed boxes of the washers overflow when too much chemicals
71

Figure 4.5: Coagulation with Cationic Polymer 577C, pH = 7.
are used, when the washer malfunctions or when the chemicals added form stable foams.
As a result, the floor space between the washers is wet and slippery. Care should be
taken not to use more chemicals than is absolutely necessary. A small strip between the
washers is screened. This allows liquid to flow to a gutter underneath. The area of this
screen should be expanded so that the liquid between the washers will drain more
completely. It is also likely that automatic feed systems that can be programmed based
on garment type, load and color would help reduce chemical costs and wastage.
The strength of the bleach can be checked by measuring the specific gravity of the
bleach. A plot of the specific gravity versus the strength of the bleach should be made
to discover variations in the bleach strength. The volume of bleach needed can be
adjusted to the strength of the bleach.
72

Antichlor is used after each bleach cycle to stop the action of the bleach. The
amount of antichlor added to the washers is 33% in excess of the theoretical amount
needed. The amount added should be closer to the stoichiometrical amount needed. An
excess of 5-10% is probably sufficient.
Acetic acid is used in this laundry for pH adjustment. This chemical has a high
BOD (0.64 lb/lb) and therefore increases the waste load of the effluent. Substitution of
this acid by formic acid (BOD 0.12 lb/lb) will reduce the organic load of the wastewater.
This reduction can be significant on certain days and can be important if the management
personnel decides to treat the wastewater on-site.
Flocculation of suspended solids and removal of color is possible through the
addition of alum or cationic polymer, 577C. The TSS can be reduced from 362 to 145
mg/l by the addition of 200 mg/l alum. A reduction of 69% ( from 362 to 118 mg/l)
is achieved with 4 mg/l 577C. It is not clear if this is sufficient to produce water of
reusable quality. Further investigation is required to identify practical treatment methods
for the company. The poor settlement of the formed flocs suggests that the use of a
DAF unit should be studied more closely. And, as mentioned earlier, there may be waters
that can be collected and reused without treatment once the required quality of water for
different washing operations is established.
Currently, no efforts ‘are made to recycle paper, plastic and metals. The fabric
arrives at the laundry in cardboard boxes. These boxes are often damaged and reuse is
not possible. After washing,-the clothes are bundled according to size and transported in
open boxes. These boxes are covered with brown paper. The amount of paper used is
often in excess of the amount needed. A more efficient way of transporting the washed
clothes would be in plastic boxes with reusable lids. If reuse of material is not possible
it should be collected and recycled. This will reduce the quantity of waste landfilled and
therefore reduce disposal costs.
73

CHAPTER 5. FIBERGLASS PROCESSING PLANT
The insulating and fire resistant properties of fiberglass fabric make it useful
in a variety of applications. Fabric produced at this plant is used in printed circuit
boards, and as insulation wrappings for electrical components and cables. Other
products of this mill are used as heavy weight asbestos replacement fabrics (lagging),
insulating blankets, high temperature particulate filters, vertical blinds and ceiling
board facings. A small amount of Kevlar fabric is manufactured.
5.1 PLANT DESCRlPTION
The yarn enters the plant wound on small bobbins or beams. During yam
warping, yarn from up to 1500 bobbins is wound on one beam. If the yarn is used
as warp yam, it goes to the slashing department. Here, the yarn passes through a pad
pan containing sizing chemicals. The chemicals are heat set by passing the yam over
steam cans. The yarn on up to four beams can pass simultaneously through one
slasher. The yarn on those four beams will be collected on one beam. The number
of beams used simultaneously in one slasher depends on the length and width of the
fabric for which the yarn till be used. Two or more strands of yam are twisted
before warping. Afterward, both fill and warp yarn go to the weaving area for the
production of woven fabric..
After weaving, a portion of the fabric is subjected to mechanical processes
(cutting, slitting, etc.) and shipped as greige fabric. When finishing is required,
chemicals may be applied on the greige (loom-state) fabric, but usually the fabric is
heat cleaned before finish application.
There are three types of heat cleaning. The majority (8040%) of the size
chemicals and original yam binders are removed in a process called caramelizing.
This involves passing the fabric through a gas fired oven at 800-125OoF. The
74

temperature in the oven depends on the fabric weight. At this point a portion of the
fabric is sold for coating or leaching. Finishes that do not need complete removal of
organics can be applied at this point. Heat treatment is continued in batch ovens at
a temperature of 650-720oF for up to 72 hours if a clean (less than 0.04% residual
organics) fiberglass fabric is required. Batch cleaning only (650-720°F for up to 72
hours) is used for very lightweight or very open constructed fabrics.
Figure 5.1: Flow Diagram of the Fiberglass Processing Plant
After heat cleaning, the majority of the fabrics are treated with hydrolyzed silane
finishes. These finishes typically have a pH in the range 3.5-4 and a shelf life of less
than 24 hours. A small portion of the fabric is treated with resin bonded pigments for
coloration. All the operations in the mill are conducted continuously. Waste yarn is
used to produce insulating mats in the special
75

products department. A flow diagram of the production process is given in figure 5.1.
5.2 WATER USE
The three major uses of water in the production area of the mill are for non-
contact cooling of machinery, chemical mixes and the HVAC system. Table 5.1 gives
an estimate of the water use in the plant. This table shows that cooling machinery is
responsible for almost 80% of the daily water consumption in the plant.
Most of the non-contact cooling water is required in the finishing department.
The chemicals applied to the fabric are set by heating the fabric to 220-625°F. This
process heats the rolls over which the fabric passes which can damage machinery
parts and the fabric. City water flows through the rolls at a rate of 5 to 10 gallons
per minute (gpm) with an average of 6 gpm. After the water passes through the rolls,
it mixes with the wastewater and is discharged to the sewer. There are, in total, 26
non-contact cooling rolls and 4 non-contact cooling jackets in the plant. Non-contact
cooling jackets can be found around chemical pans. There are 8 cooling rolls in the
plant that produce water with a temperature of 140-150oF. These rolls are only used
when performing a special operation. Plant personnel estimated that each of these
rolls operates 6 hours per day and that at any given time 25% of the rolls are
operating. The remaining cooling rolls (18) are estimated to operate 65% of the time
and the cooling jackets (4) during 75% of the time (estimates by the environmental
engineer at the plant). The quantity of water discharged at a temperature of 140-
150°F is 5,000 gpd. Ninety six percent (128,000 gpd) of the non-contact cooling
water discharge has a temperature of 80-90°F. The non-contact cooling water also
include water used for cooling 1 size pan and the guillotine. The guillotine is a
machine that is used in the Special Products department to recycle waste yarn and
‘fabric. The flow rate of the cooling water was measured (6.3 gpm). The guillotine
operates, on average, 9 hours per day.
The HVAC system includes airwashers and humidification equipment,
76

absorption chillers, cooling towers and two boilers. The steam produced by the
boilers is used to heat the building, produce warm water, and heat steam cans. A
small amount of live steam is needed every two weeks to produce hot water for
washing operations. The average boiler water make-up was estimated by plant
personnel for the summer and the winter months. During the summer months (5
months), the boilers operate at 40% of their average winter capacity. The average
boiler make-up is 21% during the summer months and 22% during the remaining 7
months of the year.
There are four air washers in the plant. Plant personnel estimated that each
air washer uses 0.6 gpm. On average, two units (50% operation) operate 18 hours per
day. The blowdown of one washer was measured (0.9 gallons per hour). The
resulting total flowrate for the four washers was 65 gpd.
According to the environmental engineer at the plant, the cooling towers and
chillers require 1.4 gallons of water per ton of cooling due to evaporation. The 1000
tons of cooling available at the plant are, used to cool the buildings during the summer
and to provide cooling water for the air compressors. The blowdown (30% of amount
evaporated) and percent operation was estimated by the HVAC maintenance
personnel. The water used for the size and finish mixes was estimated by the plant
chemist. The quantities of mixes dumped in 1993 were 560 gpd for the finish mixes
and 85 gpd for the size mixes.
The water needed for cleaning of the units was e&mated by the personnel
operating the machines. These estimates are given in the appendix (Table Bl). The
environmental engineer at the plant estimated that 500 gallons per day is lost due to
evaporation.
The domestic and cafeteria water use are estimated on basis of the number of
employees and estimated flowrate of the equipment. For example, it was estimated
that each employee uses the water fountain once during his/her shift. The water used
was estimated to be equal to one glass of water. The washers are used once every
two weeks. The flowrate measured in one of these washers was 10 gpm.
77

A detailed overview of the water use and wastewater generation is given in
Appendix B (Table Bl). The estimated water supplied to each water component is
given in Table 5.1. Table 5.2 gives the daily flowrates generated by each wastewater
component.
Table 5.1: Estimated Water Supplied to the Fiberglass Processing Plant.
Daily water consumptiongpd
Non-contact Cooling Water 133,000
HVAC 16,000
Chemical Mixes (size and finish) 9,100
Washing 1,000
Cleaning 5,000
Domestic 3.000
Cafeteria 700
Total 168,000
Percent of daily water use
79.2
9.5
5.4
0.6
2.9
1.8
0.4
99.8
Table 53: Estimated Wastewater Generation at the Fiberglass Processing Plant.
Non-contact Cooling Water
HVAC
Chemical Mixes
washing
Cleaning
Domestic
Daily wastewater generation, Percent of Daily wastewatergpd Generated
133,000 88.1
6,000 4.8
650 0.5
1,000 0.7
4,500 3.0
3,000 2.0
Cafeteria 510 0.3
Total 149,000 99.6
78

5.3 WASTEWATER CHARACTERISTICS
This mill does not have a pretreatment facility. Wastewater generated in the
different departments is combined and discharged to the POTW. The sewer charges
imposed by the municipality are based on 90% of the mill’s city water intake. The
plant pays a fixed charge per gallon of water discharged, plus a surcharge if COD >
500 mg/l, TSS > 240 mg/l or BOD5 > 240 mg/l. The company is not allowed to
discharge wastewater with one of the following characteristics: BOD5 > 965 mg/l or
COD > 1850 mg/l. To calculate the surcharges, the wastewater treatment operator of
the POTW takes four 24-hour composite samples every month and analyzes them for
COD, BOD5 and TSS. The average COD, BOD5 and TSS were 582 mg/l, 103 mg/l
and 135 mg/l, respectively, during the year.
Samples of the different types of wastewater were collected and analyzed. The
results of the analyses are given in Table 5.3. Samples of domestic and cafeteria
wastewater were not collected. The wastewater characteristics for these sources were
obtained in “Introduction to Environmental Engineering” by Davis and Cornwell
(1991). It was also not possible to collect a representative sample of general cleaning
wastewater. Samples of two different types of finishing mix were taken. The finish
mix of unit 3 represents the type of mix that is used to treat 70% of the fabric. It was
therefore assumed that 70% of this wastewater is generated by this type of mix. The
other type of finish mix is used to treat 10-15% of the fabric, 15-20% of the finishing
processes are mechanical only or are types of finishing mixes not sampled. The
company has four basic sizing mixtures. Two of these mixes were sampled. The mix
with a COD = 160,800 mg/l was chosen, because it had the highest concentration of
PVA and auxiliary chemicals used in the size mixes. The other mix analyzed had a
low concentration of PVA and a small quantity of one auxiliary chemical. The
composition of the other size mixes is different from the two analyzed, but the type
and amount of chemicals used is similar to the ones analyzed.
79


The COD of the combined wastewater was calculated using the COD and flow
of each wastewater component. The only unknowns in this table were the wastewater
characteristics of general cleaning wastewater-s. Therefore, an estimate for the COD
of the general cleaning wastewater was determined by trial and error and incorporated
into the mass balance (Table 5.3). The flowrate (gpd) of each wastestream component
was multiplied by its COD. The summation of these values was divided by the
estimated flowrate of the combined wastewater to give the calculated COD (mg/l) of
the combined wastewater. Three estimates for the COD of the general cleaning
wastewaters are given in Table 5.4 together with the corresponding COD of the
combined wastewater.
Table 5.4: Influence of the COD of General Cleaning on the COD of the Combined Wastewater.
COD general cleaning Corresponding COD formg/l the combined wastewater, mg/l
7,500 494
10,000 576
13,000 658
The estimated COD of the combined wastewater was close to the measured
COD when the COD concentration of general cleaning was estimated to be 10,000
mg/l. This is an acceptable value since the chemical mixes used in the different
machines can have very high COD values (up to 160,800 mg/l). During one visit,
operators were cleaning one of the machines in the finishing department. The
chemical mix used during the previous run was very tough to remove. Eight hours
were needed to clean the machine. The wastewater from this cleaning operation was
very strong in the beginning of the cycle, but dilute at the end. In addition, general
cleaning is very Similar to the washing operations performed at the plant. Washing
operations are performed on Kevlar to remove. sizing and on a portion of the
fiberglass fabric as a pretreatment to heat cleaning. The COD of this water is 4,000
81

mg/l. General cleaning removes essentially the same chemicals, but from machinery
parts rather than fabric or yam. Cleaning the production floor for which detergents
are used is also included under general cleaning. The same procedure was followed
to estimate the TSS of the general cleaning wastewater. The best match was obtained
with a TSS = 3,500 mg/l.
5.4 SOLID WASTE
The mill makes good efforts to reduce the amount of by-products generated
and landfilled. The yam arrives at the plant on reusable pallets and is wound on
plastic creels. These creels are returned to the supplier. The only unrecycled by-
product generated during yarn handling is the plastic wrapped around the shipping
pallets. Waste yarn generated during warping, sizing and weaving goes to the Special
Products department for the production of insulative mats. Fabric is wasted in the
finishing department each time a new roll is started and when chemical baths are
changed. Fabric is also wasted when machines break down. In 1993, 500 tons of
fiberglass were recycled and 600 tons were landfilled.
5.5 FLOW REDUCTION
5.5.1 Approach
The material balance of Table 5.3 shows that almost 80% of the water
consumed is used for non-contact cooling. It is estimated that 4% of this water has
a temperature between 140o and 150°F. This water could be used to preheat the
boiler make-up water. Afterwards, this non-contact cooling water could be cooled
further by a cooling tower or chiller and reused.
The majority of the non-contact cooling water discharged has a temperature
of 8O-90oF. It is possible to reuse this water for preheating other waters or as non-
82

contact cooling water once it is cooled to 65oF, the temperature required for cooling
purposes. Cooling this water can be done by a chiller and/or cooling tower. A
cooling tower could provide the necessary cooling when the wet bulb temperature of
the outside air is below 55oF. Weather data from the Roanoke weather station
(Ecodyne Corporation, 1980) indicated that the average dry-bulb temperature in
Roanoke is at 56oF or below during five months of the year. The data also indicated
that the wet-bulb temperature did not drop below the dry bulb temperature. The wet-
bulb temperature is measured by a thermometer with a wetted wick over its bulb. The
dry-bulb temperature is measured with an ordinary thermometer. Calculations were
performed to evaluate the cost of cooling this non-contact cooling water. The
following assumptions were used in the calculations:
1. The hot cooling water (140 - 150oF) is cooled to 100°F by using it to
preheat the boiler feed water. It is then cooled by a cooling tower or
chiller to 65°F.
2. The chiller has a Coefficient of Performance (COP) of 3. Chillers
usually operate with a COP in the range of 2.5 to 3.5 (Liptak, 1987).
3. Weather data showed that the wet bulb temperature air will allow
cooling of the water by a cooling tower during five months of the year.
However, it is assumed in the calculations that a cooling tower is used
during four months,
4. Installation costs for new pipes and pumps was not considered.
5. The electrical motors of the chiller have a efficiency of 70%.
The chillers and cooling towers available at the plant have a usable cooling
capacity of 440 tons. According to the management at the mill, the available cooling
towers have enough excess cooling capacity to cool the water during the winter
months and probably during the summer months. Two scenarios were investigated
since it is not clear if enough cooling capacity is available during the warmer months
83

of the year. The first scenario assumes that an extra chiller (100 ton cooling capacity)
is installed at a cost of $ 50,000 (installed cost estimated by the environmental
engineer at the mill). A cooling tower would provide cooling during four months
each year. In the second scenario cooling is provided by the equipment available at
the mill.
The cooling required to cool the water, QH ,Btu/hr (Liptàk. 1987):
QH = M *Cp*(T2 -T1) (5.1)
where
QH = heat transfer rate (Btu/hr)
M = mass flow (lbs/hour)
Cp = heat capacity of feed (Btu/lb/oF)
T2= inlet temperature (OF)
T1 = outlet temperature (“F)
The mass flow of water that must be cooled, M (lb/hr):
M -133,000gpd *8.341bs/gal=46,000 *lbs/hours (5.2)24hrs/day
The cooling required to cool ‘the water is then calculated using equation 5.1:
QH = 46,0001bs/hr * 1 Btu/lb/oF * 20°F = 920,000 Btu/hr (5.3)
The energy that the chiller compressor has to deliver, Qc (kWh), is then calculated by
equation 5.4:
Q c Q H * 1 = 920,000 * 1 = 90 kWhCOP 3412 kWh/Btu 3 3412
(5.4)
84

The electrical energy that the chiller motor must deliver, QE (kWh):
Q Q c = 9 0E
= 130kWhE 0.7
(5-5)
where
E = efficiency of the electrical motors of the chiller
It was assumed that the chiller will deliver this cooling capacity 8 months/year.
According to the environmental engineer at the plant, electricity is bought at
$0.05/kWh. It is assumed that the chillers operate 24 hrs/day, 30 days/month. The
electrical cost of the chiller, C ($/yr):
C = 130kWh * 24hrs/day * 30days/mo. * 8mo. = $ 38,000/yr (5.6)
The total cost for the operation of the chiller is therefore $38,000/yr.
5.5.2 Water consumption
The water consumption in the plant will decrease significantly when the non-
contact cooling water is recycled. The temperature of the water entering the chiller
or cooling tower will be on average 85°F since it was recommended that the water
with a temperature of 140-l50°F was used to preheat the boiler feed water. The
increased use of the cooling towers and chillers will increase the water consumption
for the HVAC system. Cooling the non-contact cooling water will require 920,000
Btu/hr (77 Tons of cooling). An extra 3,300 gpd of water are required to account for
evaporation and blowdown ( 1.4 gal per ton of cooling plus 30% blowdown per gallon
of water evaporated).
Holme reported in 1977 that water supply losses due to broken valves,
leakages, etc., varied from 6 - 44 % of the total water supply with an average of
85

25%. Based on these numbers a make-up requirement of 15% in the closed loop
system was assumed.
Table 5.5: Current and Recommended Water Consumption and Wastewater Generation.
current I Recommended
Description Water use Wastewatergpd generation
gpd
Domestic 3,000 3,000
Non-contactcooling water
Washing
Sizing mix
Finish mix
HVAC
Cafeteria
General cleaning
133,000 133,000
l,000 1,000
1,100 85
8,000 560
16,000 6,000
700 500
5,000 4,500
3,000 3,000
20,000 20,000
1,000 1,000
1,100 85
8,000 560
19,300 6,800
700 500
5,000 4,500
Total (Gal/day) 168,000 149,000 I 58,100 36,000
cost (/yr)Savings (/yr)
$87,700 $105,500 $30,300 $25,500
$137.400
5.5.3 Net Savings
The costs related to recycling non-contact cooling water are given in Table 5.6.
As mentioned earlier, the capital cost and operating costs of a chiller are estimated
to be $50,000 and $38,000/yr, respectively. Thus, recycling the non-contact cooling
water can result in financial savings the first year in both cases. This will, however,
depend on the costs related to the operation of fans and pumps and to the cost of
wastewater treatment.
86

Table 5.6: Cost Estimate of Water Recycling.
Chiller installed 88,000 137,400 49,400
No chiller installed 38,000 137,400 99,400
5.5.4 Effects on Characteristics of Wastewater
Recycling the non-contact cooling water in a closed loop will have a major
effect on the characteristics of the waste stream. The influence of the reduced
wastewater flow on the COD and TSS concentration of the water are shown in Table
5.7. The results of the revised material balance show that the COD and TSS
concentration of the combined wastewater will increase to 2,200 mg/l and 537 mg/l,
respectively. The mill would not be allowed to discharge this wastewater, since the
upper limit of the COD is 1850 mg/l. As a result, segregation and pretreatment of the
most polluted waste streams will be required. The load of the combined wastewater
is determined by three streams: dumped size mixes, dumped finish mixes and
cleaning wastewater. Removing the chemical mixes from the combined wastewater
would reduce the COD to 1500 mg/l, (a 33% reduction) and the TSS to 500 mg/l (see
Appendix Table B2). The company would be allowed to discharge this wastewater,
but would have to pay surcharges because the COD exceeds 500 mg/l.
5.5.5 Further Reducing the Flow
Sometimes water flows through rolls that do not need cooling or when a
machine is not operating. Efforts should be made to check each roll in the finishing
department to see if it needs to be cooled. An automatic valve could be installed on
the cooling rolls so that no water flows through the rolls when the machinery is not
operating.
87


5.6 RECOVERY OF PVA
The company has four basic size mix formulations. These formulations all
contain water, PVA and auxiliary chemicals, but in different concentrations. It may
be possible to use left overs of one mix as part of another mix after adjusting the
amount of water and chemicals in the excess size mix. Calculations were performed
to determine the amount of PVA dumped per year. The average pounds of PVA per
gallon of size mix made is equal to, MPVA(lb/gal):
M = PVA (lb/yr)PVA size (gal/yr)
Quantity of PVA dumped every year, QPVA( lb/yr):
QPVA = M P V A * Q s i z e
where
Qsize= the quantity of size mix dumped yearly, gal/yr,
Cost of dumping PVA:
C P V A = Q P V A * P P V A
(5.7)
(5.8)
(5.9)
with P2vA= the unit price of PVA, $/lb
The numbers used in this calculation were provided by the environmental engineer at
the plant. The results of this calculation showed that 7% of the PVA purchased is lost
through dumps which amounts to $9,900 in last PVN/year. If this is not possible,
the PVA could be recovered through membrane filtration (Cook, 1992). PVA
molecules are big which makes it possible to separate them from smaller molecules
like water and detergents. The concentrated PVA can then be stored and used to
make fresh size mixtures.
89

5.7 PRETREATMENT OF CHEMICAL MIXES
According to the chemist at the plant, thirty percent of the finish mixes have
a high pH and are high in suspended solids. Some lab experiments were performed
with this type of finish mix. The mix was allowed to settle for 12 hours. The COD
and suspended solids content of the mix was determined before and after settling.
The results of the experiment are shown in Table 5.8. The results show that
sedimentation removed 34% of the COD and 85% of the solids. These experiments
are promising and more tests should be performed to evaluate the removal of COD
by coagulation, flocculation, and sedimentation.
Table 5.8: Results of Settling Experiment Performed on Finish Mix from Fiberglass Processing Plant.
Sample COD (mg/l)
before settling 75,200
After 12 hours settling 49,600
Percent removal 34%
Suspended solids (mg/l)
17,160
2,500
85%
The majority of the finish mixes (70%) have a shelf life of 24-hours. The pH
of these mixes must be kept at 3 to keep the solution soluble. Neutralization of the
mixes results in the formation of solids which settle out. (Research and Development
Department at the company; Personal communication, 1995a). It should be
investigated how much COD is removed by neutralization of these mixes.
5.8 RECOMMENDATIONS AND CONCLUSIONS
Modifying the non-contact cooling water system so it can be operated as a
closed loop will reduce the wastewater flow by 76%. This will result in significant
annual savings. Economic analysis showed that the first year savings would be
90

$49,400 if an extra chiller is installed. If no chiller is needed, the savings would be
$99,400. Costs related to the operation of fans and pumps would not taken into
consideration. The recycle system will result in a more concentrated wastewater since
the non-contact cooling water contains few contaminants. The finishing and sizing
mixes discharged account for 33 % of the COD load of the combined wastewater.
However, the daily generation of these concentrated waste streams would be less than
700 gallons. It is therefore recommended that these strong chemical mixes be
segregated from the other streams and treated on-site. The performed experiments
revealed that some pretreatment can be achieved by plain sedimentation (Table 5.8).
More research is required to develop a pretreatment system for these strong chemical
mixes. For example, recovering PVA from left-over size mixes will reduce the COD
concentration in the dumped, size mixes, therefore reducing the amount of
pretreatment needed before the wastewater is discharged to the POTW. Seven percent
of the PVA bought is lost through dumps. This accounts for $9,900 per year.
The management of the mill recognizes that the pad pans for chemical mixes
are probably bigger than necessary. The size of the pad pan depends on the number
of times the fabric needs to pass through the pan. In many mills, the fabric passes
several times through the pan, although one pass is enough to give the desired
characteristics to the fabric. Adjusting the number of times the fabric passes through
the pan will make it possible to optimize the size of the pan and therefore the amount
of chemical dumped at the end of the run. The pad pans used in this mill hold 30 to
100 gallons. It is likely that the size of the 100 gallon pans can be reduced.
According to the research and development department of the company, the
size mixes should only be dumped at the end of a run. There is no limit on the life
of the size mixes. Frequently, a size mix is used only for several days. This means
that several tanks of this mix are used unnecessarily. A fresh batch of mix is made
when the amount available is low. Under the current system, a full tank of mix made
at the end of the week and partially stored until the next week. If the slasher
operator, in that following week, detects that the mix has deteriorated (PVA breaking
91

down due to bacterial growth), (s)he dumps it. On the basis of odors and the problem
stated above, 100 to 200 gallons of size are dumped every two days. As an
alternative to the current practice, it would be better to better match the amount of
mix made to that actually needed. Also, a better system than off-odors, alone, is
needed to ascertain the quality of a mix.
The amount of finishing mixes dumped (560 gpd) represents 7 % of the
amount of mixes made (8,000 gpd). Half of the dumps are due to liquid left in piping
and pad pans at the end of the run. The other half is dumped because of errors made
when calculating the amount of mix needed. Calculation errors can be reduced were
the quantity of finish mix needed per type, width and length of fabric recorded and
adjusted each time that combination of mix and fabric is used.
The washers use hot water (170-180°F) at an estimated flow rate of 5 gpm.
Currently, the water is heated by pumping live steam through the washers. These
washers are near dryers that constantly operate at a temperature of 220 to 625°F.
Heating the water by passing it though the dryers before it goes to the washers will
save energy and steam. It is likely that the water can be heated to the desired
temperature within the dryers.
92

CHAPTER 6. COTTON DYEING AND PRINTING MILL
This mill dyes and prints cotton and polyester/cotton blends for the production of
bed linen and draperies. The end products are sheets and pillows used for industrial,
commercial and institutional purposes. The mill also does commission work for
companies such as Revmans, Laura Ashley, etc. The fabric processed at the mill arrives
from weaving plants all over the world. This results in a significant variation in quality
of the greige (i.e. raw, unfinished) goods.
6.1 PROCESS DESCRIPTION
All greige fabric is treated in the bleach and finishing range. The mill has two
bleach ranges that produce 340,000 yards per day. The rolls of greige fabric are checked
at the beginning of the range for correct fabric type, width, etc. If the fabric is used for
the production of sheets, it is pulled through the singer. The gas-fired oven burns fibers
from the surface of the fabric. This operation prevents the development of small balls
of fiber during the use of the linen. The cooling rolls located after the singer in the
bleach range are in part of the singer equipment. The fabric then passes through a quench
box. This box contains hot water and detergent to remove the sizing chemicals from the
surface of the fabric. Excess liquor is squeezed from the cloth and is returned to the
quench box. The fabric is then pulled into a J-box. The dimensions of the J-box allow
the fabric to stay in this box for 1 hour. Steam injected into the J-box maintains the
temperature at 180oF. The combination of detergent, steam and time ensures a complete
breakdown of the sizing chemicals. The fabric then passes through a Tensitrol washer.
This is a washer consisting of one basin through which water flows at a flowrate of 50
gpm and a temperature of 180°F. After the removal of sizes and detergent, the fabric
passes through a saturator where it is saturated with the bleach solution. This solution
contains hydrogen peroxide, caustic soda and auxiliary chemicals. The operator checks
93
the concentration of H202 and caustic soda every 30 min. If needed, the amount of H2O2
and/or caustic soda entering the saturator is adjusted. After it passes through a second
J-box the fabric is washed in two Tensitrol washers in series. The fabric is stored in wet
bins until further processing.
After it is bleached, the fabric passes a first time through the finishing range. The
first operation in the finishing range is spreading the fabric evenly in the Sutton opener.
The fabric is stored in the wet bins in rope form and needs to be spread open before
further processing. The purpose of the wetout pan located at the beginning of the
finishing range is wetting the fabric. Creases in the fabric are then removed by passing
the fabric over steam cans. This simulates ironing the fabric. The fabric then passes
through a pad pan containing pigment dyes. When processing fabric that will be dyed
on the thermosol (or heat setting, dyeing process) dye range, a wetting agent and acetic
acid facilitate the dyeing process. A resin finish to treat fabric that is already colored
would also be added. The tenter frame located after the pad pan dries the fabric and sets
the applied chemicals. This tenter frame consists of 10-l2 ovens in series. The
temperature in each of the consecutive ovens increases gradually from 150°F in the first
oven to 420oF in the last oven. The physical finishing at the end of the range straightens
the fabric before it is wound on a roll. The flow diagrams of the bleaching and finishing
range are shown in Figures 6.1 and 6.2, respectively.
Some fabric passes twice through the finishing range: once to heat set for dyeing
and once to apply resins after the fabric is dyed on the thermosol dye range. The fabric
leaving the finishing range can be further processed on the thermosol dye range or the
printers. Some fabric will go to the sheeting department for the production of sheets
and/or pillowcases. Fabric that does not need further processing is shipped to the
customer. The fabric processed on the finishing range can be visually inspected (graded).
The dyebath of the thermosol dye line contains vat dyes, pigment dyes or disperse
dyes. Sometimes fiber reactive dyes are used instead of vat dyes. After the fabric leaves
the dyebath, it passes through a gas-fired predryer, a set of steam cans and a curing oven.
94

Figure 6.1: Flow Diagram of the Bleaching Operation.
This process allows the fabric to dry slowly and prevents the migration of the dyes. If
the fabric contains polyester, disperse dyes will be set. A chemical pan after the curing
oven contains sodium hydrosulfite and caustic. The sodium hydrosulfite reduces the vat
dyes and makes them soluble. A steamer allows the reduced dyes to migrate into the
cotton fibers. Removal of excess chemicals is achieved in 10 washers. The first two
washers contain hot water to remove excess caustic and reducing chemicals before
oxidation of the vat dyes. Hot water alone is insufficient to remove excess dyes from the
surface of the fabric. The following two washers contain acetic acid and hydrogen
hydroxide to oxidize the vat dyes to their insoluble form. Excess dyes on the surface of
the fabric and chemicals are then removed by soap and hot water. The use of acetic acid
results in the production of acetate. This chemical has to be removed by excess water,
because it will stain the fabric. All fabrics treated on the thermosol range are sent back
to the finishing range before further processing.
95

Figure 6.2: Flow Diagram of the Finishing Range.
The fabric dyed in the finishing range or thermosol can go to one of three printers
that apply a pattern of colors to the fabric. Before the fabric touches the printer blanket,
a layer of contact adhesive is applied to the printer blanket. This glue ensures good
contact between the blanket transporting the fabric and the fabric itself, and prevents the
movement of the fabric during printing. The fabric leaving the printers passes through
a predryer and a curing oven. The glue on the printer blanket is washed-off. This
operation requires a large amount of water. The print paste is made by an automated
system that weighs the amount of dyes needed to obtain a certain shade. Afterward, a
drum is placed under a mixer, and the paste is mixed for 1 to 2 minutes. The mixer lifts
automatically and swings to another drum for rinsing. Flow diagrams of the thermosol
dye range and the printing operations are given in Figures 6.3 and Figure 6.4,
respectively.
96
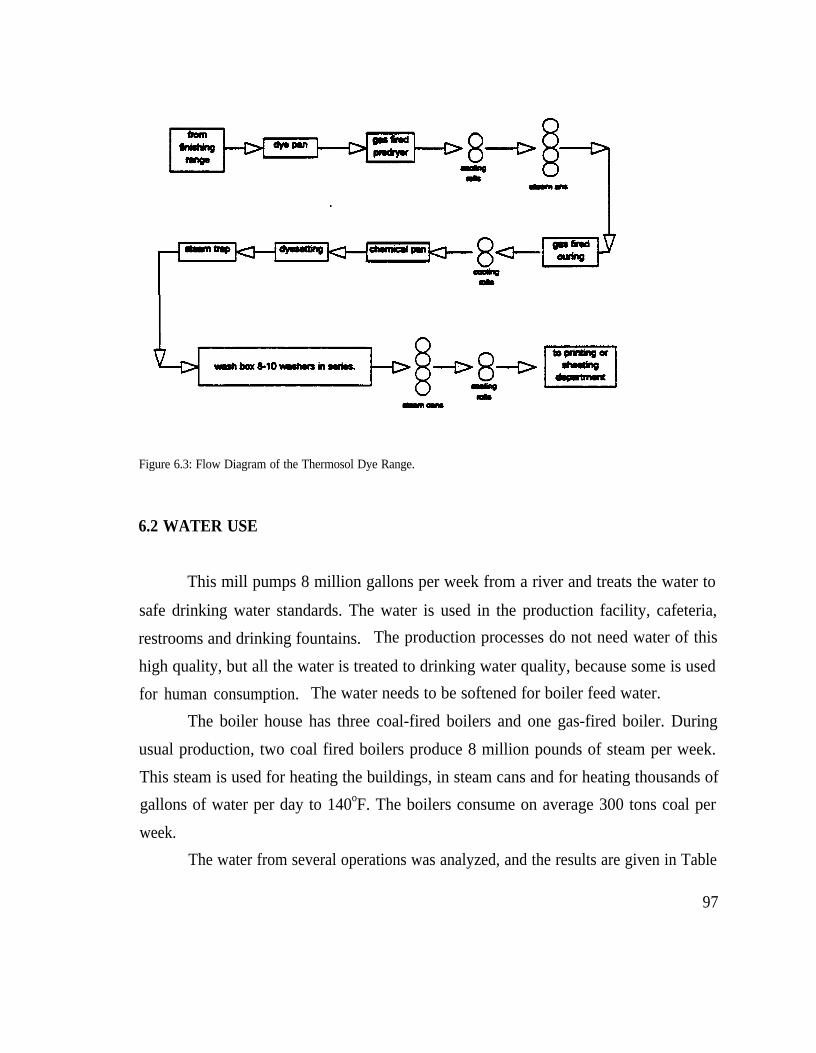
Figure 6.3: Flow Diagram of the Thermosol Dye Range.
6.2 WATER USE
This mill pumps 8 million gallons per week from a river and treats the water to
safe drinking water standards. The water is used in the production facility, cafeteria,
restrooms and drinking fountains. The production processes do not need water of this
high quality, but all the water is treated to drinking water quality, because some is used
for human consumption. The water needs to be softened for boiler feed water.
The boiler house has three coal-fired boilers and one gas-fired boiler. During
usual production, two coal fired boilers produce 8 million pounds of steam per week.
This steam is used for heating the buildings, in steam cans and for heating thousands of
gallons of water per day to 140oF. The boilers consume on average 300 tons coal per
week.
The water from several operations was analyzed, and the results are given in Table
97

Figure 6.4: Flow Diagram of the Print Range.
6.1. Grab samples were only taken from the production processes that seemed eligible
for pollution prevention. Samples of washer 7 and washer 9 in the thermosol dye range
could not be taken since they were not in use at the time visits were made. The
wastewater generated in the. different departments is collected and treated on site by
physicochemical and biological methods and discharged the river.
63 RECOVERY OF NON-CONTACT COOLING WATER IN TEE BLEACH
RANGE
When fabric is treated in the bleach range, it passes through the singer to remove
excess fuzz from the surface. Afterward, the cloth is cooled by 6 cooling rolls. The
flowrate of non-contact cooling water is estimated to be 5 gpm per roll at a temperature
of 170oF. Currently, the heat in this water is recovered before it is discharged to the
98


treatment plant. The heat recovery system is not functioning well due to the number of
leaks in the system. The characteristics of the water are given in Table 6.1.
The characteristics of the singer, non-contact cooling water were compared with
quality standards of process water reported by Beckmann and Pflug (1983). According
to these standards, the process water must be colorless. No value expressing color in
ADMI units is given. Also, no values for chromium and surfactant concentration and pH
are given. The comparison is given in Table 6.2. Visual observation of the samples
showed that they were essentially colorless (30 ADMI units). Chromium and copper
levels were also very low which means that, according to the criteria of Table 6.2., the
cooling water can probably be reused directly. It is recommended that the water is used
in the quench box following the cooling rolls. This quench box has a water demand of
25 GPM at a temperature of 160°F.
Table 6.2: Comparison of Water Characteristics of the Singer Non-contact Cooling Water with Water QualityStandard for Process Water.
This implementation can be achieved with minimal investment and can result in
significant savings. The projected savings were calculated. It is assumed in these
100

calculations that there are no savings in wastewater treatment since the pollution load of
the wastewater does not change. The cost of treating the incoming water is estimated as
$1.4/1000 gallons (plant records). The incoming water has a maximum temperature of
60°F (plant records). The bleach range operates 5,600 hours a year. The company
records show that the boiler house produces steam at a pressure of 140 psia. Hot water
demand of the quench box is 25 gpm at 160°F. The heat required to produce this water,
QH (Btu/yr), can be calculated with equation 6.1 (Liptàk, 1987).
QH =M *Cp *(T2-T1) (6.1)
with
QH = heat transfer rate (Btu/yr)
M = feed mass flow (lb/yr)
CP = heat capacity of feed (Btu/lb/oF)
T2 = outlet temperature (oF)
T1 = inlet temperature (“F)
Therefore,
QH = 25gpm *60 *5,600 hr/yr *8.34 *lb/gal *I Btu/lb/oF <160°F -6OoF) =7 *l09Btu/yr
The steam flow rate, Fs (lb/yr), is given by equation 6.4 (Liptak, 1987).
where
QH = heat transfer rate (Btu/yr)
Fs = steam mass flow (lb/yr)
(6.3)
101

AH, = latent heat of vaporization (Btu/lb) = 868.03 Btu/lb at 140 psia.
Fs =7 *IO9
868.03= 8.1 *l06 lb/yr (6.4)
The consumption of coal can then be calculated. The coal produces 19,100 lbs of steam
per ton of coal burned (Industrial Energy Center). The coal has a average heating value
of 14,000 Btu/lb and a price of $50 per ton.
Fc =8.1 *l06
19,100= 424 tons/yr
where,
FC = mass flow of coal (tons/yr)
The projected annual costs savings per bleach range:
AS = FC *(unit cost of coal) + FW <unit cost of water) (6.6)
AS = 425 *50 + 8.4 *l06 * 1.4/ 1000 = $33,000/yr/quench box
(6.5)
(6.7)
where
Fw= the flow rate of water in the quench box (gallons/yr)
Fw= 25 gpm *60min/hr *56OOhr/yr =8.4 *lO6gal/yr (6.8)
6.4 REDUCTION OF WATER USE IN TEE WASHERS IN THE BLEACH RANGE
Each of the three washers in a bleach range has a water flow rate of 50 gpm at
a temperature of 180°F. There is no counter-current flow between the washers. Washer
102

3 and washer 2 are interconnected, but fresh water is added to both washers. Comparing
the water characteristics of the water in these washers (Table 6.1) shows that the COD,
color and TSS of the water in washer 3 is lower or equal to the characteristics of washer
1 and 2. It can therefore be concluded that the water in washer 3 is less contaminated
and can be recycled to washer 2 following the principle of counter current flow. The
projected savings were calculated using the same technique as in section 6.3.
QH = 50gpm *6Omin/hr *56OOhrs/yr *8.34lb/gal *l Btu/ln/oF *(180°F -6OoF)
Q H= 1.7 *l010Btu/yr
The steam mass flow (lb/yr):
FS =1.7 *lOlO
868.03= 2 *l07 lb/yr
The mass flow of coal (tons/yr):
Fc2 *l07
= - = 1,050 Ton/yr19,000
(6.9)
(6.10)
(6.11)
(6.12)
The flowrate of water saved by recycling water from washer 3 to washer 2, gal/vr:
Fw= 50gpm *6Omin/hr *56OOhr/yr = 17 *l06 gal/yr
AS = 1,050 *50 + 17 *l06 * 1.4/1000 = $76,000/yr
(6.13)
(6.14)
The total savings are estimated to be $154,000 per year because the company has
two bleach ranges. These savings can be achieved without a large investment. However,
103

the management of the company is currently thinking of replacing the Tensitrol washers
by Menzel rope washers. The Menzel rope washers consist of two towers with guide
tubes between the towers. Rollers in the towers guide the fabric through the tubes. The
dirty cloth enters the machine at the bottom. Fresh water enters at the top of the
machine. This results in counter-current flow of fabric and water. The washers will
reduce the flowrate in each washer to 12 gpm. The parts that get in contact with the
fabric are made of stainless steel and are therefore well suited for use in preparation of
textile products. The price of these washers was estimated at $ 113,500 in 1992 by the
manufacturer (Personal communication, Menzel, 1995b). Currently, the three washers
together require 150 gpm. Replacing the existing washer by Menzel rope washers will
reduce the flowrate to 36 gpm (12 gpm/washer), a reduction of 114 gpm. The projected
energy savings and the resulting annual savings are calculated below.
QH = 3.8 *lO10Btu/yr (6.16)
Q H= 114gpm *6Omin/hr *56OOhr/yr *8.341b/gal *l Btu/°F*(180oF60oF)
(6.15)
F = 3.8 *lO10
S 868.03= 4.4 *l07 lb/yr
Fc = 4.4 *107
19,000= 2,30Oton/yr
AS = 2,300 *50 + 38 *l06 *1.4/1000 = $168,000/yr
(6.17)
(6.18)
(6.19)
Calculations showed that replacing the existing washers by Menzel rope washers will save
the company $168,000/yr per bleach range. The simple pay back period is 2.1 years.
104

6.5 WASHERS IN THE THERMOSOL DYE RANGE
The piping for operating the washers in counter-current flow is available.
Removal of caustic and reducing agents before the addition of acid and oxidizing
chemicals is crucial to reduce the consumption of chemicals. This can be achieved by
counter-current flow between washers 4,3,2 and 1. The acid and hydrogen peroxide
in the effluent of washer 3 and 4 will enhance the removal of caustic and reducing
chemicals in washers 2 and 1. Acid and oxidizing chemicals added to washer 4 will flow
to washer 3. This will probably reduce the addition of chemicals to washer 3.
Measurement of the pH and redox potential can help to optimize the amount of chemicals
added to washer 3. The same principle can be used in washer 4. The principle of
counter-current flow can also be implemented between washers 5 and 6 and washers 7,
8, 9, and 10. Figure 6.5 shows the washing process schematically.
Currently, the amount of chemicals added to each washer is not adjusted to the
needs of the fabric. The manager of the thermosol dye range knows that some fabrics do
not need two washers with acid and hydrogen peroxide. It is therefore recommended that
the chemical needs of each fabric be determined and that the chemical feed be adjusted
accordingly.
The use of acetic acid in washers 3 and 4 results in the formation of acetate that
can color fabric if not removed completely by large quantities of water. Acetic acid has
a high BOD and can result in an increased BOD loading to the wastewater treatment
plant. Substitution of formic acid or a inorganic acid for acetic acid will eliminate
problems with the formation of acetate and can reduce the water use. The other acids
will also reduce that BOD loading to the treatment plant. The BOD equivalent of formic
acid is 0.12 lb/lb, whereas acetic acid has a BOD equivalent of 0.64 lb/lb. Formic acid
also has a lower molecular weight, so less formic acid will be needed to achieve the same
pH.
105

Figure 6.5: Schematic Overview of the Washers in the Thermosol Dye Range.
6.6 GENERAL RECOMMENDATIONS FOR THE BLEACH RANGE
The temperature in J-boxes is kept at 180°F by the introduction of steam. As a
result, hot water containing bleach chemicals and contaminants is collected at the bottom
the J-boxes. Currently, this flow is discharged to the treatment plant without recovery of
heat. The configuration of the bleach range made it impossible to collect samples from
the J-box, and the characteristics of the water leaving the J-box are not known. However,
this water contains large amounts of caustic and H202 and should be returned to the
saturator. Recycling the J-box drain to the saturator will result in a lower consumption
of bleach chemicals and hot water and, therefore, energy. The contaminants present in
this water would probably have no detrimental effects on the quality of the products. The
106

same is valid for the J-box after the quench box. This recycling system has been
successfully implemented in other textile mills as mentioned in the literature review
section of this study (Evans, 1991).
The washers in the bleach range operate at 180°F. It might be useful to
investigate if the same washing efficiency can be achieved at a lower temperature, for
example 170oF. This can be investigated by lowering the temperature of the water by 5
or lOoF and observing the effects on the quality of the products. The temperature should
be lowered until detrimental effects are observed. The temperature should then be
increased to the level where no effects were observed. It is possible that some fabrics
require 180°F and that others can be treated at a lower temperature. In addition, the
existing system for heat recovery needs to be repaired.
The concentration of the chemicals in the saturator is adjusted to the fabric. The
flowrate of the water in the quenchbox, saturator and washers stays constant. However,
it is well known that cotton needs more pretreatment than polyester and it therefore seems
logical that the flowrate of water and soap should be adjusted to the type of cloth on the
machine: the higher the cotton content of the cloth, the higher the flowrate.
6.7 RECOMMENDATIONS FOR THE FINISHING RANGE
The function of the wet-out stage is to wet the fabric so that creases can be
removed during subsequent drying. The wet out pan is overflowing at a high rate (15-25
gpm). According to the manager of the finishing range it is necessary to overflow this box
to prevent the buildup of solids in the pan. The wastewater analysis of Table 6.1 shows
that some contaminants are removed from the fabric, but that the water is still of
reasonable quality. Filtering the water leaving the wet out pan and recycling the water
to this pan would result in significant savings.
Vacuum extraction and steam cans after the wetout pan remove the excess water
before the cloth enters the finishing pan. A good vacuum extractor remove: all the
107

unbound water. The steam cans could remove more water, but management agrees that
these cans already remove too much. As a result, the cloth leaving the cans has a 30%
moisture regain from the atmosphere. It should be investigated if the utilization of steam
cans at this point in the process can be stopped.
Each steam can has a steam trap. This trap prevents steam from leaving the steam
can. Some of the steamtraps are malfunctioning; steam can be observed passing through
the steam trap. When this steam gets to the storage tank, it loses its energy to the
atmosphere. Each of the steam traps in the plant should be checked and replaced, if
necessary.
The finishing pans in the two finishing ranges have different dimensions. One
holds 20 gallons, whereas the other one holds 100 gallons. The chemical mixes of these
pans are, on average, dumped 15 times a day. This means that 1,200 gallons more of a
strong chemical mix are dumped from the larger pan. These mixes are often expensive.
The pans should therefore be as small as possible. Replacing the existing pan by a
smaller one would probably be a large investment, but placing a dummy in the existing
large pan would have the same effect with a lower investment. Implementing this
recommendation would not only save water, chemicals and energy, but will also reduce
the load to the wastewater treatment plant.
The cooling cans in the finishing range are two by two connected and discharge
into a small tank. A thermocouple measures the temperature of the water in the storage
tank. If the temperature of the water is below 120oF, it is reused in the cooling cans.
As the temperature reaches 120°F, fresh water is added to the tank until the temperature
drops below 1200F. At the same time, some water is discharged to the sewer. The
system can be improved by recovering the heat in the discharged water and reusing the
cooled water in the cooling cans.
108

6.8 GENERAL RECOMMENDATIONS FOR THE THERMOSOL DYE RANGE
The thermosol dye range is operated two shifts each day. Cleaning the machinery
and dumping all the baths and washers is required when using a light color after a dark
color. Efforts are made to use consecutively darker colors so that cleaning between each
run can be avoided. However, on certain days cleaning is required after each run because
light colors are used after darker colors. It would help if the production schedule
established. This would require adjustment of the production schedule in the bleach and
finishing range.
Sometimes two different fabrics are dyed to the same shade, but the composition
of the dyebaths is different because the fabrics contain different percentages of cotton and
polyester. In this case, the dyebaths are dumped but not the washers. There is a
possibility that the remaining dye solution can be reused by simply adjusting the amount
of chemicals in the solution.
There are several ways to reduce the water used in the cooling rolls. One way,
is to collect the water leaving the rolls in a small storage tank and send it back to the
rolls if the temperature is below a preset temperature. This is the same principle as is
currently used in the finishing range. The characteristics of the water leaving the
predryer, cooling rolls are given in Table 6.3 together with the water quality standard for
the process water reported by Beckmann and Pflug (1983). Visual observation of these
samples showed that they were essentially colorless (13 ADMI units). Chromium and
copper levels were also very low. Therefore, according to the criteria of Table 6.3, the
non-contact cooling water could be reused directly. Direct reuse is possible in the
washers and water seal located behind the steamer.
6.9 GENERAL RECOMMENDATION FOR THE PRINT RANGE
The print range has a high water demand for cleaning. No water is used to rinse
109

Table 6.3: Comparison of the Water Characteristics of the Predryer Non-contact Cooling Water with Water Qualitystandards for Process water.
Non-contact cooling Quality standards for process water (Beckmann andPflug, 1983)
Color 13 ADMI colorless
Copper (mg/l) 0.011 < 0.1
Chromium (mg/l) 0.0009 usually non-existent
Total ions (g/l) < 0.5
COD (mg/l) 11 < 20
pH 7 near neutral
Surfactants - none no value given
the fabric after application of the print paste. The print paste is thick and difficult to
remove from the machinery parts and drums used to make up the different colors.
Another source of water consumption is the print blanket. A glue is applied to the
blanket at the beginning of the print range. This is to ensure good contact between the
blanket and the fabric. This glue contains starch and PVA. Removal of the glue from
the blanket after the printing operations requires large quantities of water. Perkins (1987)
reported the removal of PVA from 50/50 polyester/cotton blend fabric through vacuum
extraction. The fabric was wetted by passing it though a desize saturator or by spraying
it with water before vacuum (13- 15 inches of mercury) was applied to the fabric. Fifty
three percent of the size was recovered. The company should investigate if the removal
of printer glue from the print blanket can be achieved by vacuum extraction. There are
other water-based adhesive that are available which might function as well and be
removed more easily.
The printer screens and other parts are removed from the printer when they are
cleaned. These parts are cleaned with a hose until they are almost spotless. The screens
are hollow inside and print paste is collected at the inside of the screen The inside of
110

these screens would be cleaned with a cylinder shaped broom through which water is
sprayed. The other parts of the equipment should also be cleaned with high pressure
cleaning equipment. The possibility of using a vacuum to clean the printer parts and
screens should also be investigated.
Another problem in the print range is the mixer and drums used for making the
different print pastes. After the different chemicals are added to the drum, it is placed
under the mixer and mixed for 1 to 2 min. The mixer then lifts from the drum and
swings to another drum for cleaning. No time is allowed for excess print paste to drip
off the mixer, back into the drum containing the paste. This paste is now collected in a
pit under the mixing area and is discharged to the treatment system. More time should
be allowed for the paste to drain from the mixer into the drum; and then, after the mixer
swings to the drum, efforts should be made to collect as much of the concentrated paste
from the mixer as possible before it is sprayed with water. The wasted, concentrated
paste can probably be processed with the other chemical sludges at the plant.
6.10 RECOMMENDATIONS AND CONCLUSIONS
Opportunities for water and energy conservation can be found in each of the wet
processing departments in this company. A summary of the recommended actions is
given below. Details about the implementations can be found in the appropriate section
of this chapter.
Non-contact cooling water in the bleach range has a temperature of 170- 180°F and
can be reused as process water in the quench box. This implementation would be
achieved with a minimal investment and would result in significant savings due to the
reduction of water and energy consumption. The estimated savings are $66,000 per year.
This estimate does not take any capital investment into consideration. Operating costs
would be minimal.
The Tensitrol washers in the bleach range have high water demands. Counter-
111

current flow between washer 3 and washer 2 would reduce water consumption in the
washers by 50 gpm with an annual savings of $154,000. However, the company is
considering replacing these washers by more efficient Menzel rope washers. It is
recommended that the washers be replaced since this would result in significant water and
energy savings. The simple payback period is 2.1 years if all the washers of one range
are replaced. After payback, the reduced water and energy consumption would result in
annual savings of $336,000. Other source reduction techniques that can help in the bleach
range are:
- Recycle the J-box effluent to the saturator.
- Optimize the temperature and flowrate of the tensitrol washers. Some fabrics
do not need a flow rate of 50 gpm at 180°F.
Recommendations for the finishing range:
- Adjust the flowrate of the wet-out pan to the requirements of the fabric.
Recycle this water if possible.
- The combination of a vacuum extractor and steam cans after the wet-out pans
seems redundant. A good vacuum extractor removes all the unbound water.
Removal of the unbound water is sufficient at this point in the operation.
- Some of the steam traps connected to the steam cans do not function properly.
Each steam trap should be checked and replaced/repaired if malfunctioning.
- The chemical pans of the two finishing ranges have different dimensions. The
largest pan, should be replaced since it results in excess dumps.
The washers in the thermosol dye range should be operated in the counter-current
mode. Acid and hydrogen peroxide are added to washers 3 and 4. Counter-current flow
between washers 4,3,2, and 1 will improve the removal of caustic and reducing agents
112
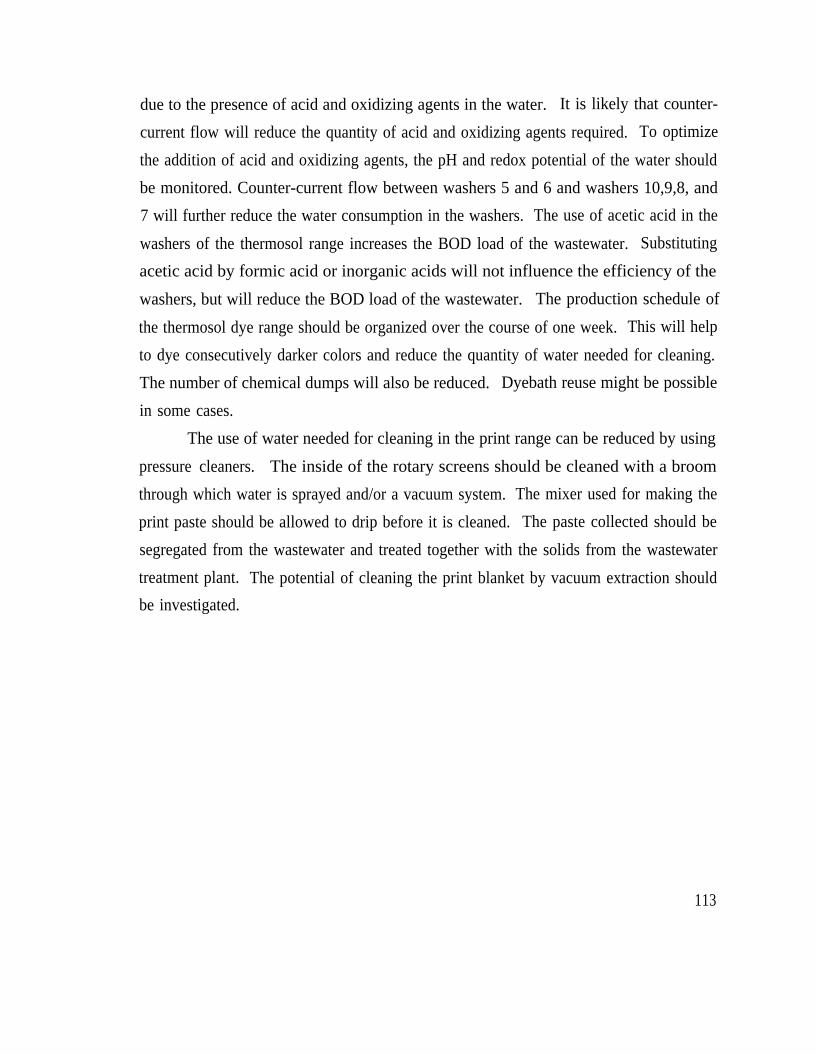
due to the presence of acid and oxidizing agents in the water. It is likely that counter-
current flow will reduce the quantity of acid and oxidizing agents required. To optimize
the addition of acid and oxidizing agents, the pH and redox potential of the water should
be monitored. Counter-current flow between washers 5 and 6 and washers 10,9,8, and
7 will further reduce the water consumption in the washers. The use of acetic acid in the
washers of the thermosol range increases the BOD load of the wastewater. Substituting
acetic acid by formic acid or inorganic acids will not influence the efficiency of the
washers, but will reduce the BOD load of the wastewater. The production schedule of
the thermosol dye range should be organized over the course of one week. This will help
to dye consecutively darker colors and reduce the quantity of water needed for cleaning.
The number of chemical dumps will also be reduced. Dyebath reuse might be possible
in some cases.
The use of water needed for cleaning in the print range can be reduced by using
pressure cleaners. The inside of the rotary screens should be cleaned with a broom
through which water is sprayed and/or a vacuum system. The mixer used for making the
print paste should be allowed to drip before it is cleaned. The paste collected should be
segregated from the wastewater and treated together with the solids from the wastewater
treatment plant. The potential of cleaning the print blanket by vacuum extraction should
be investigated.
113

CHAPTER 7. NYLON DYEING AND FINISHING PLANT
The company dyes nylon yams used for the production of industrial carpets. The
yam is dyed in a continuous operation using acid, premetallized and/or basic dyes.
Wastewater from the processes is treated in an on-site wastewater treatment plant.
7.1 PROCESS DESCRIPTION
The nylon yams arrives at the mill wound on tubes in shrink-wrapped containers
or cardboard boxes. The yarn tubes are placed on creels at the head end of each dyeline.
The cardboard tubes, boxes and shrink wrap are collected and sold to recyclers. In the
first step of the process, the yam passes through a steam port for the reduction of static.
During the following heat setting operation, yam is radiant heated to 360-400°F for
approximately 55 seconds. This removes finishing agents previously applied to the yarn
and straightens the yam strands. Printers then apply up to eight different colors to the
yarn. The printers are rollers covered with dye solution. The solutions are transferred
to the yarn by pressing the strands to the printers for a short period of time. Next, the
colored yam passes through a dye-setting unit in which the yarn is steamed for 3 to 7
minutes at a temperature of ‘190-210°F. A steam trap prevents steam from leaving the
steam box. After this, the yarn passes through a set of washers and padded rollers to
remove excess dye and dye-setting chemicals. A dryer at the end of each line holds the
yarn for one minute and removes excess rinse water. The dyed yarn is stored in J-boxes
at the end of the dyeline. From these J-boxes, the yarn goes to the opening department
where it is wound onto tubes. The color of the yarn is checked by graders before it is
shipped to a customer. An overview of the production process is given in Figure 7.1.
The rinse waters, dyes and other chemicals are collected together with the boiler
blowdown and the condensate from the dye-setting units at several points throughout the
production process. This water flows to an on-site wastewater treatment plant which
114

includes an aerated lagoon, and coagulation/flocculation, sedimentation, filtration and
disinfection.
Figure 7.1: Flow Diagram of the Nylon Dyeing and Finishing Mill.
The dye solutions are made in a central dye kitchen. Here, water with a
temperature of 180-190oF flows into a conical mixing tank. Powdered dyes, acid,
defoamers and wetting agents are added to the hot water and mixed. The dye solutions
are then pumped into 2400 1 tanks at the end of each dyeline. Each mixture is pumped
into 800 1 tanks next to the printers when needed. The liquid in these tanks is stirred
continuously. The company uses predominantly acid dyes, but basic and premetallized
dyes are also used. The premetallized dyes can only be used on two dye-lines because
they require a special heat-setting unit. The company has six dye-lines and one sample
115

line also for small orders.
7.2 WATER USE AND TREATMENT
The mill generates approximately 100,000 gallons of industrial wastewater per day
(gpd). The boiler house produces steam for the production of hot water and heating of
the facilities. The biggest assignment of the boilers, however, is the production of steam
for the dye-setting units. The wastewater generated from boiler blowdown accounts for
25% of the total amount generated. The steam trap and the rinsing procedures each
generate 20,000 gal of wastewater per day. The remaining wastewater is derived from
the dyeing operations (13,000 -15,000 gpd) and general cleaning.
As mentioned before, the on-site wastewater treatment facility consists of an
aerated lagoon followed by flocculation, sedimentation and filtration. The biomass in the
aerated lagoon is low and biological degradation is often not sign&ant. Presently, the
treatment plant operators add a small amount of a bacterial culture to the lagoon to
enhance biological treatment. The treatment plant operators feel that the addition of 100
lbs of the bacterial culture per week improves treatment of the wastewater, especially
during periods that the wastewater is hard to treat.
The water then passes into two flocculation tanks. Polymers are added at this
point. Sludge removed from the sedimentation basin is dewatered on a belt press. Prior
to disposal at a landfill, the sludge is dried on drying beds. Partial anaerobic digestion
occurs in the sedimentation basin and during sludge storage, causing a odor primarily due
to hydrogen sulfide. The treatment plant operates at a higher flowrate than the company
is allowed to discharge to the river. Some of the treated water is therefore stored in a
storage tank so that water can be discharged when the treatment plant is not operating.
In addition to the treatment plant effluent, there are several point sources of storm water
which are discharged into the river. They include storm water from a bulk oil earthen
dike, a concrete dike for above-ground storage of waste oil and a concrete truck loading
116

area. A flow diagram of the wastewater treatment plant is given in Figure 7.2.
Figure 7.2: Flow Diagram of the On-site Wastewater Treatment Facility.
7.3 RESULTS AND DISCUSSION
7.3.1 Water quality analysis of the dye-lines
Figure 7.3 shows the washboxes and padded rollers of a dyeline. Water enters the
steam trap (pointA) and the washbox (pointC) at a flow rate of >4gpm. After visual
observation of this section of the various dye-lines, it seemed that the water leaving point
D (second strainer) was relatively free of color. It was therefore recommended that this
water be recycled to the steam trap (pointA). It was estimated that this can reduce the
117

water used for rinsing by 50%.
Figure 7.3: Schematic Representation of the Rinsing Operations in a Dy-line.
Plant personnel replumbed dye-line 1 to determine if the proposed recycle system
was feasible. Fresh water entering at point C was recycled from point E to point A.
Samples were collected at different times during a run. The four sampling points were:
steamtrap (point A), first set of padded rollers (point B), washbox (point C) and second
set of padded rollers (point D). Two samples of each dyeline were analyzed for
cadmium, nickel and chromium. The results of the experiments are shown in Tables 7.1
and 7.2. Figures 7.4 and 7.6 show the color intensity of samples taken at the dye-lines.
The amount of COD present in each sample is provided in Figures 7.5 and 7.7.
118

119

The color measurements of dyeline 2 are represented in Figure 7.4. The data show
that the color content of the water much higher at point A and B than at C and D. The
figure also shows that the color was higher at point B than at point A. This was expected
since the first set of padded rollers is at B and excess water is removed. The DOC
content of the samples (Figure 7.5) follows the same trend as the color intensity. The
color and DOC content of samples taken at point C and D were much lower than in
samples from points A and B. The color and DOC content decreased with time at point
A and B. This was not detected at points C and D. The large difference in
contamination between water from point A and point C indicates that most of the color
was removed by the first rinse water. Water should therefore be recycled from point E
120

Figure 7.4: Color Intensity (ADMI) of Samples Taken in Dye-line 2.
to point A and wasted after strainer B (Figure 7.3).
The results of the water analysis from dyeline 1 are shown in Figures 7.6 and 7.7.
Water from point D mixes with water leaving point C. This water was recycled to point
A and then discharged. The color content of samples taken from point A and B increased
during the first two hours of the run. Afterward, the color content decreased at sampling
points A and B. The same-was observed in dyeline 2. It is not clear if this reduction
was due to the addition of fresh water or if it is typical of the process. It is also an
indication that recycling water did not have an impact on the rinse procedure and that
it can be implemented without the addition of fresh water to the steam trap.
If this recycle system is implemented on each dyeline, the water and cost savings
will be considerable. More then 80% of the dyes used at the company are acid dyes.
‘The results of the water analysis show that the proposed system can be used for acid
dyes. However, when dark colors are used, the introduction of fresh water at point A
121

Figure 7.5: DOC Content (mg Carbon/l) of Samples Taken on Dye-line 2.
might be necessary. The affinity of premetallized dyes for nylon is lower then the affinity
of acid dyes. As a result, more premetallized dyes leach from the yam and highly color
the rinse water. It is therefore not likely that recycling rinse water is possible when
premetallized dyes are used unless the water is pretreated.
As mentioned above, the water enters the steam trap and wash box of each dyeline
at a flow rate of > 4 GPM. This results in the generation of 38,000 GPD if each dyeline
operates for 16 hours a day. it was estimated that this recycle system would reduce the
water consumption of the rinsing procedure by 33%. These water savings were calculated
assuming that:
1. 90% of the dyes used allow for water to be recycled from the wash box
to the steamtrap.
2. 50% of the time that water is recycled, 2 GPM of fresh water is added to the
steam trap.
122

Figure 7.6: Color Intensity (ADMI) of Samples Taken on Dye-line 1.
3. Water is added to the wash box at a flow rate of 4 GPM.
4. Each dyeline operates for 20 hours a day.
7.3.2 Wastewater treatment
The purpose of these -experiments was to analyze the efficiency of the current
wastewater treatment system, locate problems and investigate possible improvements.
This was done by performing three sets of experiments. The first experiment consisted
ofanalyzing samples from different points within the treatment system. Samples were
taken from the combined wastewater leaving the textile plant, at the beginning and end
of the aerated lagoon and at the point where the wastewater enters the physico-chemical
part of the treatment system. The treated wastewater and the water leaving the storage
tank were also sampled (Figure 7.2). A second set of experiments consisted of laboratory
123

Figure 7.7: DOC Content (mg Carbon/l) of Samples Taken on Dye-line 1.
coagulation experiments in which the effect of different coagulants was evaluated. The
following coagulants were used in the experiments: FeCl3, Alum (Al2(SO4)3), two cationic
polymers (Al220 and Selfloc 1740) and one anionic polymer (A130). In addition, the
biological treatability of the dyewaste was investigated under aerobic and anaerobic
conditions.
Wastewater analys i s
The results of the evaluation of the lagoon are given in Table 7.3 and Figure 7.8.
A 24 hour composite sample was taken from the lagoon influent (pipeline). The samples
at the beginning and end of the lagoon were grab samples. The results show that a
significant amount of the COD in the lagoon was associated with the solids. A small
amount of bacterial culture was added to the lagoon the day before sampling. The
treatment plant operators at the company have learned that the lagoon can only reduce
124

the color and COD of the wastewater when the bacterial culture is added to the lagoon
on a regular basis. The total suspended solids concentration in the lagoon was 934 mg/l.
The TSS levels on two other days during the summer were 550 mg/l and 254 mg/l.
These concentrations of solids are too low to achieve significant biological treatment.
The reduction of COD and color in the lagoon were therefore probably due to a
combination of biodegradation, adsorption of color onto settleable solids and dilution
effects. The biomass is not able to sustain itself since the addition of the bacterial culture
is required on a regular basis. It is therefore recommended that the addition of this
culture is stopped and that changes are made to the lagoon so that it can sustain the
biological culture and thus operate as an activated sludge reactor. The results of the
treatment achieved in the physicochemical part of the treatment plant are shown in Table
7.4 and Figure 7.9. This system provided a color reduction of 20% and a COD reduction
of 25%. Other treatment options should be considered since these removal efficiencies
are low and because the company has difficulties meeting discharge limits. The
differences between the storage tank influent and effluent were negligible, indicating that
there was no biological degradation in the tank.
125

Table 73: Results of the Wastewater Analysis of the Lagoon.
pH
Temperature (oC)
TSS (mg/l)
COD (unfiltered, mg/l)
COD (filtered, mg/l)
color (ADMI)
DOC (mg carbon /l)
Cadmium (µg/l)
Chromium (µg/l)
Nickel (µg/l)
Pipeline Begin lagoon End lagoon
5.6 7 7.1
36 24 24
74 850 934
2,990 776 582
3,370 2,134 1,645
2,140 652 597
1,016 169 210
1.2 0.9 0.7
70 85 76
IS 18 13
Figure 7-8: Treatment Achieved in the Lagoon.
126

Table 7.4: Treatment Achieved by the Physico-chemical Part of the Treatment Facility.
COD (filtered, mg/l)
Pump station Finished water Discharge
375 275 258
DOC (mg carbon/l)color (ADMI)
121
473
101
306
TSS (mg/l) 110 56 53
127

Of all the coagulants used, Selfloc 1740 gave the best results at a dose of 10 mg/l.
This is the cationic polymer presently used by the company. In a second part of the
physicochemical treatment at the plant, an anionic polymer is added to improve the
sedimentation of the formed flocs. However, the laboratory experiments showed no
improvement when anionic polymer was added. When Al220 was used instead of Selfloc
1740, better removal efficiencies were achieved, but only at concentrations of 180 mg/l.
The addition of anionic polymer after the addition of Al220 did not improve the treatment
of the wastewater. The on-site physicochemical treatment system is, however, not
efficient enough to enable to company to comply consistently with its NPDES permit.
Biological treatment
In the short-term biological treatability experiment, the plant’s effluent was mixed
with municipal wastewater in different ratios. Details about the set-up of the experiment
are given in Chapter 3. The results of the aerobic treatability study are shown in
Figures 7.10 and 7.11. Figure 7.10 shows a soluble COD removal of about 90% for all
the biological systems after four days. No removal of COD was achieved in the
anaerobic systems. The large reduction in COD was accompanied by a reduction in color,
even after 2 days (Figure 7.12). This can be an indication that color adsorbs onto the
particles.
The results of this research show that biological treatment of the dye wastewater
is a promising solution for the plant’s problems. The lagoon can probably be used as an
activated sludge system, but steps need to be taken to sustain a bioculture. More research
is required to determine the kinetic constants of the biological system and to investigate
the variability of the wastewater.
128

figme 7.10: Removal of Soluble COD (mgIl) in the Aerobic Treatability Study.
7.4 RECOMMENDATIONS AND CONCLUSIONS
The experiments show that recycling rinse water from the washbox to the steam
trap is possible when acid dyes are used. The recycle system should be installed on each
dye-line so that it can be used when acid dyes are applied to the yarn. The addition of
fresh water to the steam trap is required in some cases. Further research is required to
investigate the use of the recycle system when dyeing with premetallized and cationic
dyes.
Efforts should be made to optimize the quantity of dye solution made for each run.
Recording the amount of dye left at the end of each run and the amount of yarn dyed in
that run will help to estimate more accurately the quantity dye needed for a specific run.
According to plant personnel, many of the acid dyes used can be recycled. In fact, the
plant is currently recycling 30-50 % of the acid dyes. Excess dyes should be stored until
129

Figure 7.11: Removal of Color in the Aerobic Treatability Study.
further use if a large quantity of dye is left due to an error in calculations.
Each printer consists of eight dye pans. Each of these pans can contain a different
dye solution. The amount of dye left in piping and pans at the end of a run is close to
1001. The volume of dyebaths in the printers is larger than required for the dyeing
operation. It might be possible to fill much of the excess space with dummy blocks.
The flowrate of water entering the steam trap and washbox is not adjusted well
to the type of dyes and yarn used. Combinations of certain dyes and yarn will require
more water for rinsing then others. Efforts should therefore be made to optimize the
flowrate of the rinse water.
Plant personnel know that in some cases prewetting the yarn before it enters the
printers reduces the amount of dye picked up by the yarn. This is not practiced at the
plant. Investigating and implementing this option will reduce the quantity of dye needed
for a run and therefore results in savings.
130

The management has some good recycling programs for cardboard tubes and boxes
and shrink wrap. The company should explore the use of plastic tubes and plastic pallets
which can be returned to a supplier. This would make direct reuse of resources possible.
It was observed during one visit that a hose was left running. Hoses like this
discharge water at a flowrate of 5-10 gpm. Such bad housekeeping practices result in the
unnecessary consumption of resources and increase the hydraulic load to the wastewater
treatment plant. Placing an automatic shut-off on each hose in the plant will easily solve
this problem.
The on-site wastewater treatment plant does not function very well at times and
changes should be made to optimize the system. The aerated lagoon is operated at a HRT
of 7 days but the biomass in the system is too low to achieve significant biodegradation.
Further research is required to determine biological kinetic coefficients of the lagoon.
The lab-scale coagulation experiments showed that the characteristics of the wastewater
vary significantly and influence the treatment achieved by coagulation. The influence of
the wastewater characteristics on the treatment of the water can be reduced by
equalization of the water. Care must be taken not to shock load a biological treatment
system. It is therefore recommended that the strongest wastes are collected in a buffer
tank or pretreated before being added to a biological treatment system at a constant flow.
131

CHAPTER 8. SUMMARY AND CONCLUSIONS
Pollution prevention (P2) methods are those measures that eliminate or reduce
pollution prior to off-site recycling or treatment. P2 can be achieved by source reduction,
reuse and on-site recycling. In source reduction., production processes are analyzed to
reveal possibilities for reducing the amount of air, water and land pollutants released. This
can be achieved by conservation\optimization of chemical use, substitution of chemicals,
process changes, equipment modification, raw material control and improved maintenance
and housekeeping. Reuse and recycling water and chemicals can also reduce the
amount of pollutants released.
The objective of this research was to investigate P2 opportunities for the textile
wet processing industry. This was achieved through an extensive literature review and
P2 audits performed at textile companies. Textile wet processing operations were briefly
discussed in the literature review. The main objective of the literature review was to
describe the various source reduction and recycling opportunities available for the textile
industry. Case studies were included to clarify the concepts and benefits associated with
P2. P2 measures can help the textile processor to reduce the amount and strength of the
waste produced and the costs related to waste treatment. Other benefits include reduction
of chemical, water and energy consumption, reduced liability for the waste produced and
increased compliance with regulations.
In the second part of the project, P2 audits were conducted at four textile mills.
The companies considered cover a wide range of plants in the textile wet processing
industry. Among the facilities were a stone and soft washing laundry, a large fiberglass
processing plant, a large cotton printing, dyeing and finishing mill, and a nylon yam
dyeing and finishing mill.
Each mill was visited several times. Information about the operations,
consumption of water, chemicals and energy were obtained by several means. Interviews
132

with employees operating machinery and the management personnel at the plant were
performed to identify problems and points in the manufacturing process were P2
techniques might be successful. Visual observation of the manufacturing processes
revealed problems overlooked by the personnel. The duration of the observations ranged
from a few hours to 24 hours. This depended on the type of operation. Batch processes
tend to consume more resources (dyes, auxiliary chemicals, water, etc.) and be more
variable than continuous processes, so were observed longer. Formation obtained from
plant records included design information, wastewater analysis data, permit applications
(air and water), disposal records and data about the consumption and costs of energy and
water. Other information collected were Material Safety and Data Sheets, treatment and
disposal records, and water and sewer charges. Wastewater samples from several
operations were analyzed for COD, BOD, color, TSS, pH and temperature. Lead, copper,
zinc and chromium concentrations in were also determined.
The collected information was used to make recommendations to the management
of each mill concerning possible implementations. The feasibility of the proposed
measures was discussed with the mill’s management. If enough information was
available, an economic analysis of the proposed P2 measures was performed. The
economical analysis showed that significant savings can be expected when the proposed
P2 measures are implemented. Chemical substitutions appeared to be advisable at some
plants. However, information about the characteristics of chemicals currently used and
possible alternatives will be required before final decisions can be made.
Coagulation/flocculation tests were performed to investigate the physicochemical
treatment of wastewaters from the stone and soft washing laundry and nylon yarn
processing plant. The biological treatability of effluent of the nylon yam processing mill
was investigated by performing a short-term batch biological study.
The following general conclusions were derived from this research.
Recommendations and conclusions specific to the various mills can be found at the end
of the respective chapters.
133

1. Significant reductions in water and energy consumption were possible at
all mills. Water reductions will be achieved by reusing non-contact cooling
water and counter-current flow in washers. Reusing hot water will
significantly reduce the energy consumption at one mill. Improvements in
housekeeping will also help to reduce water consumption; e.g.; by using
automatic shut-offs on hoses.
2. The volume of many chemical pans in the mills was larger than required for
the operation. Conservation of chemicals will be achieved by optimizing the
volume of these pans.
3. Recording the amount of dye solution/chemical mix remaining after each
run with a given amount and type of fabric will allow for more accurate
calculation of the quantity of mix needed.
4. Scheduling operations over a longer time period (e.g. one week instead of
one day) will help to minimize water and chemical use.
5. Dye reuse and the collection of residual, concentrated chemical mixes (dyes,
print paste, finish and size mixes) before they are mixed with other liquid
wastes will minimize the quantity of dye wasted and the strength of
discharged wastewater-s at three of the plants studied.
134

ACHWAL, W. B., 1990 a. “Environmental aspects of textile chemical processing (part
I).” Colourage, vol 37, no 9. September 1990, p 40-42.
ACHWAL, W. B., 1990 b. “Environmental aspects of textile chemical processing (Part-
II).” Colourage, vol 37, no 10, October 1990, p 35-36.
BECKMANN, W., AND PFLUG, .J, 1983. “Reuse of weakly loaded liquors from textile
processing operations”. Textil-Praxis International, vol 38, March 1983, p II-VI.
BERGENTHAL, .I F., EAPEN, .J, HENDRIKS, R V., TAWA, A. J. and TINCHER, W.
C, 1985. “Full-scale demonstration of textile dye wastewater reuse.” Fortieth
Purdue University Industrial Waste Conference, 1985, p 165-171.
BURCH, T. E, DYER, D. F., and MAPLES, G., 1982. A practical system for
conserving energy and water in waste streams.” Water Conservation technologies
in Textiles. State of the Art. WRRI Bulletin, May 1982, p 58-59.
COOK, F. L, 1983. Direct dyebath reuse: The future is now! Textile World vol 121,
no 9, September 1983, p 144, 147.
COOK, F. L, 1990 a. “AATCC invades Boston with environmental ammo.” Textile
World, vol 128, no 11, September 1990, p 67-68, 70.
COOK, F. I., 1990 b. “Fabric processes beholden to energy, environment.” Textile
World, November 1990, p 49,5l-52, 54.
135

COOK, F. L, and TINCHER , W. C, 1978. “Dyebath reuse in batch dyeing.” Textile
Chemist and Colorist, vol 10, no 1, January 1978, p 21-25.
COOPER, S. G., 1978. The textile industry. Environmental control and energy
conservation. Noyes Data Corporation, Park Ridge, New Jersey, 385 p.
CORREIA, V.M, STEPHENSON, T., and SIMON, J.J, 1994. ” Characteristics of
textile wastewater- a review.” Environmental Technology, vol 15, p 916-929.
DAVIS, J P., 1990. “Wastewater options.” Apparel Industry Magazine, vol 5 1, no 2,
February 1990, p 50, 52.
DAVIS, J. P., 1991. “Wastewater treatment - the new frontier.” Bobbin, vol 32, no 8,
April 1991, p 38,40-42.
DAVIS, M.L, and CORNWELL, D.A., 1985. Introduction to Environmental
Engineering. McGraw-Hill, Inc., PWS Publishers, New York, New York, 822 p.
DICKINSON, K, 1986. “Preparation” in: The Dyeing of Cellulosic Fibres. Preston, C.
Dyers Company Publications Trust. The Eastern Press Ltd., London and Reading,
408 p.
DURIG, G., 1981. ” Environmental protection in the textile industry. Suppliers of dyes
and chemicals have a sizable pool of information and experience to share with
their customers.” American Dyestuff Reporter, vol 70, no 2, february 1981,
p 26-28.
136

ECODYNE CORPORATION, 1980. Weather Data Handbook: for HVA C and Cooling
Equipment Design. Ecodyne Corporation, MCGraw-hill, New York, 1980,285 p.
ENVIRONMENTAL PROTECTION AGENCY, 1978. Environmental Pollution Control.
Textile Wet Processing Industry Environmental Research Information Center.
technology Transfer, 138p.
ENVIRONMENTAL PROTECTION AGENCY, 1992. Facility Pollution Prevention
Guide. EPA/6OO/R-92/088. Office of Solid Waste, USEPA, Washington, DC,
143 p.
EVANS, BRUCE A., 1982. “Potential water and energy savings in textile bleaching.”
Water Conservation Technology in Textiles. State of the A rt. WRRI bulletin,
May 1982, p 55-57.
FLETCHER, G. A. and JOHNSTON, N., 1993. “The aire and calder project: a regional
waste minimization club.” Effluent Treatment and Waste Minimization. United
Kingdom Institution of Chemical Engineers Symposium Series no. 132, March 3l-
April 1, 1993, p 67-79,.
FOX, M.R, and SUMNER, H.H., 1986. “Dyeing with Reactive Dyes.” in: the Dyeing
of Cellulosic Fibres. Preston, C. Dyers Company Publications Trust. The Eastern
Press Ltd., London and Reading, 408 p.
GOODMAN, G. A. and PORTER, .I J, 1980. “Water quality requirements of reuse in
textile dyeing Processes.” American Dyestuff Reporter, vol 69, no 10, October
1980, p 33-37, 39,46.
137

GREENBERG, AE, CLESCERI, LS., and EATON, AD., 1992. Standard methods for
the Examination of Wafer and Wastewater. 18th Edition American Public Health
Association, American Water works Association, Water Environment Federation,
Washington, DC.
GREER, J A., and TURNER, G. R, 1983. Indigo denims: The practical side.” Textile
Chemist and Colorist, vol 15, no 6, June 1983, p 11-17.
GRIZZLE, T. A., 1982. “ Ultrafiltration applications in the textile industry.” Water
Conservation Technology in Textiles. State of the A rt. WRRI bulletin, May 1982,
p 20-23.
HALL, D. M., 1982. “ The potential for saving water and energy through recycling of
process water in textile finishing plants.” Water Conservation Technology in
Textiles. State of the A rt. WRRI bulletin, May 1982, p 60-61.
HARIES, R C, 1993. “Waste auditing and minimization- practical procedures and case
studies.” Effluent Treatment and Waste Minimization. United Kingdom Institution
of Chemical Engineers,Symposium Series no. 132, March 31- April 1,1993, p 41-
54.
HARKER, RP., 1980. “Recycling sewage water for scouring and dyeing.” American
Dyestuff Manufaturer, vol. 69, no 1, January 1980, p 28-37, 46.
HOIME, I, 1977. “What happens in the industry runs dry?” Journals of the Society of
Dyers and Colorist, vol93, April 1977, p 142-144.
138
HUFFMAN, L .,L, 1986. “Russell’s condensate system saves $ l,000/day.” Textile
World vol 124, no 6, June 1986, p 76.
HUNT, G., 1985. Dyebath and bleach bath reconstitution for textile mills. Pollution
Prevention Program, North Carolina Department of Environment, Health and
Natural Resources. Raleigh, North Carolina, 6p.
lNDUSTRIAL ENERGY CENTER, 1994. Energy Use Study for the Bibb Company.
Cooperative Study by Virginia Power and the Industrial Energy Center,
Blacksburg, Virginia, 1994, 36 p.
INOUE, G. and NAGASAWA, S. 1977. “Water reuse in fiber dyeing industry.”
Desalination, vol23, no 12, december 1977, p133-140.
JONES, H. R, 1973. Pollution control in the textile industry. Noyes Data Corporation,
Park Ridge, New Jersey, 323 p.
JUBY, J 1985. “One-step bleaching.” Textile Chemist and Colorist, vol 17, no 5, May
1985, p 21-22.
KALOGERIDIS, C, 1990. “Don’t waste your waste: It’s like burning dollars.” Textile
World, vol 128, no 12, December 1990, p 68-69.
KESSELS, K H, and SULZER, R, 1989. “Denim leads the way in leisurewear.”
Textile month, vol 102, no 7, July 1989, p 21-24.
KOTHE, (1973). “Textile solvent technology.” AATCC symposium, jan 1973, p 127.
139

BRAMAR, L, 1993. “Pollution. Cemer les problemes pour mieux les r&oudre.”
Undustie Textile, no 1249, decembre 1993, p 41-42.
KRAVETZ, L, 1983. “Biodegradation of nonionic surfactants: alcohol ethoxylates vs
nonyl phenol ethoxylates.” Textile Chemist and colorist, vol 15, no 4, April 1983,
p 23-28.
KREMER, F., BROOMFIELD, B., AND FRADKIN, L, 1982. “Energy and materials
recovery options for the textile industry.” Thirty Seventh Purdue University
Industrial Waste Conference Proceedings, 1982, p 157.
KRON, P., 1988. ” Jeans.” Apparel Industry Magazine, vol49, no 1, January 1988,
p 28-32.
LIPTAK, B. G., (1987). Optimization of unit operations. Radnor Pennsylvania by Chilton
Book Company, 1987,410 p.
MARCHALL, H., 1986. “Dyeing of polyester/cotton blends.” in: the Dyeing of Cellulosic
Fibres. Preston, C. Dyers Company Publications Trust. The Eastern Press Ltd.,
London and Reading;,408 p.
McKENNA, 1992. “Pollution control.” Apparel Industy Magazine, vol 53, no 1,
January 1992, p 40,42,44.
MOORE, S.B., DIEHL, RA BARNHARDT, J.M. and AVERY, G.B., (1987). “Aquatic
toxicity of textile chemicals.” Textile Chemist and Colorist, vol 19, no 5, May
1987, p 29-32.
140

NEEDLES, H. L, 1986. Textile fibers, dyes, finishes, and processes. A Concise Guide.
Noyes Publications, Park Ridge, New Jersey, 408 p.
OLSON, L, 1988. “A new technology for stoneless stone-washing applications.”
American Dyestuff Reporter, vol 77, no 5, May 1988, p 19-22.
PARK, J. and SHORE, J, (1984). “Water for the dyehouse: supply, consumption,
recovery, and disposal.” Journal for the Society of Dyers and Colorist, vol 100,
no 12, December 1984, p 383-399.
PERKINS, W. S., 1987. “Reclamation of polyvinyl alcohol using vacuum extraction.”
Textile Chemist and Colorist, vol. 19, May 1987, no. 5, p17-20.
PERSONAL COMMUNICATION, 1995a. Research and Developement Department of
the fiberglass finishing plant.
PERSONAL COMMUNICATION, 1995b. Schoellkopf, Jochem, Menzel.
PICKFORD, T., 1981. “The use of follow-on in dyeing.” Textile Institute and Industry,
vol 19, 1981, p55
PORTER, aud SNIDER, (1976). “Longterm biodegradation of textile chemicals.” Journal
of the Water Pollution Control Federation, vol 48, no 9, September 1976, p 2198-
2210.
PROVOST, J. R, 1992. “Effluent improvement by source reduction of chemicals used
in textile Printing.” Journal of the Society of Dyers and Colorist, Volume 108,
May/June 1992, p 260-264.
141

SCOTT, K., 1990. n Achieving better denim processing.” Laundry and Cleaning News,
vol 12, no 10, June 1990, p27-30.
Smith, B., 1986. Identification and reduction of pollution sources in textile wet
processing. Pollution Prevention Program, North Carolina Department of
Environment, Health and Natural Resources. Raleigh, North Carolina, 129 p.
SMITH, B., 1987 a “Troubleshooting in textile wet processing - Au overview”.
American Dyestuff Reporter, vol 76, no 2, February 1987, p 28-30.
SMITH, B., 1987 b. “Chemical screening and inventory control”. American Dyestuff
Reporter vol 76, no 6, June 1987, p 24-25.
SMITH, B., 1988. A workbook for pollution prevention by source reduction in textile
wet processing. Pollution Prevention Program, North Carolina Department of
Environment, Health, and Natural Resources, Raleigh, North Carolina, 1988,
69 p.
SMITH, B., 1989 a. “Pollutant source reduction: Part I - An overview.” American
Dyestuff Reporter, vol 78, no 3, March 1989, p 28, 30, 33-34.
SMITH, B., 1989 b. Pollutant source Reduction: Part II - Chemical handling.” American
Dyestuff Reporter, vol 78, no 4, April 1989, p 26-28, 30-32.
SMITH, B., 1989 c. “Pollutant source reduction: Part III - Process alternatives.”
American Dyestuff Reporter, vol 78, no 5, May 1989, p 32,34-40.
142

SMITH, B., 1989 d.“Pollutant source reduction: Part IV - Audit procedures.” American
Dyestuff Reporter, vol 78, no 6, June 1989, p 3l-34,48.
SMlTH, B. Identification and reduction of toxic pollutants in textile mill effluents.
Pollution Prevention Program, North Carolina Department of Environment, Health,
and Natural Resources, Raleigh, North Carolina, 105 p.
SNOWDEN-SWAN, L, 1995. “Pollution prevention in the textile industry.” in: Industrial
Pollution Pevention Handbook. FREEMAN, H. M. ,McGraw-Hill, Inc, p 829-845.
STANDARD METHODS FOR THE EXAMINATION OF WATER AND
WASTEWATER, 1992. APHA, AWWA, WEF, 18th edition, Washington, D.C.
THAYER, A.M., 1992. “Pollution Reduction.” Chemical and Engineering News, vol 70,
no 46, November 1992, p22-24, 28-29, 32-36, 44-45,49, 51-52.
TlNCHER, W. C and AVERETTE, L, 1982. “Direct dye-bath reuse through
spectophotometric and ozonolysis techniques.” Water Conservation Technology
in Textiles. State of the Art. WRRI bulletin, May 1982, p 12-16.
TINCHER, W. C, COOK, F.L and BARCH, L, 1981. “Reusing dyebaths in jet dyeing.”
Textile Chemist and Colorist, vol 13, no 12, December 1981, p 14-17.
TWORECK, W. C, ROSS, W. R, and RENSBURG, N. J.J. & 1984. “ The use of
reclaimed water in the textile industry.” Textile Industries Dyegest S.A ., April
1984, p 2, 4, 8.
143

WARD, A., 1993. “Beating the blues.” Industrial Wastewater, vol 1, no 5, May 1993,
p15-16, 18.
YOUNG, IL S., 1990. “Techniques for treating prewashed denim laundry wastewaters.”
FOrty fourth Purdue University Industrial Waste Conference, 1990, p 307-3 11.
YOUNG, K S., 1992. “Treatment of prewash denim laundry wastewaters: Case
histories.” Forty sixth Purdue University Industrial Waste Conference, 1992., p
235-244.
144

APPENDIX A: WORKSHEETS
145


APPENDIX B: FIBERGLASS PROCESSING PLANT
155


Recommended