PET IMAGINING OF SPEECH AND NONSPEECH STIMULI
247
RESEARCH ON SPOKEN LANGUAGE PROCESSING Progress Report No. 24 (2000)
Indiana University
PET Imaging of Differential Cortical Activation by Monaural Speech and Nonspeech Stimuli1
Donald Wong,2,3David B. Pisoni,3 Jennifer Learn,4 Jack T. Gandour,5 Richard T. Miyamoto3 and Gary D. Hutchins6
Speech Research Laboratory Department of Psychology
Indiana University Bloomington, Indiana 47405
1 This study was supported by the Departments of Otolaryngology, Radiology, NIH Grants DC 00064 (RTM) and DC 000111 (DBP). We thank Rich Fain and PET-facility staff for assistance and radionuclide production and developers of Michigan PET software for its use. 2 Department of Anatomy and Cell Biology, Indiana University School of Medicine, Indianapolis, IN 46202. 3 Department of Otolaryngology-Head & Neck Surgery, Indiana University School of Medicine, Indianapolis, IN 46202. 4 Department of Psychiatry, Indiana University School of Medicine, Indianapolis, IN 46202. 5 Department of Audiology and Speech Sciences, Purdue University, West Lafayette, IN 47907. 6 Department of Radiology, Indiana University School of Medicine, Indianapolis, IN 46202.
WONG, PISONI, LEARN, GANDOUR, MIYAMOTO AND HUTCHINS
248
PET Imaging of Differential Cortical Activation by Monaural Speech and Nonspeech Stimuli
Abstract. PET imaging was used to investigate the brain activation patterns of listeners presented monaurally (right-ear) with speech and nonspeech stimuli. The major objectives were to identify regions involved with speech and nonspeech processing, and to develop a stimulus paradigm suitable for studies of cochlear-implant subjects. Scans were acquired under a silent condition and stimulus conditions that required listeners to press a response button to repeated words, sentences, time-reversed (TR) words, or TR sentences. Group-averaged data showed activated foci in the posterior superior temporal gyrus (STG) bilaterally and in or near the anterior insula/frontal operculum across all stimulus conditions compared to silence. The anterior STG was activated bilaterally for speech signals, but only on the right side for TR sentences. Only nonspeech conditions showed frontal-lobe activation in both the left inferior frontal gyrus [Brodmann’s area (BA) 47] and ventromedial prefrontal areas (BA 10/11). An STG focus near the superior temporal sulcus was observed for sentences compared to words. The present findings show that both speech and nonspeech engaged a distributed network in temporal cortex for early acoustic and prelexical phonological analysis. Yet backward speech, though lacking semantic content, is perceived as speechlike by engaging prefrontal regions implicated in lexico-semantic processing.
Introduction
Functional neuroimaging techniques have provided a noninvasive tool for elucidating the neural
circuits engaged in speech perception and spoken-language processing (Petersen et al., 1988, 1989). These studies of language processing have identified sites in the left inferior frontal cortex and posterior temporal cortex, regions classically implicated as speech/language centers from postmortem studies with aphasic patients (Geschwind, 1979). Furthermore, by comparing brain activation patterns under task conditions requiring different levels of signal processing and analysis, more extensive regions beyond the classical regions have also been identified for speech processing (Peterson & Fiez, 1993; Binder et al., 1997). Based on several recent imaging studies in speech processing, a widely distributed neural network has been hypothesized that links frontal and temporo-parietal language regions (for review, see Brown et al., 1999).
The motivation of the present investigation was twofold. First, we wanted to understand the cortical
mechanisms underlying speech perception and spoken language processing. Both speech and nonspeech signals were used in order to identify cortical sites associated with complex-signal processing from sensory to lexico-semantic stages. Previous imaging studies have used time-reversed (TR) speech as a control condition to compare with speech signals (Howard et al., 1992; Price et al., 1996; Hirano et al., 1997; Binder et al., 2000). TR speech preserves some of the acoustical properties of speech sounds, but these nonspeech signals are devoid of semantic content. Second, we hoped to develop methods with normal-hearing listeners that could be used in future PET-imaging studies of patients with cochlear implants (CIs). Monaural stimulation was employed with these normal-hearing subjects to simulate the clinical conditions in which CI subjects hear on the side fitted with the prosthetic device (Naito et al., 1995, 1997; Wong et al., 1999). Another important consideration was selection of sets of stimuli that have served as standard test batteries for assessing speech perception in hearing-impaired subjects. Lists of words and sentences were presented as test signals under different scanning conditions. Listeners were required to detect a consecutive repetition in a sequence of stimuli by pressing a response button. TR words and TR sentences served as the nonspeech control conditions. Monaural stimulation was used in all
PET IMAGINING OF SPEECH AND NONSPEECH STIMULI
249
acoustic conditions in order to compare the findings with recently emerging imaging data from speech/language studies using binaural presentation.
Materials and Methods
Subjects
Five right-handed subjects (3 males, 2 females) with normal-hearing sensitivity (pure-tone air-conduction threshold < 20 dB H.L. at 0.5, 1.0, 2.0, 4.0 kHz) and with a mean age of 28.3 + 10.1 years (mean + SD) participated in this study. Payment was given for their participation. All subjects provided written consent to the experimental protocols for this study, which was approved by The Institutional Review Board of IUPUI and Clarian and was in accordance with the guidelines of the Declaration of Helsinki.
Stimuli and Tasks
An audiotape cassette reproduced the test signals at approximately 75 dB SPL for a total of 3-½ min
during scanning under the acoustic conditions. The acoustic signals were originally recorded onto a tape and played back as free-field stimuli delivered by a high-quality loudspeaker approximately 18 inches from the right ear. The left ear was occluded using an E-A-R foam insert to attenuate sound transmission in this ear by at least 25-30 dB SPL. This monaural stimulation mimics the clinical condition found with monaural listening by CI subjects hearing with a prosthesis implanted into only one ear.
Table 1. Stimulus Paradigm
Condition Auditory Stimulus
(Right Ear) Examples Motor Response
(Right Thumb) 1. Baseline
Silence
No response required
2. Speech
Words
boost, fume, thread, calf, day, bind
Press button after repeated stimuli
3. Speech
Sentence
What joy there is in living. See the cat glaring at the scared mouse.
Press button after repeated stimuli
4. Non-Speech
TR Word
Press button after repeated stimuli
5. Non-Speech
TR Sentence
Press button after repeated stimuli
Prior to the scanning session, subjects were told that they would hear either speech or nonspeech signals in each of the acoustic conditions. However, they were not informed about the specific type of acoustic signal to be presented prior to each scan. Scanning conditions were either active or passive. In
WONG, PISONI, LEARN, GANDOUR, MIYAMOTO AND HUTCHINS
250
the passive, silent baseline condition, the subject was instructed to relax. There was no stimulus presentation or response required during this scanning condition. In the active task conditions, subjects grasped a response device with their right hand, and were instructed to press a button with their right thumb immediately after an acoustic stimulus (e.g., word or sentence) was consecutively repeated. This detection task was designed to direct the subjects’ attention to the sound pattern and to monitor the stimulus sequence for repetitions. Thus, the speech and nonspeech tasks were conceptualized as simple auditory discrimination tasks (see paradigm in Table 1). Each button-press response activated a red light, which the experimenter observed and used to score the number of correct responses during each active task condition. Subjects were debriefed after the imaging session to discuss relative task difficulty and their subjective impressions of the perceived stimuli.
Speech stimuli consisted of lists of isolated English words and meaningful sentences used for
speech-intelligibility testing (Egan, 1948). The Word condition used a list of 54 phonetically-balanced, monosyllables (e.g., “boost”, ”fume”, “each”, ”key”, ”year”, “rope”). The Sentence condition used a list of 44 Harvard sentences (e.g., “What joy there is in living.”; “Those words were the cue for the actor to leave.”; “The wide road shimmered in the hot sun.”) selected from the lists developed by Egan (1948). Six to ten words comprised each sentence. TR versions of the same words and sentences were used for the two nonspeech conditions. These stimuli consisted of the 54 words played backwards in the TR Word condition, and 44 sentences played backwards in the TR Sentence condition. The percentage of consecutively repeated stimuli averaged 21% across all acoustic conditions. TR speech was considered to be devoid of semantic content, and was therefore considered an appropriate nonspeech control. The lists were presented at a rate of 1 stimulus per 3 sec in the Word and TR Word conditions and at 1 stimulus per 4 sec in the Sentence and TR Sentence conditions. The duration of each list was approximately 3 ½ min long. PET Image Acquisition and Processing
PET scans were obtained using a Siemens 951/31R imaging system, which produced 31 brain image
slices at an intrinsic spatial resolution of approximately 6.5 mm full-width-at-half-maximum (FWHM) in plane and 5.5 mm FWHM in the axial direction. During the entire imaging session, the subject lay supine with his/her eyes blindfolded. Head movement was restricted by placing the subject's head on a custom-fit, firm pillow, and by strapping his/her forehead to the imaging table, allowing pixel-by-pixel within-subject comparisons of cerebral blood flow (CBF) across task conditions. A peripheral venipuncture and an intravenous infusion line were placed in the subject's left arm. For each condition, about 50 mCi of H2
15O was injected intravenously as a bolus; upon bolus injection, the scanner was switched on for 5 min to acquire a tomographic image. During the active acoustic conditions, sounds were played over a 3 ½ min period followed by 1 ½ min of silence. A rapid sequence of scans was performed to enable the selection of a 90-s time window beginning 35-40 s after the bolus arrived in the brain. For each condition in the experimental design, instructions were given immediately prior to scanning. Repeated scans were acquired from subjects in the following stimulus conditions: (1) Silent Baseline, (2) Word, (3) Sentence, (4) TR Word, (5) TR Sentence.
Seven paired-image subtractions were then performed on group-averaged data to reveal statistically
significant results in the difference images: (1) Word – Silence, (2) Sentence – Silence, (3) TR Word – Silence, (4) TR Sentence – Silence, (5) Sentence – Word, (6) Sentence – TR Sentence, and (7) Word – TR Word. The Sentence – Word subtraction was designed to dissociate processing of suprasegmental or prosodic cues at the sentence-level from those at the level of isolated words. In the Sentence – TR Sentence condition, nonspeech is subtracted from speech. Regions of significant brain activation were identified by performing an analysis process (Michigan software package, Minoshima et al., 1993) that included image registration, global normalization of the image volume data, identification of the
PET IMAGINING OF SPEECH AND NONSPEECH STIMULI
251
intercommissural (anterior commissure – posterior commissure) line on an intrasubject-averaged PET image set for stereotactic transformation and alignment, averaging of subtraction images across subjects, and statistical testing of brain regions demonstrating significant regional CBF changes. Changes in regional CBF were then mapped onto a standardized coordinate system of Talairach and Tournoux (1988). Foci of significant CBF changes were tested by the Hammersmith method (Friston et al., 1990, 1991) and values of p < 0.05 (one-tailed, corrected) were identified as statistically significant. The statistical map of blood flow changes was then overlaid onto a high-resolution T1-weighted, structural MRI of a single subject for display purposes to facilitate identification of activated and deactivated regions with respect to major gyral and sulcal landmarks under each of the subtractions.
The multiple foci of significant peak activation in the superior temporal gyrus were distinguished by
arbitrarily grouping these foci into anterior (y > -5 mm) middle (y from –5 to –23 mm), and posterior (y from –24 to –35 mm) (Wong et al., 1999). The extent of activation was determined only in the superior temporal gyrus (STG) of each hemisphere by drawing regions of interest (ROIs) around the activation foci at the Hammersmith threshold. A single ROI was drawn on each side to include the extent of activation from all peak foci of STG activation.
Results
Behavioral Performance
The subjects scored 100% on the detection tasks for the Word and Sentence conditions. On the
nonspeech tasks, a total of one error was scored in the TR Word condition, and two errors in the TR Sentence condition for all subjects. Foci of Significant Blood Flow Increases
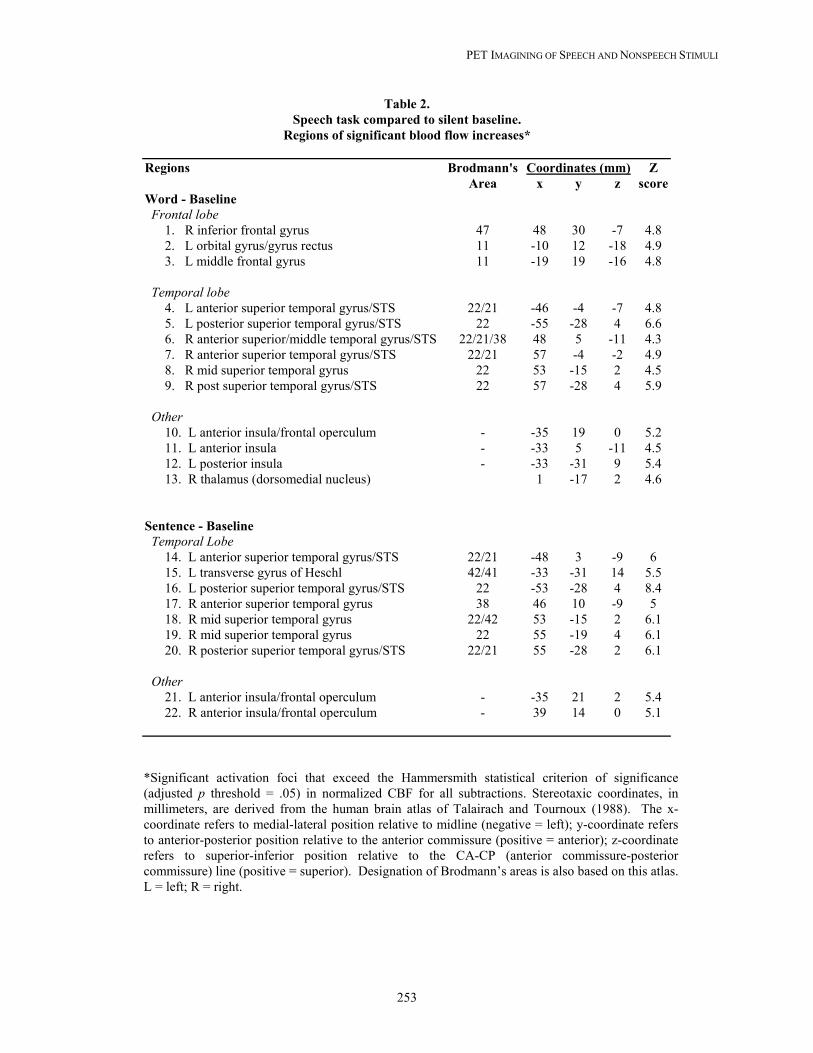
Compared to the silent baseline condition, in both the Sentence and Word conditions, extensive CBF
increases were observed bilaterally in the STG (Table 2; Fig. 1, upper two panels). The STG activation pattern was generally more robust and larger on the left side for all baseline subtractions in this study using right-ear stimulation. The activated region was elongated in an anterior-to-posterior direction with multiple peak foci distinguishable in the anterior, middle, and posterior parts of the STG (Table 2: foci # 4-9, 14-20; Fig. 1). The activations in the posterior half of the STG were often in the superior temporal plane within the Sylvian fissure, presumably encompassing the primary and secondary association auditory cortex [Brodmann’s area (BA) 41/42]. This activation pattern also extended ventrally onto the lateral (exposed) STG surface as far as the superior temporal sulcus (STS) and middle temporal gyrus (MTG), especially on the left side. This robust activation presumably included a part of BA 22 on the lateral surface and a part of BA 21 in the banks of the STS or on the MTG. The anterior STG activation was typically observed on the lateral surface, near the STS, and toward BA 38, a region containing the temporal pole. CBF increases were consistently found at the junction between the anterior insula and the frontal operculum on the left side (Table 2: foci #10-11, 21-22; Fig. 1) (bilateral for Sentence). No CBF increases were found in the inferior frontal gyrus (IFG) of the left frontal cortex. Compared to the silent baseline condition, in both the TR Sentence and TR Word conditions, CBF increases were observed in the temporal lobe bilaterally (Table 3; Fig. 1). Compared to baseline, the TR Sentence showed a robust bilateral STG activation (Table 3: foci #13-16), a pattern similar to that observed for the Sentence minus baseline condition. The strong left posterior STG activation also extended ventrally as far as the STS/MTG (Table 3: focus #13; Fig. 1), a spread of activity similar to that found for the speech conditions compared to baseline. Noteworthy is the pattern of STG activation on the right side, which contains multiple anterior and posterior foci (Table 3: foci #14-16); the foci extended
WONG, PISONI, LEARN, GANDOUR, MIYAMOTO AND HUTCHINS
252
along the lateral STG surface, but did not spread to the STS. Compared to baseline, the TR Word condition showed a noticeably weaker STG activation (Table 3: foci #4-6) than that observed for the TR Sentence condition (Fig. 1, lower two panels). The temporal-lobe activation was mainly on the left side in the posterior STG and MTG. Only a single focus was observed in the posterior STG on the right side. The activated focus observed for TR Sentence minus baseline condition was an elongated swath of activity on the left lateral STG surface along the anterior-to-posterior direction similar to that found in the Sentence minus baseline condition. In contrast, the left STG focus for TR Word-baseline was more focally confined to the posterior STG, extending ventrally rather than anteriorly (Fig. 1). Examination of the activation patterns of all four baseline comparisons revealed that both the Sentence and TR Sentence conditions evoked larger activations than the Word and TR Word conditions. These larger STG activations occurred extensively along the anterior-to-posterior direction, whereas the smaller activations were confined only to the posterior STG.
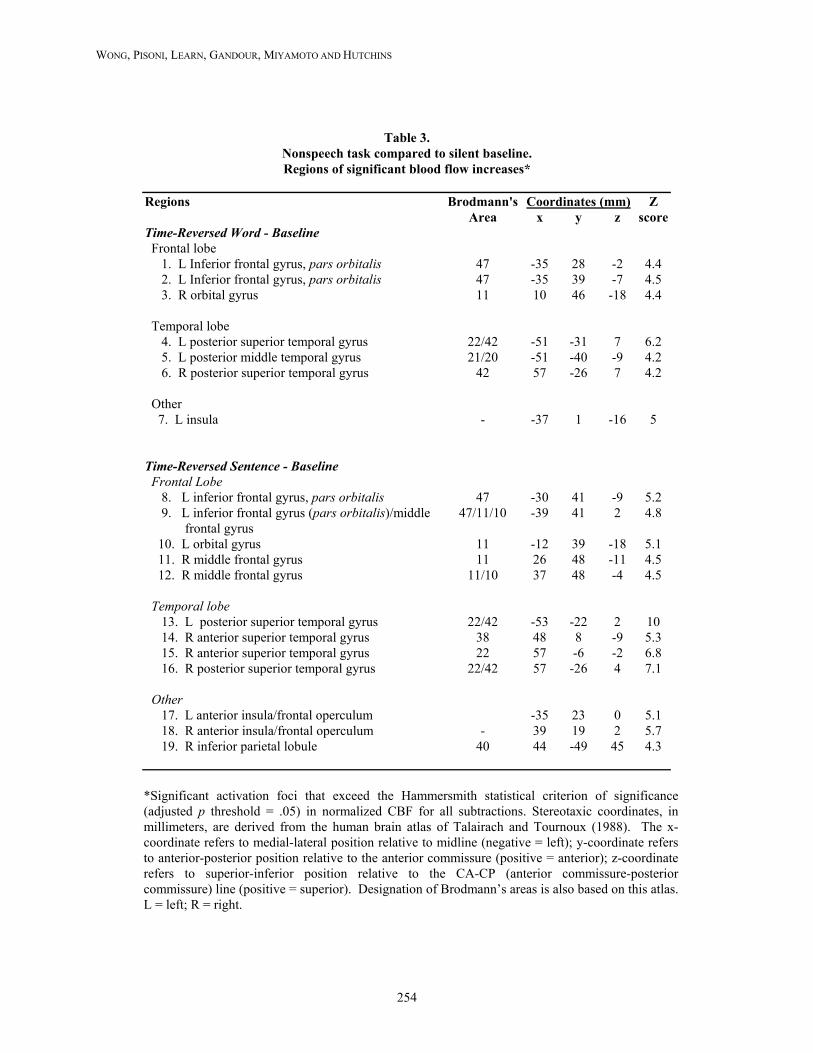
Compared to the baseline condition, the two nonspeech conditions showed CBF increases in foci of
the frontal lobes that were not observed in the speech conditions (Table 3). For example, activation foci were found in the left inferior frontal gyrus (pars orbitalis, BA 47) (Table 3: foci #1-2, 8-9; Fig. 2), a region often referred to as ventral or inferior prefrontal cortex in imaging studies on language processing (see Fiez, 1997). A second pattern of frontal-lobe activation was also found bilaterally in a part of the frontopolar region; this activation was largely confined to the ventromedial frontal cortex in BA 10/11 (Fig. 2).
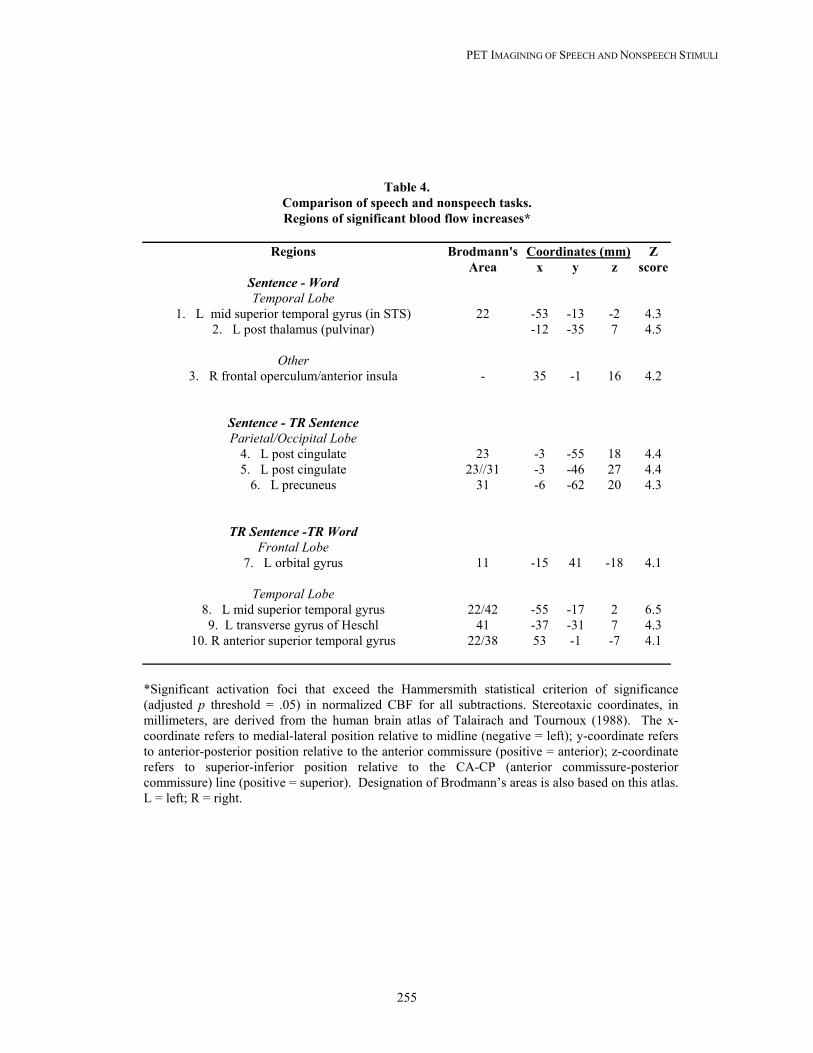
CBF increases were also isolated when the speech and nonspeech conditions were compared (Table
4). In the Sentence minus Word condition, a focus of CBF increase was found in the middle part of the left STG (BA 22) near the STS (Table 4: focus #1; Fig. 3). The TR Sentence minus TR Word condition was the only other comparison between two active tasks to show CBF increases in the STG (Table 4: foci #8-10). No CBF increases were found in any speech region of the left frontal lobe for comparisons between speech conditions (Sentence – Word) or between speech and nonspeech conditions (Sentence- TR Sentence). No significant CBF increase was found for Word – TR Word.
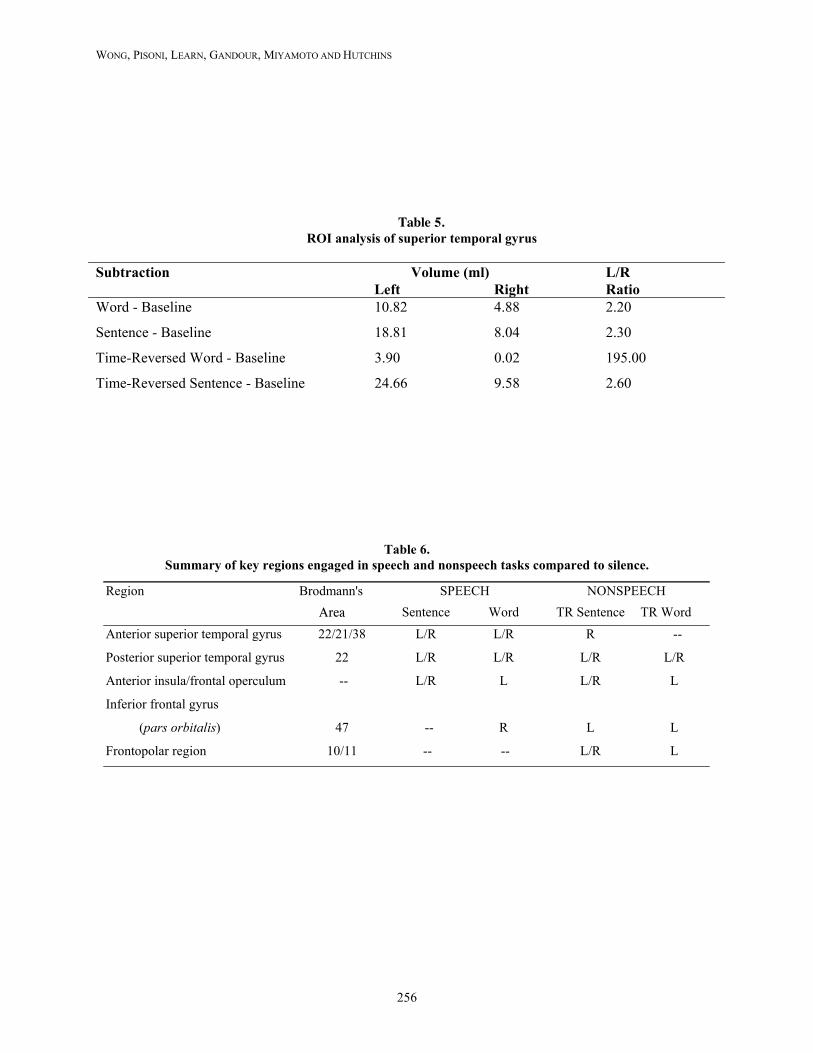
Table 6 summarizes the major similarities and differences in the patterns of CBF increases for
speech and nonspeech conditions relative to silent baseline. In brief, activation patterns in posterior STG bilaterally and anterior insula/frontal operculum were found consistently across all speech and nonspeech conditions. Bilateral activation in anterior STG was observed for the speech conditions only. Activation in both the ventromedial prefrontal cortex and left inferior frontal gyrus was found only in the nonspeech conditions. When different levels of complex-sound processing were compared, a focus in the left STG/MTG in the STS was observed for the sentence condition compared to the word condition. Foci of Significant Blood Flow Decreases
Compared to the baseline condition, all speech and nonspeech conditions showed CBF decreases
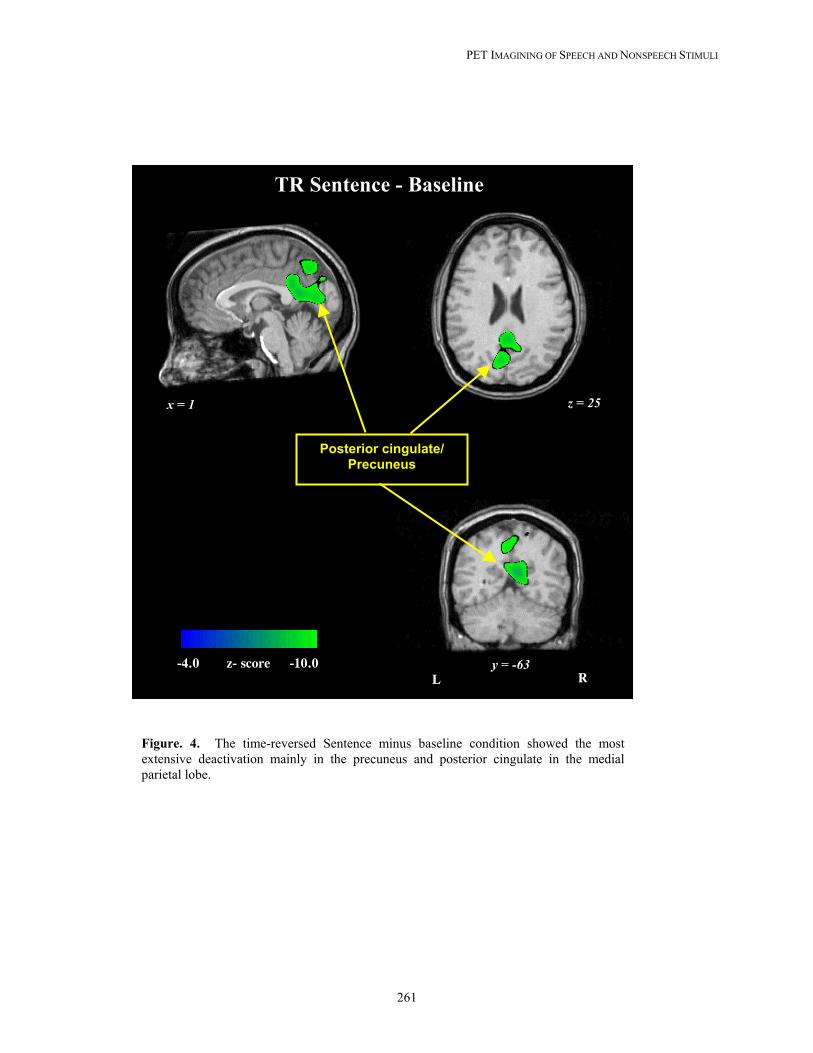
typically in the medial parietal and occipital lobe in such regions as the precuneus (BA 7) and posterior cingulate (BA 31, 30, 23) (Table 7: foci #1, 6-8, 10-12). The majority of these foci were found for the TR Sentence minus baseline condition (Fig. 4).
PET IMAGINING OF SPEECH AND NONSPEECH STIMULI
253
Table 2. Speech task compared to silent baseline.
Regions of significant blood flow increases* Regions Brodmann's Coordinates (mm) Z
Area x y z score Word - Baseline Frontal lobe 1. R inferior frontal gyrus 47 48 30 -7 4.8 2. L orbital gyrus/gyrus rectus 11 -10 12 -18 4.9 3. L middle frontal gyrus 11 -19 19 -16 4.8 Temporal lobe 4. L anterior superior temporal gyrus/STS 22/21 -46 -4 -7 4.8 5. L posterior superior temporal gyrus/STS 22 -55 -28 4 6.6 6. R anterior superior/middle temporal gyrus/STS 22/21/38 48 5 -11 4.3 7. R anterior superior temporal gyrus/STS 22/21 57 -4 -2 4.9 8. R mid superior temporal gyrus 22 53 -15 2 4.5 9. R post superior temporal gyrus/STS 22 57 -28 4 5.9 Other 10. L anterior insula/frontal operculum - -35 19 0 5.2 11. L anterior insula - -33 5 -11 4.5 12. L posterior insula - -33 -31 9 5.4 13. R thalamus (dorsomedial nucleus) 1 -17 2 4.6 Sentence - Baseline Temporal Lobe 14. L anterior superior temporal gyrus/STS 22/21 -48 3 -9 6 15. L transverse gyrus of Heschl 42/41 -33 -31 14 5.5 16. L posterior superior temporal gyrus/STS 22 -53 -28 4 8.4 17. R anterior superior temporal gyrus 38 46 10 -9 5 18. R mid superior temporal gyrus 22/42 53 -15 2 6.1 19. R mid superior temporal gyrus 22 55 -19 4 6.1 20. R posterior superior temporal gyrus/STS 22/21 55 -28 2 6.1 Other 21. L anterior insula/frontal operculum - -35 21 2 5.4 22. R anterior insula/frontal operculum - 39 14 0 5.1
*Significant activation foci that exceed the Hammersmith statistical criterion of significance (adjusted p threshold = .05) in normalized CBF for all subtractions. Stereotaxic coordinates, in millimeters, are derived from the human brain atlas of Talairach and Tournoux (1988). The x-coordinate refers to medial-lateral position relative to midline (negative = left); y-coordinate refers to anterior-posterior position relative to the anterior commissure (positive = anterior); z-coordinate refers to superior-inferior position relative to the CA-CP (anterior commissure-posterior commissure) line (positive = superior). Designation of Brodmann’s areas is also based on this atlas. L = left; R = right.
WONG, PISONI, LEARN, GANDOUR, MIYAMOTO AND HUTCHINS
254
Table 3. Nonspeech task compared to silent baseline. Regions of significant blood flow increases*
Regions Brodmann's Coordinates (mm) Z
Area x y z score Time-Reversed Word - Baseline Frontal lobe 1. L Inferior frontal gyrus, pars orbitalis 47 -35 28 -2 4.4 2. L Inferior frontal gyrus, pars orbitalis 47 -35 39 -7 4.5 3. R orbital gyrus 11 10 46 -18 4.4 Temporal lobe 4. L posterior superior temporal gyrus 22/42 -51 -31 7 6.2 5. L posterior middle temporal gyrus 21/20 -51 -40 -9 4.2 6. R posterior superior temporal gyrus 42 57 -26 7 4.2 Other 7. L insula - -37 1 -16 5
Time-Reversed Sentence - Baseline Frontal Lobe 8. L inferior frontal gyrus, pars orbitalis 47 -30 41 -9 5.2 9. L inferior frontal gyrus (pars orbitalis)/middle frontal gyrus
47/11/10 -39 41 2 4.8
10. L orbital gyrus 11 -12 39 -18 5.1 11. R middle frontal gyrus 11 26 48 -11 4.5 12. R middle frontal gyrus 11/10 37 48 -4 4.5 Temporal lobe 13. L posterior superior temporal gyrus 22/42 -53 -22 2 10 14. R anterior superior temporal gyrus 38 48 8 -9 5.3 15. R anterior superior temporal gyrus 22 57 -6 -2 6.8 16. R posterior superior temporal gyrus 22/42 57 -26 4 7.1 Other 17. L anterior insula/frontal operculum -35 23 0 5.1 18. R anterior insula/frontal operculum - 39 19 2 5.7 19. R inferior parietal lobule 40 44 -49 45 4.3
*Significant activation foci that exceed the Hammersmith statistical criterion of significance (adjusted p threshold = .05) in normalized CBF for all subtractions. Stereotaxic coordinates, in millimeters, are derived from the human brain atlas of Talairach and Tournoux (1988). The x-coordinate refers to medial-lateral position relative to midline (negative = left); y-coordinate refers to anterior-posterior position relative to the anterior commissure (positive = anterior); z-coordinate refers to superior-inferior position relative to the CA-CP (anterior commissure-posterior commissure) line (positive = superior). Designation of Brodmann’s areas is also based on this atlas. L = left; R = right.
PET IMAGINING OF SPEECH AND NONSPEECH STIMULI
255
Table 4.
Comparison of speech and nonspeech tasks. Regions of significant blood flow increases*
Regions Brodmann's Coordinates (mm) Z
Area x y z score Sentence - Word Temporal Lobe
1. L mid superior temporal gyrus (in STS) 22 -53 -13 -2 4.3 2. L post thalamus (pulvinar) -12 -35 7 4.5
Other
3. R frontal operculum/anterior insula - 35 -1 16 4.2
Sentence - TR Sentence Parietal/Occipital Lobe
4. L post cingulate 23 -3 -55 18 4.4 5. L post cingulate 23//31 -3 -46 27 4.4
6. L precuneus 31 -6 -62 20 4.3
TR Sentence -TR Word Frontal Lobe
7. L orbital gyrus 11 -15 41 -18 4.1
Temporal Lobe 8. L mid superior temporal gyrus 22/42 -55 -17 2 6.5 9. L transverse gyrus of Heschl 41 -37 -31 7 4.3
10. R anterior superior temporal gyrus 22/38 53 -1 -7 4.1
*Significant activation foci that exceed the Hammersmith statistical criterion of significance (adjusted p threshold = .05) in normalized CBF for all subtractions. Stereotaxic coordinates, in millimeters, are derived from the human brain atlas of Talairach and Tournoux (1988). The x-coordinate refers to medial-lateral position relative to midline (negative = left); y-coordinate refers to anterior-posterior position relative to the anterior commissure (positive = anterior); z-coordinate refers to superior-inferior position relative to the CA-CP (anterior commissure-posterior commissure) line (positive = superior). Designation of Brodmann’s areas is also based on this atlas. L = left; R = right.
WONG, PISONI, LEARN, GANDOUR, MIYAMOTO AND HUTCHINS
256
Table 5. ROI analysis of superior temporal gyrus
Subtraction Volume (ml) L/R Left Right Ratio Word - Baseline 10.82 4.88 2.20
Sentence - Baseline 18.81 8.04 2.30
Time-Reversed Word - Baseline 3.90 0.02 195.00
Time-Reversed Sentence - Baseline 24.66 9.58 2.60
Table 6. Summary of key regions engaged in speech and nonspeech tasks compared to silence.
Region Brodmann's SPEECH NONSPEECH Area Sentence Word TR Sentence TR Word
Anterior superior temporal gyrus 22/21/38 L/R L/R R --
Posterior superior temporal gyrus 22 L/R L/R L/R L/R
Anterior insula/frontal operculum -- L/R L L/R L
Inferior frontal gyrus
(pars orbitalis) 47 -- R L L
Frontopolar region 10/11 -- -- L/R L
PET IMAGINING OF SPEECH AND NONSPEECH STIMULI
257
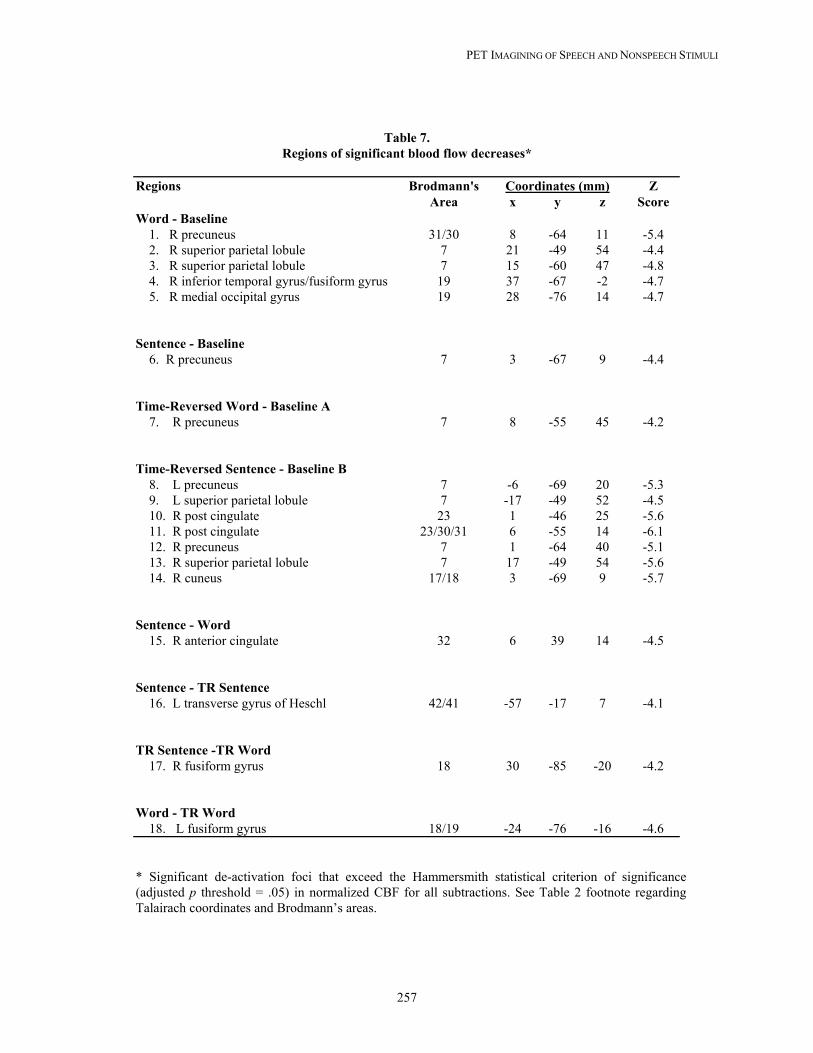
Table 7. Regions of significant blood flow decreases*
Regions Brodmann's Coordinates (mm) Z
Area x y z Score Word - Baseline 1. R precuneus 31/30 8 -64 11 -5.4 2. R superior parietal lobule 7 21 -49 54 -4.4 3. R superior parietal lobule 7 15 -60 47 -4.8 4. R inferior temporal gyrus/fusiform gyrus 19 37 -67 -2 -4.7 5. R medial occipital gyrus 19 28 -76 14 -4.7
Sentence - Baseline 6. R precuneus 7 3 -67 9 -4.4
Time-Reversed Word - Baseline A 7. R precuneus 7 8 -55 45 -4.2 Time-Reversed Sentence - Baseline B 8. L precuneus 7 -6 -69 20 -5.3 9. L superior parietal lobule 7 -17 -49 52 -4.5 10. R post cingulate 23 1 -46 25 -5.6 11. R post cingulate 23/30/31 6 -55 14 -6.1 12. R precuneus 7 1 -64 40 -5.1 13. R superior parietal lobule 7 17 -49 54 -5.6 14. R cuneus 17/18 3 -69 9 -5.7
Sentence - Word 15. R anterior cingulate 32 6 39 14 -4.5
Sentence - TR Sentence 16. L transverse gyrus of Heschl 42/41 -57 -17 7 -4.1
TR Sentence -TR Word 17. R fusiform gyrus 18 30 -85 -20 -4.2
Word - TR Word 18. L fusiform gyrus 18/19 -24 -76 -16 -4.6
* Significant de-activation foci that exceed the Hammersmith statistical criterion of significance (adjusted p threshold = .05) in normalized CBF for all subtractions. See Table 2 footnote regarding Talairach coordinates and Brodmann’s areas.
WONG, PISONI, LEARN, GANDOUR, MIYAMOTO AND HUTCHINS
258
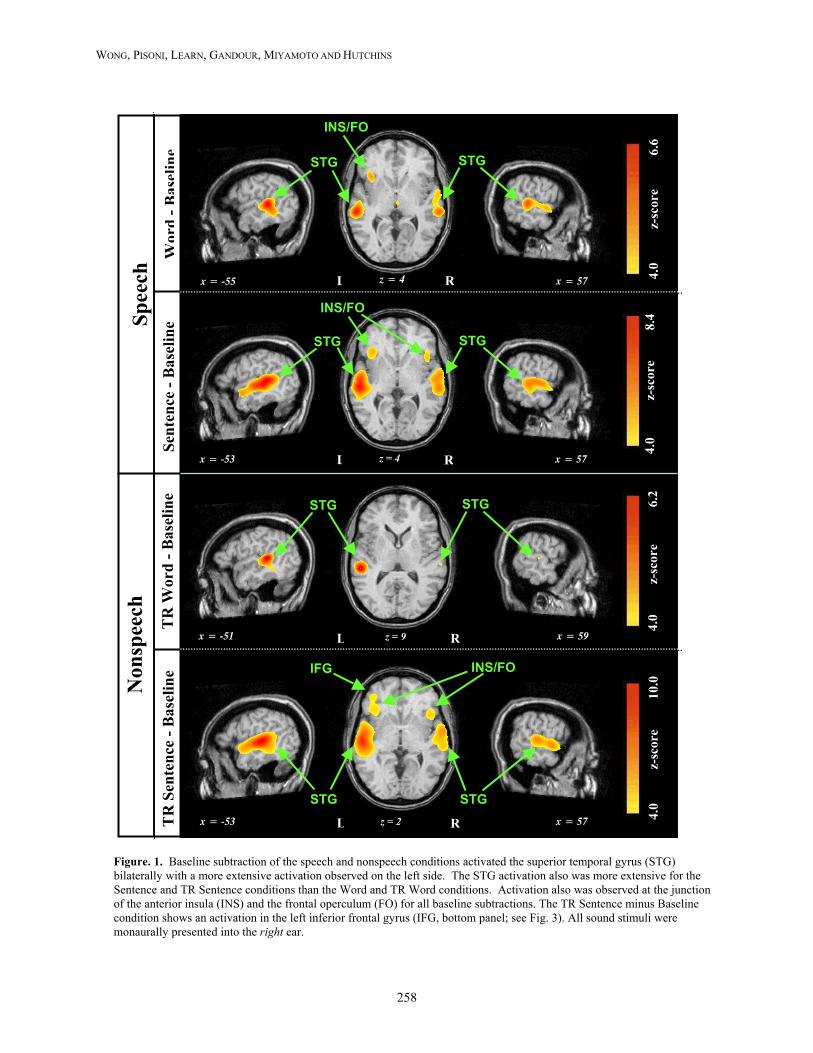
Figure. 1. Baseline subtraction of the speech and nonspeech conditions activated the superior temporal gyrus (STG) bilaterally with a more extensive activation observed on the left side. The STG activation also was more extensive for the Sentence and TR Sentence conditions than the Word and TR Word conditions. Activation also was observed at the junction of the anterior insula (INS) and the frontal operculum (FO) for all baseline subtractions. The TR Sentence minus Baseline condition shows an activation in the left inferior frontal gyrus (IFG, bottom panel; see Fig. 3). All sound stimuli were monaurally presented into the right ear.
STG STG
INS/FO IFG
L R z = 2 x = -53 x = 57TR
Sen
tenc
e - B
asel
ine
STG STG
L R z = 9 x = -51 x = 59
TR
Wor
d - B
asel
ine
STG STG
INS/FO
x = -53 x = 57L Rz = 4
Sent
ence
- B
asel
ine
INS/FO
STG STG
x = -55 x = 57L Rz = 4
Wor
d-B
asel
ine
Non
spee
ch
Spee
ch
4.0
z
-sco
re
10.0
4
.0
z-sc
ore
6
.2
4.
0
z-sc
ore
6.
6
4.
0
z-s
core
8.
4
PET IMAGINING OF SPEECH AND NONSPEECH STIMULI
259
TR Sentence - Baseline
TR Word - Baseline
Inferior Frontal Gyrus
Orbital Gyrus
y = 46 y = 39
L Ry = 41
L Ry = 48
40
4.0
10.0
z-score
z-score
4.0
6.2
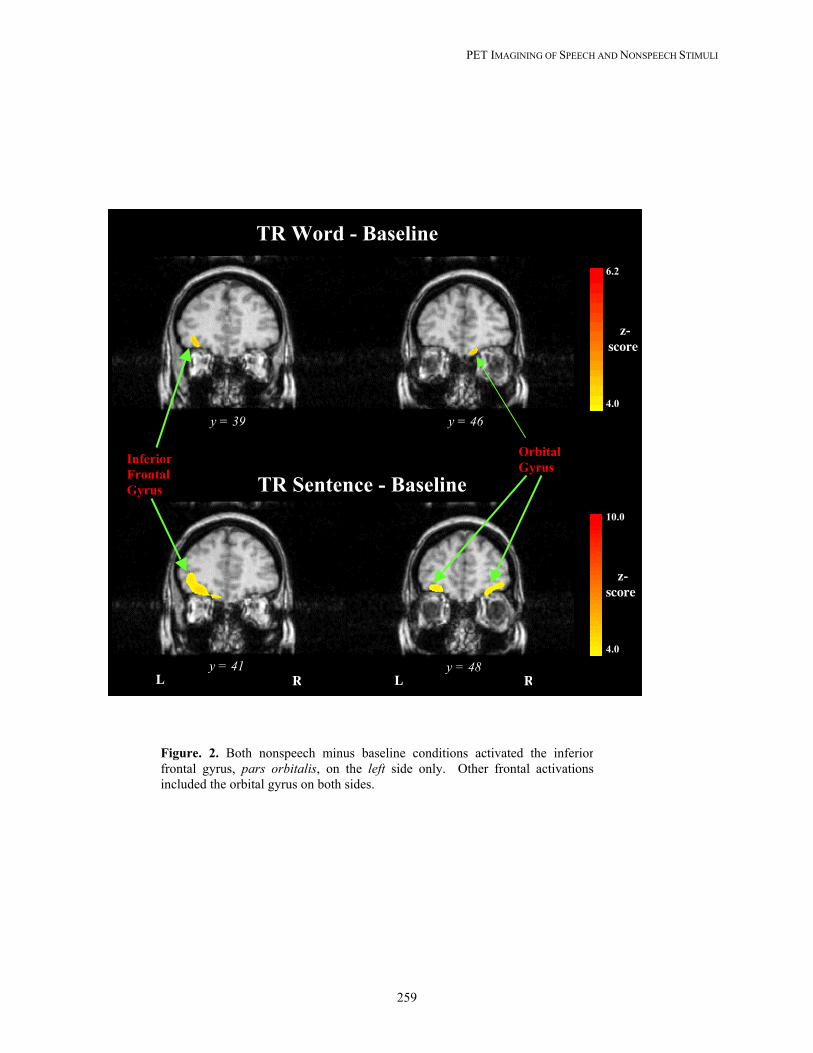
Figure. 2. Both nonspeech minus baseline conditions activated the inferior frontal gyrus, pars orbitalis, on the left side only. Other frontal activations included the orbital gyrus on both sides.
WONG, PISONI, LEARN, GANDOUR, MIYAMOTO AND HUTCHINS
260
STG/STS
4.0 z-score 4 .5 y = -13
L R
x = -53 z = 2
Sentence - Word
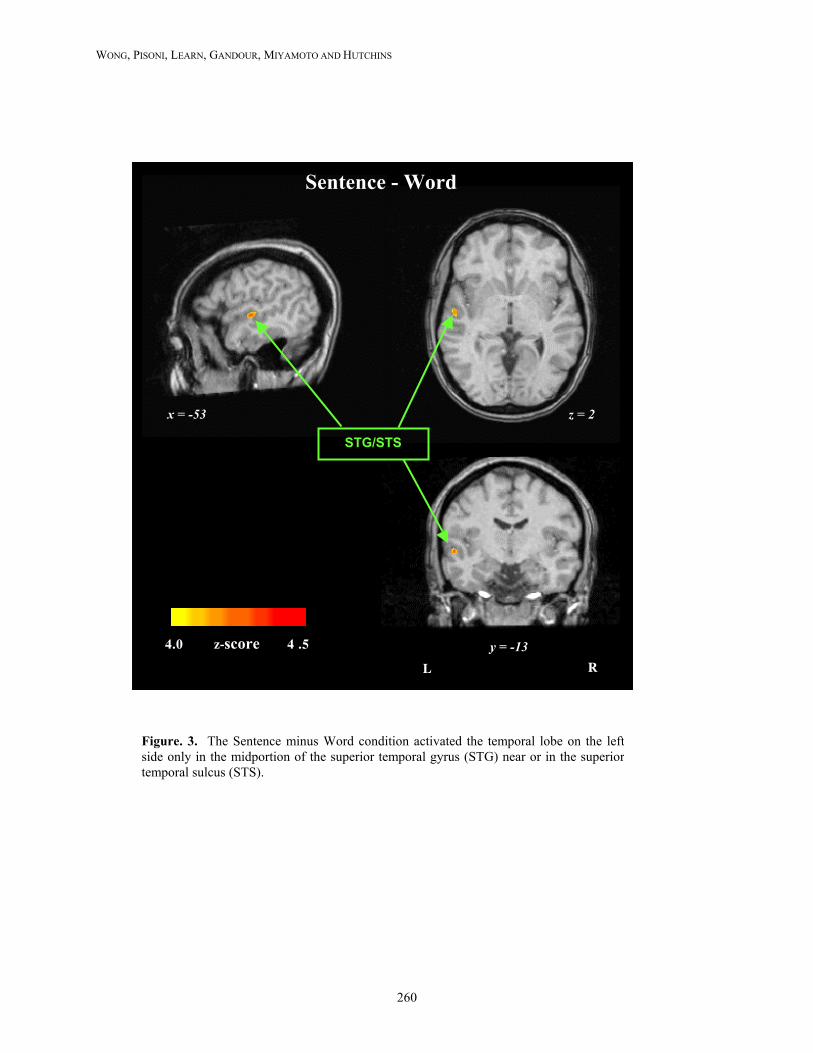
Figure. 3. The Sentence minus Word condition activated the temporal lobe on the left side only in the midportion of the superior temporal gyrus (STG) near or in the superior temporal sulcus (STS).
PET IMAGINING OF SPEECH AND NONSPEECH STIMULI
261
x = 1 z = 25
R L y = -63 -4.0 z- score -10.0
Posterior cingulate/ Precuneus
Figure. 4. The time-reversed Sentence minus baseline condition showed the most extensive deactivation mainly in the precuneus and posterior cingulate in the medial parietal lobe.
TR Sentence - Baseline

WONG, PISONI, LEARN, GANDOUR, MIYAMOTO AND HUTCHINS
262
Discussion
Frontal-Lobe Activation
Two separate activations foci in the frontal lobe were found almost exclusively for the nonspeech conditions compared to the silent baseline condition: in the left inferior (BA 47) and ventromedial (BA 11/10) prefrontal cortex. The activation observed in the left inferior prefrontal cortex was located in the inferior frontal gyrus (IFG), pars orbitalis (BA 47; Table 3: foci #1-2, 8-9). This perisylvian focus is over 20 mm rostral to the activation in the frontal operculum/anterior insula (Table 3: foci #7, 17-18), and is at least 18 mm from the second prefrontal focus.
Neuroimaging studies over the last decade have demonstrated that the left inferior prefrontal cortex
(BA 44, 45, 46, 47) shows the strongest activation to semantic task demands (for review see Price et al., 1999). The finding that the left IFG was activated only under the nonspeech conditions compared to silent baseline was somewhat unexpected. Thus, one would have expected the speech conditions to activate the part of the left IFG that contains the classically defined Broca’s area (pars opercularis, pars triangularis: BA 44/45) and is associated mainly with phonological processing. Petersen and colleagues (1988, 1989) were the first to demonstrate that the pars orbitalis (BA 47) of the left IFG showed the strongest activation pattern to semantic processing in speech production tasks. Imaging data obtained across word generation and semantic decision tasks provide further support for the association of semantic processing and the left inferior frontal cortex (e.g., Peterson et al., 1989; Wise et al., 1991; Shaywitz et al., 1995; Binder et al., 1997; Poldrack et al., 1999). This left prefrontal activation has also been found to extend into the temporal-parietal cortex, from the anterior temporal pole to as far posterior as the angular gyrus (Vanderberghe et al., 1996). Thus, based on both neuropsychological data and neuroimaging studies, the semantic processing system for spoken language may be mediated by a distributed neural network linking frontal regions with temporo-parietal language centers on the left hemisphere: BA 47, a part of the inferior frontal gyrus ventral to the classical-defined Broca’s area (BA 44/45), has an executive role for maintaining and controlling the effortful retrieval of semantic information from the posterior temporal areas (Fiez, 1997), and the posterior temporal regions for stored semantic knowledge (Price et al., 1999).
The lack of a left prefrontal activation to speech compared to baseline may be explained by the fact
that no explicit semantic association was required for the task in the present study. The subjects treated the task as a simple detection task. Despite the available lexico-semantic information contained in the familiar speech sounds, the speech tasks were apparently performed at the earlier acoustic and prelexical levels of analysis in the brain with minimal effort. This interpretation would account for the observed activation pattern in the superior temporal region that did not extend into the left inferior prefrontal cortex. In fact, similarity in the STG activation patterns for speech and backward speech is consistent with the hypothesis that regions of the temporal lobe are largely used for acoustic-phonetic processing (see Binder et al., 2000). The additional activation of the left prefrontal regions for the nonspeech signals may be related to greater task demands for backward speech that involved an effortful, although unsuccessful attempt at semantic retrieval and interpretation of these sound patterns. The presence of errors found only in the backward speech tasks and greater effort subjectively reported during post-scan debriefing are consistent with greater task demands in these types of auditory discrimination tasks. It is also possible that the activation in BA 47 for nonspeech tasks compared to silent baseline may be due to a relatively greater task demands placed on auditory working memory to maintain representations of these nonlinguistic stimuli. Models of working memory (Baddeley, 1996; Smith & Jonides, 1999) have suggested that executive processes, which provide the attentional control of working memory, may depend on the operation of the ventral part of Broca’s area in Brodmann’s area 45/47. The present study cannot dissociate the multiple cortical subsystems, whether task- or speech-specific, that are engaged when listening to backward speech.
PET IMAGINING OF SPEECH AND NONSPEECH STIMULI
263
The other major prefrontal activation that we observed was on the basal surface, typically in the
ventromedial frontal cortex (BA 11/10) in the gyrus rectus and orbital gyrus (basal part). The further recruitment of this prefrontal focus, in addition to the left inferior prefrontal cortex, may be related to the generally greater task demands required in performing these tasks when listening to unfamiliar auditory signals. This activation was observed in or near the part of the frontopolar region that is engaged in verbal memory tasks involving monitoring of auditory inputs (Petrides et al., 1993). The frontopolar region has extensive interconnections with auditory regions of the superior temporal gyrus (Petrides & Pandya, 1984; Barbas & Mesulum, 1985). Other researchers have suggested that processes related to retrieval effort and search in memory, whether successful or not, may also engage regions of anterior prefrontal cortex near BA 10 (e.g., see Buckner et al., 1996; Schacter et al., 1996). In the present study, the backward sentence task, presumably the more demanding of the two nonspeech tasks, evoked multiple activated foci extending bilaterally in these areas.
Activation in Temporal Lobe
In neuroimaging studies with normal-hearing listeners, both binaural (for review see e.g., Peterson et al., 1988) and monaural studies (e.g., Lauter et al., 1985; Hirano et al., 1997; Scheffler et al., 1998) have demonstrated bilateral activation of the STG. In the monaural studies, a more extensive activation was observed on the hemisphere contralateral to the side of stimulus presentation. The larger temporal-cortex activation contralateral to monaural stimulation reflects the known fact that auditory inputs transmitted along the central auditory pathway are sent predominantly to the contralateral auditory cortex (primary and secondary association areas) (e.g., see Jones and Peters, 1985). This general pattern of bilateral activation in the STG was also found in the present monaural study. When speech (words, sentences) and nonspeech (TR words, TR sentences) conditions were compared to the silent baseline condition, the posterior STG, which includes the auditory cortex, was activated bilaterally, but displayed a stronger and more extensive focus in the left hemisphere, contralateral to the stimuli presented to the right ear.
The sound patterns for both the sentences and backward sentences evoked the largest overall level of
activation, the isolated words evoked a smaller level of activation, and the TR words evoked the lowest level of activation within the STG (Table 5). This differing extent of activation may reflect the greater complexity of the sound patterns (Sentence and TR Sentence) versus the isolated stimuli (Word and TR Word). This interpretation is consistent with studies using binaural stimuli, in which the activated auditory regions in the temporal lobe became more extensive bilaterally as the task demands increased with the complexity of the speech stimuli (e.g. sentences differing in structural complexity) (Just et al., 1996).
Another possible explanation for the larger STG activation in the Sentence condition is related to
differences in presentation rate between the Sentence and Word conditions (Price et al., 1992; Binder et al., 1994; Dhankhar et al., 1997). The rate of word presentation was slower in the Word than Sentence condition (isolated words versus sequence of words of a sentence during a unit of time). In the nonspeech conditions, a presentation rate effect may also have induced the larger activation observed for the TR Sentence than the TR Word. Furthermore, both the Word and TR Word conditions (compared to baseline) showed a more confined activation in the posterior STG that was as robust on the left as the more extensive STG activation in the Sentence and TR Sentence conditions. The fact that we find common activation in the posterior STG for both Sentence and Word conditions cannot be explained by a presentation-rate effect. Instead, this posterior STG focus appears to reflect processing demands associated with speech stimuli (Price et al., 1992).
WONG, PISONI, LEARN, GANDOUR, MIYAMOTO AND HUTCHINS
264
In all stimulus conditions compared to silent baseline, the left posterior STG was consistently activated. This focus extended from within the Sylvian fissure to the lateral cerebral surface as far ventrally as the STS and MTG. Hirano et al. (1997) also observed activated foci in both the STG and the MTG when (Japanese) sentences were compared to backward sentences under monaural stimulation. Furthermore, Wise et al. (1991) noted that the bilateral activation of the STG showed a similar pattern when speech and backward speech were each compared to silent baseline under binaural presentation. This pattern of activation suggests that the posterior temporal gyrus of both sides participates in the initial cortical stages of sensory analysis of complex sounds, whether isolated words or sentences perceived as speech or nonspeech. Furthermore, the left posterior STG, especially in the vicinity of the STS and the posterior MTG, has been hypothesized to be involved with prelexical phonological processing (Mazoyer et al., 1993; Price et al., 1999). Our findings suggest that both speech and nonspeech were processed cortically beyond the early sensory level to at least the prelexical phonological stages in left-lateralized speech-specific sites.
The anterior STG (BA 22) was activated bilaterally only when the speech conditions were compared
to the silent baseline condition. This pattern of activity was typically located ventrally near the STS/MTG (BA 22/21) and as far anteriorly as BA 38 in a region of the temporal pole (Rademacher et al., 1992). The view that the anterior STG/temporal pole of both sides involves speech-specific processing was previously proposed because bilateral activation of the anterior STG was consistently found when subjects listened to speech sounds (Petersen et al., 1988; 1989; Wise et al., 1991; Zatorre et al., 1992; Mazoyer et al., 1993; Binder et al., 1994). In the present study using monaural stimulation, the anterior STG was activated on the right side only when the nonspeech condition (backward sentence) was compared to silence. This finding, in conjunction with the bilateral activation observed in the anterior STG for the speech conditions, suggests that the anterior STG is engaged in speech-specific processing on the left side only. The ipsilateral activation of the right anterior STG found in the backward sentence condition strongly suggests that this acoustic stream engaged right-hemispheric mechanisms specialized for the encoding and storage of prosodic and intonation cues (Zatorre et al., 1992; Griffiths et al., 1999). The absence of right-sided hemispheric activity for the backward word condition compared to baseline is unclear, although this may be due simply to the relatively lower overall level of STG activation observed for this task. The bilateral activation under the speech conditions is also consistent with the interpretation that prosodic processing of the speech stimuli is also lateralized to this right homologous region (Zatorre et al., 1992; Mazoyer et al., 1993).
Mazoyer et al. (1993) have associated bilateral activation of the temporal poles with binaural
listening to continuous speech (e.g., stories). A similar bilateral activation of the anterior STG was also evoked in the present monaural study, although continuous speech stimuli were not essential. Both the Word and Sentence conditions compared to silent baseline gave rise to an anterior STG focus. Moreover, our findings support the specialized role of this region in the processing of spoken language at the lexico-semantic level. When compared to silent baseline, the relatively stronger focus observed for sentences than for words also supports their hypothesis that the greater the extent of activity in the left temporal-pole, the more levels of linguistic processing are engaged and/or the more memory demands are placed on the linguistic content of stimuli. Since the word condition is sufficient to activate the left anterior temporal region, our findings indicate that the left STG/temporal pole is a component of a distributed network involved with lexical processing. In contrast, the posterior STG of both sides appears to be part of a network by which both sensory and sublexical phonological stages of cortical processing are shared by both speech and nonspeech signals. The fact that both speech and nonspeech stimuli similarly activated this region supports the view by Binder et al. (2000) that listeners can still perceive speech features from nonspeech signals as unintelligible as backward speech.
PET IMAGINING OF SPEECH AND NONSPEECH STIMULI
265
Activation in Anterior Insula The anterior insula/frontal operculum was activated on the left side for both speech and nonspeech
conditions compared to silent baseline. Bilateral activation was found only for the conditions that required listening to stimulus patterns (Sentence or TR Sentence). Although the exact role of the insula in language processing remains controversial (see Flynn et al 1999 for review), its connections with the auditory cortex and inferior frontal gyrus strategically places this relay station as part of a network engaged in verbal communication. Previous neuroimaging studies have demonstrated bilateral insular activation at or near the junction with the frontal operculum in tasks that involve speech articulation and coordination (Wise et al., 1999), short-term verbal memory (Paulesu et al., 1993), control of vocal pitch including subvocal rehearsal (Zatorre et al., 1994), and phonological encoding (Paulesu et al., 1996). In the present study, the demands of the auditory task in detecting signal repetition require maintenance of the stimulus pattern in short-term working memory. Subvocal rehearsal of meaningful speech signals or pitch patterns in nonspeech would be consistent with the role implicated for the anterior insula/frontal operculum. Activation Dissociated from Speech and Nonspeech Comparison
Previous neuroimaging studies have attempted to dissociate sites implicated in prelexical and lexico-
semantic stages of cortical processing by directly comparing speech and nonspeech conditions. However, when using backward speech as a nonspeech control for forward speech or pseudowords as a control for real words (Wise et al., 1991; Hirano et al., 1997; Price et al., 1996; Binder et al., 2000), the brain activation patterns among these subtractions showed little if any differences, especially in left-hemispheric regions associated with semantic processing (e.g., prefrontal cortex, angular gyrus and ventral temporal lobe). These negative results suggest that these “speechlike” stimuli, even though they are devoid of semantic content, unavoidably accessed stages of processing up to possibly the lexical level, but produced less activation in this network overall than real words (Norris & Wise, 2000). Consequently, commonly activated foci would be subtracted out in speech versus nonspeech contrasts. The present study also did not isolate auditory/speech centers of significant activation when speech was compared to backward speech [Word minus TR Word; Sentence minus TR Sentence (Table 4)]. These findings are consistent with the proposal that backward speech, which is even less speechlike than pseudowords, is a complex signal that will attempt to engage the distributed network for spoken language as much as possible. In fact, it is noteworthy that subjects reported that these backward speech stimuli appeared to be language-like, and even resemble “bits of a foreign language”. Yet this anecdotal finding is not inconsistent with earlier behavioral studies. For example, Kimura and Folb (1968) have demonstrated similar right-ear advantages for the perception of both forward and backward speech. Cutting (1974) noted that backward speech, as well as CV stimuli, contains transitions often unsuitable for perceiving speech segments, but yet are heard and processed as speech stimuli. In the present neuroimaging study, the similarities and differences found between the brain activation patterns for the speech and backward speech compared to silent baseline provide further insights into how brain circuits for speech may be exploited for processing complex nonspeech signals. Backward speech engaged not only most of the temporal-lobe network that mediates auditory and prelexical phonological stages of analysis of spoken language, but also additional stages of lexico-semantic processing associated with the left frontal lobe.
The TR Sentence compared to TR Word condition revealed activated foci in the left STG, right
anterior STG, and basal prefrontal cortex (BA 11) (Table 4: foci #7, 8-10). These activated foci may be simply related to the greater complexity and higher presentation rate, and hence greater potency in activation, of a sound pattern associated with a stream (sentences or TR sentences) than with isolated stimuli (words or TR words). Whereas the activation on the left side may merely reflect a greater activation contralateral to the monaural stimulus, the activation on the right side (anterior STG) probably reflects the relatively greater pitch processing associated with the stimulus stream.
WONG, PISONI, LEARN, GANDOUR, MIYAMOTO AND HUTCHINS
266
The present investigation was able to dissociate a cortical site related to processing at the sentence
level. When the Sentence was compared to Word condition, a discrete site was isolated in the left STS at the junction between the midportion of the STG and the MTG (Table 4: focus #1; Fig. 3). Mazoyer et al. (1993) implicated a similar region on the left that included the STG and MTG for sentence-level processing. In their study with binaural stimuli, the STG activation became significantly more asymmetric (left-sided) to meaningful stories than to word lists, and the MTG on the left side was activated by stories but not by word lists. Our observations also provide further support for the hypothesis that the cortical stages of processing at the single-word level and higher involve more extensive areas in the temporal lobe outside the classically defined Wernicke’s area in the temporo-parietal regions (Peterson et al., 1989; Binder et al., 1997). Deactivation of Cortical Regions
For all of the silent baseline subtractions, decreases in cerebral blood flow were commonly found in the medial parietal/occipital lobe (precuneus/post cingulate gyrus in BA 7/23/31), cortical regions known to show deactivation in auditory and non-auditory tasks (Shulman et al., 1997; Binder et al., 1999). Shulman et al. (1997) suggested that the information-processing demands required in the active conditions were sufficient to result in suspension of ongoing processes (e.g., self-monitoring of external environment or unconstrained verbal thought processes), which are normally found in the silent baseline condition. Compared to the silent baseline condition, the TR Sentence condition noticeably produced multiple deactivated foci in this region. This finding is also consistent with the hypothesis that greater effort and increased attentional demands are required in performing these tasks in the nonspeech conditions. Implications for Neuroimaging of CI Patients
Neuroimaging studies of speech and language processing in normal-hearing subjects have
recognized that task performance can involve not only the intended auditory processing from early sensory analysis to linguistic processing, but other nonspecific cognitive task-demands that are automatically engaged, such as selective attention and working memory. Yet, no imaging study with CI subjects has considered these more general cognitive demands as they relate to outcomes in speech-perception tasks. Thus, future imaging studies of CI users that attempt to relate their speech-perception levels to the distributed neural network activated in task performance should consider the attentional and working-memory networks that are engaged along with those for speech processing. In a recent PET study of a new CI user (Miyamoto et al., 2000), speech stimuli evoked activated prefrontal foci (BA 11/47) near some of those activated by backward speech in the present study. CI users presumably encounter greater demands on attention and working memory when listening to speech as compared to normal listeners. Thus, the effortful attempt of CI users to make sense of speech may be modeled in part by observing normal-listeners’ efforts to make sense of backward speech. These cognitive demands may initially be quite substantial as CI users attempt to recognize degraded signals fed through the device as speech. After about two years of device use, the prefrontal activation induced by speech extended into the right prefrontal regions where pitch processing of complex sounds has been implicated (Zatorre et al., 1992, 1994). It remains to be determined whether these frontal circuits will further develop and influence the speech-perception strategies and outcomes of CI users.
PET IMAGINING OF SPEECH AND NONSPEECH STIMULI
267
References Baddeley, A., 1996. The fractionation of working memory. Proc. Natl. Acad. Sci. USA 93, 13468-13472. Barbas, H., Mesulum, M.-M., 1985. Cortical afferent input to the principalis region of the rhesus monkey.
Neuroscience 15, 619-37. Binder, J.R., Frost, J.A., Hammeke, T.A., Cox, R.W., Rao, S.M., Prieto, T., 1997. Human brain language
areas identified by functional magnetic resonance imaging. J. Neurosci. 17, 353-362. Binder, J.R., Frost, J.A., Hammeke, T.A., Bellgowan, P.S.F., Rao, S.M., Cox, R.W., 1999. Conceptual
processing during the conscious rest state: A functional MRI study. J. Cogn. Neurosci. 11, 80-93. Binder, J.R., Frost, J.A., Hammeke, T.A., Bellgowan, P.S.F., Springer, J.A., Kaufman, J.N., Possing, T.,
2000. Human temporal lobe activation by speech and nonspeech sounds. Cereb. Cort. Mon. 10, 12-528.
Binder, J., Rao, S., Hammeke, T., Frost, J., Bandettini, P., Hyde, J., 1994. Effects of stimulus rate on signal response during functional magnetic resonance imaging of auditory cortex. Cogn. Brain Res. 2, 31-38.
Brown, C.M. and Hagoort, P., (editors) 1999. The Neurocognition of Language. Oxford University Press, New York.
Buckner, R.L., Raichle, M.E., Miezin, F.M., Petersen, S.E., 1996. Functional anatomic studies of memory retrieval for auditory words and visual pictures. J. Neurosci. 16, 6219-6235.
Cutting, J.E., 1974. Two left-hemisphere mechanisms in speech perception. Perception and Psychophysics, 16, 601-612.
Dhankhar, A., Wexler, B.E., Fulbright, R.K., Halwes, T., Blamire, A.M., Shulman, R.G. 1997. Functional magnetic resonance imaging assessment of the human brain auditory cortex response to increasing word presentation rate. J. Neurophysiol. 77, 476-483.
Egan, J.P., 1948. Articulation testing methods. Laryngoscope 58, 955-991. Fiez, J.A., 1997. Phonology, semantics, and the role of the left inferior prefrontal cortex. Hum. Brain
Mapping 5, 79-83. Flynn, F., Benson, F., Ardila, A., 1999. Anatomy of the insula – functional and clinical correlates.
Aphasiology 13, 55-78. Friston, K., Frith, C., Liddle, P., Dolan, R., Lamerstma, A., Frackowiak R., 1990. The relationship
between global and local changes in PET scans. J. Cereb. Blood Flow Metab. 10, 458-466. Friston, K., Frith, C., Liddle, P., Frackowiak, R., 1991. Comparing functional PET images: The
assessment of significant changes. J. Cereb. Blood Flow Metab. 11, 81-95. Geschwind, N., 1979. Specializations of the human brain. Scientific American 241, 158-168. Griffiths, T.D., Johnsrude, I., Dean, J.L., Green, G.G.R., 1999. A common neural substrate for the
analysis of pitch and duration patterns in segmented sounds. NeuroReport 10, 3815-3820. Hirano, S, Naito, Y, Okazawa, H, Kojima, H, Honjo, I., Ishizu, K, Yenokura, Y, Nagahama, Y,
Fukuyama, H., Konishi, J., 1997. Cortical activation by monaural speech sound stimulation demonstrated by positron emission tomography. Exp. Brain Res. 113, 75-80.
Howard, D., Patterson, K., Wise, R. Brown, W.D., Friston, K., Weiller, C., Frackowiak, R., 1992. The cortical localization of the lexicon. Brain 115, 1769-1782.
Just, M.A., Carpenter, P.A., Keller, T.A., Eddy, W.F., Thulborn, K.R., 1996. Brain activation modulated by sentence comprehension. Science 274, 114-116.
Jones, E.G., Peters, A., 1985. Cerebral cortex. Association and auditory cortices. Vol., 4. Plenum Press, New York.
Kimura, D., Folb, S., 1968. Neural processing of backwards-speech sounds. Science 161, 395-396. Lauter, J.L., Herscovitch, P., Formby, C., Raichle, M.E., 1985. Tonotopic organization in human auditory
cortex revealed by positron emission tomography. Hearing Res. 20, 199-205. Mazoyer, B., Dehaene, S., Tzourio, N., Frak, V., Cohen, L., Murayama, N., Levrier, O., Salamon, G.,
Mehler, L., 1993. J. Cogn. Neurosci. 5, 467-479.
WONG, PISONI, LEARN, GANDOUR, MIYAMOTO AND HUTCHINS
268
Minoshima, S., Koeppe, R., Mintum, M., Berger, K.L., Taylor, S.F., Frey, K.A., Kuhl, D.E., 1993. Automated detection of the intercommissural line for stereotaxic localization of functional brain imaging. J. Nucl. Med. 34, 322-329.
Miyamoto, R.T., Wong, D., Pisoni, D.B. Changes induced in brain activation in a prelingually-deaf, adult cochlear implant user: A PET study. Presented at ASHA, November, 2000.
Naito, Y., Okazawa, H., Honjo, I., Hirano, S., Takahashi, H., Shiomi, Y., Hoji, W., Kawano, M., Ishizu, K., Yonekura, Y., 1995. Cortical activation with sound stimulation in cochlear implant users demonstrated by positron emission tomography. Cogn. Brain Res. 2, 207-214.
Naito, Y., Okazawa, H., Hirano, S., Takahashi, H., Kawano, M., Ishizu, K., Yonekura, Y., Konishi, J., Honjo, I., 1997. Sound induced activation of auditory cortices in cochlear implant users with post- and prelingual deafness demonstrated by positron emission tomography. Acta Oto-Laryngologica 117, 490-496.
Norris, D., Wise, R., 2000. The study of prelexical and lexical processes in comprehension: Psycholinguistics and functional neuroimaging. In: The new cognitive neurosciences. M Gazzaniga (editor), 2nd edition, chapter 60, pp. 867-880. The MIT Press: Cambridge, MA.
Paulesu, E., Frith, C., Frackowiak, R., 1993. The neural correlates of the verbal component of working memory. Nature 362, 342-345.
Paulesu, E., Frith, U., Snowling, M., Gallagher, A., Morton, J., Frackowiak, R., Frith, C., 1996. Is developmental dyslexia a disconnection syndrome? Brain 119, 143-157.
Petersen, S.E., Fiez, J.A., 1993. The processing of single words studied with positron emission tomography. Annu. Rev. Neurosci. 13, 25-42.
Petersen, S.E., Fox, P.T., Posner, M.I., Mintum, M., Raichle, M.E., 1988. Positron emission tomographic studies of the cortical anatomy of single-word processing. Nature 331, 585-589.
Petersen, S.E., Fox, P.T., Posner, M.I., Mintum, M., Raichle, M.E., 1989. Positron emission tomographic studies of the processing of single words. J. Cogn. Neurosci. 1, 153-170.
Petrides, M., Pandya, D.N., 1984. Association fiber pathways to the frontal cortex from the superior temporal region in the rhesus monkey. J. Comp. Neurol. 273, 52-66.
Petrides, M., Alivasatos, B., Meyer, E., Evans, A.C., 1993. Functional activation of the human frontal cortex during the performance of verbal working memory tasks. Proc. Natl. Acad. Sci. USA 90, 878-882.
Poldrack, R.A., Wagner, A.D., Prull, M.W., Desmond, J.E., Glover, G.H., Gabrielli, J.D.E., 1999 Functional specialization for semantic and phonological processing in the left inferior prefrontal cortex. Neuroimage 10, 15-35.
Price, C., Indefrey, P., Turrennoul, M., 1999. The neural architecture underlying the processing of written and spoken word forms. In: The Neurocognition of Language (Colin M Brown and Peter Hagoort eds). Oxford University Press, New York.
Price, C., Wise, R., Ramsay, S., Friston, K., Howard, D. Patterson, K., & Frackowiak, R., 1992. Regional response differences within the human auditory cortex when listening to words. Neurosci. Lett. 146, 179-182.
Price, C.J., Wise, R.J.S., Warburton, E.A., Moore, C.J., Howard, D., Patterson, K., Frackowiak, R.S.J., Friston, K.J., 1996. Hearing and saying. The functional neuroanatomy of auditory word processing. Brain 119, 919-931.
Rademacher, J., Galaburda, A.M., Kennedy, D.N., Filipek, P.A., Caviness, V.S., 1992. Human cerebral cortex: localization, parcellation, and morphometry with magnetic resonance imaging. J. Cogn. Neurosci. 4, 352-374.
Schacter, D.L., Alpert, N.M., Savage, C.R., Rauch, S.L., Albert, M.S., 1996. Conscious recollection and the human hippocampal formation: evidence from positron emission tomography. Proc. Natl. Acad. Sci. USA 93, 321-325.
PET IMAGINING OF SPEECH AND NONSPEECH STIMULI
269
Scheffler, K., Bilecen, D., Schmid, N., Tschopp, K., Seelig, J., 1998. Auditory cortical responses in hearing subjects and unilateral deaf patients as detected by functional magnetic resonance imaging. Cereb. Cortex 8, 156-163.
Shaywitz, B.A., Pugh, K.R., Constable, R.T., Shaywitz, S.E., Bronen, R.A., Fulbright, R.K., Shankweiler, D.P., Katz, L., Fletcher, J.M.S.E., Skudlarski, P., Gore, J.C., 1995. Localization of semantic processing using functional magnetic resonance imaging. Hum. Brain Mapping 2, 149-158.
Shulman, G.L., Fiez, J.A., Corbetta, M., Buckner, R.L., Miezin, F.M., Raichle, M.E., Petersen, S.E., 1997. Common blood flow changes across visual tasks: II. Decreases in cerebral cortex. J. Cogn. Neurosci. 9, 648-663.
Smith, E., Jonides, J., 1999. Storage and executive processes in the frontal lobes. Science 283, 1657-1661. Talairach, J., Tournoux, P., 1988. Co-planar Stereotaxic Atlas of the Human Brain. 3-Dimensional
Proportional System: An Approach to Cerebral Imaging. Thieme Medical Publisher, New York, NY.
Vanderberghe, R., Price, C.J., Wise R, Josephs, O., Frackowiak, R.S.J., 1996. Functional anatomy of a common semantic system for words and pictures. Nature 383, 254-256.
Wise, R., Chollet, F., Hadar, U., Friston, K.J., Hoffner, E., Frackowiak, R.S.J., 1991. Distribution of cortical networks involved in word comprehension and word retrieval. Brain 114, 1803-1817.
Wise, R.J., Greene, J., Buchel, C., Scott, S.K., 1999. Brain regions involved in articulation. Lancet, 353, 1057-1061.
Wong, D., Miyamoto, R.T., Pisoni, D.B., Sehgal, M., Hutchins, G.D., 1999. PET imaging of cochlear-implant and normal-hearing subjects listening to speech and nonspeech. Hearing Res. 132, 34-42.
Zatorre, R.J., Evan, A.C., Meyer, E., Gjedde, A., 1992. Lateralization of phonetic and pitch discrimination in speech processing. Science 256, 846-849.
Zatorre, R.J., Evans, A.C., Meyer E., 1994. Neural mechanisms underlying melodic perception and memory for pitch. J. Neurosci. 14, 1908-1919.
WONG, PISONI, LEARN, GANDOUR, MIYAMOTO AND HUTCHINS
270
This page left blank intentionally.
Recommended