Performance Dashboard
Hopper Car Demand Cars Shipped
Week 50 This Year Last YearThis Year versus
Last Year
This Year
Last Year
This Year vs. Last
Year YTDWeekly Average YTD
Weekly Average YTD
Weekly Average
CN 3,793 3,083 710 214,160 4,283 197,864 3,957 16,296 325
CP 3,504 3,411 93 204,944 4,098 201,396 4,027 3,548 70
7,297 6,494 803 419,104 8,381 399,260 7,984 19,844 395
Railway Corridor Week 50 YTD
CN N.A. Domestic 314 22,903
Prince Rupert 1,077 60,143
Thunder Bay 500 22,506
Vancouver 1,393 100,739
Total 3,284 206,291
CP N.A. Domestic 448 13,962
Prince Rupert 112 112
Thunder Bay 1,328 47,346
Vancouver 1,460 139,029
Total 3,348 200,449
Empty Hopper Cars Supplied - Week 50 (All Want Weeks) Supplied by Block Size
Current Week Orders
Prior Week Orders Future Week Orders Total Cars Supplied
This Year
Last Year This Year
Last Year This Year
Last Year
ThisYear Last Year
CN 3,239 2,829 109 260 22 3,348 3,111
CP 3,065 2,506 195 120 501 200 3,761 2,826
6,304 5,335 304 380 501 222 7,109 5,937
Week 50 Year to DateBlock Size CN CP Total CN CP Total
1 1% 2% 2% 3% 3% 3%
25 5% 1% 3% 3% 2% 3%
50 17% 14% 16% 13% 11% 12%
100 77% 82% 80% 80% 84% 82%
Current Week Order Fulfillment
CN CP Total
Current Week Hopper Car Demand 3,793 3,504 7,297Current Week Order Fulfillment
Supplied in Current Week 3,239 3,065 6,304
Supplied Early 2 134 136
Total Cars Supplied for Want Week 3,241 3,199 6,440
Current Week Unfulfilled Demand (552) (305) (857)
% Current Week Orders Supplied 85% 91% 88%
85% 91%
Loaded Dwell Time (Hours) at Origin (All Traffic) Dwell Time (Hours) at Destination (All Traffic)
Week 50 Year to Date
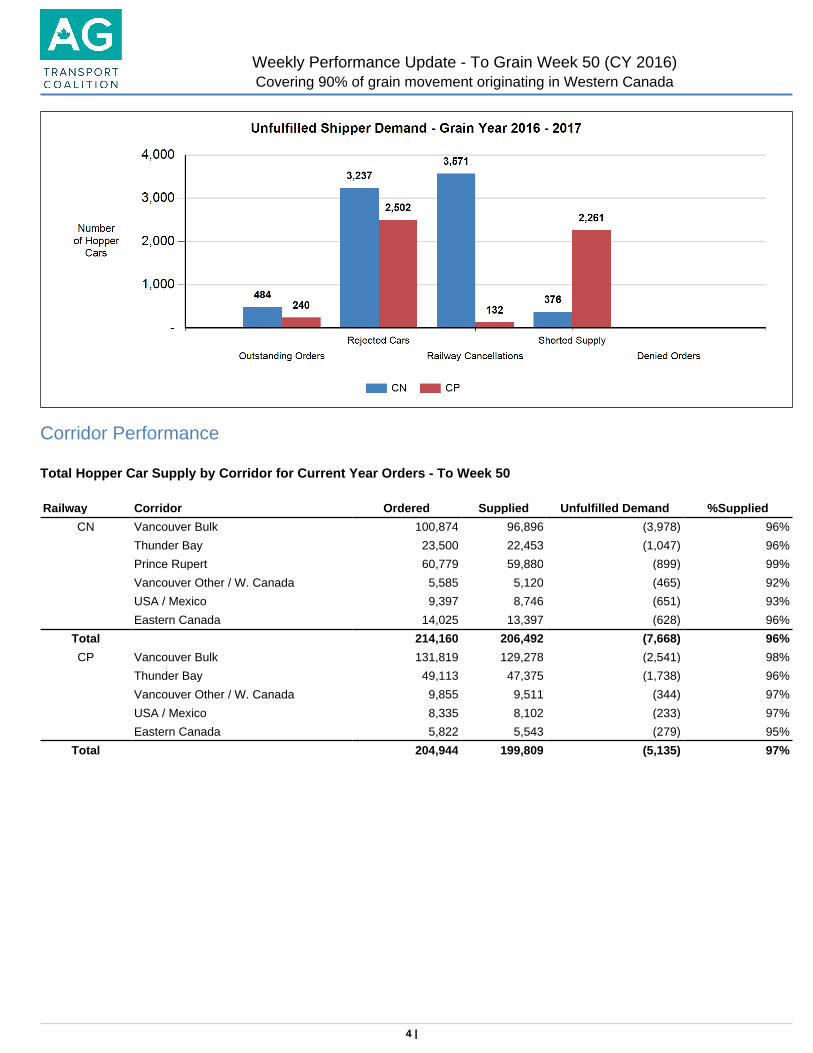
This Year Last Year This Year Last YearCN 28 23 25 20CP 41 33 60 60
Week 50 Year to DateThis Year Last Year This Year Last Year
Vancouver CN 17 15 19 24CP 11 8 11 10
Thunder Bay CN 35 32 51 73CP 42 38 40 47
1 |
Weekly Performance Update - To Grain Week 50 (CY 2016)Covering 90% of grain movement originating in Western Canada
2 |
Weekly Performance Update - To Grain Week 50 (CY 2016)Covering 90% of grain movement originating in Western Canada

3 |
Weekly Performance Update - To Grain Week 50 (CY 2016)Covering 90% of grain movement originating in Western Canada
Corridor Performance
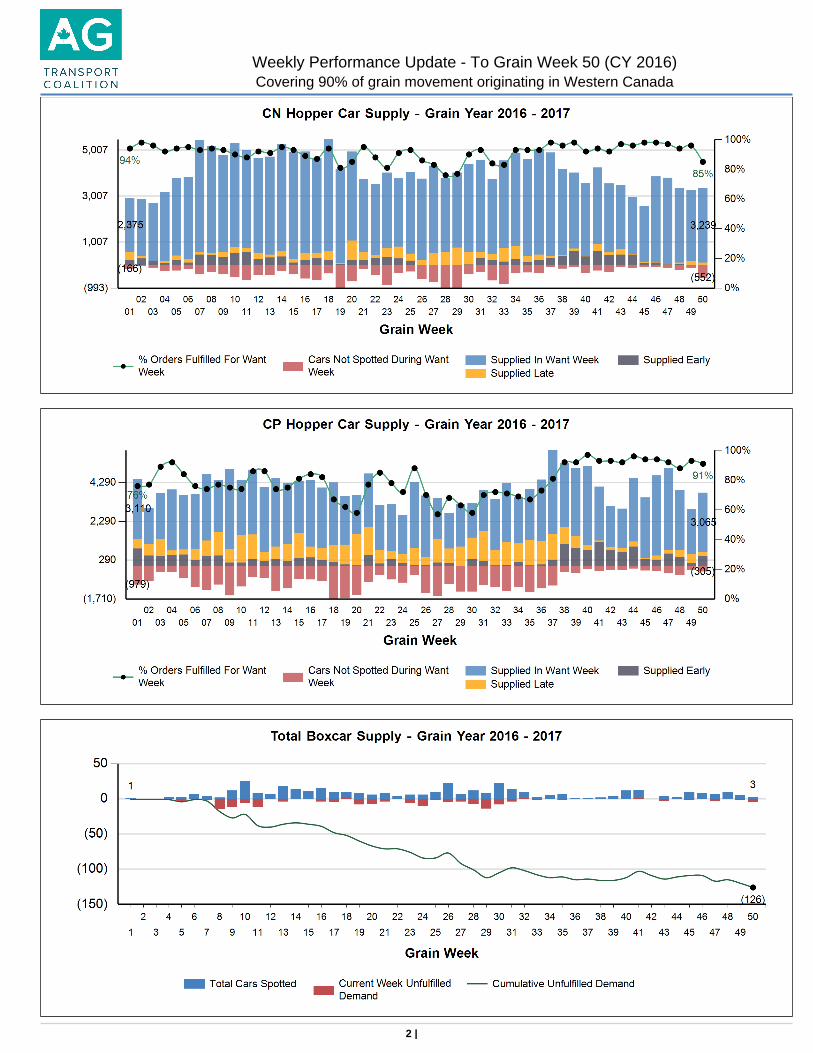
Total Hopper Car Supply by Corridor for Current Year Orders - To Week 50
Railway Corridor Ordered Supplied Unfulfilled Demand %Supplied
CN Vancouver Bulk 100,874 96,896 (3,978) 96%
Thunder Bay 23,500 22,453 (1,047) 96%
Prince Rupert 60,779 59,880 (899) 99%
Vancouver Other / W. Canada 5,585 5,120 (465) 92%
USA / Mexico 9,397 8,746 (651) 93%
Eastern Canada 14,025 13,397 (628) 96%
Total 214,160 206,492 (7,668) 96%
CP Vancouver Bulk 131,819 129,278 (2,541) 98%
Thunder Bay 49,113 47,375 (1,738) 96%
Vancouver Other / W. Canada 9,855 9,511 (344) 97%
USA / Mexico 8,335 8,102 (233) 97%
Eastern Canada 5,822 5,543 (279) 95%
Total 204,944 199,809 (5,135) 97%
4 |
Weekly Performance Update - To Grain Week 50 (CY 2016)Covering 90% of grain movement originating in Western Canada

Hopper Cars Supplied in the Want Week by Corridor - To Week 50
Week 50 Year to Date
Railway Corridor Ordered Supplied %Supplied Ordered Supplied %Supplied
CN Vancouver Bulk 1,660 1,392 84% 100,874 89,874 89%
Thunder Bay 585 549 94% 23,500 21,393 91%
Prince Rupert 1,088 1,075 99% 60,779 58,095 96%
Vancouver Other / W. Canada 63 60 95% 5,585 4,633 83%
USA / Mexico 259 104 40% 9,397 8,291 88%
Eastern Canada 138 61 44% 14,025 12,581 90%
CN Total 3,793 3,241 85% 214,160 194,867 91%
CP Vancouver Bulk 1,482 1,449 98% 131,819 106,488 81%
Thunder Bay 1,586 1,354 85% 49,113 40,162 82%
Vancouver Other / W. Canada 52 52 100% 9,855 7,284 74%
USA / Mexico 334 294 88% 8,335 5,649 68%
Eastern Canada 50 50 100% 5,822 3,747 64%
CP Total 3,504 3,199 91% 204,944 163,330 80%
5 |
Weekly Performance Update - To Grain Week 50 (CY 2016)Covering 90% of grain movement originating in Western Canada
Origin Dwell Performance
6 |
Weekly Performance Update - To Grain Week 50 (CY 2016)Covering 90% of grain movement originating in Western Canada

Destination Dwell Performance
7 |
Weekly Performance Update - To Grain Week 50 (CY 2016)Covering 90% of grain movement originating in Western Canada
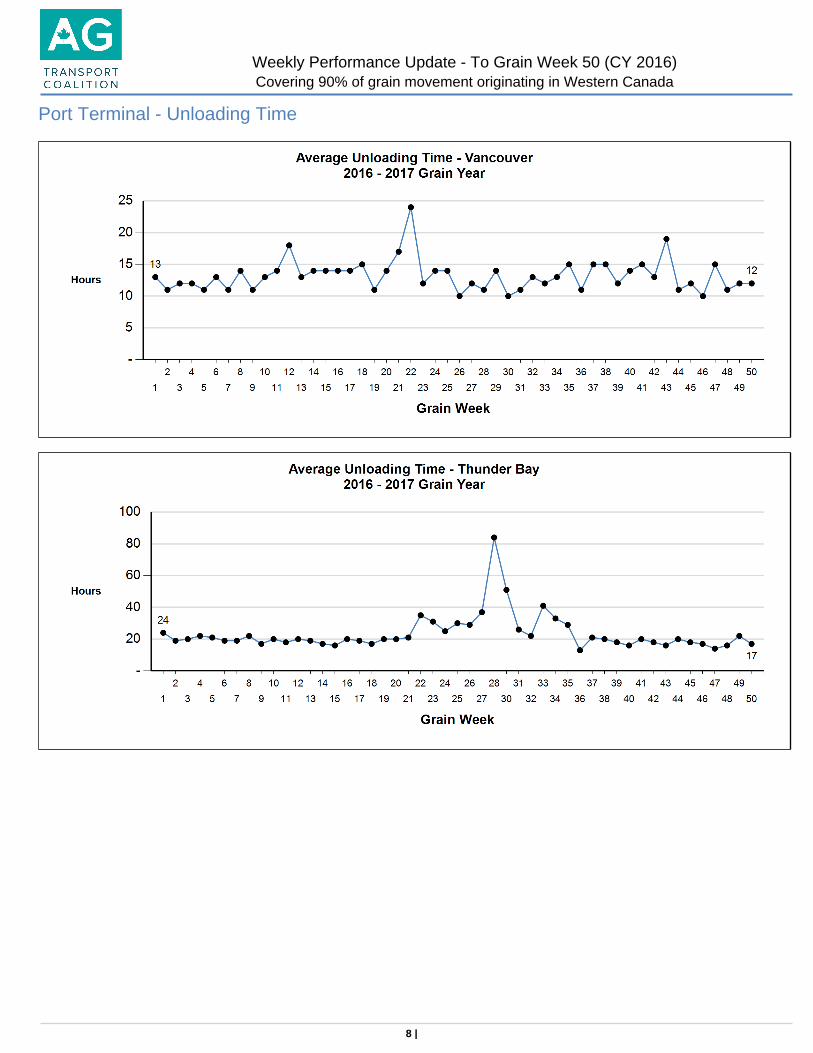
Port Terminal - Unloading Time
8 |
Weekly Performance Update - To Grain Week 50 (CY 2016)Covering 90% of grain movement originating in Western Canada

Glossary of Terms
Hopper Car Demand The total number of hopper cars ordered for a given want week for each of CN and CP. Demand data is presented for the current week report and for the grain year to date. Comparisons are provided for the current grain versus the prior grain year.
Empty Hopper Cars Supplied
A count of all empty hopper cars supplied for the grain service week being reported on. Supply is categorized based on whether it is for the current want week, for prior week orders or for future week orders (supplied early).
Supplied by Block Size Percentage distribution of total hopper car supply for the current report week and year to date (YTD) based on the block size ordered by shippers and as reported by shippers.
Hopper Cars Supplied in Want Week
A count of all empty hopper cars supplied for a want week in that want week including cars supplied early which are considered on time.
Want Week Order week as defined by the railways
Cars Supplied Early Cars supplied for orders in a given want week supplied in advance of that week – these cars are considered on time for performance measurement purposes.
Cars Supplied Late Cars supplied during a grain service week that are for a prior week’s orders.
Hopper Car Orders Supplied Within the Want Week
The number of hopper cars supplied by the railways during or in advance of the want week expressed as a percentage of total orders for the week.
Future Week Orders Orders supplied in a given grain service week that are for orders in weeks after the week for which performance is being reported. – Reference Page 1 – Empty Hopper Cars Supplied
Prior Week Orders Orders supplied in a given grain service week that are for orders in weeks prior to the week for which performance is being reported. – Reference Page 1 – Empty Hopper Cars Supplied
Outstanding Orders Orders that shippers expect to have fulfilled by the railways that remain unfulfilled as of the report date. This excludes bad order cars, shorted cars, denied orders and railway cancellations.
Unfulfilled Demand The calculation of total unfulfilled demand for hopper cars represents the accumulated difference across all grain weeks in the year between the number of cars ordered by shippers and the number of cars supplied by the railway for those orders. This total unfulfilled demand includes orders not filled as a result of bad order and shorted cars and as such represents the volume of missed and deferred shipper orders.
Origin Dwell The elapsed time from the release of loaded cars by shippers to the time the railways physically pull the cars from a shipper’s siding for movement to destination.
Destination Dwell The elapsed time from the time a railcar arrives at the destination railway yard to the time it is placed at the receiver’s facility for unloading.
Unloading Time The average time elapsed between the placement of a loaded car at the receiver’s facility and the release of the empty car back to the railway.
Port Terminal Unloading Time
The average elapsed time between the placement of a loaded car for unloading to the release of the empty car. This measure is based on railway reported placement and empty release events.
9 |
Weekly Performance Update - To Grain Week 50 (CY 2016)Covering 90% of grain movement originating in Western Canada
Recommended