Optimal dispatch of zero-carbon-emission micro Energy Internetintegrated with non-supplementary fired compressed air energystorage system
Rui LI1, Laijun CHEN1, Tiejiang YUAN2, Chunlai LI3
Abstract To utilize heat and electricity in a clean and
integrated manner, a zero-carbon-emission micro Energy
Internet (ZCE-MEI) architecture is proposed by incorpo-
rating non-supplementary fired compressed air energy
storage (NSF-CAES) hub. A typical ZCE-MEI combining
power distribution network (PDN) and district heating
network (DHN) with NSF-CAES is considered in this
paper. NSF-CAES hub is formulated to take the thermal
dynamic and pressure behavior into account to enhance
dispatch flexibility. A modified DistFlow model is utilized
to allow several discrete and continuous reactive power
compensators to maintain voltage quality of PDN. Optimal
operation of the ZCE-MEI is firstly modeled as a mixed
integer nonlinear programming (MINLP). Several trans-
formations and simplifications are taken to convert the
problem as a mixed integer linear programming (MILP)
which can be effectively solved by CPLEX. A typical test
system composed of a NSF-CAES hub, a 33-bus PDN, and
an 8-node DHN is adopted to verify the effectiveness of the
proposed ZCE-MEI in terms of reducing operation cost and
wind curtailment.
Keywords Zero-carbon-emission micro Energy Internet,
Non-supplementary fired compressed air energy storage,
District heating network, Power distribution network,
DistFlow, Mixed integer linear programming
1 Introduction
The dual-pressure from global energy crisis and envi-
ronment pollution, has led to the reformation of energy
utilization behaviors. Exploiting renewable energies is a
world-wide consensus to address energy and environment
issues. Renewable energies, such as wind power and solar
power, have gained a rapid development both in concen-
trated and distributed manner in the last decades [1].
However, most available wind and solar power are greatly
curtailed in the recent years, especially in Northeast and
Northwest China, which prevents the stable development
of renewable energy industry [2].
Utilizing multiple energy carriers including electricity,
heat, cold, and natural gas in an integrated way is a trend to
reduce the waste of wind and solar power. Integrated
energy system (IES) is a symbolic system incorporating
multiple energy carriers by connecting several energy
networks with a few energy hubs (EH) capable of the
transmission, conversion, and storage among different
energy carriers [3, 4]. Through IES and EH, different
energy networks can be co-optimized and managed to
improve the utilization ratio of wind and solar power and
CrossCheck date: 12 September 2016
Received: 30 June 2016 / Accepted: 13 September 2016 / Published
online: 21 October 2016
� The Author(s) 2016. This article is published with open access at
Springerlink.com
& Laijun CHEN
Rui LI
Tiejiang YUAN
Chunlai LI
1 Department of Electrical Engineering, Tsinghua University,
Beijing 100084, China
2 Department of Electrical Engineering, Xinjiang University,
Urumqi 830046, China
3 Qinghai Electrical Power Research Institute, Qinghai Electric
Power Corporation, Xining 810008, China
123
J. Mod. Power Syst. Clean Energy (2016) 4(4):566–580
DOI 10.1007/s40565-016-0241-4

increase dispatch flexibility of the whole energy supply
system [5–8].
CHP unit is a kind of EH capable of supplying heat and
electricity simultaneously, i.e., co-generation. In this
respect, CHP is utilized to co-optimize heating network and
electrical network to increase the flexibility and reduce
curtailed wind and solar power [5–7]. Unfortunately, CHP
needs natural gas backup to generate electricity, which
breaks the original intention to release environment issue
due to carbon emission caused by burning fossil fuel.
Compressed air energy storage (CAES), a promising
energy storage technique, also uses natural gas combustion
to produce electricity and leads to environment issues
similar to CHP. By incorporating thermal energy storage
system (TES) into CAES, advanced adiabatic compressed
air energy storage system (AA-CAES) and non-supple-
mentary fired compressed air energy storage system (NSF-
CAES) are capable of storing the thermal generated during
air compression process in an air storage tank, and
releasing it to heat the compressed air during electricity
generation process [9, 10]. Thus, no gas combustion is
needed in such advanced CAES systems. Similar with
CHP, NSF-CAES is a class of EH capable of combined
cooling, heating, and power generation. Owing to the zero-
carbon-emission character, NSF-CAES hub can be adopted
to construct a zero-carbon IES. On that basis, a zero-car-
bon-emission micro Energy Internet (ZCE-MEI) architec-
ture is proposed by developing NSF-CAES as a clean EH
to encompass the power distribution network (PDN) and
district heating network (DHN) in this paper. The feasi-
bility of using NSF-CAES as a clean energy hub in Energy
Internet has been analyzed in [11], while more emphasis
has been put on the scheduling of ZCE-MEI in this
paper.
The studies that are suitable for modeling CAES has
been available in [12–16]. CAES system and NSF-CAES
system are formulated and implemented to power network
dispatch operation in [12, 13] respectively. The optimal
scheduling of wind power integrated with CAES in trans-
mission system is studied in [14]. Meanwhile, by consid-
ering wind power generation and CAES, a low-carbon-
emission micro grid architecture and corresponding ther-
mal-wind-storage joint operation dispatch method are
proposed respectively in [15, 16]. Optimal operation
strategies of CAES on electricity spot markets with fluc-
tuating prices are reported in [17]. On the other hand, the
combined operation of electricity and heating system has
been investigated in several literatures as [5–8, 18, 19].
Optimal operation strategies have been developed in [5] to
accommodate wind power. Dispatch problem of combined
heat and power, and transmission-constrained unit com-
mitment by co-optimize PDN and DHN are investigated in
[6, 7] respectively. Two combined analysis methods have
been developed in [8] to analysis the operation of heating
and electricity network. Optimal power flow of integrated
electrical and heating system is studied in [18]. Besides,
coordinated scheduling of energy resources for distributed
district heating and cooling systems in an integrated energy
grid has been investigated in [19].
Although some existing references are dedicated to
explore the operation of CAES and combined operation of
integrated electricity and heating systems, most of them
establish a simplified efficiency based power block model
to formulate CAES, without modeling the pressure and
temperature dynamic of CAES. CAES is a natural EH
capable of co-generation of cool, heat and power. It is
necessary to consider the pressure behaviors and temper-
ature dynamic to enhance dispatch flexibility. On the other
hand, with the high penetration of renewable energies,
voltage management of PDN is more difficult and impor-
tant compared with traditional PDN. Thus, voltage, reac-
tive power, and corresponding reactive compensators need
to be formulated to maintain reactive power balance and
voltage quality in the optimal operation of PDN. Besides,
most exist combined heat and electricity systems use CHP
as the interface between PDN and DHN, which undoubt-
edly opposites the requirement of zero-carbon-emission. In
this regard, we intend to develop a short-term day-ahead
scheduling model for the proposed ZCE-MEI integrated
NSF-CAES to reduce wind power curtailment and save
system operation cost.
The contribution of this paper mainly includes the fol-
lowing three parts. Firstly, a micro Energy Internet archi-
tecture is proposed, NSF-CAES is utilized as a clean EH to
achieve zero-carbon-emission. Secondly, detailed dispatch
model of NSF-CAES hub is constructed by considering the
pressure behaviors and thermal dynamics. DistFlow model
of the radial PDN is also formulated by incorporating
discrete and continuous reactive power compensators, and
on load tap changer (OLTC). Thirdly, operation of the
proposed ZCE-MEI is optimized to reduce curtailed wind
power and operation cost compared with traditional PDN
and DHN.
The rest of this paper is organized as follows. Micro
Energy Internet and ZCE-MEI architecture are proposed in
Section 2, operation mechanism and detailed dispatch
model of NSF-CAES hub are also formulated to incorpo-
rate the pressure behaviors and temperature dynamics. In
Section 3, optimal operation of ZCE-MEI incorporating
PDN and DHN with NSF-CAES hub is modeled to reduce
operation cost and wind curtailment. The effectiveness of
the proposed architecture and dispatch model is verified
through a typical ZCE-MEI composed of a NSF-CAES
hub, an 8-node DHN, and a 33-bus PDN in Section 4.
Conclusions and further research directions are drawn in
Section 5.
Optimal dispatch of zero-carbon-emission micro Energy Internet… 567
123

2 Zero-carbon emission micro Energy Internet
2.1 Micro Energy Internet
Micro Energy Internet (MEI) is a system composed of
distributed energy sources, energy storage units, multi-
carrier energy sources, multi-carrier loads, and distribution
networks [20]. MEI can be operated independently or
connected to public energy networks. Urban and rural
community, hospital, industrial park, and school are rep-
resentatives of MEI. MEI aims at realizing an integrated
optimization and dispatch of multiple energy sources to
save costs and reduce emissions through the conversion
and storage among different energy carriers.
Except for MEI, a few solutions including micro gird
(MG), virtual power plant (VPP) have been proposed to
handle the energy supply issues. MG is a system consists of
at least one clean energy generation unit and energy storage
unit, mainly supplying personal power load demand in
specific geographical areas [21]. MG connected to the PDN
could operate in an isolated mode or a grid connection
mode [21]. VPP is a system composed of several dis-
tributed generation units, can usually be regarded as a
traditional power plant. VPP puts more emphasis on the
comprehensive generation and trading characters of the
whole virtual plant, and usually used in the electricity
market [22]. MG and VPP only focus on the power supply
without considering other energy forms such as thermal
energy considered in CHP. CHP can supply thermal and
power energy simultaneously, which could be viewed as a
generation unit in MEI. Besides, MEI could accommodate
the flow distribution of both power and other energy car-
riers. Undoubtedly, MG is the basis of the MEI, which puts
more emphasis on the coordinated management and oper-
ation of multiple energy carriers.
The architecture of a typical MEI is illustrated in Fig. 1
[20]. Several networks including power network, heat
network, cold network, and natural gas network are
connected with each other through energy conversion and
storage devices, i.e., energy hubs, such as CHP, CAES,
heat storage system, and refrigerator. The main focus of
this paper is the combined heat and power scheduling of a
MEI with PDN and DHN. It is worth mentioning that a
zero-carbon-emission NSF-CAES is used as the hub
between PDN and DHN in proposed ZCE-MEI, rather than
CHP which discharges carbon.
2.2 NSF-CAES hub
As mentioned above, NSF-CAES can be viewed as a
clean EH capable of co-generation of cool, heat and power.
The diagram of a common NSF-CAES hub with two-stage
compression and two-stage expansion is shown in Fig. 2.
The whole system is composed of air compression unit, air
storage tank, air turbine, and heat regeneration system.
During charging, the air compressor utilizes off-peak
electricity, curtailed wind power and solar power to drive
compressor to compress air to a high pressure one, and
store the high pressure air into air storage tank. Different
from CAES, the thermal energy along air compression is
stored in a heat regeneration system to improve operation
efficiency in NSF-CAES. When the electricity is needed,
high pressure air stored in air storage tank can be released
and preheated by the stored thermal energy to the turbine to
drive generator. Thus, the decoupling storage of thermal
energy and molecular potential energy is realized. Multi-
stage air compressor and multi-stage air turbine structure
are often employed in actual NSF-CAES hubs to improve
the whole energy storage and conversion efficiency
[10, 23]. For simplicity, a NSF-CAES hub with 2-stage
compressor and 2-stage turbine is considered in this
paper.
Power grid
Roof-mounted
PV
Wind power heating
Natural gas pipeline
Heat storage system
Absorption refrigeratorCAES
DC/AC
AC/DC
Load
Electricity networkHeat networkCold networkNatural gas network
Fig. 1 Framework of a micro Energy Internet
M
Driven-motor1-stage oil
cooling2-stage oil
cooling
1-stage water
cooling
2-stageheating
1-stage heating
2-stage water cooling
Oil pump
Oil pump
2-stage expansion
Splitter
Splitter
Mixer
Mixer
High-temperatureoil storage tank
Low-temperature
oil storage tank
Airstorage
tank
1-stage compression
2-stage compression
Generator
Cooling tower
Mixer Splitter
1-stage expansion
G
Fig. 2 Diagram of a typical NSF-CAES hub
568 Rui LI et al.
123

Motivated by [18], the interface of NSF-CAES with
PDN and DHN is shown in Fig. 3. Thermal energy stored
in regeneration system and generated by immersion heater
or heat pump plays the role of heating source for DHN.
From another aspect, wind power and off-peak electricity
act as the input of NSF-CAES hub, i.e., compressor is the
electrical interface of NSF-CAES with grid. Besides, NSF-
CAES hub can provide electricity power for the PDN, i.e.,
generator is the interface of NSF-CAES with grid.
2.3 NSF-CAES formulation
The following assumptions are made before modeling
NSF-CAES.
1) The air is considered as an ideal one, and meets ideal
gas equation.
2) Air storage tank adopts the isothermal model, i.e.,
temperature of stored air equals to that of ambient
[24].
3) Air storage tank employs the constant volume model,
i.e., volume of air storage tank keeps no change [24].
4) Compressor and turbine use the adiabatic model.
5) Heat loss of thermal energy storage tank is neglected.
6) Power consumption of circulating pump is neglected.
7) Pressure loss of high pressure air and water through
the heat exchanger is neglected.
2.3.1 Compressor
According to [10, 20, 23], power consumption of rth
stage compressor during charging satisfies:
pcj;r;t ¼1
gcj;r
jj� 1
Rgqmcj;ts
c;inj;r;t
prc;outj;r;t
prc;inj;r;t
!j�1j
�1
24
35 ð1Þ
where pcj;r;t is the power demand of rth stage compressor at
time t; gcj;r is the adiabatic efficiency of rth stage com-
pressor; j is the adiabatic exponent of air; Rg is the gas
constant; qmcj;t is the mass flow rate of air of compressor j at
time t; sc;inj;r;t is the inlet temperature of rth stage compressor
at time period t; prc;inj;r;t and pr
c;outj;r;t are the inlet and outlet air
pressure of rth stage compressor at time period t.
Equation (1) defines the bounds of consumed power of
each stage compressor.
ucj;tpc;lj;r � pcj;r;t � ucj;tp
c;uj;r ð2Þ
where ucj;t is the binary variable that is equal to 1 if com-
pressor is working; pc;lj;r and p
c;uj;r are the lower bound and
upper bound of power demand of rth stage compressor.
Total power demand of compressor is given by
Acj;t ¼
Xncr¼1
pcj;r;t ð3Þ
where nc is the number of compressor stage; Acj;t is the total
power consumption of compressor.
Air mass flow rate of each stage compressor should be
kept within the limits.
ucj;tqmc;lj � qmc
j;t � ucj;tqmc;uj ð4Þ
where qmc;lj and qm
c;uj are the lower and upper bound of
mass flow rate of air of compressor j.
The relationship between air temperature of inlet and
outlet rth stage compressor is given by [10, 20, 23]
sc;outj;r;t ¼ sc;inj;r;t
1
gcj;r
prc;outj;r;t
prc;inj;r;t
!j�1j
�1þ gcj;r
24
35 ð5Þ
where sc;outj;r;t is the outlet temperature of rth stage com-
pressor at time period t.
Air pressure in each stage compressor is constrained by
prc;inj;1;t ¼ pram ð6Þ
prc;in;lj;r � pr
c;inj;r;t � pr
c;in;uj;r ð7Þ
prc;out;lj;r � pr
c;outj;r;t � pr
c;out;uj;r ð8Þ
prc;inj;rþ1;t ¼ pr
c;outj;r;t 1� r� nc � 1 ð9Þ
prc;outj;nc;t
¼ prstj;t ð10Þ
prc;outj;r;t ¼ pr
c;inj;r;t 1þ ucj;t bj;r � 1
� �h ið11Þ
prc;inj;r;t � pr
c;outj;r;t � bj;rpr
c;inj;r;t ð12Þ
where prc;inj;1;t and pr
c;inj;r;t are the inlet air pressure of 1-stage
and rth stage compressor at time period t; pram is the
ambient pressure; prc;in;lj;r and pr
c;in;uj;r are lower and upper
bound of inlet air pressure of rth stage compressor; prc;outj;r;t
and prc;outj;nc;t
are the outlet air pressure of rth stage com-
pressor; prc;out;lj;r and pr
c;out;uj;r are the lower and upper bound
Return water
Supply water
Power NFS-CAES
Immersion heater
Power
Cold
Heat output
Heat output
Heat
Power
Fig. 3 Interface of NSF-CAES energy hub
Optimal dispatch of zero-carbon-emission micro Energy Internet… 569
123

of outlet air pressure of rth stage compressor; bj,r is the
compression ratio of rth stage compressor.
Equation (6) denotes the inlet air pressure of 1-stage
compressor. Equations (7) and (8) depict the bound of inlet
and outlet air pressure of rth stage compressor. The rela-
tionship between inlet air pressure of (r ? 1)th stage and
outlet air pressure of rth stage is given by (9). Equation (10)
describes the link between outlet air pressure of the last
stage and air pressure of air storage tank. Correlations of
inlet air pressure and outlet air pressure of rth stage com-
pressor are shown in (10) and (12).
2.3.2 Turbine
To some extent, the operation mechanism of turbine can
be regarded as an inverse process of compressor. Thus, the
formulations for turbine can be easily inferred from that of
compressor.
For NSF-CAES j, power generated by sth stage turbine
can be calculated by
pgj;s;t ¼ ggj;s
jj� 1
qmgj;tRgs
g;inj;s;t 1�
prg;inj;s;t
prg;outj;s;t
! jj�1
24
35 ð13Þ
where pgj;s;t is the power generation of sth stage turbine at
time t; ggj;s is the adiabatic efficiency of sth stage turbine;
qmgj;t is the mass flow rate of air of turbine j; sg;inj;s;t is the inlet
temperature of sth turbine; prg;inj;s;t and pr
g;outj;s;t are the inlet and
outlet air pressure of sth stage turbine.
Power generated by each stage of turbine should be keep
in the bounds.
ugj;tp
g;lj;s � p
gj;s;t � u
gj;tp
g;uj;s ð14Þ
where ugj;t is the binary variable that is equal to 1 if turbine
is working; pg;lj;s and p
g;uj;s are the lower bound and upper
bound of power generation of sth stage turbine.
Correspondingly, we have the total power generation:
Agj;t ¼
Xnes¼1
pgj;s;t ð15Þ
where ne is the number of turbine stage; Agj;t is the total
power generation of NSF-CAES turbine.
Air mass flow rate of each stage turbine should be kept
within the range:
ugj;tqm
g;lj � qm
gj;t � u
gj;tqm
g;uj ð16Þ
where qmg;lj and qm
g;uj are the lower and upper bound of
mass flow rate of air of turbine j.
Similar to (5), the connection between inlet and outlet
air temperature of sth stage turbine at each time period t can
be formulated as
sg;outj;s;t ¼ sg;inj;s;tggj;s
prg;outj;s;t
prg;inj;s;t
!j�1j
�1þ 1
ggj;s
24
35 ð17Þ
where sg;outj;s;t is the outlet temperature of sth stage turbine at
time period t.
Air pressure in each stage turbine is constrained by
prg;inj;1;t ¼ prstj;t ð18Þ
prg;in;lj;s � pr
g;inj;s;t � pr
g;in;uj;s ð19Þ
prg;out;lj;s � pr
g;outj;s;t � pr
g;out;uj;s ð20Þ
prg;inj;sþ1;t ¼ pr
g;outj;s;t 1� s� ne � 1 ð21Þ
prg;outj;ne;t
¼ pram ð22Þ
prg;outj;s;t ¼ pr
g;inj;s;t 1þ u
gj;t cj;s � 1� �h i
ð23Þ
1
cj;spr
g;inj;s;t � pr
g;outj;s;t � pr
t;inj;s;t ð24Þ
where prg;inj;1;t and pr
g;inj;s;t are inlet air pressure of 1-stage and
sth stage turbine at time period t; prst is the pressure of air
storage tank; prg;in;lj;s and pr
c;in;uj;s are lower and upper bound
of inlet air pressure of sth stage turbine; prg;outj;s;t and pr
g;outj;ne;t
are outlet air pressure of sth and ne stage turbine; prg;out;lj;s
and prg;out;uj;s are lower and upper bound of outlet air pres-
sure of sth stage turbine; cj,s is the expansion ratio of sth
stage turbine.
The meanings of (18)–(24) can be concluded according
to (6)–(12).
2.3.3 Air storage tank
Pressure of high pressure air in storage tank at time
period t ? 1 can be calculated by
prstj;tþ1 ¼ prstj;t þ1
VRgs
stt ucj;tqm
cj;t � u
gj;tqm
gj;t
� �ð25Þ
where prstj;t is the pressure of air storage tank at time period
t; V is the volume of air storage tank; sstt is the temperature
of air storage tank.
Equation (25) is a measure for the state of charge (SOC)
of NSF-CAES hub.
In the light of the operation requirements of NSF-CAES,
air pressure in the air storage tank should be kept in the
limits:
prlj � prstj;t � pruj ð26Þ
where prlj and pruj are the lower and upper bound of pres-
sure of air storage tank.
570 Rui LI et al.
123
2.3.4 Regenerative system
Based on the heat exchange theory, thermal energy col-
lected by cooler equipped after rth stage compressor at time
period t during charging can be depicted by [20, 23, 25]:
hgj;r;t ¼ caqm
cj;t sc;outj;r;t � sc;inj;rþ1;t
� �1� r� nc � 1 ð27Þ
hgj;nc;t
¼ caqmgj;nc;t
sc;outj;nc;t� sam
� �ð28Þ
where hgj;r;t and h
gj;nc;t
are the collected heat by rth stage
cooler; ca is the constant pressure specific heat of air.
Accordingly, the total thermal energy collected during
charging is the sum of that of each cooler, i.e.,
Hgj;t ¼
Xncr¼1
hgj;r;t ð29Þ
Similarly, thermal energy consumed by heater equipped
before sth stage turbine during discharging can be
calculated by
hcj;1;t ¼ caqmgj;t sg;inj;1;t � samst
� �ð30Þ
hcj;s;t ¼ caqmgj;t sg;inj;s;t � sg;outj�1;s;t
� �1\s� ne ð31Þ
where hcj;1;t and hcj;s;t are the consumed heat by the first and
sth stage heater.
Also, we have the total consumed thermal energy given
by
Hcj;t ¼
Xnes¼1
hcj;s;t ð32Þ
The SOC of thermal energy storage system of NSF-
CAES can be illustrated as
Hstj;t ¼ Hst
j;t�1 þ ucj;tHgj;t � u
gj;tH
cj;t � hdj;t ð33Þ
Hst;lj �Hst
j;t �Hst;uj ð34Þ
where Hstj;t is the heat of heat regeneration system at time
period t; Hst;lj and H
st;uj are the lower and upper bound of
heat can be stored in the heat regeneration system.
Noting that, heat power recycled by the heat exchanger
with water as cooling medium as in Fig. 2, i.e., 1-stage
water cooling and 2-stage water cooling, is ignored in this
part. The modeling process is similar to that of heat
exchanger with conduction oil.
3 Operation of zero-carbon-emission microEnergy Internet
It is worth mentioning that wind power is considered as
a class of scheduled generation source, i.e., allowing cur-
tailment during the operation of ZCE-MEI in this paper.
The errors between day-ahead forecasting and the real-time
situation are neglected. Besides, wind power is regarded as
free so that it will be consumed as much as possible [26].
3.1 Objective function
It is assumed that NSF-CAES hub and heat pump are the
heat sources of DHN in the proposed ZCE-MEI, while heat
pump is the main heat source. In this regard, we assume
that heat pump buy electricity directly from power grid not
some buses in the PDN. Thus, NSF-CAES hub is the only
coupling point between DHN and PDN in the proposed
ZCE-MEI. We consider the objective of reducing
scheduling cost of ZCE-MEI over the whole dispatch
periods:
minXt2T
bt ht þXnhpj¼1
dhpj;t
!ð35Þ
where bt and ht are the electricity price and power bought
from grid at time period t; dhpj;t is the power demand of heat
pump in DHN; nhp is the number of equipped heat
pump.
The first term in (35) is the cost of electricity bought
from gird for PDN while the second term is the electricity
cost for heat pump in DHN. Objective function (35) is
subjected to the following constraints.
3.2 Constraints
1) Heat pump and circulating water pump
Similar to (27) and (28), total thermal energy supplied
by the NSF-CAES hub and heat pump equipped at node i
can be calculated by:
hhpi;t þ h
gi;t ¼ cwm
gi;t sSi;t � sRi;t
� �ð36Þ
where hhpi;t and h
gi;t are the heat generated by NSF-CAES hub
and heat pump at time period t; cw is the constant pressure
specific heat of recycle water; mgi;t is the mass flow rate of
recycle water at node i; sSi;t and sRi;t are the temperature of
supply water system and return water system at node i.
Temperature of the water at each heat pump should be
kept in the range:
sS;li � sSi;t � sS;ui ð37Þ
where sS;li and sS;ui are the lower and upper bound of tem-
perature of supply water at node i.
Power consumed by circulating water pump equipped at
node i satisfies [18]:
dcpi;t ¼ m
gi;t
prSi;t � prRi;t
gcpi qð38Þ
Optimal dispatch of zero-carbon-emission micro Energy Internet… 571
123

where prSi;t and prRi;t are pressure of supply water and return
water of node i at time period t; dcpi;t is the power demand of
circulating water pump at node i; q is the density of recycle
water; gcpi is the efficiency of circulating water pump.
The power consumption of heat pump and circulating
water should be limited by:
dhp;li � d
hpi;t � d
hp;ui ; dcp;li � d
cpi;t � d
cp;ui ð39Þ
where dhp;li ; dcp;li and d
hp;ui ; dcp;ui are the lower and upper
bound of power consumption of heat pump and circulating
water pump equipped at node i.
2) Heat load
Heat load at node i of DHN in ZCE-MEI can be cal-
culated by [8, 25]:
hdi;t ¼ cwmdi;t sSi;t � sRi;t
� �ð40Þ
where mdi;t is the mass flow rate of recycle water of head
load at node i at time period t; hdi;t is heat load demand.
There exist a minimum supply pressure and return
pressure for circulating water pump in each NSF-CAES
connected to node i, i.e.,
prSi;t � prRi;t � prli ð41Þ
Accordingly, temperature of return water at heat load i is
constrained by:
sR;li � sRi;t � sR;ui ð42Þ
where sR;li and sR;ui are the lower and upper bound of
temperature of return water.
3) Heat network
According to the continuity of flow [6, 8, 25], for each
node i 2 H(N), the following equations are satisfied:Xb2FðiÞ
mSb;t þ md
i;t ¼ mgi;t þ
Xb2TðiÞ
mSb;t; 8i; t ð43Þ
Xb2FðiÞ
mRb;t þ m
gi;t ¼ md
i;t þXb2TðiÞ
mRb;t; 8i; t ð44Þ
where F(i) and T(i) are the set of pipes with node i as
‘from’ or ‘to’ node; mSb;t and mR
b;t are the mass flow rate of
recycle water of supply and return water system of pipe b at
time t; mgi;t and md
i;t are the mass flow rate of recycle water
of heat generation unit and heat load at node i.
The relationship between temperature of node i 2 H(N)
and temperature of pipe b 2 H(P) can be depicted as:Xb2TðiÞ
sS;outb;t mSb;t
� �¼ sSi;t
Xb2TðiÞ
mSb;t ð45Þ
Xb2FðiÞ
sR;outb;t mRb;t
� �¼ sRi;t
Xb2FðiÞ
mRb;t ð46Þ
where sS;outb;t and sR;outb;t are outlet temperature of pipe b of
supply system and return system at time t.
The relationship between node temperature and tem-
perature of pipe is illustrated as:
sS;inb;t ¼ sSi;tsR;inb;t ¼ sRi;t
(ð47Þ
where sS;inb;t and sR;inb;t are inlet temperature of pipe b of
supply system and return system at time t.
Mass flow of each pipe b of supply network and return
network should be limited according the physical character
of pipe, i.e.,
0�mSb;t �mu
b
0�mRb;t �mu
b
�ð48Þ
where mub is the upper bound of mass flow rate of recycle
water through pipe b.
The pressure between inlet and outlet of pipe b can be
illustrated as [18, 25]:
prSi;t � prSj;t ¼ lb mSb;t
� �2ð49Þ
prRj;t � prRi;t ¼ lb mRb;t
� �2ð50Þ
where lb is the pressure loss coefficient of pipe.
The temperature drops exponentially during recycle
water flow in pipes [18]. The outlet temperature of pipe b is
an exponential function of inlet temperature of pipe b.
sS;outb;t ¼ sS;inb;t � samt
� �e� kbLb
cwmSb;t þ samt ð51Þ
sR;outb;t ¼ sR;inb;t � samt
� �e� kbLb
cwmRb;t þ samt ð52Þ
where kb is temperature loss coefficient of pipe; Lb is the
length of pipe b; samt is the ambient temperature at time
period t.
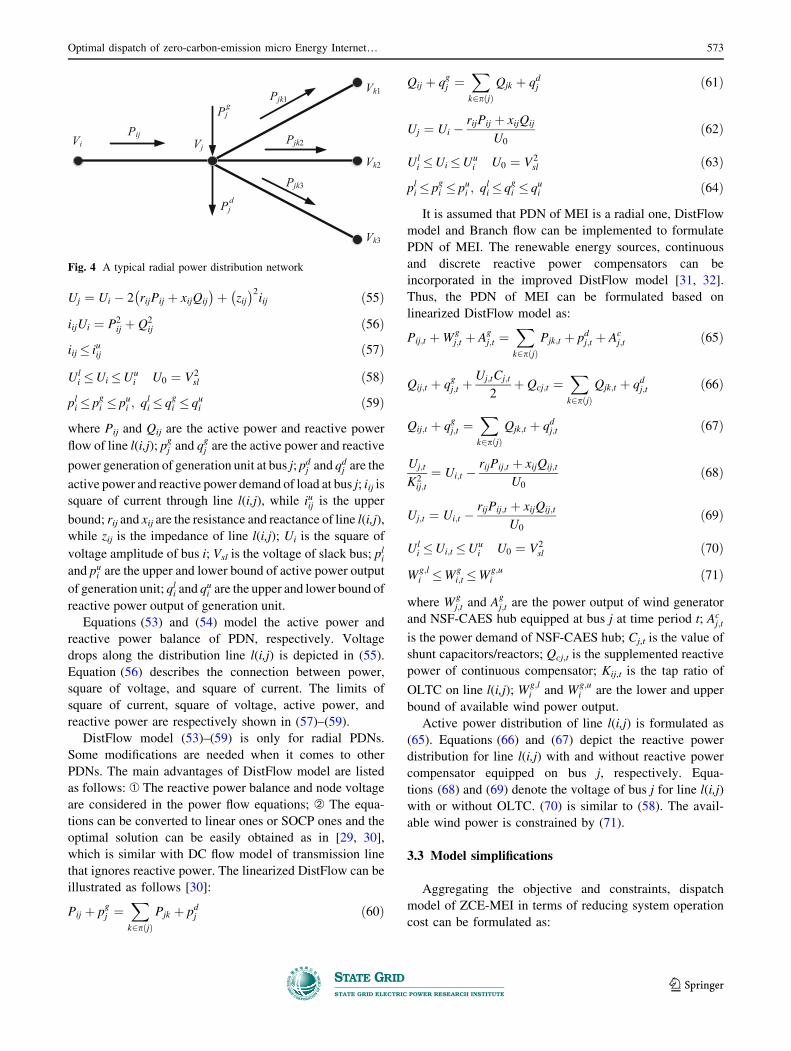
4) Power distribution network
Different from the power transmission network, PDN
usually has a radial topology as shown in Fig. 4.
The power flow in such a radial PDN can be described
by DistFlow model or Branch flow as in [27–29] and can
be illustrated as:
Pij þ pgj � rijiij ¼
Xk2pðjÞ
Pjk þ pdj ð53Þ
Qij þ qgj � xijiij ¼
Xk2pðjÞ
Qjk þ qdj ð54Þ
572 Rui LI et al.
123
Uj ¼ Ui � 2 rijPij þ xijQij
� �þ zij� �2
iij ð55Þ
iijUi ¼ P2ij þ Q2
ij ð56Þ
iij � iuij ð57Þ
Uli �Ui �Uu
i U0 ¼ V2sl ð58Þ
pli � pgi � pui ; q
li � q
gi � qui ð59Þ
where Pij and Qij are the active power and reactive power
flow of line l(i,j); pgj and q
gj are the active power and reactive
power generation of generation unit at bus j; pdj and qdj are the
active power and reactive power demand of load at bus j; iij is
square of current through line l(i,j), while iuij is the upper
bound; rij and xij are the resistance and reactance of line l(i,j),
while zij is the impedance of line l(i,j); Ui is the square of
voltage amplitude of bus i; Vsl is the voltage of slack bus; pli
and pui are the upper and lower bound of active power output
of generation unit; qli and qui are the upper and lower bound of
reactive power output of generation unit.
Equations (53) and (54) model the active power and
reactive power balance of PDN, respectively. Voltage
drops along the distribution line l(i,j) is depicted in (55).
Equation (56) describes the connection between power,
square of voltage, and square of current. The limits of
square of current, square of voltage, active power, and
reactive power are respectively shown in (57)–(59).
DistFlow model (53)–(59) is only for radial PDNs.
Some modifications are needed when it comes to other
PDNs. The main advantages of DistFlow model are listed
as follows: � The reactive power balance and node voltage
are considered in the power flow equations; ` The equa-
tions can be converted to linear ones or SOCP ones and the
optimal solution can be easily obtained as in [29, 30],
which is similar with DC flow model of transmission line
that ignores reactive power. The linearized DistFlow can be
illustrated as follows [30]:
Pij þ pgj ¼
Xk2pðjÞ
Pjk þ pdj ð60Þ
Qij þ qgj ¼
Xk2pðjÞ
Qjk þ qdj ð61Þ
Uj ¼ Ui �rijPij þ xijQij
U0
ð62Þ
Uli �Ui �Uu
i U0 ¼ V2sl ð63Þ
pli � pgi � pui ; q
li � q
gi � qui ð64Þ
It is assumed that PDN of MEI is a radial one, DistFlow
model and Branch flow can be implemented to formulate
PDN of MEI. The renewable energy sources, continuous
and discrete reactive power compensators can be
incorporated in the improved DistFlow model [31, 32].
Thus, the PDN of MEI can be formulated based on
linearized DistFlow model as:
Pij;t þWgj;t þ A
gj;t ¼
Xk2pðjÞ
Pjk;t þ pdj;t þ Acj;t ð65Þ
Qij;t þ qgj;t þ
Uj;tCj;t
2þ Qcj;t ¼
Xk2pðjÞ
Qjk;t þ qdj;t ð66Þ
Qij;t þ qgj;t ¼
Xk2pðjÞ
Qjk;t þ qdj;t ð67Þ
Uj;t
K2ij;t
¼ Ui;t �rijPij;t þ xijQij;t
U0
ð68Þ
Uj;t ¼ Ui;t �rijPij;t þ xijQij;t
U0
ð69Þ
Uli �Ui;t �Uu
i U0 ¼ V2sl ð70Þ
Wg;li �W
gi;t �W
g;ui ð71Þ
where Wgj;t and A
gj;t are the power output of wind generator
and NSF-CAES hub equipped at bus j at time period t; Acj;t
is the power demand of NSF-CAES hub; Cj,t is the value of
shunt capacitors/reactors; Qcj,t is the supplemented reactive
power of continuous compensator; Kij,t is the tap ratio of
OLTC on line l(i,j); Wg;li and W
g;ui are the lower and upper
bound of available wind power output.
Active power distribution of line l(i,j) is formulated as
(65). Equations (66) and (67) depict the reactive power
distribution for line l(i,j) with and without reactive power
compensator equipped on bus j, respectively. Equa-
tions (68) and (69) denote the voltage of bus j for line l(i,j)
with or without OLTC. (70) is similar to (58). The avail-
able wind power is constrained by (71).
3.3 Model simplifications
Aggregating the objective and constraints, dispatch
model of ZCE-MEI in terms of reducing system operation
cost can be formulated as:
Vk3
Vk2
Vk1
Pjd
Pjg
Vj
PijVi
Pjk3
Pjk2
Pjk1
Fig. 4 A typical radial power distribution network
Optimal dispatch of zero-carbon-emission micro Energy Internet… 573
123

min ð35Þs:t: ð1Þ�ð34Þ; ð36Þ�ð52Þ; ð65Þ�ð71Þ ð72Þ
Dispatch model (72) is actually a large scale mixed
integer nonlinear programming (MINLP) problem, which
is hard to be effectively solved. In this section, each part of
this model, including NSF-CAES hub, PDN, and DHN are
linearized to yield a mixed integer linear programming
(MILP) which can be easily solved by CPLEX.
1) Linearization of NSF-CAES hub
Air pressure pr, temperature s, and mass flow rate qm
are the adjustable variables of a NSF-CAES hub. It is
difficult to adjusting them simultaneously owing to the
complexity of hydraulic–thermal dynamics. Fortunately, a
practical NSF-CAES hub often operates at a constant
pressure and constant temperature (CP–CT) mode [10, 23].
Thus, (1) and (13) reduces to
pcj;r;t ¼1
gcj;r
jj� 1
qmcj;tRgs
c;inj;r;t b
j�1jj;r � 1
� �ð73Þ
pgj;s;t ¼ gtj;s
jj� 1
qmgj;tRgs
g;inj;s;t 1� cgj;s
�j�1j
� �ð74Þ
respectively.
Similarly, (5) and (17) reduce to
sc;outj;r;t ¼ sc;inj;r;t
1
gcj;rb
j�1jj;r � 1þ gcj;r
� �ð75Þ
st;outj;s;t ¼ sg;inj;s;tggj;s cgj;s
jj�1 � 1þ 1
ggj;s
!ð76Þ
respectively.
Besides, under CP–CT operation mode, (6)–(12) and
(18)–(24) are eliminated.
2) Linearization of PDN
As for PDN, (66) and (68) are nonlinear equations. The
term Uj,tCj,t in (66) is a nonlinear one, to linearize this term,
the discrete variable C can be formulated as [31–33],
Cj ¼ Clj þ sj 2
0gj;0 þ 21gj;1 þ � � � þ 2vjgj;v j� �
ð77Þ
0� 20gj;0 þ 21gj;1 þ � � � þ 2vjgj;v j �Cuj � Cl
j
sj8j 2 EðNÞ \ ED
ð78Þ
where gj;0; gj;1; . . .; gj;v j are binary variables; ED is set of
buses for shunt capacitors/reactors; sj is the step size of
shunt capacitors/reactors; Clj and Cu
j are the lower and
upper bound of shunt capacitors/reactors; vj is a integer
which can be decided by:
log2Cuj � Cl
j
sjþ 1
!� 1� vj � log2
Cuj � Cl
j
sjþ 1
!
ð79Þ
Thus, the term Uj,tCj,t in (66) is transformed to
Uj;tCj;t ¼ CljUj;t þ sj 2
0gj;0Uj;t þ � � � þ 2vjgj;v jUj;t
� �ð80Þ
Usually, (80) can be linearized by utilizing big M
method, i.e.,
Uj;tCj;t ¼ CljUj;t þ sj 2
0dj;0 þ � � � þ 2vjdj;v j� �
ð81Þ
Uj;t �M 1� gj;k;t� �
� dj;k;t �Uj;t þM 1� gj;k;t� �
ð82Þ
�Mgj;k;t � dj;k;t �Mgj;k;t ð83Þ
where dj;0; dj;1; . . .; dj;v j are binary variables; M is a big
number.
As for the OLTC branch l(i,j), the term of left side of
(68) can be expanded as:
Uj;t
K2ij;t
¼ Uj;tbij;1;t
K2ij;1
þ bij;2;t
K2ij;2
þ � � � þbij;nij;t
K2ij;nij
!ð84Þ
where Kij,1, Kij,2,…,Kij;nijare the available value of tap of
OLTC; nij is the number of available OLTC tap value. In
this regard, (68) can be linearized as [31–33]:
Uj;t
K2ij;t
¼Xnijk¼1
hj;k;t
K2ij;k
ð85Þ
�M 1� bij;k;t� �
þ Uj;t � hj;k;t �M 1� bij;k;t� �
þ Uj;t ð86Þ
�Mbij;k;t � hj;k;t �Mbij;k;t ð87Þ
where hj,k,t are dummy variable; bij,1,t and bij;nij;t are binary
variables, withPnijk¼1
bj;k;t ¼ 1:
3) Linearization of DHN
As for DHN, there exists four different operating
strategies, including constant flow and constant supply
temperature (CF–CT), constant flow and variable supply
temperature (CF–VT), variable flow and constant supply
temperature (VF–CT), variable flow and variable supply
temperature (VF–VT) [25, 34]. Under the VF–VT and VF–
CT modes, the temperature dynamics (49) and (50) are
nonlinear, which made the dispatch problem difficult to be
solved. Fortunately, in an actual DHN, CF–VT has more
flexibility than CF–CT, and CF–VT yields a linear DHN
model.
For simplicity, the widely used CF–VT mode is imple-
mented in this paper, thus, (43), (44), (49) and (50) are
unnecessary.
574 Rui LI et al.
123

Through above transformations and simplifications, the
original MINLP (72) is reduced to a MILP problem, which
can be effectively solved by commercial solvers.
4 Case study
4.1 System settings
The configuration of the test ZCE-MEI is shown in
Fig. 5. The designed ZCE-MEI is composed of a 33-bus
PDN, an 8-node DHN, a NSF-CAES hub, 4 wind genera-
tors, 1 heat pump, and several reactive power compensators
both discrete and continuous including OLTC, SVG, shunt
capacitor and reactor. A 3 MW wind generator is equipped
with NSF-CAES hub at Bus 2, the other three 0.5 MW
wind generators are employed at Bus 7, 19, 26 respectively.
This configuration is valued in [35]. Heat pump is equipped
at node N1. It is worth mentioning that heat pump buy
electricity directly from power grid not some buses in the
PDN. Thus, NSF-CAES hub is the only coupling point
between DHN and PDN in this test system.
Time-of-use power price is shown in Fig. 6. The power
demand, heat demand, and available wind power of the
ZCE-MEI are shown in Fig. 7. Power ratio of each bus in
ZCE-MEI can be generated by each load divide system
load of the standard matpower data. Heat load ratio, and
mass flow rate of each node are shown in Table 1.
To maintain voltage quality of PDN in the designed
ZCE-MEI, several kinds of reactive power compensator are
equipped at key buses of PDN. Several OLTCs with a
minimum tap changer 0.95, maximum tap changer 1.05,
and tap step 0.01 are equipped on Line #1, #18, #22, #25
78
910 11
1 2 3 4 5 6
12
13 14 15 16 17
85 7
16
6
9
17
31 2
11
4
10
13 14
12
15 18
11111 11 123 24 25
23 24
2511111 11 127 28 29 30
27 28 2926
1131 32
30 31
11111 11 119 20 21 22
19 20 21
22
18
33
32
W4
W3
W2CAES
hub
W1
N1
N2N3 N4
N7
N8N6N5
26
Fig. 5 Configuration of ZCE-MEI
0 5 10 15 20 25
0.05
0.10
0.15
Time (hour)
Pric
e ($
/(kW
h ))
Fig. 6 Time-of-use power price
0 5 10 15 20 250.5
1.0
1.5
2.0
2.5
3.0
3.5
4.0
4.5
5.0
5.5
Time (hour)
Pow
er (
MW
/ Mva
r)
Pd; Qd; W g; Hd
Fig. 7 Power load and available wind power
Optimal dispatch of zero-carbon-emission micro Energy Internet… 575
123

respectively. Meanwhile, shunt capacitors/reactors with a
minimum value 0 and maximum value 0.2, and step 0.05
are located on Bus #5, #10, #13, #17, #20, #23, #30
respectively. Besides, SVG are equipped on Bus #4, #9,
#14 to provide continuous reactive power.
4.2 Simulation of NSF-CAES
In this section, operation of a 1 MW NSF-CAES hub is
simulated to verify the effectiveness of the proposed for-
mulation. The rated parameters of each stage compressor
and turbine are depicted in Table 2 and Table 3, respec-
tively. Besides, the rated mass flow rate of each compressor
and turbine are 0.64, 2.46 kg/s, respectively. The volume
of air storage tank of the designed NSF-CAES is
2000 m3.
The round trip energy flow of the designed 1 MW NSF-
CAES hub is illustrated in Fig. 8. The electricity efficiency
ge = 1.46/2.8 = 52.14%, the round trip energy efficiency
gCAES = (1.46 ? 0.4193)/1.3867 = 67.12%. These effi
ciencies are acceptable for commercial applications to
realize return of investment at commercial scale.
4.3 Simulation results
All simulations are implemented on a laptop with Intel
i5-4210M CPU and 16 GB RAM. The operation of NSF-
Table 1 Heat load parameters of the test ZCE-MEI
Node no. Heat load ratio Mass flow rate
(kg/s)
1 0 10
2 0 0
3 0 0
4 0 0
5 0.2 2
6 0.2 2
7 0.2 2
8 0.4 4
Table 2 Rated parameters of compressor
Compressor prin
(MPa)
prout
(MPa)
sin
(�C)sout
(�C)P (kW) g
1-stage 0.1 1.15 15 375 250 0.85
2-stage 1.15 9 40 366 250 0.81
Table 3 Rated parameters of turbine
Turbine prin
(MPa)
prout
(MPa)
sin
(�C)sout
(�C)P (kW) g
1-stage 8.4 0.94 280 60 500 0.82
2-stage 0.94 1 280 60 500 0.82
NSF-CAESenergy hub
Electricity2.8×103 kWh
Charging
Electricity1.46×103 kWh
Heat power0.4193×103 kWh
Energy loss0.4207×103 kWh
Discharging
Fig. 8 Energy flow of designed 1 MW NSF-CAES
0 5 10 15 20 25-2
-1
0
1P
g(M
W)
Time (hour)
8.4
8.6
8.8
9.0
P r(M
Pa)
Charge/discharge power ; State of charge
Fig. 9 SOC of NSF-CAES hub
0 5 10 15 20 25-2
-1
0
1
Hg (M
W)
Time (hour)
0
1
2
3H
str ( M
Wh)
Charge/discharge power; State of charge
Fig. 10 SOC of TES of NSF-CAES hub
576 Rui LI et al.
123

CAES hub, system operation cost and wind curtailment are
analyzed consequently in the following subsections.
1) Operation of NSF-CAES hub
The SOC of NSF-CAES and that of TES of NSF-CAES
hub are shown in Fig. 9 and Fig. 10, respectively. Fig-
ure 11 illustrates the heat power output of heat pump and
NSF-CAES hub.
We can learn from above two figures that NSF-CAES
utilizes free wind power and cheap electricity at off-peak
periods, such as from t = 1 to t = 6, to charge the air into
air storage tank to store the energy in two forms, i.e.,
thermal energy in TES and molecular potential energy in
air storage tank. The molecular potential energy can be
used to drive turbine to generate electricity during on-peak
periods, such as from t = 13 to t = 14, under the condition
of consuming certain thermal energy stored in TES.
Although most heat load are supplied by heat pump in the
DHN, some of the thermal energy stored in TES during
energy charging process can be directly used to supply heat
power for heat load to save cost, such as at time periods
t = 10, t = 16. Similar conclusions can be drawn by
analyzing Fig. 9, Fig. 10, and Fig. 11 simultaneously.
2) Operation cost and wind curtailment
Power output of wind generator, power bought from
grid, and wind curtailment of wind generator #1 under the
designed ZCE-MEI and separate operation modes are
comparatively studied in Fig. 12 and Fig. 13.
Comparing Fig. 12 and Fig. 13, we draw the conclusion
that by utilizing NSF-CAES hub in MEI, curtailed wind
power during off-peak time can be reduced by storing the
available free wind power in NSF-CAES and using the
stored energy to supply power demand during on-peak
periods. Thus, the power brought from grid can also be
reduced in the proposed MEI, also the system operation
cost. Through co-optimize PDN and DHN in the proposed
ZCE-MEI, wind power curtailment of the whole system is
reduced from 5.2347 to 2.0452 MWh as shown in the red
shadow in Fig. 12 and Fig. 13. System operation cost of
MEI and separate operation of PDN and DHN is compared
in Table 4. By co-optimize PDN and DHN through NSF-
CAES hub, the operation cost of the whole system is
reduced 3.32% compared with optimize DHN and PDN
separately.
Table 4 Operation costs under different operation modes
Mode PDN (9103$) DHN (9103$) SUM (9103$)
MEI 3.1950 3.1208 6.3163
Single 3.3601 3.1729 6.5330
0 5 10 15 20 25
0.2
0.4
0.6
0.8
1.0
1.2
1.4
1.6
1.8
Time (hour)
Hea
t (M
W)
H hp; H d; H g
0
-0.2
Fig. 11 Heat output of heat pump and NSF-CAES
W2 ;Time (hour)
Pow
er (M
W)
0 5 10 15 20 25-0.5
0
0.5
1.0
1.5
2.0
2.5
3.0
3.5
W2; g Ac; W curg,u;
Fig. 12 Power balance of ZCE-MEI
Time (hour)0 5 10 15 20 25
Pow
er (M
W)
-0.5
0
0.5
1.0
1.5
2.0
2.5
3.0
3.5
W2 ;W2; g Ac; W curg,u;
Fig. 13 Power balance of separate operation mode
Optimal dispatch of zero-carbon-emission micro Energy Internet… 577
123

Besides, we can also learn from the two figures that,
during period from t = 8 to t = 22, all the available wind
power has been utilized to supply the power load demand.
3) Optimal power flow
Optimal temperature distribution of DHN of the
designed ZCE-MEI at the on-peak heat load period (t = 5)
and off-peak heat load period (t = 15) are shown in
Fig. 14.
It is shown in Fig. 14 that the different heat load at on-
peak period (t = 15) and off-peak period (t = 5) can be
supplied by adjusting the return water temperature. Under
the condition of the same supply water temperature, the
smaller the return water is, the larger the heat power can be
supplied. Besides, the temperature of outlet of supply and
return water system usually lower than that of inlet of
supply and return water system which is similar to the
common sense.
Optimal power flow of PDN at on-peak time period
(t = 11) and off-peak time period (t = 5) are depicted in
Fig. 15. Voltage of each bus during off-peak power load
and on-peak power load and corresponding states of
OLTCs are shown in Fig. 16 and Fig. 17.
We can learn from above figures that node voltage and
reactive power balance are maintained and supplied in the
required limits by adjusting the OLTC and shunt capaci-
tors/reactors at on-peak and off-peak time periods.
5 Conclusion
This paper proposes a zero-carbon-emission micro
Energy Internet architecture to utilize power and heat in an
integrated manner. NSF-CAES hub is a clean energy hub
accommodating DHN and PDN. A detailed NSF-CAES
1 2 3 4 5 6 755
60
65
70
75
80
85
90
95
100
Pipe No.
Tem
pera
ture
(°C
)
S,in; S,out; S,in; S,out
R,in; R,out; R,in; R,out5 5 15 15
5 5 15 15
Fig. 14 Pipe temperature at on-peak and off-peak time
0 5 10 15 20 25 30 35-2
-1
0
1
2
3
4
Line No.
Pow
er fl
ow (
MW
/Mva
r)
P11
Q11
P5
Q5
Fig. 15 Optimal power flow at on-peak and off-peak time
0 5 10 15 20 25 30 350.95
0.96
0.97
0.98
0.99
1.00
1.01
1.02
1.03
1.04
1.05
Bus No.
Vol
tage
am
pliti
tude
U11
U5
Fig. 16 Bus voltage at on-peak and off-peak time
1.0 1.5 2.0 2.5 3.0 3.5 4.00.94
0.96
0.98
1.00
1.02
1.04
1.06
OLTC No.
OLT
C ra
sio
K
K11K5
Fig. 17 Rasio of OLTC at on-peak and off-peak time
578 Rui LI et al.
123

dispatch model is constructed to consider the pressure
behaviors and temperature dynamics. To maintain the
voltage quality of PDN in the proposed ZCE-MEI, an
improved linearized DistFlow model is utilized to take
OLTC and capacitor and reactor shunt compensator into
account. Optimal operation of the ZCE-MEI is realized in
terms of reducing operation cost. A typical 1 MW NSF-
CAES hub is designed to show the effectiveness of the
proposed NSF-CAES formulation. Simulation results ver-
ified the advantages of the proposed ZCE-MEI in reducing
operation cost and wind curtailment.
Noting that, we assume there is no uncertainty in the
system parameter, thus the method cannot adapt to situa-
tions with parameter uncertainties which is more common
in actual system. Our further work will focus on the opti-
mal dispatch of MEI with uncertainty, the robust opti-
mization and stochastic optimization methods would be
adopted to handle this kind of problem.
Acknowledgment This work was supported in part by the National
Natural Science Foundation of China (No. 51321005, No. 51377092,
No. 51577163), and Opening Foundation of the Qinghai Province
Key Laboratory of Photovoltaic Power Generation and Grid-con-
nected Technology.
Open Access This article is distributed under the terms of the
Creative Commons Attribution 4.0 International License (http://
creativecommons.org/licenses/by/4.0/), which permits unrestricted
use, distribution, and reproduction in any medium, provided you give
appropriate credit to the original author(s) and the source, provide a
link to the Creative Commons license, and indicate if changes were
made.
References
[1] Brunekreeft G, Buchmann M, Danekas C et al (2015) Regula-
tory pathways for smart grid development in China. Springer
Fachmedien Wiesbaden, Wiesbaden, pp 119–138
[2] Global wind report: annual market update 2015 (2016). Global
Wind Energy Council (GWEC), Brussels
[3] Geidl M, Andersson G (2007) Optimal power flow of multiple
energy carriers. IEEE Trans Power Syst 22(1):145–155
[4] Shabanpour-Haghighi A, Seifi AR (2015) Energy flow opti-
mization in multicarrier systems. IEEE Trans Ind Inform
11(5):1067–1077
[5] Li JH, Fang JK, Zeng Q et al (2016) Optimal operation of the
integrated electrical and heating systems to accommodate the
intermittent renewable sources. Appl Energy 167:244–254
[6] Li ZG, Wu WC, Shahidehpour M et al (2016) Combined heat
and power dispatch considering pipeline energy storage of dis-
trict heating network. IEEE Trans Sustain Energy 7(1):12–22
[7] Li ZG, Wu WC, Wang JH et al (2016) Transmission-constrained
unit commitment considering combined electricity and district
heating networks. IEEE Trans Sustain Energy 7(2):480–492
[8] Liu XZ, Wu JZ, Jenkins N et al (2016) Combined analysis of
electricity and heat networks. Appl Energy 15:1238–1250
[9] Jakiel C, Zunft S, Nowi A (2007) Adiabatic compressed air
energy storage plants for efficient peak load power supply from
wind energy: the European project AA-CAES. Int J Energy
Technol Policy 5(3):296–306
[10] Mei SW, Wang JJ, Tian F et al (2015) Design and engineering
implementation of non-supplementary fired compressed air
energy storage system: TICC-500. Sci China Technol Sci
58(4):600–611
[11] Xue XD, Mei SW, Lin QY et al (2016) Energy Internet oriented
non-supplementary fired compressed air energy storage and
prospective of application. Power Syst Technol 40(1):164–171
[12] Daneshi H, Srivastava AK, Daneshi A (2010) Generation
scheduling with integration of wind power and compressed air
energy storage. In: Proceedings of the 2010 IEEE PES trans-
mission and distribution conference and exposition, New
Orleans, LA, USA, 19–22 April 2010, 6 pp
[13] Liu B, Chen LJ, Zhang Y et al (2014) Modeling and analysis of
unit commitment considering RCAES system. In: Proceedings
of the 33rd Chinese control conference (CCC’14), Nanjing,
China, 28–30 July 2014, pp. 7478–7482
[14] Abbaspour M, Satkin M, Mohammadi-Ivatloo B et al (2013)
Optimal operation scheduling of wind power integrated with
compressed air energy storage (CAES). Renew Energy 51:53–59
[15] Fang C, Chen LJ, Zhang Y et al (2014) Operation of low-car-
bon-emission microgrid considering wind power generation and
compressed air energy storage. In: Proceedings of the 33rd
Chinese control conference (CCC’14), Nanjing, China, 28–30
July 2014, pp. 7472–7477
[16] Wang C, Chen LJ, Liu F et al (2014) Thermal–wind-storage
joint operation of power system considering pumped storage and
distributed compressed air energy storage. In: Proceedings of the
2014 power systems computation conference (PSCC’14), Wro-
claw, Poland, 8–22 August 2014, 7 pp
[17] Lund H, Salgi G, Elmegaard B et al (2009) Optimal operation
strategies of compressed air energy storage (CAES) on elec-
tricity spot markets with fluctuating prices. Appl Therm Eng
29(5/6):799–806
[18] Awad B, Chaudry M, Wu JZ et al (2009) Integrated optimal
power flow for electric power and heat in a microgrid. In: Pro-
ceedings of the 20th international conference and exhibition on
electricity distribution (CIRED ‘09), Part 2, Prague, Czech, 8–11
June 2009, 1 pp
[19] Wu QH, Zheng JH, Jing ZX (2015) Coordinated scheduling of
energy resources for distributed DHCs in an integrated energy
grid. CSEE J Power Energy Syst 1(1):95–103
[20] Hwang T, Choi M, Kang S et al (2012) Design of application-
level reference models for micro energy grid in IT perspective.
In: Proceedings of the 8th international conference on comput-
ing and networking technology (ICCNT’12), Gyeongju,
Republic of Korea, 27–29 August 2012, pp. 180–183
[21] Xue XD, Liu BH, Wang YC et al (2016) Micro energy network
design for community based on compressed air energy storage.
Proc CSEE 36(12):1–7
[22] Katiraei F, Iravani MR, Lehn PW (2005) Micro-grid autono-
mous operation during and subsequent to islanding process.
IEEE Trans Power Deliv 20(1):248–257
[23] Dielmann K, van der Velden A (2003) Virtual power plants
(VPP): a new perspective for energy generation? In: Modern
techniques and technologies: proceedings of the 9th interna-
tional scientific and practical conference of students, post-
graduates and young scientists (MTT’03), Tomsk, Russia, 7–11
April 2003, pp. 18–20
[24] Wang SX, Zhang XL, Yang LW et al (2016) Experimental study
of compressed air energy storage system with thermal energy
storage. Energy 103:182–191
[25] Budt M, Wolf D, Span R et al (2016) A review on compressed
air energy storage: basic principles, past milestones and recent
developments. Appl Energy 15:250–268
Optimal dispatch of zero-carbon-emission micro Energy Internet… 579
123

[26] Zhao H (1995) Analysis, modelling and operational optimization
of district heating systems. PhD Thesis, Technical University of
Denmark, Copenhagen
[27] Ji Z, Kang CQ, Chen QX et al (2013) Low-carbon power system
dispatch incorporating carbon capture power plants. IEEE Trans
Power Syst 28(4):4615–4623
[28] Baran ME, Wu FF (1989) Network reconfiguration in distribu-
tion systems for loss reduction and load balancing. IEEE Trans
Power Deliv 4(2):1401–1407
[29] Farivar M, Low SH (2013) Branch flow model: relaxations and
convexification—Part I. IEEE Trans Power Syst
28(3):2554–2564
[30] Wei W, Mei SW, Wu L, Wang J, Fang Y (2016) Robust oper-
ation of distribution networks coupled with urban transportation
infrastructures. IEEE Trans Power Syst. doi:10.1109/TPWRS.
2016.2595523
[31] Wang ZY, Chen B, Wang JH et al (2015) Coordinated energy
management of networked microgrids in distribution systems.
IEEE Trans Smart Grid 6(1):45–53
[32] Liu B, Liu F, Mei SW et al (2015) AC-constrained economic
dispatch in radial power networks considering both continuous
and discrete controllable devices. In: Proceedings of the 27th
Chinese control and decision conference (CCDC’15), Qingdao,
China, 23–25 May 2015, pp. 6249–6254
[33] Ding T, Liu SY, Yuan W et al (2016) A two-stage robust
reactive power optimization considering uncertain wind power
integration in active distribution networks. IEEE Trans Sustain
Energy 7(1):301–311
[34] Ferreira RS, Borges CLT, Pereira MVF (2014) A flexible mixed-
integer linear programming approach to the AC optimal power
flow in distribution systems. IEEE Trans Power Syst
29(5):2447–2459
[35] Pirouti M, Bagdanavicius A, Ekanayake J et al (2013) Energy
consumption and economic analyses of a district heating net-
work. Energy 57(8):149–159
[36] Denholm P, Sioshansi R (2009) The value of compressed air
energy storage with wind in transmission-constrained electric
power systems. Energy Policy 37(8):3149–3158
Rui LI received the B.S. degree in electrical engineering from North
China Electric Power University in 2014. He is currently pursuing the
Ph.D. degree in electrical engineering in Tsinghua University,
Beijing, China. His current research interests include reinforcement
learning, game theory, micro energy internet, and compressed air
energy storage system.
Laijun CHEN received the B.Eng. and Ph.D. degrees, both in
electrical engineering, from Tsinghua University, Beijing, China in
2006 and 2011, respectively. He is currently an associate professor in
the Department of Electrical Engineering, Tsinghua University. He is
also the Vice Director of New Energy (Photovoltaic) Industry
Research Center, Qinghai University. His research mainly concerns
distribution generation, microgrids, and energy storage.
Tiejiang YUAN received the Ph.D. degree in electrical engineering
from Xinjiang University, Urumqi, China in 2009. He is currently an
associate professor in the Department of Electrical Engineering,
Xinjiang University. He is also pursuing his post-doctoral degree in
Tsinghua University. His current research focuses on renewable
energy generation.
Chunlai LI received the Master degree in control theory and control
engineering from Northeast China Electric Power University in 2007.
He is currently pursuing the Ph.D. degree in electrical engineering in
Shenyang University of Technology, Shenyang, China. His current
research interests include PV power generation, photovoltaic grid-
connecting, and energy storage system.
580 Rui LI et al.
123
Recommended