
Louisiana State UniversityLSU Digital Commons
LSU Historical Dissertations and Theses Graduate School
1966
New Methods for the Determination of TraceQuantities of Vanadium.Sham Lal SachdevLouisiana State University and Agricultural & Mechanical College
Follow this and additional works at: https://digitalcommons.lsu.edu/gradschool_disstheses
This Dissertation is brought to you for free and open access by the Graduate School at LSU Digital Commons. It has been accepted for inclusion inLSU Historical Dissertations and Theses by an authorized administrator of LSU Digital Commons. For more information, please [email protected].
Recommended CitationSachdev, Sham Lal, "New Methods for the Determination of Trace Quantities of Vanadium." (1966). LSU Historical Dissertations andTheses. 1135.https://digitalcommons.lsu.edu/gradschool_disstheses/1135

This dissertation has been microfilmed exactly as received
SACHDEV, Sham Lai, 1937- NEW METHODS FOR THE DETERMINATION OF TRACE QUANTITIES OF VANADIUM.
Louisiana State University, Ph.D., 1966 Chemistry, analytical
University Microfilms, Inc., Ann Arbor, Michigan

NEW METHODS FOR THE DETERMINATION
OF TRACE QUANTITIES OF VANADIUM
A Dissertation
Submitted to the Graduate Faculty of the Louisiana State University and
Agricultural and Mechanical College in partial fulfillment of the requirements for the degree of
Doctor of Philosophy
in
The Department of Chemistry
bySham Lai Sachdev
B.S., Panjab University, 1959 M.S.., Pan jab University, i960
January, 1966

ACKNOWLEDGMENTS
The author wishes to express his gratitude to Professor
Philip W. West for directing this research. He also wishes to
express his appreciation for the help and encouragement extended
to him by Dr. J. W. Robinson, his colleagues and many members of
the graduate faculty of the Chemistry Department at Louisiana
State University.
The author gratefully acknowledges financial support
received from the United States Public Health Service for part
of this investigation, and from the "Dr. Charles E. Coates Memorial
Fund of the L.S.U. Foundation donated by George H. Coates" for the
preparation of this dissertation.-
Finally, the author would like to extend his thanks to
Mr. G. H. Sexton for giving assistance on many occasions and
Susan Lay for typing the final copy of this manuscript.
ii

TABLE OF CONTENTS
PAGE
ACKNOWLEDGMENTS ........................................... ii
LIST OF TABLES............................................. vi
LIST OF FIGURES........................................... vii
ABSTRACT...................... viii
CHAPTER
I. INTRODUCTION....................................... 1
II. CONVENTIONAL METHODS FOR THE ANALYSIS OF VANADIUM . 3
A. Gravimetric Methods......................... 3
B. Titrimetric Methods......................... 3
C. Photometric Methods ............... 5
D. Emmision Spectroscopy ...................... 6
E. X-ray Fluorescence Spectroscopy w ........... 7
F. Neutron-Activation Analysis ................. 7
G. Polarography................................. 7
H. Flame Photometry............................. 8
I. Summary..................................... 8
III. ATOMIC ABSORPTION SPECTROSCOPY..................... 10
A. Historical Background ...................... 10
B. Theory....................................... 11
C. Equipment................................... 1^
iii

CHAPTER PAGE
IV. DETERMINATION OF VANADIUM BYATOMIC ABSORPTION SPECTROSCOPY .................... 17
A. Introduction................................ 17
B. Experimental................................ 20
C. Apparatus.................................... 20
D. Procedure for Extraction .............. 20
E. Procedure for the Study of Interferences . . . 21
F. Water Analysis.............................. 21
G. Setting of the Instrument.................... 22
V. RESULTS AND DISCUSSION............................ 27
A. Studies of Various Flames and the Effect ofOrganic Solvents ............................. 27
B. Choice of Extraction Procedure .............. Jl
C. Enhancement of Absorption Signal by the Useof MIBK....................................... 33
D. Role of the Organic Solvents................ ^0
E. Optimum Conditions.......................... 1<-1
F. Use of Multiple Burners......... ............. k-5
G. Study of Interferences...................... ^9
H. Procedure for the Analysis of Vanadium inWater Samples.................................
VI. RING OVEN TECHNIQUE................................ 52
A. Introduction................................ 52
B. Qualitative Analysis ........................ 52
C. Quantitative Determination.................. 5^
D. Trace Analysis.............................. 5^
E. Air Pollution Studies........................ 55iv

CHAPTER PAGE
VII. DETERMINATION OF VANADIUM BV THERING OVEN TECHNIQUE............................... 57
A. Introduction................................. 57
B. Experimental................................. 5®
C. Procedure for Preparing Rings ............... 5®
D. Analysis of an Unknown....................... 59E. Results and Discussion.............. 62
F. Selection of Filter Paper ................... 63G. Study of Interferences....................... 6k
H. Method of Testing Interferences ............ 6k
I. Results of Interference Study ............... 6k
SELECTED BIBLIOGRAPHY...................................... 65VITA....................................................... 72
v

LIST OF TABLES
TABLE PAGE
I. Sensitivity of the Strongest Absorption Linesof Vanadium....................................... 22
II. Slit Positions and Slit Openings................... 2k
III. Effect of Organic Solvents......................... 33IV. Effect of Mixed Organic Solvents................ . jk
V. Absorption of 3183*9 A Line of Vanadium inOxy-acetylene Flames of Different Compositions. . . k2
VI. Absorption of 3105*9 A Line of Vanadium inOxy-acetylene Flames of Different Compositions. . . k}
VII. Absorption of 3183*9 ̂ Line of Vanadium inOxy-acetylene Flames of Different Compositions. . . kk
VIII. Absorption of 3183*9 A Line of Vanadium atDifferent Heights in Oxy-acetylene Flames ........ k6
IX. Effect of Interfering Ions on the Absorption of3183.9 ^ Line of Vanadium..................... 50
X. Determination of Vanadium in Water Samples..... 51XI. Determination of the Concentration of
Unknown Solutions................................. 62
XII. Determination of Vanadium......................... 63
vi

LIST OF FIGURES
FIGURE PAGE
1. Optical Arrangement of Perkin-Elmer Model 3^3Atomic Absorption Spectrophotometer ................ 16
2. Effect of Methanol on the Absorption of 3183*9 A Line of Vanadium in Oxy-acetylene Flames of Various Compositions................ 28
3* Effect of Ethanol on the Absorption of 3183*9 A Line of Vanadium in Oxy-acetylene Flames of Various Compositions........................................ 29
Effect of Propanol-2 on the Absorption of3l83*9 A Line of Vanadium in Oxy-acetylene Flames ofVarious Compositions................................ 30
5. Effect of Addition of Oleic Acid to MIBK Used forExtracting Vanadium Cupferrate, on the Absorptionof 3183*9 ^ Line of Vanadium in Oxy-acetylene Flames of Various Compositions ............................ 36
6. Effect of Addition of Oleic Acid to the Solution ofVanadium in Methanol on the Absorption 3183*9 A Line of Vanadium in Oxy-acetylene Flames of Various Compositions ■ 37
7* Effect of Addition of Oleic Acid to Solution ofVanadium in Ethanol on the Absorption of 3183*9 A Line of Vanadium in Oxy-acetylene Flames of Various Compositions................. ...................... 38
8. Effect of Addition~of Oleic Acid to Solution ofVanadium in Propanol-2 in the Absorption of 3183*9 ^Line of Vanadium in Oxy-acetylene Flames of Various Compositions......................................... 39
9* Effect of Variation of Burner Height on theAbsorption of 3183*9 ^ Line of Vanadium............. kj
10. Calibration Curves................................... H8
11. The Ring O v e n ....................................... 60
vii

ABSTRACT
Occurence of vanadium in a wide variety of material and its
increasing number of applications have greatly emphasized the need
for improved methods for its determination. Two new methods for the
determination of trace quantities of vanadium have been developed;
one based on atomic absorption spectroscopy and the other on the
ring oven technique. The former is useful for the determination of
vanadium in dilute solutions and the latter for smaller samples.
1. By Atomic Absorption Spectroscopy.
Although this recently developed technique has provided simple,
sensitive and very selective methods for the determination of a large
number of metals, it has not been very successful when applied to
refractory metals such as vanadium. This is because vanadium forms
very stable refractory oxides in the flame used for atomization and
thus there are no free vanadium atoms left for atomic absorption. By
the use of mixed systems of organic solvents in conjunction with a
fuel rich oxy-acetylene flame, conditions have been found under which
free vanadium atoms can be formed quite efficiently. Under these
conditions atomic absorption spectroscopic technique has been found to
provide a simple, sensitive, very selective and reliable method for
the determination of vanadium. Sensitivity of the method is 0.J2 mg/1
(in organic phase) for Vf> absorption. Vanadium is extracted asvanadium cupferrate into a mixture of oleic acid and methyl isobutyl
viii

ketone. The organic phase is aspirated into a fuel rich flame of a
Beckman integral aspirator type burner. The upper part of the inner
luminous cone of the flame was found to be the best portion of the
flame for the absorption of the 3183.9 & line of vanadium. The extraction procedure is simple and can also be used for concentrating
vanadium from aqueous solutions. Vanadium concentrations as low as
1 mg/1 can easily be determined with reasonable accuracy.
2. By the Ring Oven Technique.
Ring oven methods of analysis are very useful when the quan
tity of test material available is very small. The method developed
for the determination of vanadium is based on the selective reaction
of Qf-benzoinoxime with vanadium (V) in acidic medium. Selectivity
of the method is further improved by extracting the precipitate formed
between vanadium (V) and Q'-benzoinoxime with benzene. The extraction
is carried out on the filter paper placed on the ring oven. The
method is simple, sensitive, selective and rapid. As little as 0.1p<g
of vanadium can be determined from a microliter drop of a solution.
ix

CHAPTER I
INTRODUCTION
Vanadium, once regarded as a scarce element, is one of the
more abundant elements of the minor constituents of the earth's crust
and is more common than copper, lead, nickel or zinc. It is esti
mated (39) to be present to the extent of 0.015$ *n the earth's crust. In addition to about 70 vanadium minerals, this element is found in
petroleum crudes (^3), in some marine organisms, including holothur-
ians and ascidians, in plants(l)d), and even in human teeth (60).Recently, many unusual properties of vanadium and its com
pounds have been discovered. As a result, its applications are
increasing rapidly. Vanadium metal makes hard alloys such as ferro-
vanadium and nickel-vanadium. Pure vanadium metal is of great
interest to the nuclear scientists for the following reasons:
1. It has relatively low neutron-capture cross-section.
2. It shows good strength at elevated temperatures in non-atmos-
pheric conditions.
3* It does not alloy with uranium at high temperature.
k. It has good thermal conductivity.
Compounds of vanadium find their use in industry as catalysts
for the manufacture of compounds such as sulfuric acid, phthalic
anhydride and adipic acid. Large quantities of ammonium metavanadate

2
are applied in the formulation of ceramic glazes and stains. Vanadium
compounds are also used in ink and paint industries because they con
tribute to drying characteristics. Compounds such as amnonium vanadyl
tartarate are being examined for toxicity and if not toxic these may
prove to be useful in the treatment of high blood pressure resulting
from arteriosclerosis. The studies of Costello and Currani(7) have
indicated that ingestion of vanadium compounds lowers the cholesterol
level in human blood.
To keep in step with the increasing use of vanadium and its
compounds, improved analytical methods for its detection and deter
mination will be needed. This work has been undertaken with the aim
of developing new and better methods for the determination of vanadium
at microgram levels.
t

' •CHAPTER II
CONVENTIONAL METHODS FOR THE
DETERMINATION OF VANADIUM
A. GRAVIMETRIC METHODS
Most organic and inorganic precipitants of vanadium are
unsuitable for general use, either because they are not quantitative
or because of coprecipitation of other elements along with vanadium.
Thus, gravimetric procedures can only be used if the composition of
vanadium solution is known and if appropriate separation procedures
are employed. A six per cent aqueous cupferron solution has been
recommended for the precipitation of vanadium (42). Mercurous
nitrate and lead acetate have also been used as precipitants for the
gravimetric determination (42).
B . TITRIMETRIC METHODS
Titrimetric procedures based on oxidation of vanadium (IV) to
vanadium (V), as well as reduction of vanadium (V) to vanadium (IV),
have been developed. In the case of solutions which contain no
oxidizable element other than vanadium, the procedure is very simple.
An acidic solution of tetravalent vanadium is titrated by means of a
standard permanganate solution,. To insure that vanadium in the sam
ple solution is in the tetravalent state, excess ferrous ion is
usually used and the excess subsequently oxidized by ammonium
persulfate (24).

In place of ferrous ions, sulfur dioxide has also been used to
reduce vanadium (V) to vanadium (IV). The excess of sulfur dioxide
can be very easily removed by bubbling carbon dioxide vigorously
through the sample solution. This procedure has been stated to be
more accurate (21) than the method employing ferrous compounds as
reductants.
The end point of these titrations may be determined visually,
spectrophotometrically (18), or potentiometrically (15). Spectropho-
tometric methods for the determination of end points provide the most
sensitive procedures. Such titration procedures have been success
fully used for the determination of vanadium in steel samples.
Titrimetric procedures based on the reduction of vanadium(V) to
vanadium (IV) have also been developed and used for the determination
of vanadium in steel samples. In principle, vanadium is oxidized to
the pentavalent state, excess oxidant is destroyed and the resultant
solution is titrated against standard ferrous solution. Permanganate
solution is often used to selectively oxidize vanadium(IV) and iron(ll)
without oxidizing chromium(III) which is a common interfering ion in
the case of steel analysis. Excess permanganate is reduced by sodium
nitrite which does not reduce vanadium (V). Excess nitrite must be
destroyed and this can easily be done by the use of sulfamic acid or
urea. The end point of such a titration can be determined by the
use of an indicator such as barium diphenylaminesulphonate (33).;
potentiometrically (Vf), amperometrically (38) or by dead-stop determination of the end point (17)* Potentiometric and amperometric
methods for the determination of the end point have been reported to

5
be more precise than visual means, whereas, the dead-stop determina
tion of the end point has been reported to be very precise. Large
quantities of uranium, chromium and titanium can be tolerated in
these procedures.
C . PHOTOMETRIC METHODS
Photometric procedures are quite sensitive and are very useful
for the determination of vanadium at low levels of concentration. A
number of spectrophotometric methods have been developed and are used
in non-routine analysis. Some of the commonly used procedures have
been listed as follows:
1. As Phosphotungstovanadate. Phosphoric acid intensifies the
yellow color formed by the reaction of sodium tungstate with vana
dium (V) and thus provides a sensitive method for the determination
of vanadium (62). This procedure, however, is not very selective and
therefore, elimination of interfering ions is necessary. The
recommended procedure for the removal of interfering ions is by mer
cury cathode electrolysis. Selectivity may also be achieved by
extraction with ethylmethyl ketone (2$). A procedure based on this
reaction has been reported for the determination of vanadium in low-
alloy steel (6).2. Spectrophotometric Determination with Hydrogen Peroxide.
This procedure is less sensitive than the phosphotungstate method, but
it is more selective (63)* Only titanium, molybdenum, tungsten and chromium present interference. Titanium presents the greatest inter
ference problem.

3* Determination as 8-hydroxyquinolinate. The complex formed
between vanadium (V) and 8-hydroxyquinoline is extracted into alcohol- free chloroform (^6). An ethylenediamine tetraacetic acid solution
in the presence of calcium salt is used as a masking reagent to pre
vent the extraction of other interfering ions. The method is suita
ble for biological samples.
4 Miscellaneous Photometric Methods. A large number of
photometric procedures have been developed using reagents such as
pyrocatechol violet (29)> rutin (10), xylenol orange (31)> N-benzoyl-N-phenyl hydrazine (35)> N-benzoyl tolyl hydroxylamine (30), and 4(2-pyridylazo)resorcinol (5). All of these spectrophotometric
procedures are quite sensitive and desired selectivity can be
achieved by the use of masking agents. The choice of masking agents
will, by all means, depend upon the nature of interfering ions present.
D. EMISSION SPECTROSCOPY
Arc and spark spectra of vanadium are quite complex and pro
vide many suitable lines for its determination. The complex nature
of the spectra, however, increases the problems due to interference.
Vanadium has been stated to show some JIJO neutral and singly ionized
spectral lines (19)* Thus, a spectrograph of high dispersion and
resolution is required for the determination of vanadium. Some 12
spectrographic methods for determining vanadium have been suggested
by A.S.T.M. (25)* These methods include point to plane, porus-cup,
pellet, rod to rod and rotating disc techniques. These procedures have proved to be very useful for the determination of trace quanti
ties of vanadium in steel, aluminum and biological samples.

E. X-RAY FLUORESCENCE SPECTROSCOPY
Vanadium is at the lower fringe of the group of elements in
the periodic table that are amenable to x-ray analysis. It emits a
Kcc line of wave-length 2.502A. Procedures based on this principle
have been developed for the determination of vanadium in cracking
catalyst (11), petroleum (8), steel and carbonaceous materials (3).F. NEUTRON-ACTIVATION ANALYSIS
When vanadium is bombarded with slow neutrons, the following
(n,y) reaction occurs:
+ Xn -* 52V & 52Cr23 O 2 3 24
The half life of is 3*75 minutes and this precludes isolation ofS3the element after irradiation; thus, interference due to other ele
ments undergoing the (n,y) reaction are to be expected. However,
due to large activation cross-section for vanadium (^.5 barns) short irradiation times are possible and the activity of a large number of
isotopes would be negligible in this case. Further elimination of
interferences can be obtained by the use of a gamma spectrometer to
monitor the gamma energies within a band ranging from 1»33 t052I.55 m.e.v. which includes l.k6 m.e.v. gamma radiation from V.23
Neutron activation techniques have been applied for the determina
tion of vanadium in graphite, high-alloy steel (27) and in petroleum (k).
G. POLAROGRAPHY
The study of several oxidation-reduction reactions of vana
dium by polarographic means has resulted in useful methods for its

8
analysis (26). Procedures based on oxidation-reduction reactions of
bivalent^ trivalent; tetravalent and pentavalent vanadium have been
developed. The recommended method for the removal of interference is
by electrolysis; using a mercury cathode cell. Good results have
been reported on a wide variety of steel samples (28).H. FLAME PHOTOMETRY
The use of flame photometry for the determination of vanadium
has been very limited because the characteristic line spectrum of ato
mic vanadium cannot be excited by ordinary flames. This is so because
vanadium forms stable refractory oxides. Line spectra of vanadium can
be excited by an oxygen-cyanogen flame (20). Oxygen-cyanogen flames
are very bright; noisy and therefore inconvenient to work with. Pro
cedures using a band spectrum of vanadium oxide, VO, have been de
veloped (̂*-1, ) • ln these procedures, there are several'interferences
encountered. Common elements like copper, iron, titanium, niobium and
zirconium, which are likely to be found with vanadium interfere in
such determinations (45).
I. SUMMARY
The choice of any analytical method is generally a compromise
between several factors, such as speed, accuracy, sensitivity and pre
cision. Gravimetric, volumetric and polarographic methods are macro
methods. These are useful for the determination of large quantities
of vanadium but cannot be used for the determination of vanadium if it
is present in the milligram range or less. Colorimetry, spectrography,
X-ray fluorescence and neutron activation provide various procedures
for the determination of trace quantities of vanadium in a variety of
materials. Among the colorimetric procedures, determination with

9
phosphotungstate and N-benzoylphenylhydroxylamine are useful down to
about 10 mg/1 levels. X-ray fluorescence and neutron activation
analysis are also very useful for trace analysis of vanadium if inter
ferences can easily be overcome. Emission spectrographic techniques
are employed over a range of vanadium concentrations from trace to a
few per cent.
A review of methods for the determination of vanadium clearly
shows that simple, rapid, accurate, sensitive and selective procedures
for the determination of vanadium will be quite valuable. The
recently developed technique of atomic absorption spectroscopy gives
■promise of such a procedure for vanadium. This last technique is
certainly not an alternative to a direct reading spectrograph. It can,
however, supplement such a spectrograph for it is simple, rapid,
sensitive, selective and suited for use by non-professional personnel.
Already, methods are available for the determination of about thirty
elements at parts-per-million levels. As a result of the work
described, the technique can be used with confidence as a tool for
the determination of trace amounts of vanadium.

CHAPTER III
ATOMIC ABSORPTION SPECTROSCOPY
A. HISTORICAL BACKGROUND
The phenomenon of atomic absorption and emission of radiant
energy has been known for about one hundred years. During all these
years, steady progress has been made in the development of emission
methods of spectrochemical analysis whereas absorption methods have
been largely confined to the studies of the composition of solar
and stellar atmospheres.
Based on the principle of atomic absorption, Woodson (6^)
in 1939 designed and patented an instrument for the determination of mercury vapour in air. This, however, did not attract much atten
tion and the potentialities of analytical methods based on this
principle were completely ignored until 1955 when Walsh (^9) demonstrated its applicability to a wide variety of analytical problems.
Since then atomic absorption spectroscopy has been applied to deter
mine trace quantities of a large number of elements in a variety of
materials such as medicines, biological samples(e.g., blood, urine,
saliva, tissue and spinal fluids), agricultural products, soils,
plants, plant nutrients, foods, beverages, petroleum, metallurgical
samples, water, air, cements, glass, paints and other chemicals.
10

11
B. THEORY
Atoms in the ground state constitute the bulk of an atomic
population under most conditions. In this state atoms may absorb
radiant energy of certain characteristic frequencies and be raised
to excited states. During this process, electrons are moved from
a lower energy level to a higher energy level and if the difference
between these two energy levels is hv- , where h is Planck's con
stant, then v will be the frequency of the radiation absorbed. This
absorption of energy is proportional to the concentration of atoms
in the ground state. Because small changes in temperature do not
alter the concentration of atoms in the ground state appreciably,
slight changes in temperature have no effect on the absorption.
The absorption coefficient at frequency V , Kv , is definedby:
Iv s Iov exp. - Kv 1 (1)
where IQV is the initial intensity of the incident parallel beam of
monochromatic radiation and Iv is the intensity after it has passed
through the layer of absorbing medium of thickness 1. The absorption
coefficient is a function of frequency. But, no absorption line is■ j
infinitely narrow and no radiation source emits purely monochromatic
radiation. Therefore, the absorption coefficient obtained in prac
tice is the integrated absorption coefficient. The integrated
absorption coefficient (50) of atoms in a gaseous state is given by

12
the following relation:
00Kv dv = tf*2 Nu f (2)
0 me
where e is the electronic charge, m the electronic mass, c the
velocity of light, N the number of atoms per cm3 which are capable of absorbing the radiation frequency ranging from to + d and
f, the ascillator strength, is the average number of electrons per
atom which can be excited by the incident radiation.
If there are Nv* atoms per cm3 capable of absorbing, then the
total absorption A will be:
. rfe2 f Nv 1me
Atoms capable of absorbing are the ground state atoms and if the
total concentration is to be measured it will be necessary to know
the relationship between the ground state atoms and the total concen
tration of the atoms. According to Boltzman statistics the distribution of atoms in different energy states at temperature T is given
by:
Nj ■ N Bj e*P- -Bj/M (̂ )Sj exp. -Ej/kT
Here N is the total number of atoms, Nj is the number of atoms in the
jth state, gj the statistical weight, Ej is the energy of the jth
state and k is the Boltzman constant. Walsh (1*9) calculated the mag
nitude of the fraction of atoms in the first excited state for

13
resonance lines of various elements at temperatures ranging from
2000° K to 5000°K. His results show that in nearly all cases the
number of atoms in the first excited state is only a small fraction
of the number of atoms in the ground state. For example, the ratio
of Nj/N for the 2139 A line of zinc at 2000°K is 7.29 x 10“15, and for the same line at 5000°K is If.32 x 10-6. Equation k and the
calculated results also show that the number of excited atoms varies
exponentially with temperature whereas the number of atoms in the
groung state remain virtually constant. Thus, small changes in
temperature will effect the emission intensity which is proportional
to the number of excited atoms. Because the number of ground state
atoms does not vary much with temperature, slight changes in tempera
ture will not effect the absorption. This is one of the principal
advantages of atomic absorption photometry over flame emission
photometry.
The shape of the atomic absorption line is determined by the
following factors:
a. The natural width of the line, due to the finite lifetime of the
excited state.
b. The Doppler broadening, due to the motion of the atoms relative
to the observer.
c. Pressure broadening which is due to the reduction in the. mean
free time between collisions with other atoms.
d. Stark broadening, due to external electric fields.
The natural width of an atomic absorption line is of the order of 10"4 A. Considering Doppler’s shift at 2000°K, it is of the order
of 0.01 A. To isolate such a line from the continuous background, a

resolution of 500,000 will be required which is beyond the performance of most spectrographs. In addition, the energy emitted over
such a small spectral slit-width will be too small to be measured
accurately by photoelectric methods commonly used for the measure
ments of light intensity.
Walsh (lj-9) demonstrated the possibilty of accurate measure
ments of the absorption signal by the use of sharp line source.
In such a case the only requirement is to isolate the line selected
for analysis from other lines emitted by the source and this can
easily be achieved by common monochromators.
In most instances, thermal excitation of the atoms gives rise
to emission of radiation of the same frequency as the absorption
line. This difficulty can be overcome by chopping the source radia
tion before it passes through the atomic vapor and amplifying the
output of the detector with an amplifier tuned to the chopping frequency.
C . EQUIPMENT
There are about ten models of atomic absorption spectropho
tometers commercially available. This includes single as well as
double beam instruments. The following diagram would explain the
basic components and their arrangement in a single beam assembly.
Source of Means ofradiation Chopper atomization
a b c1
Detector Monochromatorand 4-
Readout

15
a. Sources of Radiation. Requirements for a sharp-line source were
discussed on the previous page. Hollow cathode lamps for a large num
ber of elements are available in the market and constitute the most
commonly used sources. However, in some cases like those of sodium,
potassium and mercury, spectral vapour lamps may be more useful.
b. Chopper. When a beam of light, emitted from a hollow cathode lamp,
is passed through the flame, and if appropriate metal atoms in the
ground state are present in the flame, a fraction of light proportional
to the concentration of metal atoms is absorbed. At the same time some
atoms are thermally excited by the flame and emit radiation of the same
frequency as the absorption line. A chopper is employed to eliminate
this emission signal. The beam of incident radiation is chopped at
definite time intervals. The amplifier in the readout assembly is
tuned to the chopping frequency and therefore, reads only the change
in the intensity of the light due to absorption and does not detect the
emitted radiation since it is not modulated to the tuned frequency of
the detector.
c. Means of Atomization. So far the most common means of reducing
the sample to atomic vapour is by flame. Hydrogen, acetylene and
methane are the commonly used fuels. Both air and oxygen are often
used as supporters of combustion; air mostly in premixed type burners,
and oxygen in integral total consumption burners. Currently, a great
deal of work is being carried out to develop new and better means of
atomization. Various fuel mixtures and other techniques for obtaining
high temperatures such as plasma torches are being tried.

16
d. Monochromator. Because sharp line sources are used, an ordinary
monochromator is quite sufficient. Either quartz prism or grating type
monochromators may be used in these instruments.
e. Detector and Readout. Basic components of this unit are a photo
multiplier tube and an amplifier tuned to the chopper frequency.
In this study, a Perkin Elmer model 303 atomic absorption spectrophotometer was used. This is a double beam assembly and the
layout of basic components is as shown in Figure 1.
\
Si
Mq Y _ ------/
/
Mia
Figure 1
Mi through Mi2 - Mirrors D - Detector
Si - A hollow cathode lamp S2 - Slit
F - Flame C - Chopper
G - Grating

CHAPTER IV
DETERMINATION OF VANADIUM BY ATOMIC ABSORPTION SPECTROSCOPY
A. INTRODUCTION
The technique of atomic absorption spectroscopy has provided an
elegant means for the determination of a large number of metals at the
parts per million and parts per billion levels. The technique has not
been successful when applied to refractory metals such as aluminum,
niobium, tantalum, titanium, vanadium and zirconium, etc.
Elwell and Gidley in 1962 (12) listed vanadium as one of the elements which could not be determined by atomic absorption spectro
photometry. The reason for this failure of atomic absorption spectro
photometry when applied to vanadium seems to be the formation of
stable refractory oxides of vanadium in the flame which thus leaves no
free atoms for the atomic absorption. If the flame conditions are
highly reducing so as to prevent the formation of refractory oxides in
the reducing part of the flame, it would be possible to observe the
absorption signal for vanadium atoms in this part of the flame.
Because the absorption of light signal is proportional to the
population of metal atoms in the flame, attention is drawn towards the
mechanism of the production of metal atoms in the flame. Robinson and
Kevan (40) have explained, in general, the mechanism of the production
of metal atoms as follows:
17

18
Flame has been considered to consist of the following four
parts:
1. Base. In this part of the flame, droplets of the sample undergo
evaporation. Important controlling factors for the atomic absorption'
may be the droplet size, nature of the solvent, the flame temperature
and the feed rate.
2. Inner Cone. Here solid particles undergo disintegration. The
controlling factors are the flame temperature and the composition of
the flame surrounding these particles.
3- Reaction Zone. In this zone of the flame, atoms may undergo oxi
dation depending upon the flame composition and the stability of the
metal oxide.
if. Outer Mantle. Here metal atoms are in equilibrium with the metal
oxide. This equilibrium also depends upon the flame composition and
the stability of metal oxide.
Obviously, in the case of refractory metals like vanadium,
stable refractory oxides are formed in the reaction zone and under
normal flame conditions these oxides are not decomposed in any part of
the flame. It is clear from the discussion of mechanism for the pro
duction of metal atoms that the flame composition plays a very impor
tant role. Thus, it may be possible to detect vanadium by atomic
absorption by using a hot and highly reducing flame for atomization.
Fassel and Mossoti in I963 (13) reported the possibility of determining vanadium and some other refractory metals by using fuel rich
oxygen-acetylene flames and by feeding the metal solution in an
organic solvent (ethanol). Radiation was passed through three flames

19
of Beckman integral type burners arranged in a row and sensitivity
for vanadium has been reported to be 10 mg /1 for 1$ absorption.
Slavin and Manning (Ml) confirmed the work of Fassel and Mossoti and
reported a slightly better sensitivity (7 mg /1 for 1$ absorption)
under similar conditions, using Zeiss total consumption burner.
However, in such a flame, low signal/noise ratio prevented the deter
mination of vanadium in dilute solutions.
Recently, Amos and Thomas (l)have reported a sensitive method
for the determination of aluminum from aqueous solution by using a
long-path premixed type oxy-acetylene burner. But, the possibility
of frequent explosions while using an oxygen-acetylene mixture in a
premixed type burner is a serious limitation. In order to overcome
this difficulty, Willis (61) has suggested the use of a nitrous oxide-
acetylene mixture in a premix type burner made of 3/8 inch thick
stainless steel with a slot as large as k x 0.015 inch2 . The reported
sensitivity for vanadium under these conditions is I.5 mg/1 for 1$ absorption. The use of nitrous oxide instead of air or oxygen is con
siderably more expensive. A standard tank of nitrous oxide costs
about.$M).00 and lasts only 10 hours as compared to a tank of air or
oxygen which costs about three to four dollars and lasts about 30 hours.
The work presented here has been carried out with an objective
of improving the flame conditions such that the determination of
vanadium from dilute solutions could be possible by means of atomic
absorption spectroscopy. Conditions for a very selective and very
sensitive method for the determination of vanadium have been

developed by feeding vanadium in a mixture of organic solvents to
a fuel rich oxygen-acetylene flame of a Beckman integral type aspirator
burner.
B. EXPERIMENTALAll solutions were made in double distilled water.
1. Preparation of Standard Solutions of Vanadium. A stock solution,
10,000 mg/1, with respect to vanadium, was prepared by dissolving
22.80 g of pure ammonium metavanadate in about 100 ml of 50$ sulfuric acid and the volume made up to one liter with water. This solution
was stored in a polyethylene bottle. Various other concentrations
were prepared by diluting appropriate volumes of this solution.
2. Other Solutions. Solutions other than that of vanadium such as
that of cupferron and various interfering ions were prepared by
using a torsion wire balance and therefore may be regarded as approxi
mate. All reagents used were of analytical grades.
C . APPARATUS
Atomic absorption spectrophotometer (Perkin-Elmer's model 303);
large bore-integral atomizer burners-oxygen/acetylene assembly
(Beckman Instrument, Inc., No. 4090), vanadium hollow cathode lamp
(Ransley Glass, Melbourne, Australia), a pair of tongs, several 5 ml beakers, polyethylene bottles and separatory funnels, etc.
D. PROCEDURE FOR EXTRACTION
An aqueous solution of vanadium was mixed with l/10th of its
volume of concentrated sulfuric acid and the resultant solution was
cooled in an ice bath. The ice cold solution was taken in a separa
tory funnel of appropriate size and to this,-6$ aqueous solution of
cupferron (N-nitrosophenylhydroxylamine ammonium salt) was added.

21
One milliliter of cupferron solution per milligram of extractable ion
should be added. The mahogany red precipitate formed with vanadium(V)
was extracted into an appropriate fixed volume of methyl isobutyl
ketone (MIBK) or a mixture of MIBK and oleic acid. The solutions were
shaken for at least one minute before separating the two phases.
E. PROCEDURE FOR THE STUDY OF INTERFERENCES
To 2.5 ml of ammonium metavanadate solution (1000 mg/1 with
respect to vanadium), 2-5 ml of interfering ion solution of 10,000 mg/1
with respect to the interfering ion was added. This solution was mixed
with 2.5 ml of concentrated sulfuric acid and the final volume was adjusted to 25 ml. This resulting solution, which contained 100 mg/1
of vanadium and 1000 mg/1 of interfering ion, was cooled to about
10°C. The solution was transferred to a separatory funnel and 5 ml of 6$ aqueous cupferron solution was added. The precipitate formed was
extracted into 25 ml of (22:78) mixture of oleic acid and MIBK. The
atomic absorption of this solution was studied and compared with the
absorption from a solution prepared in a similar manner, containing
100 mg/1 of vanadium, but no interfering ion.
F. WATER ANALYSIS
To 50 ml of aqueous vanadium solution (1 mg/1 to 5 mg/1 with respect to vanadium), 5 ml of concentrated sulfuric acid was added.The solution was cooled in ice to about 10°C. The cold solution was
transferred to a 100 ml separatory funnel and 1 ml of 6$ aqueous cup
ferron solution followed by 5 ml of (22:78) mixture of oleic acid and MIBK were added. The mixture was shaken for one minute and the phases
were allowed to separate. The organic phase was aspirated to the flame for absorption studies.

G. SETTING OF THE INSTRUMENT
1. Choice of Absorption Frequency. Fassel and Mossoti (13) studied
the sensitivity of various absorption lines for vanadium. Their
results are given in TABLE I.
TABLE ISENSITIVITY OF THE STRONGEST ABSORPTION LINES OF VANADIUM
Wavelength, A Sensitivity (mg/1 of vanadium for li> absorption)
3183.41 253183.98 103185.40 253828.56 1003840.75 1003855.84 503902.25 1004111.78 1004379-24 504384.72 100
4389.97 100
A wavelength of 3183*98 A has been selected as the most intense and sensitive for vanadium. The instrument used, however, is not capable
of resolving this line from lines of wavelength JlQ^.kl A and 3IB5.UO A. For the use of the 3183*98 A line, the wavelength dial should be set at this reading and the Range-switch should be set at "UV Range."

2. Placement of the Hollow Cathode Lamp and Source Control. After
having fitted the hollow cathode lamp In the bracket provided, the
bracket Is fitted In Its position In the ' lamp compartment on the left
panel of the instrument. The lamp terminals are connected to the pro
per leads and the power switch is turned on. With the scale switch at
position 1, amplifier gain at position 5 and the slit control at 3,
the source control is turned clockwise until the needle on the energy
meter is in the middle of the scale. The position of the bracket
carrying the hollow cathode lamp is now adjusted so that the needle
on the energy meter reads maximum. The fine wavelength control is
adjusted in the same manner to obtain maximum reading on the energy
meter.
3« Choice of Lamp Current. On each lamp, an optimum current for its
operation is given and in the case of the vanadium lamp used in these
studies, it was 20 mA. Although the manufacturer advises not to use
more than the recommended current, it was necessary to use larger
currents in these experiments in order to maintain a proper signal to
noise ratio. It has been found that currents as high as 50 mA can be used for a short period without damaging the lamp. In these experi
ments, a lamp current of 30 mA has been used and was set with the help of source control until the ammeter in the lamp compartment read 30 mA* In.view of the high signal/noise ratio, higher lamp currents are more
desirable while using the highly reducing oxy-acetylene flame. This,
however, may shorten the life of the lamp to some extent. A 30 mA
current has been found to be very satisfactory with other settings as
wii.ll be described. The lamp has been found to give good service even after sixty hours of use.

2k
k. Setting of the Scale Switch. The scale switch provided on the
left panel of the instrument has four positions; marked 1, 2, 5 and 10, which indicate the scale expansion. In all experiments reported
here, the scale switch was set on position 1 which gave a direct reading of the percentage of signal that( was absorbed. Greater scale
expansion may be useful when absorption readings are very low.
5* Setting of Gain-control. The amplifier gain-control should be so
adjusted that the needle of the energy meter stands in the middle.
Setting of gain-control at positions higher than 6 generally causes electrical noise with resulting fluctuations in the null meter. This
can be avoided by adjusting the lamp current or slit opening. In
general, higher lamp currents allow lower gain setting for a given
slit opening.- During the experiments reported here, the gain-con
trol was set between positions foyr- and five.
6 . Slit Setting. The slit control has positions 1 through 6 . The
slit opening at these positions is given in TABLE II.
TABLE II
Slit SlitPosition Opening (mm)
1 0 .0 5
2 0.103 0 .30
4 1.005 3 .00
6 10.00

Because a bright, reducing oxy-acetylene flame had to be used in
these studies, the slit opening was kept at a minimum in order to
decrease the flame background radiation falling on the photomulti
plier tube. This minimum, however, depends upon the lamp current and
the gain-control setting. In the experiments described, a slit posi
tion of 3 was found to be satisfactory.
7- Range Switch Setting. The range switch has two positions, VIS
for visible range and UV for ultraviolet range. Its setting depends
upon the wavelength of absorption line used for the analysis. For
the work reported here it was set at the UV range.
8 . Phase Switch. If blocking the light beam, by placing a paper or
hand above the burner, makes the needle on the energy meter to devi
ate, the beam is out of phase. For phase corrections, the phase
switch should be turned to the alternate position.
9* Zero Control. After lighting the burner, the needle on the null
meter should be brought to the middle by adjusting the zero control.
10. Absorption Measurement. When the sample is fed to the flame and
if it absorbs some of the radiation passing through the flame, the
needle on the null meter is deflected. The needle is brought back to
the middle by turning the absorption control clockwise and the per
centage of light absorbed is read on the absorption counter.
11. Burner Assembly. A large bore, integral type, aspirator burner
(Beckman Instruments, Inc., No. I4O9O) has been used instead of Perkin- Elmer’s premix type burner which could not be used for oxy-acetylene
flames. A special rack was fitted for the use of one or more Beckman
burners in place of the Perkin-Elmer burner. The position of the

26
burner was so adjusted that the beam of radiation was passed through
the upper part of the inner, luminous cone of the flame. Two stage,
regulators were used on the gas tanks and a flow meter in the gas
lines. Various flow rates for oxygen and acetylene were used and the
results obtained will be discussed in the next chapter.
Many experiments were performed for comparison purpose. There
fore, conditions for these experiments were kept identical and were
roughly the optimum conditions for the observations being made. In
all such experiments, solvent was used to set the zero of the instru
ment and absorption reading for the blank was subtracted from the
absorption reading for the sample. Alternatively, blanks may be used
for setting the instrument for zero absorption.

CHAPTER V
RESULTS AND DISCUSSION
A. STUDIES OF VARIOUS FLAMES AND THE EFFECT OF ORGANIC SOLVENTS
Preliminary experiments were performed to observe the absorp
tion signal in oxygen-hydrogen flame under different conditions. No
absorption could be observed using aqueous solution of ammonium
metavanadate of 1000 mg/1 concentration with respect to vanadium.
Using vanadium solution in 90$ ethanol containing 500 mg/1 of vana
dium, only a very weak loss of signal (about 3$ absorption) could be observed in a highly reducing flame. The studies indicated that an
oxygen-hydrogen flame is unsuitable for the determination of vanadium,
apparently because such flames are not hot enough to produce an atomic
vapour of vanadium.
Absorption of the 3183-98 ^ line of vanadium could be easily
observed by using a fuel rich oxy-acetylene flame. Organic solvents
seem to enhance the absorption. The effect of additions of organic
solvents such as methanol, ethanol and isopropanol on the absorption
signal was studied in flames of various compositions. The results
are shown in Figures 2, 3 anc* The solutions used contained
1000 mg/1 of vanadium. These results show that absorption is maximum
in highly reducing flames and that the slope of the curve obtained with highly reducing flame falls down rapidly as the concentration of
organic solvent is increased. Moreover, the maximum absorption was27

Absorption
($>)
28Concentration of Vanadium s 1000 mg/1.
Flame Composition flow rate (1/min)
Oxygen Acetylene
3.0 2.6y-x 3.0 3-1A-A 3.0 3.60-0 3-0 k.lA-*. 3.0 k.6
10-
Percentage of Methanol (v/v)
Figure 2
Effect of Methanol On the Absorptionof 3185.9^ Line of Vanadium in
Oxy-acetylene Flames of Various Compositions.

Absorption
($)
29
Concentration of Vanadium = 1000 mg/1
Flame Composition flow rate (1/min)
to Oxygen Acetylene
2.63.0
o-oA- A
20
10
Percentage Ethanol (v/v)
Figure 3
Effect of Ethanol on the Absorptionof 3l83*9 ^ Line of Vanadium in
Oxy-acetylene Flames of Various Compositions

Absorption
($)
30
Concentration of Vanadium = 1000 mg/1
Flame Compositionsflow rates
Oxygen Acetylene
2.6
k.6
20 ••
10 ••
806020Percentage of Propanol-2 (v/v)
Figure k
Effect of Propanol-2 on the Absorptionof 3185*9 ^ Line of Vanadium in
Oxy-acetylene Flames of Various Compositions

31
observed when the solution contained more than 70$ of the respective organic solvent. This suggested that organic solvents are definitely
playing an important role in the establishment of flame conditions.
The flame is of more reducing character when larger quantities of
organic solvents are used. Although flame could be made more reducing
by increasing the flow rate of the fuel gas, this results in incom
plete combustion and the flame does not provide enough energy for
atomization of the vanadium. At the same time, unburned carbon par
ticles physically scatter the incident radiation.
High concentrations of organic solvents yielded better absorp
tion signals and this indicated the possibile advantage of using an
extraction procedure. A good extraction procedure would not only
provide an organic medium for vanadium, it would also increase the
selectivity of the method by eliminating a large number of possible
interfering ions. In addition, a solvent extraction step would serve
to concentrate vanadium in the organic solvent from a very dilute
aqueous solution.
B. CHOICE OF EXTRACTION PROCEDURE
A good extraction procedure should be simple, selective and
quantitative. In general, selectivity and quantitative extracta-
bility are more important factors than simplicity. In the case of
atomic absorption, however, simplicity and quantitative efficiency
would be more desirable, because the procedure itself is quite
selective. Bearing this in mind the following extraction procedures
for the extraction of vanadium were examined.

32
1* As 8-hydroxyquinolinate. Vanadium (V) can be quantitatively
extracted from aqueous solution at pH 5 with 1$ 8-hydroxyquinoline in chloroform (3^)* Addition of a masking solution consisting of EDTA
and calcium acetate eliminates a large number of interferences. How
ever, chlorinated solvents are undesirable for use in flames due to
the formation of chlorine gas. This procedure, therefore, would not
be the best choice for atomic absorption spectroscopy. Ethyl acetate
or MIBK could be used for the extraction, but quinolinates have a
tendency to decompose on warming and would thus clog the capillary of
the burner. Moreover,.a careful adjustment of pH is required which
decreases the desirable simplicity of the procedure.
2. Extraction Using a TTA/N-butanol System. Extraction of vanadium
with 2-theonyl trifluoroacetone (TTA) in normal butyl alcohol at
pH was examined. This procedure has been reported to be selec
tive and ions such as Fe+3, Cr+3, Ti+4, Zr44, As+3, Ca+3, Ni+2, Nb45,
Ce+4 and Mn+2 are not extracted (9 ). Unfortunately, quantitative
extraction was not achieved in a single step and this ruled out the
possibility of using this procedure.
3- Extraction as Cupferrate. Extraction of vanadium as cupferrate in
methyl isobutyl ketone (MIBK) from (1+9) sulfuric acid solution (16),
has been found to be very useful for these investigations. This pro
cedure is simple and quantitative separations even at microgram levels
can be obtained in a single extraction. Ethyl acetate or diethyl
ether can also be used for extracting vanadium cupferrate, but, MIBK
is more suitable for flame studies because it has a higher boiling point and the rate of its aspiration is also higher.

Tridecyl Phosphlne Oxide Method. Vanadium (V) can be quanti
tatively extracted from a solution that is O.5M with respect to sulfate and 1M with respect to nitrate by shaking with 0.4M tridecyl
phosphine oxide in kerosene (5^). Such a solvent would be desirable
for establishing reducing conditions in the flame without lowering
the flame temperature to a large extent. 'But, different samples of
kerosens may contain varying amounts of vanadium as impurity and this
would have to be taken into account.
C. ENHANCEMENT OF ABSORPTION SIGNAL BY THE USE OF MIBK
Absorption signals were found to be greatly enhanced when
vanadium was aspirated to the flame as vanadium cupferrate in MIBK.
Results for a solution containing 1000 mg/1 of vanadium are given in
TABLE III. The data for other solvents are also supplied for com
parison purpose.
TABLE III
EFFECT OF ORGANIC SOLVENTS
Concentration of Vanadium
(mg/1)SolventUsed
BoilingPoint
( ° c )
PercentageAbsorption
1000 Acetone 56.2 26
1000 Methanol 6k.7 291000 Ethanol iQ.k 531000 Propanol-2 82. k k$
1000 MIBK 118 57

J>k
These results indicate that solvents with high boiling points may be
useful for developing a sensitive method for the determination of
vanadium by atomic absorption. Consequently, solvents like glycol and glycerol, which, have very high boiling points as compared to many
other organic solvents, were tried. But in these cases very insig
nificant absorption was observed. Aqueous solutions containing
400 mg/1 of vanadium with (a) 20$ glycol and (b) 20$ glycerol showed only 10$ and 11.1|$ absorption respectively. However, considerable
enhancement in the absorption signal was observed when compounds with
high boiling points and long carbon chains like oleic acid were mixed
with the MIBK used for extracting vanadium cupferrate. The effect of
adding oleic acid, linoleic acid or linolinic acid on the absorption
signal of vanadium was studied and the results are given in TABLE IV.
Vanadium was extracted as vanadium cupferrate into a mixture of MIBK
and fatty acid (80:20 by volume). Absorption readings were taken
under optimum conditions.
TABLE IV
EFFECT OF MIXED ORGANIC SOLVENTS
Concentration of Vanadium
(mg/1)Solvent80$
Mixture20$
PercentageAbsorption
100 MIBK + Oleic Acid 32.0100 MIBK + Linoleic Acid 27. k100 MIBK Linolinic Acid 2k.5

35
The presence of about 20$ (v/v) oleic acid in MIBK showed a six to
seven fold increase in the absorption signal. TABLE IV also shows
that increasing the amount of unsaturation in the fatty acid chain
does enhance the absorption signal.
Although oleic acid is miscible with MIBK in all proportions,
larger concentrations of oleic acid cannot be used because its high
viscosity considerably lowers the rate of aspiration of the burner.
Optimum conditions have been established by studying the absorption
of vanadium as cupferrate in MIBK containing varying concentrations
of oleic acid. Studies have been made with flames of four different
compositions. Results are shown in Figure 5> where the absorption
measurements have been plotted against the increasing concentration
of oleic acid in MIBK containing 100 mg/1 of vanadium as cupferrate.
The effect of adding oleic acid to vanadium in methanol,
ethanol and propanol-2 has also been studied because these solvents have been reported to have been used in such studies. Results are
shown in Figures 6, 7, and 8. The optimum concentration of oleic
acid and the flame conditions have been found to vary slightly in all
thfee cases. Approximately five to six fold enhancement of the
absorption signal is observed upon the addition of about 20 to 26$ (V/V) oleic acid to these solvents.
These studies show that the use of a solvent mixture contain
ing 22$ oleic acid and 78$ MIBK (V/V) would be more useful for atomic absorption studies than MIBK alone. Although enhancement of the
absorption signal was quite significant when oleic acid was added to

Concentration of Vanadium = 100 mg/1Flame Composition flow rate (1/min)
Acetylene2.6
Oxygen304. 3-5
x-x 3.5 0-0 3*5a-a 3*5
20Percentage of Oleic Acid Added to MIBK (v/v)
Figure 5
Effect of Addition of Oleic Acid to MIBK Used for ExtractingVanadium Cupferrate, on the Absorption of 3183*9 ^ Line ofVanadium in Oxy-acetylene Flames of Various Compositions.

Concentration of Vanadium = 200 mg/1Flame Composition flow rateOxygen Acetylene
A -aX - X
20" o-oA. - A
10-
10 15Percentage of Oleic Acid in Methanol (v/v)
Figure 6Effect of Addition of Oleic Acid to the Solution of Vanadium inMethanol on the Absorption of 3183*9 & Line of Vanadium in
Oxy-acetylene Flames of Various Compositions.

Absorption
($)
Vanadium Concentration = 200 mg/1Flame Composition flow rates (1/min)Oxygen Acetylene4.04.04.04.0
X -X0-0 & - &
2cr
let
20Percentage of Oleic Acid in Ethanol (v/v)
. Figure 7
Effect of Addition of Oleic Acid to the Solution of Vanadium inEthanol on the Absorption of 3183*9 ^ Line of Vanadium in
Oxy-acetylene Flames of Various CompositionsV>4oo

Absorption
($)
Concentration of Vanadium = 200 mg/1
Flame Compositions flow rate (1/min)
Oxygen Acetylene1CfA - a If.O 3.10 - 0 lf.0 3.6^ - a If .0 k.6X - X If-.O 5.1
H-----------------— I----------------- 1------------------1------------------1-5 10 15 20 25Percentage of Oleic Acid in Propanol-2 (v/v)
Figure 8Effect of Addition of Oleic Acid to the Solution of Vanadium in
Propanol-2 on the Absorption of 3183*9 & Line of Vanadium inOxy-acetylene Flames of Various Compositions.
VjJvo

ko
methanol, ethanol or propanol-2, total absorption from such systems
was quite low as compared to the oleic acid-MIBK system. Therefore,
further studies of these systems were not continued.
D. ROLE OF THE ORGANIC SOLVENTS
The absorption of light signal is proportional to the popu
lation of ground state metal atoms in the flame. The enhancement of
absorption signal associated with the use of organic solvents indi
cates an increased population of ground state metal atoms in the
flame. Methyl isobutyl ketone is not only a good solvent for
extracting vanadium cupferrate, it also has a lower viscosity and
therefore higher aspiration rate than that of an aqueous solution.
Higher aspiration rate means that more analyte goes into the flame
per unit time which would increase the population of metal atoms in
the flame. The use of the organic solvent also provides better
reducing conditions in the flame which are necessary in the study of
refractory metals. Also, the flame temperature is higher due to the
heat of combustion of the solvent and this improves the sensitivity.
In the case of aqueous samples, water has a cooling effect on the
flame. The increase of aspiration rate and small differences in flame
temperature, however, cannot account for the many fold increase of the
absorption signal observed in many cases. The pattern of combustion
of organic solvents and the droplet size formed also seem to be impor
tant controlling factors for atomization. Further enhancement of the
absorption signal by the addition of oleic acid to MIBK indicates that
the combustion pattern must be playing an important role in the pro
cess of atomization, because the addition of oleic acid actually

decreases the aspiration rate. The increased efficiency of atomi
zation may be due to further disintegration of tiny droplets of oleic
acid containing vanadium, higher flame temperature, etc.
Because various physical and chemical properties such as sur
face tension, viscosity, vapour pressure, heat of combustion, etc.,
influence the atomization efficiency, the effect of organic solvents
is very hard to interpret in a direct atomizer-burner flame. The
solvent effect can therefore vary a great deal with the conditions and
thus the experimental results obtained under one set of conditions may
not be valid for another.
E . OPTIMUM CONDITIONS
Absorption for vanadium, from solvent mixture containing 22$
oleic acid and 78$ MIBK (V/V), was measured in some 30 different compositions of oxy-acetylene flames. Results are shown in TABLES V, VI
and VII. All measurements were made with flames in optimum position,
that is, the absorption reading in each case was the maximum that
could be obtained under the given flame conditions.
From the data shown in TABLES V, VI and VII, it is evident
that an oxygen flow rate of 3.5 1/min with an acetylene flow rate of 3*3 1/min provides the optimum flame conditions for maximum absorption
per unit concentration of vanadium. It may also be noted that noise
level, which is oscillation of the needle about the null point,
expressed as percentage absorption, is also quite low. A low noise
level is very important for better precision and reproducibility of the method.

TABLE V
Absorption of 5183.9 A Line of Vanadium
In Oxy-acetylene Flames of Different Compositions
Solvent Used: Mixture of Oleic Acidand MIBK (22:78 V/V)
Concentration of Vanadium: 200 mg/1
Oxygen Flow Rate (1/min)
Acetylene Flow Rate (1/min)
Absorption
(percent)
Noise Level (# abs.)
3 2 .05 17.6 1 .60
3 2 .31 27.6 1.60
3 2 .56 k6.k 2.^5
3 2 .8 2 5O .9 5 .20
3 3 .0 8 3 1 .2 5 .20
3 3-33 it-9.0 5.20
3 3.59 Wf .6 k.10
3 3-85 kl.2 3.52
3 it-. 10 37*2 2.45
Lamp Current Used = 30 mA.
Slit Opening = 0 . 3 mm.
Vanadium extracted as Vanadium cupferrate

TABLE VI
Absorption of 3183.9 A Line of Vanadiumin Oxy-acetylene Flames of Different Compositions.
Solvent Used: Mixture of Oleic Acidand MIBK (22:78 V/V)
Concentration of Vanadium: 200 mg/1
Oxygen Flow Rate (1/min)
Acetylene Flow Rate (1/min)
Absorption
(percent)
Noise Level ($ abs.)
3-5 2 .0 3 9.6 1.1
3-5 2.31 16.5 1.63-5 2 .56 31.9 1.6
3-5 2.82 43.0 2.0
3.5 3.08 55-3 2.0
3-5 3.33 6 0 .9 1.6
3-5 3.59 60.2 1.1
3.5 3.85 58.5 1.1
3.5 4.10 53-2 1.1
3-5 4.36 48.7 1.1
Lamp Current Used z 30 mA.
Slit Opening = 0.3 mm.
Vanadium extracted as Vanadium cupferrate

44
TABLE VII
Absorption of 5185.9 A Line of Vanadium
in Oxy-acetylene Flames of Different Compositions.
Solvent Used: Mixture of Oleic Acidand MIBK (22:78 V/V)
Concentration of Vanadium: 200 mg/1
Oxygen Flow Rate (1/min)
Acetylene Flow Rate (1/min)
Absorption
(percent)
Noise Level ($ abs.)
4 2 .5 6 4.6 0.60
4 2 .8 2 6 .5 0.60
• '4 3-08 11.0 1.10
4 3-33 14.1 1.60
4 3-59 20 .0 2.45
4 3-86 25 .6 2.45
4 4 .1 0 46.8 3.52
4 4 .3 6 53-5 3.52
4 4 .6 2 56.1 3.52
4 4.88 56 .0 4.10
4 5-12 51.0 4.10
Lamp Current Used = 30 mA.
Slit Opening - 0 . 3 mm.
Vanadium extracted as Vanadium cupferrate

As considered in the previous chapter, the population of the
ground state vanadium atoms will not be the same in all parts of the
flame. Therefore, absorption of radiation will also be different in different parts of the flame. Various parts of the flame, of compo
sition mentioned above, were examined. Results are shown in TABLE VUE
and Figure 9*
Lateral displacement of the burner along the path of the light
beam did not affect the absorption so long as the beam of light was
passing through the proper part of the flame.
F. USE OF MULTIPLE BURNERS
A turbulent flow burner system consisting of three Beckman I4O9O atomizer burners (large bore-oxygen/acetylene assembly) mounted in a
row are commercially available and are commonly used with the Beckman
atomic absorption accessory and the Jarrel-Ash atomic absorption
spectrophotometer. Such a system was used by Fassel and Mossoti (13) for observing the absorption signal of vanadium and certain other
refractory metals. Absorption studies for vanadium were made using
the system developed with one, two and three burners respectively.
The results are shown in Figure 10. This figure shows three calibra
tion curves obtained using one, two and three burners respectively.
Considerable enhancement of the absorption signal has been achieved
by the use of three burners in a row, and a resultant sensitivity of
O .72 mg/1 for one per cent absorption was obtained. While using two
or three burners in a row, oxygen and acetylene flow has to be adjus
ted such that each burner takes about 3*5 1/min of oxygen and 3.3 1/min of acetylene.
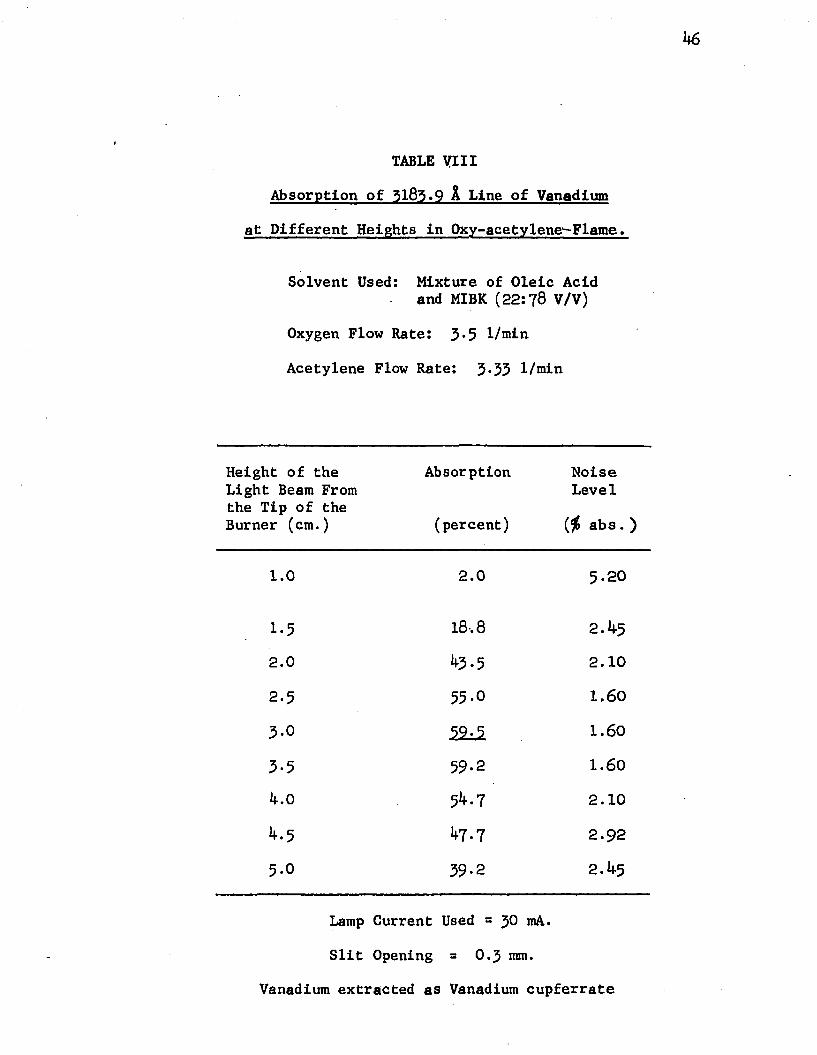
TABLE VIII
Absorption of 5185.9 A Line of Vanadium
at Different Heights in Oxy-acetylene-Flame.
Solvent Used: Mixture of Oleic Acidand MIBK (22:78 V/V)
Oxygen Flow Rate: 3-5 1/min
Acetylene Flow Rate: 3*33 1/min
Height of the Light Beam From the Tip of the Burner (cm.)
Absorption
(percent)
NoiseLevel
($ abs.)
1.0 2.0 5-20
18,8 2.^52.0 43.5 2.10
2-5 55.O 1.603-0 1.60
3-5 59-2 1.60U.o 5^-7 2.104.5 ^7-7 2.925.0 39-2 2.if5
Lamp Current Used = 30 mA.
Slit Opening = O .3 mm.Vanadium extracted as Vanadium cupferrate

Absorption
($)
V7
Concentration of Vanadium = 200 mg/1
50-.
Flow Rates
Oxygen Acetylene
3.5 1/min 3.3 1/min
20..
Vanadium Present as Vanadium Cupferrate
10..
Height of the Light Beam From the Tip of the Burner (mm)
Figure 9Effect of Variation of Burher Height on
the Absorption of 3185*9 ^ Line of Vanadium.

Abso
rban
ce
1*8
Obtained with one Beckman Burner
Obtained with two Beckman Burners
Obtained with three Beckman Burners
Sensitivity
1. 2.1 mg/1 (for 1$ absorption)2. 1.08 mg/1 (for 1# absorption)3. O .72 mg/1 (for 1$ absorption)
20 IfO 60
Concentration of Vanadium (mg/1)
Figure 10
Calibration Curves

49
G. STUDY OF INTERFERENCES
The use of the extraction procedure eliminates a large
number of possible interferences by cations and anions. The
following cations, however, may be extracted along with vana
dium (V) under the conditions described for the extraction.
Their effect on the absorption of 3183*9 A line of vanadium was studied. Results are shown in TABLE IX.
The presence of an excess of cupferron is desirable in
all the cases and it is essential if iron, bismuth or antimony
is present because these ions are preferentially complexed under
the given conditions. Zirconium forms a white precipitate
which can be very easily removed by passing the solution through
a funnel with its stem plugges with glass wool.
H. PROCEDURE FOR THE ANALYSIS OFVANADIUM IN WATER SAMPLES
A method is described which is very suitable for the
determination of vanadium in water samples. Vanadium concen
trations as low as 1 mg/1 can be very easily determined. Fifty milliliters of water containing 1 mg/1 of vanadium was taken, the vanadium was extracted into 3 nil of mixed organic solvent (oleic acid + MIBK,22:78 V/V) as vanadium cupferrate and was
determined using a two-burner assembly. The method described is
quite accurate and reproducible. Results of a few analyses are shown in TABLE X.

50
TABLE IX
Effect of Interfering Ions on the Absorption
of 3185.9 A Line of Vanadium
Concentration of Vanadium: 100 mg/1
Concentration of Interfering Ion: 1000 mg/1
Interfering Ion Present
Absorption in Presence of Interfering Ion
(percent)
AbsorptionWithoutInterfering Ion
(percent)
Sb+3 t o . 6 t o .5Cu+2 39.9 t o .5W04-2 39-7 to. 5Bi+3 lH .3 to . 5Th+4 t o . 6 t o .5M0O4”2 t o . 3 t o .5U02+2 t o A t o .5Sn+4 39.8 t o .5Ti+4 39.9 t o .5Fe+3 39.9 t o .5Zr+4 t o . 3 t o .5

51
TABLE X
DETERMINATION OF VANADIUM IN WATER SAMPLES
Vanadium Number of VanadiumTaken Determinations Found(mg/1) (mg/1)
1 10 1.03 ± 0*°6
3 10 3.10 + 0.09

CHAPTER VI
RING OVEN TECHNIQUE
A. INTRODUCTION
The first paper describing the ring oven technique was pub
lished by Weisz in 195^- (55)* Originally, this method was developed
as a qualitative separation technique for extremely small samples.
Soon after its introduction, applications began to appear in various
other branches of analytical chemistry. Qualitative and quantita
tive as well as inorganic and organic studies have now been developed.
Lack of sufficient test material is frequently a disadvantage,
especially when complex mixtures are to be studied. The ring oven is
a simple apparatus which has proved to be useful for the detection
and determination of various, elements by chemical methods where only
very small quantities of test material are available. The ring oven
not only enables one to concentrate the test material into a ring of
very small v area, it also makes possible the application of separa
tion techniques such as solvent extraction and precipitation to very
small quantities of test material (in the nanogram to microgram
range). The method has found application in the following fields of
analysis.
B. QUALITATIVE ANALYSIS
(1) Metal ions: Filter paper has been cotamonly used for spot
reactions in cases where the reaction product is either a colored

53
insoluble product or has a pronounced tendency to adsorb on the filter
paper. Where the reaction product does not meet these requirements,
spot tests may be carried out on a spot plate in a small test tube,
so that the presence of the reaction product can be determined. The
ring oven can, however, be used to concentrate the reaction product
in a small ring area,and thus enhance the sensitivity of the test.
West and Mukherji (58) have developed a procedure for the separation and microidentification of as many as 35 metal ions in a single drop
of test solution. Their procedure combines solvent extraction with
the ring oven technique. Matic (32) has developed a procedure for the routine analysis of technical uranium solutions. He analyzed
solutions from 17 uranium producing mines for the presence of 28 elements by this method.
(2) Anions: In I96I, Weisz (52) mentioned some 23 identification reactions for anions in his monograph. Since then, very few
further applications have been made. Musil, Haas and Drabner (38) have reported a separation scheme for 8 common anions (bromide, iodide,
thiocyanate, sulphate, chromate, phosphate, arsenate and hexacyano-
ferrate (II)) contained in a single drop of solution. Another syste
matic scheme for the analysis of common anions has been worked out by
Biswas, Munshi and Dey (2). Mooney has developed an exclusion system
by which 12 anions can be identified by employing a number of single tests performed in certain sequence. Separation of these anions is
not necessary in such a procedure. Ions identified in this scheme
are nitrate, borate, silicate, phosphate, sulphate, molybdate, fluo
ride, cyanide, chromate, bromide, iodide and chloride.

5^
C. QUANTITATIVE DETERMINATION
Spot colorimetry is a promising quantiative analytical method.
Ring oven methods are not different from spot colorimetry in principle. However, they are more sensitive because the constituents of the
spot are concentrated into a ring of much smaller area as compared to
that of the spot. Analysis at submicrogram levels can easily be
performed by means of ring oven and quantitative results are obtained
quickly, easily and very clearly.
In this type of analysis, rings of unknown concentrations are
visually matched against the rings of standard concentrations.
Ottendorfer (37) compared the visual measurements of the rings
against instrumental density measurements. He found that mere visual
comparison of the rings is at least equal if not superior to the
instrumental measurements.
Often, several procedures can be developed for the determina
tion of any particular ion by choosing a suitable chemical reaction
and separation or masking procedure. This choice, of course, depends
upon the type of interfering ions likely to be present in the sample
and the sensitivity required.
D. TRACE ANALYSIS
| Feigl and West (14) in 1957 pointed out the possibility of
using the ring oven in trace analysis. Since then, this simple tech
nique is becoming more and more popular. Already about 75 papers
have appeared dealing with trace analyses by the ring oven technique.

55
E. AIR POLLUTION STUDIES
Ring oven methods can be very useful for air pollution studies.
The analysis of airborne particulates and aerosols is one of the most
important problems of chemical analysis. It is very important to con-\
trol the impurities in air for public health and hygiene.
Although relatively large amounts of sample can be collected
by the use of high volume samplers over an extended period of time,
it is more desirable to collect smaller samples during brief sampling
periods, if methods for analysis of these small samples are availa
ble. Such methods should be capable of isolating, concentrating,
identifying and determining small quantities of various materials
present in the air. The ring oven technique in conjunction with
several sensitive chemipal reactions, now well known, fulfills these
conditions and can therefore be used in this field with advantage.
Methods for the estimation of antimony (56), beryllium (57)/ selenium (54), caffeine (59)> and sulfate (22), in air have been
worked out.
F. RADIOACTIVE SUBSTANCES
The ring oven also provides a simpler approach for the deter
mination of radioactive material. A simple procedure for such
analysis is as follows:
A standard scale is prepared by making rings of 1,2,4,6,8,10
and 19 microliters of standard solution of the radioactive substance. These rings are exposed to X-ray film for certain known periods of
time and the corresponding rings are developed on the film. Then,
three similar autoradiographs are prepared under similar conditions

56
with different but known volumes of sample solution. These unknown
rings are matched with rings of the standard scale. Concentration of
the unknown solution can easily be calculated from the known concen
tration of the matching rings. This method gives good results but it is time consuming.

CHAPTER VII
DETERMINATION OF VANADIUM BY THE RING OVEN TECHNIQUE
A. INTRODUCTION
If the total quantity of sample material available is very
small, spectrographlc and neutron activation procedures are the
only ones of the various procedures discussed in Chapter II that
would be capable of determining trace quantities of vanadium
present. Both of these techniques require very expensive equip
ment and highly trained personnel. The ring oven technique, as
already discussed, provides a sensitive means for the determination
of metals such as vanadium. As little as O.l^g of vanadium present
in a microliter of solution can be determined.
West and Conrad (55) reported a selective spot test for the
detection of vanadium. They found that a yellow precipitate is formed between a-Benzoinoxime and vanadate ion in acidic solution.
Probably there is anhydride formation between the -OH groups of the
metalloacid and -OH or -NOH group of the benzoinoxime molecule.
57

58
This reaction has been used to develop a procedure for the determina
tion of vanadium (V). The selectivity of this procedure is further
enhanced by extracting the yellow precipitate with benzene and the
sensitivity is increased by concentrating the product into a ring.B. EXPERIMENTAL
Reagents: a-Benzoinoxime; saturated solution in ethanol.
Benzene.
Standard vanadate solution; prepared by dissolving
0.2298 g of pure dry ammonium metavanadate in 3N sulfuric acid such that the final volume of solution be 1 liter. Solution contains 0.1p,g of
vanadium per microliter.
Apparatus: Weisz ring oven with accessories (National
Appliance Co.)
Surface thermometer (Pacific Transducer Corp.,
Model 311F. )
Hair drier.
Lambda pipets and solvent pipets.
Schleicher and Schuell filter paper No. 595 of 5*5 cm diameter.
C. PROCEDURE FOR PREPARING RINGS
Place a filter paper, the center of which has been previously
marked with a sharp pencil or a pin, on a ring oven maintained at
about 100°C. The temperature of the ring oven can be easily adjusted
by means of a powerstat and measured with a surface thermometer
1

59
placed on the hot surface of the ring. Two microliters of a satu
rated solution of a-benzoinoxime in ethanol is placed on the center
of the filter paper by means of a lambda pipet passing through the
guide tube of the ring oven as shown in Figure 11/. After placing
a-benzoinoxime at the center, one or more jils of solution containing
vanadium (V) is slowly added to the center of the filter paper. A
very faint yellow spot may appear at the center. The spot at the
center is thoroughly washed with benzene which is added by means of
a solvent pipet passing through the guide tube. The rate of addition
of benzene is so adjusted that it evaporates as soon as it reaches
the edge of the ring zone. If the rate of addition is very slow,
benzene will evaporate before reaching the edge of the ring oven and
the ring obtained will be diffused. Also, if the rate of addition
of benzene is too rapid, the benzene will pass over the edge and
evaporate quickly on the hot surface, thus, resulting in a
diffused ring. The time sequence of successive washings can be
easily adjusted with very little practice. As benzene spreads on
the paper it dissolves the yellow compound formed between vanadium(V)
and a-benzoinoxime. When the benzene solution reaches the hot cir
cular edge of the ring zone, the solvent evaporates leaving behind a
yellow ring. The intensity of the color of the ring is proportional
to the concentration of vanadium present in the solution.
D. ANALYSIS OF AN UNKNOWN
The general procedure described earlier is followed for the
preparation of each ring. The standard scale is conveniently pre
pared by making rings with 0,1,2,^,8 and 10 |J,1 drops of solution

6o
CAPILLARY PIPET
GUIDE TUBE
RETAINER RING
AUXILIARY RING
HEATING BLOCK
POWER CORD
X FILTER PAPER
Figure 11.
THE RING OVEN

61
containing 0.1|i)g/|xl of vanadium (V). In each case, two microliters
of tt-benzoinoxime solution is used. The product is stable and the
rings of standard scale can be stored for a number of days for com
parison with those of unknown concentration. For the best results,
the unknown solution containing vanadium (V) should be 3N with respect
to sulfuric acid. A ring is made from 1 |il of unknown solution vana
dium (V) and matched with the standard scale.
In general, when a ring is made from one drop of unknown
solution and compared with the standard scale, three possibilities can
arise:
(1) The ring is less intense than standard ring of 1 y-1;
hence the unknown solution is weaker than the standard solu
tion and the ring must be made with larger volume of unknown
solution, say 5*6,10 |ils or even more.
(2) The ring is more intense than the standard ring of 10|j,ls;
in such a case the concentration of the unknown solution is
more than ten times that of the standard solution and the
unknown solution should be diluted such that the unknown rings
fall within the range of scale.
(3) The ring fits into the scale; in such a case the ring is. . . . W .matched on the. scale and an estimate can be easily made about
the concentration of the unknown solution.
For more accurate analysis the following procedure is recommended.
Let the rings of standard scale be numbered I, II, III,— X,etc.
according to the increasing amount of vanadium present in the rings.
Now make three rings with different numbers of microliter portions of

62
the unknown solution, say 1, 2 and 3 M<ls of the solution such that the intensity of these rings falls within the range of the standard
scale. For example, unknown ring with 1 p,l may match with ring II
of the standard scale and unknown rings with 2 and 3 M-ls may match with rings V and Vfl, respectively.
TABLE XI
DETERMINATION OF THE CONCENTRATION OF UNKNOWN SOLUTIONS
Volume of Solution
m
UnknownUsed
Matching Ring on
Standard Scale
Amount of Vanadium in Standard Ring
(M.g)1 II 0.22 V 0.5
3 VI 0.6
TOTAL 6 1-3
Concentration of the unknown solution = I.3/6 = 0.22 (J.g/p.1.
E. RESULTS AND DISCUSSION
Accuracy and reproducibility of the method for microdeter
mination of vanadium were ascertained by the procedure described
above. Results are shown in TABLE XII.

65
TABLE XII
DETERMINATION OF VANADIUM
Taken Found8(Hg) (M)
0.3 0.508 + o.oi3bO .5 0A9I4. + 0.011
a. Based on averaging 5 values calculated from three rings each.
b. Calculated at 90$ confidence limit.
F. SELECTION OF FILTER PAPER
Many qualities of filter papers were examined, and those
checked were found to be free of vanadium contamination. Because
washing with organic solvents having low boiling points like
benzene is very easy and does not effect the strength of the paper,
most filter papers were found to be suitable. In the present
investigation, however, Schleicher and Schuell No. 595 filter paper
of 5*5 cm diameter was used.

6k
G. STUDY OF INTERFERENCES
The interference effects of the following ions were
examined:
Group I. Li+, Na+, K+, CU+2, Rb+, Ag+, Cs+ and Au+3.
Group II. Be+2, Mg+2, Zn+2, Sr+2, Ca+2, Cd+2, Ba+2 and Hg+2 . Group III. A1+3, Ga+3, Ce+4 and T1+.Group IV. Si03"2, Ti+4, Ge03"2, Zr+4, Sn+4, Pb+2 and Th+4.Group V. NH4+, N03“, HP04"2, As+5, Sb+5 and Bi+3 .Group VI. S04"2, Cr04"2, Se04"2, Mo04“2, Te04“2 and W04-2.Group VII. Cl", C104”, Mn+2, Br", Br03~, and I03“.
Group VIII. Fe+3, C0+2, Ni+2 and Pt+4.H. METHOD OF TESTING INTERFERENCES
The effect of interfering ions was investigated by preparing
two rings for each ion. One ring contained 10 g of interfering ion
and the other ring was prepared with 1 |jl1 of solution containing 0-5 ^g of vanadium and 10 (xg of interfering ion. These two rings
were matched with blank and standard ring (containing 0.5 M-g of vanadium) respectively.
I. RESULTS OF INTERFERENCE STUDY
Among the ions tested only Fe+3 slightly intensifies theI—yellow color of the ring. This interference was easily overcome by
adding a few drops of JN H3P04 to the unknown solution until the pale yellow color, due to iron, disappeared. Acidity of unknown
solutions is an important factor. If the solution is not properly
acidic, i.e. 3N with respect to HsS04, copper ions may interfere with the test.

SELECTED BIBLIOGRAPHY
1. Amos, M.O., and Thomas, P.E. "Determination of Aluminum in
Aqueous Solution by Atomic Absorption Spectroscopy," Anal.
Chim. Acta, XXXII (I965), 139-
2. Biswas, S.D., Munshi, K.N. and Dey, A.K. "A Systematic Scheme
for the Analysis of Common Anions Using the Weisz Ring-Oven
Technique," Mikrochem. Ichnolyt Acta, (1963); bO.
3 . Black, R.H. and Forsyth, W.J. "The Determination of Sulfur
and Vanadium in Carbon Material by X-Ray Fluorescence
Analysis," Norelco Reptr., VI (1959); 53*
k. Brooksbank, W.A., Leddicotte, G.E. and Mahlman, H.A. "Analysis
for Trace Impurities by Neutron Activation," J. Fhys. Chem.,
LVII (1953); 815.
5 . Budevsky, 0. and Johnova, L. "Colorimetric Determination of
Vanadium (V) with 4(2-Pyradylazoresorcinol)," Talanta, XII
(1965), 29.
6. Cooper, M.D. and Winter, P.K. "Determination of Vanadium as
Phosophotungstovanadate," Anal. Chem., XXI (19^9); 6 0 5.
7* Costello, R. L. and Currani, G.L. "Reduction of Excess
Cholesterol in the Rabbit Aorta by Inhibition of Endogenous
Cholesterol Synthesis," J. Expt. Med., XXVII (1956); ^9*
65

66
8 . Davis, E.N. and Hoeck, B.C. "X-ray Spectrographic Method for
the Determination of Vanadium and Nickel in Residual Fuels
and Charging Stock," Anal. Chem., XXXVII (1955) ^ 1880.9. Dey, A.K. and Rahaman, M.S. "Rapid Extraction and Spectro-
photometric Method for the Determination of Vanadium (V)
with 2-Thenoyltrifluoroacetone," Anal. Chem., XXXV (I963),
1095.10. Dev, B. and Jain, S.D. "Spectrophotometric Determination of
Vanadium (V) with Rutin (Quercetin 3“R-utinoside)," Proc.Ind. Acad. Sci., (1963), 1̂ 2.
11. Dryoff, G.V. and Skiba, P. "Determination of Trace Amounts
of Iron, Nickel, and Vanadium on Catalysts by Fluorescent
X-ray Spectrography," Anal. Chem., XXVI (195*0* l77**-«
12. Elwell, W.T. and Gidley, J.A.F. Atomic-Absorption Spectro
photometry. New York: The Macmillan Company, I962. pp. k2-k^.
13* Fassel, V.A. and Mossotti, V.G. "Atomic Absorption Spectra
of Vanadium, Scandium, Yttrium, and Rhenium," Anal. Chem.,
xxxv (1963), 252.114-. Feigl, F. and West, P.W. Trace Analysis. Editors: Yoe, J.H.
and Koch, H.J.,Jr., New York: John Wiley and Sons, Inc.,I957. p. I65.
15. Furman, N.H. "Application of Ceric Sulfate in Volumetric
Analysis," J. Am. Chem. •Soc., L (I928), 1675*16. Furman, N.H., Mason, W.B. and Pekola, J.S. "Extraction of
Cupferrates," Anal. Chem., XXI (l9*<-9)> 1325.

67
17* Gale, R.H. and Mosher, E. "Determination of Milligram
Quantities of Vanadium in the Presence of Uranium,"
Anal. Chem., XXII (19^0), 9^2.
18. Goddu, R.F. and Hume, D.N. "Determination of Small Amounts
of Vanadium in Steel by Photometric Titration," Anal. Chem.,
xxii (1950), 131 .̂
19. Harvey, G.E. Spectrochemical Procedures. Glendale, Calif.:
Applied Research Laboratory. 1950* p*103-
20. Herrmann, R;- and Alkemade, C.T.J. Chemical Analysis by Flame
Photometry. Second Edition. New York: Interscience Pub
lishers, 1963* p.515.21. Hillebrand, W.F., Lundell, G.E.F., Bright, H.A. and Hoffman, J.I.
Applied Inorganic Analysis. Second Edition. New York: John
Wiley and Sons, Inc., 1953* p.^60.
22. Huygen, C. "The Determination of Sulphate by the Ring OvenTechnique and Its Application to Air Pollution Measurements,"
Mikrochem. Ichnoanalyt. Acta, (1963); 6.
23* Kitagawa, H. and Shibata, N. "Spectrophotometric Determination
of Vanadium by Extraction of Tungstovanadophosphoric Acid
with Ethyl Methyl Ketone," Japan Analyst, VII (I958), 62k.2k. Kolthoff, I.M. and Elwing, J. Treatise on Analytical Chemistry-
Part II. VIII, I963. p.223.25* . Treatise on Analytical Chemistry-Part II. VIII,
1963. p.238.26. Kolthoff, I.M. and Lingane, J.J. Polarography. Second Edition.
New York: Interscience Publishers, II, 1952. pp. ^7-^52.

68
2J. Leliaert, G., Hoste, J. and Eeckhaut, J. ,rActivation Analysis
of Vanadium in High Alloy Using Manganese as Internal
Standard," Anal. Chim. Acta, XIX (1958)* 100.
28. Lingane, J.J. and Meites, L.,Jr. "Polarographic Determination
of Vanadium in Steel and Other Ferro Alloys," Anal. Chem.,
xix (1947), 159.29* Majumdar, A.K. and Savariar, C.P. "Pyrocatechol Violet As a
Colorimetric Reagent for Estimation of Vanadium, Molybdenum
and Tungsten," Naturwissen Schaften, XLV (1958), 8 -̂.
30. Majumdar, A.K. and Das, G. "Spectrophotometric Determination
of Vanadium with N-Benzoyl-o-Tolyl Hydroxylamine," Anal.
Chim. Acta, XXXI (196 )̂, lVf.
31. Makoto, 0. "Spectrophotometric Determination of Vanadium (IV)
with Xylenol-Orange," Bull. Chem. Soc. Japan, XXXVI
(1963), 137.
32. Matic, M. "Qualitative Analysis of Uranium Solution by Weisz
Ring-Oven Technique," J.S. African Chem. Inst., XIV
(1961), 100.33* Methods of Analysis Committee. British Iron and Steel Associa--
tion. J. Iron Steel Inst. (London), CLXX (I952), 3^3*
3^. Morrison, G.H. and Freiser, H. Solvent Extraction in Analytical
Chemistry. First Edition. New York: John Wiley and Sons,
Inc., I957. p. 2Mf.35* Musil, A. and Haas, W. "Determination of Vanadium with
N-Benzoyl-N-Phenyl Hydroxylamine," Mikrochim. Acta, VI (1957), 803.

69
36 . Musil, A., Haas, W. and Drabner, J. "Trennung Von Anionen
mit Hilfe des Ringofens," Mikrochlm. Acta, (I962), 1121.
37* Ottendorfer, L.J. Proceedings of Felgl Anniversary Symposium.
Amsterdam: Elsevier Publishing Co. I962. p. 100.38. Parks, T.D. and Agazzl, E.J. "Determination of Small Amounts
of Chromium and Vanadium by Amperometric Titration," Anal.
Chem., XXII (I95O), II79.39' Rankama, K. and Shama, Th.G. Geochemistry. Chicago: Univ.
of Chicago Press. 19^9* P* 38.1<0. Robinson, J.W. and Kevan, L.J. "Further Observations in
Atomic Absorption Spectroscopy," Anal. Chim. Acta, XXVIII
(1963), 170.41. Schoffmann, E. and Malissa, H. "Beitrag zur Flammen
Photometrischen Bestimmung Kleiner Mengen Metalldiathyl-
dithiocarbamat nach Extraction mit Tetrachlorkohlenstoff,"
Mikrochim. Acta, (I96I), 319*42. Scott *s Standard Methods of Analysis. Sixth Edition. New
York: D. Van Nostrand Co., Inc., I, 1962. p. 1210.43. Skinner, D.A. "Chemical State of Vanadium in Santa Maria Oil,"
Ind. Eng. Chem., XLIV (1952), H 59.44. Slavin, W. and Manning, D.C. "Atomic Absorption Spectrophoto
metry in Strongly Reducing Oxy-acetylene Flame," Anal. Chem.,
xxxv (1963), 253.45. Stander, C.M. "Extraction and Flame Spectrophotometric Deter
mination of Vanadium," Anal. Chem., XXXII (i960), I296.

70
46. Talvitie, N.A. "Colorimetric Determination of Vanadium with
8-Quinolinol," Anal. Chem.. XXV (1953)* 604-.
4-7* Treadwell^ W.D. "Reduction mit Cadmium und Blei in der
Massanalysis III," Hel. Chim. Acta, V (1922), 732 + 806.
48. Vinogradov, A.P. "Distribution of Vanadium in Organism,"
Compt. Rend. Acad. Sci. U.S.S.R., III (1934-), 454-.
4-9> Walsh, A. "The Applications of Atomic Absorption Spectra
to Chemical Analysis," Spectrochimica Acta, VII (1955)* 108.50. Weisskopf, V., and Wigner, E. "Uber die Naturliche Linien-
breite in der Strahlung des Harmonischem Oszillators,"
Zeitschrift fur Physik, LXV (I93O), 18.
51. Weisz, H. "Recent Developments in Ring Oven Technique,"
Talanta, XI (1964), 1060.
52. ___________. Microanalysis by the Ring Oven Technique. First
Edition. New York: Pergamon Press, I96I. pp. 56-62.53* ___________ • "Aus Fuhrung von Trennungen in Einem Tropfen,"
Mikrochim. Acta, (1954), 140.
54. West, P.W. and Cimmerman, Ch. "Microdetermination of Selenium
with 3* 3 1 -Diamino Benzidine by the Ring Oven Technique and Its Applications to Air Pollution Studies,11 Anal. Chem.,xxxvi (1964), 2013.
55. West, P.W. and Conrad, J. "Detection of Vanadium by Means of
Spot Tests," Mikrochemie Vereinigt mit Mikrochimica Acta,xxxv (1950), 4.
56. West, P.W. and Llacer, J.J. "Determination of Antimony by the
Ring Oven Technique," Anal. Chem., XXXIV (1962), 555*

71
57* West,- P.W. and Mohilner, P.R. "Estimation of Beryllium with Eriochrome Cyanine R. Using the Ring Oven Technique," Anal.
Chem.. XXXIV (I962), 558.58. West, P.W. and Mukherji, A.K. "Separation and Microidentifi
cation of Metallic Ions by Solvent Extraction and Ring'Oven
Techniques," Anal. Chem.. XXXI (1959), 9^7.
59. West, P.W. and Ordoveza,F. "Microdetermination of Caffeine
(in air) by Using the Ring Oven Technique," Anal. Chim. Acta,
xxx (196IO, 9̂ 7.60. Williams, G.W.M. Trace Elements in Food. New York: John Wiley
and Sons, Inc., 19^7• P*^7*61. Willis, J.B. "The Nitrous Oxide-Acetylene Flame in Atomic
Absorption," Letter to Nature. (In press).
62. Wright, E.R. and Mellon, M.G. "The Phosphotungstate Method
for Vanadium," Ind. Eng. Chem.. Anal. Ed., IX (1957), 251.
65. Wright,' E.R. and Mellon, M.G. "The Peroxide Method for
Vanadium," Ind. Eng. Chem., Anal. Ed., IX (1957); 575-
6k, Woodson, T.T. "A New Mercury Vapor Detector," The Review
of Scientific Instruments, X (1959); 5^8.

VITA
Sham Lai Sachdev was born at Hoshiarpur, India, on
December 21, 1957* He graduated from D.A.V. High School at
Hoshiarpur in April, 195^* He then joined Panjab University
at Chandigarh, India and received a B.S.(Hons.) and M.S. in
the years 1959 ^9^0, respectively. From October, i960 toAugust, I96I, he worked as a chemistry teacher at D.A.V. College Chandigarh. In September I96I, he entered the graduate school of Louisiana State University, Baton Rouge, and is presently a
candidate for the degree of Doctor of Philosophy in chemistry.

EXAMINATION AND THESIS REPORT
Candidate: sham Lai Sachdev
Major Field: Chemistry
Title of Thesis: jjew Methods for the Determination of Trace Quantities of Vanadium
Approved:
[/J - Ia J —Major Professor and Chairman
Dean or the Graduate School
EXAMINING COMMITTEE:
,iejnc a
7JL.
Date of Examination:
Friday, December 17, 19^5
Recommended


