Embed Size (px)
Citation preview

P a g e | 812
Received: 19 July 2021 Revised: 07 September 2021 Accepted: 01 October 2021
DOI: 10.22034/ecc.2021.300477.1224
Eurasian Chem. Commun. 3(2021) 812-830 http:/echemcom.com
FULL PAPER
Determination of trace metformin in pharmaceutical preparation using molecularly imprinted polymer based pvc-membrane
Shams Aws Ismaeel* |Yehya Kamal Al-Bayati
Department of Chemistry, College of Science,
University of Baghdad, Baghdad, Iraq
*Corresponding Author:
Shams Aws Ismaeel
Tel.: +009647704664573
Polymerization of precipitation was used to make liquid electrodes with metformin (MET) imprinted polymers. Lev was used as a template to make molecular (MIP) and non-imprinted (NIP) polymers. In the polymerization process, methyl methacrylate (MMA), acrylamide (AM), ethylene glycol dimethacrylate (EGDMA), and benzoyl peroxide (BPO) were employed as monomers, cross-linkers, and initiators. Using Di B Sabacat (DBS) and Di methyl adipate (DMA) as plasticizers in PVC matrix, the molecularly imprinted membranes and the non- membranes were prepared. The liquid electrodes' slopes and detection limits were -28.03 – -19.45 mV/decade and 3×10⁻⁵ M–7×10⁻⁵ M, respectively, and their reaction time was about 1 minute. Liquid electrodes were filled with 0.1 M standard drug solution, and their response was consistent throughout a pH range of 1.5 to 10.0, with high selectivity for several types. The electrodes developed have been effectively used in the production of pharmaceutical samples for analyte analysis without the need for time-consuming pretreatment.
KEYWORDS
Liquid electrodes; metformine (MET); (MIP); acrylamide (AM); ethylene glycol dimethacrylate (EGDMA); benzoyl peroxide (BPO).
Introduction
Metformin, marketed under the trade names
Glucophage and others, is the first-line
therapy for type 2 diabetes, particularly in
overweight people [1,2,3,4]. It is also used to
treat polycystic ovarian syndrome (PCOS) [5].
It is taken by mouth and is not linked to weight
gain [6]. It is occasionally used as an off-label
supplement to help patients who take
antipsychotics and phenelzine to avoid
gaining weight [7]. Metformin (Figure 1) is a
medication that is typically well tolerated [8].
Diarrhea, nausea, and stomach discomfort are
all common side effects. It has a minimal
chance of inducing hypoglycemia. If the drug is
given in excessively large dosages to people
who have significant renal issues, a high blood
lactic acid level can occur [9]. It is not advised
for people who have severe liver disease.
Metformin is a kind of antihyperglycemic drug
known as a biguanide. Molecular imprinting is
a new approach for creating polymers with
distinct molecular characteristics for a specific
medication, its analogs, or an enantiomer [10].
Molecularly imprinted polymers (MIPs) are
made. In a suitable solvent, a template
molecule is combined with functional
monomers, a cross-linker, and an initiator
[11]. Aprotic and non-polar solvents are used
most of the time. The extraction of the
template molecule after polymerization
exposes recognition holes that complement
the template molecule's shape, size, and

P a g e | 813 S.A. Ismaeel and Y.K. Al-Bayati
chemical activity, allowing the resultant
polymers to preferentially rebind the template
molecule from a mixture of closely similar
molecules [12].
FIGURE 1 Chemical structure of the metformin
For metformin determination, several
analytical techniques were employed,
including chromatography [10], high-liquid
chromatography (HPLC) and molecular
absorption, flow injection [11,12], and
potentiometric method [13,14]. On the other
hand, such procedures are differentiated by
the time and effort required to prepare the
sample for analysis, as well as the high cost of
instrumentation. A novel metformin-selective
membrane electrode (MET-MIP+DBS or DMA)
for the PVC membrane process was developed
in this work.
Experimental
Chemicals and materials
Company of Drug Manufacturing and Medical
Supplies provided metformin (IRAQ- SID-
Samara). Metformin 850 mg from (Berlin-
Chemie AG Berlin-allemagne) and
METFORMIN 500 Merck Serono KGaA,
Darmstadt from (Germany) are two generic
metformin tablets available in local
pharmacies. Sigma-Aldrich provided them,
and they were utilized as directed. From
Sigma-Aldrich, methyl methacrylate (MMA),
acrylamide (AM) (99%), monomer ethylene
glycol dimethacrylate (EGDMA) (99%), and
benzoyl peroxide (BPO) (78%) were used. The
chemical used was the largest purity reagent
and was used when obtained without further
purification.
Apparatus
A digital voltmeter (HANA pH211instrument
Microprocessor pH meter) was used to
perform potentiometric measurements.
Digital pH meters (wissenschaftlich-
TechnischeWerkstätten GmbH WTW pH
meter in lab pH720-Germany) were used for
pH measurements. Electrode efficiency was
investigated by calculating the potential of
levofloxacin solutions at ambient temperature
with a variety of concentrations from 5×10⁻⁴
M to 10-1 M. Every solution was stirred, and
the reading potential was recorded at
equilibrium. The calibration curves were
obtained by plotting the response against the
levofloxacin concentration logarithmic
functions.
Preparing of standard solutions for ISEs studies
1- A standard solution of 0.1 M metformin was
prepared by dissolving 1.290 gm standard
metformin in methanol and in the volumetric
flask completed to 100mL. Other solutions
(5×10⁻⁵ – 10-1) M were prepared in 100 mL
with the same procedure.
2- Methyl prarben (1×10⁻¹ M) solution was
prepared by dissolving (1.521 g) of Methyl
prarben in 100 mL of deionized distilled water
in volumetric flask of 100 mL. A series of
solutions has been prepared from (1×10⁻¹ M)
of Methyl prarben.
3- Propyl prarben (1×10⁻¹ M) solution was
prepared by dissolving (1.802 g) of Propyl
prarben in 100 mL of deionized distilled water
in volumetric flask of 100 mL. A series of
solutions have been prepared from (1×10⁻¹ M)
of Propyl prarben.
4- Tri sodium citrate (1×10⁻¹ M) solution was
prepared by dissolving (2.5807 g) of Tri
sodium citrate in 100 mL of deionized distilled
water in volumetric flask of 100mL. A series of
solutions has been prepared from (1×10⁻¹ M)
of Tri sodium citrate.
5- The stock standard solution of 1×10⁻³ M,
1×10⁻⁴ M, phospho molybdic acid was

P a g e | 814 Determination of trace metformin in pharmaceutical…
prepared by dissolving 1.1288 g, 0.11288 g,
respectively, in distilled water and completed
to 100 mL.
6- Hydrochloric acid (1N and 0.1N) was
prepared from (8.36 mL and 0.836 mL) of
concentrated HCl, respectively, and was
diluted by deionized water to 100 mL.
7- Sodium hydroxide (1N and 0.1N) was
prepared from (4 gm and 0.4 gm) of
NaOH respectively and diluted by deionized
water to 100 mL.
Synthesis of the imprinted polymer (MIP)
The first molecularly imprinted polymer
(MET-MIP1) was formulated using a bulk
polymerization technique in a 50mL screw cap
glass test tube (50 mL); MIPs for The template
(MET) 0.127 mmol (0.016 g) was dissolved in
a thick walled glass tube in 2 mL of methanol
(CH3OH), 2.5 mmol (0.25) g methyl
methacrylate A functional monomer, cross-
linker N,N methyleneediacrylamide (N, N-
MDAM) 14 mmol (2.15) g and 0.08 mmol
(0.01g) benzoyl peroxide as initiator (BPO).
But while the second molecularly imprinted
polymer metformin (MET-MIP2) was
obtained by combining 0.42 mmol (0.05 g) of
the template (MET), it was dissolved in a thick-
walled glass container in 2mL methanol. 2.7
mmol (0.19) gm acrylamide as a functional
monomer, Ethylene glycol dimethacrylate
(EGDMA) 12.7 mmol (2.5 g) as across-linker
and initiator benzoyl peroxide (BPO) 0.15
mmol (0.036 g). The mixture was degassed in
an ultrasonic water bath, purging nitrogen for
40 minutes to remove oxygen from the
solution. The glass tube was withdrawn from
the ultrasonic water bath while preserving the
flow of nitrogen, sealed and put within a water
bath at 60 °C to start the reaction. The above
solution was later added. The mixture was
degassed in an ultrasonic water bath, purging
nitrogen for 30 minutes. The glass tube was
placed in a water bath at 60 °C while
maintaining the continuous flow of nitrogen
inside the glass tube throughout the reaction
time, when the reaction ended, the molecular
imprinted polymer was hardened, the
polymer was dried and crashed to acquire a
polymer particle after the polymerization
process. The template was successively
eliminated using Soxhlet removal by
continuous washing with the MIPs with 40
percent (v /v) portions of 100 mL methanol
/acetic acid solution. The polymer was dried
for (24-48) hours at (35-45) °C. The polymers
were then crushed with mortar and pestle and
measured at a particle size of 125 μm (using
100 mesh sieves); they were used in the
selective sensor membrane as an active
substrate. The unprinted polymer (NIP) was
similarly developed but without the drug
template.
FTIR of molecularly imprinted polymers for (MET)
The metformin FTIR spectra, MIP based on
several function monomers (before and after
the removal of template) are shown in the
following Figures 2, 3, 4, and 5.
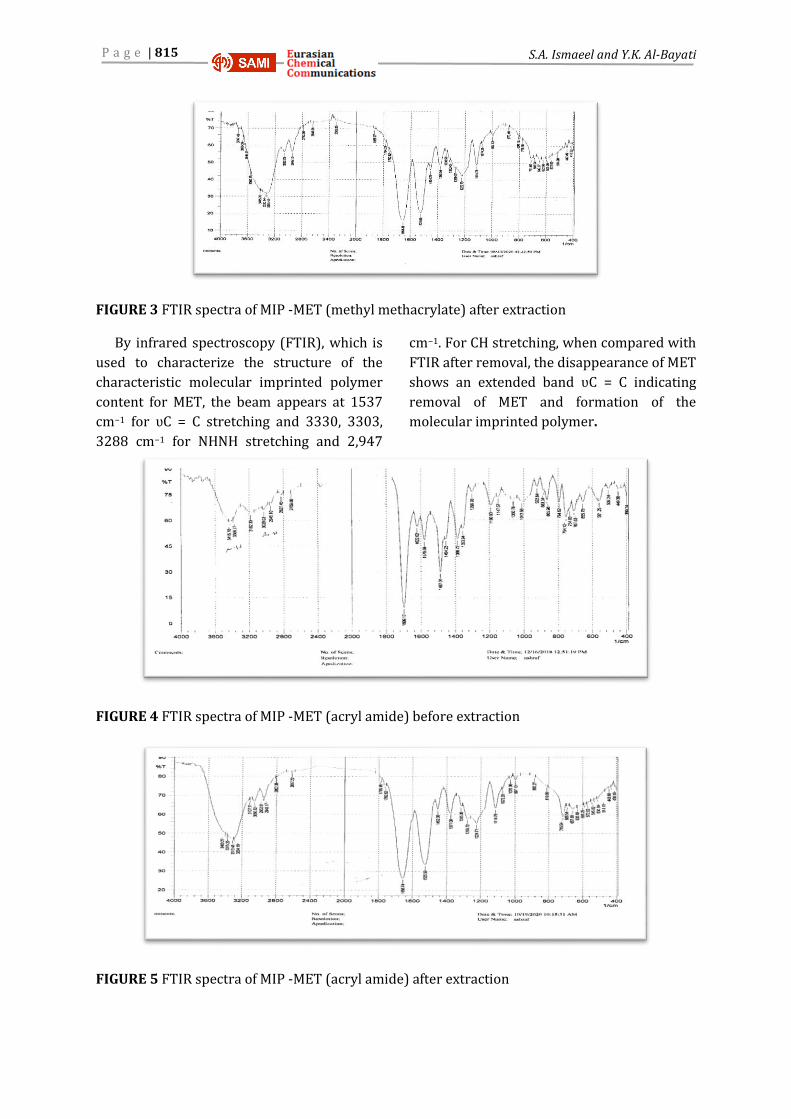
FIGURE 2 FTIR spectra of MIP -MET (methyl methacrylate) before extraction
P a g e | 815 S.A. Ismaeel and Y.K. Al-Bayati
FIGURE 3 FTIR spectra of MIP -MET (methyl methacrylate) after extraction
By infrared spectroscopy (FTIR), which is
used to characterize the structure of the
characteristic molecular imprinted polymer
content for MET, the beam appears at 1537
cm−1 for ʋC = C stretching and 3330, 3303,
3288 cm−1 for NHNH stretching and 2,947
cm−1. For CH stretching, when compared with
FTIR after removal, the disappearance of MET
shows an extended band ʋC = C indicating
removal of MET and formation of the
molecular imprinted polymer.
FIGURE 4 FTIR spectra of MIP -MET (acryl amide) before extraction
FIGURE 5 FTIR spectra of MIP -MET (acryl amide) after extraction

P a g e | 816 Determination of trace metformin in pharmaceutical…
Infrared spectroscopy (FTIR) is used to
diagnose the composition of the molecular
imprinted polymer of MET drug, as it is
observed by the above diagram showing the
beam at 1579 cm-1 for the expansion of C = C,
3415, 3386 cm -1 for the stretching of NH NH,
2827, and 2945 cm−1 for ʋCH stretching which
is indicative of drug presence, when compared
with the FTIR graph before and after drug
removal; MET shows disappearance of ʋC = C
band, C = H stretching indicating drug MET
removal and molecular fingerprint polymer
formation.
Scanning electron microscope (SEM)
SEM will be utilized to determine the
thickness, structure, and surface distribution
of the pore membrane. SEM examination
revealed that the molecular imprinted
polymer has a tightly organized and normal
pore structure on the surface and in cross-
section, which acts as the interface sites.
Several publications have demonstrated that,
due to the shape and nature of the porous
pores, a molecular impressed membrane of
this kind identifies and transports the
template molecule efficiently as shown in
Figures 6 and 7 the SEM for ( MIP -MET-
methyl methacrylate) and (MIP - MET-acryl
amide ) after and before washing.
FIGURE 6 SEM photograph of the surface of (MIP1-MET- MMA) before washing (a), SEM photograph of the surface of (MIP1-MET- MMA) after washing (b)

P a g e | 817 S.A. Ismaeel and Y.K. Al-Bayati
FIGURE 7 SEM photograph of the surface of (MIP1-MET- acryl amide) before washing (a), SEM photograph of the surface of (MIP1-MET- acryl amide) after washing (b)
Construction of ion-selective electrodes
By construction of Ion-Selective Electrodes, as
shown by Mahajan et al. (12), electrode body
building and immobilization were achieved.
The solution of metformin (0.1) M was filled as
an internal solution in the glass tube.
Membrane was preferred tube immersed in a
standard solution of (0.1) M naproxen for at
least three hours before measurements
representing membrane electrode
stipulations.
Preparation of pharmaceutical samples
A suitable weight was taken for the production
of 100 mL solutions in order to extract the
powder of pharmaceutical samples from
tablets using a pestle and mortar to grind the
tab casting. Appropriate amount of methanol
(CH3OH) was utilized for dissolved
pharmaceutical samples and completed in a
volumetric methanol flask with a magnetic
agitator for more than 30 minutes. Instead, the
material was screened using 0.07 m cellulose
filter paper to prepare and receive
levofloxacin concentrations of 1x10⁻³ M and
1x10⁻⁴ M.
Results and discussion
One of the most commonly used voltage
sensors is ion selective electrodes (ISE). Such
measurements were used in laboratory
research, industry, process management,
physiological, and environmental monitoring.
Membranes that reacted to concentration
analysis by generating ions could be
controlled by a chemical reaction using an ion
selective electrode. The two main types of
membrane electrodes were ionic-sensitive

P a g e | 818 Determination of trace metformin in pharmaceutical…
selective electrodes and selective molecular
electrodes used to evaluate molecular
analytes. The fundamental goal of selective ion
electrodes is to transmit electrical current
from metals to liquids. In metals, electrical
current is carried by electrons, whereas in
liquids, electrical current is carried by ions.
For each electrochemical process,
conductivity measurements can be performed
in one of these types of galvanic cells,
electrolysis, or electrical analysis. This type of
cell must be in contact with the solution on
both sides of the cell membrane, and some ISE
connections are accessible on one side of the
membrane. The following is the standard cell
composition:
outer ref I test solution I membrane I internal
ref.
or
outer ref I test solution I ion selective
electrode
The current passing through the
electrolytic cell must be zero depending on
this condition that the cell is designed in
accordance with the basic design rule for
electrolytic cells (Figure 8).
FIGURE 8 Schematic diagram showing a standard potentiometric cell with an ion-elective electrode
Metformin was used as a template, methyl
methacrylate was used as a monomer,
ethylene glycomethacrylate delayed (EGDMA)
was used as a cross-linking agent, and benzoyl
peroxide was used as an initiator to make MIP.
Plasticizers play a crucial role in the ISE
membrane. When a plasticizer is employed as
a membrane solvent, compatibility with
polymer and other membrane materials offers
a homogenous membrane state, and the
practical use of an ISE membrane should be
banned since the electrode output will be
altered over time. A PVC matrix is used to
construct two electrodes. Dioctyl phthalate
(DOP) as a plasticizer, based on met-MIP
(Membranes L1, L2), has been observed. It
defines the set of correlation coefficients,
linear detection limit range, and age (day). The
outcomes are shown in the Table 1.

P a g e | 819 S.A. Ismaeel and Y.K. Al-Bayati
TABLE 1 Parameters of MET-MIP1, MET-MIP2 selective electrode using different monomers and plasticizers
Electrode number
Membrane composition
Parameter
Slope mv/decade
R2 Correlation coefficient
R
Linearity range (M)
The detection limit
(M)
I MET+MIP1
(MMA+N,NMDA+DOP) -18.96 0.9906 0.9952 5×10⁻⁵-1×10⁻¹ 3×10⁻⁴
II MET+MIP2
(AM+EGDMA+DOP) 18.28 0.9954 0.9976 5×10⁻⁵-1×10⁻¹ 3×10⁻⁵
FIGURE 9 Calibration curve of MET-MIP1 selective electrode using (DOP) as a plasticizer
FIGURE 10 Calibration curve of MET-MIP2 selective electrode using (DOP) as a plasticizer
Effect of pH
The effect of pH on the electrode potentials for
(MET) selective membrane electrodes was
studied by measuring the e.m.f. of the cell in
(MET) solutions at three different
concentrations (1×10⁻⁴, 1×10⁻³ and 1×10⁻²) M
in which the pH ranged from 1.0-11.0. The pH
adjusted by adding appropriate amounts of
hydrochloric acid and/or NaOH solution is
shown in Figure 11 and Table 2. At pH values
less than 1.5 or in very high acidity, the
electrode response has been increased rather
irregularly. This may be due to the fact that the
electrode response to H+ activities as well as
metformin ions and in an alkaline solution (pH
greater than 10) has been decreased, which
may be attributed to the decrease in the
solubility of metformin.
y = -8.2364ln(x) - 93.9806R² = 0.9906
-80-70-60-50-40-30-20-10
0
5E-05 0.0005 0.005 0.05
resp
on
se m
V
log c
Calibration curve for (MIP1+ DOP)

P a g e | 820 Determination of trace metformin in pharmaceutical…
FIGURE 11 pH effect upon the metformin electrodes potential at a concentration (10-2 M, 10-3 M, 10-4 M)
TABLE 2 Effective pH ranges used for metformin selective electrodes
Number Membrane
Composition pH range
1×10⁻² M 1×10⁻³ M 1×10⁻⁴ M
I MET-MIP1+ DOP 5.5 – 10.0 5.0 – 8.5 4.0 – 7.5 II MET-MIP2+ DOP 3.5 – 6.5 2.5 – 5.5 5.0 – 8.0
Response Time
Response time is defined as the required time
to attain steady potential in the electrode
within range of ±1 mV of the final equilibrium
value. It has been noticed that the response
time value for higher concentrations is less
than that of low concentration because the
access to the equilibrium state in high
concentration is shorter than the low
solutions. This proves the response time
depending on the concentration of metformin.
The average response time (t 95% =) of the
metformin membranes is listed in Table (3)
below.

P a g e | 821 S.A. Ismaeel and Y.K. Al-Bayati
TABLE 3 The response time of metformin membranes
Membrane composition
Concentration (M)
Potential(mv)at t/100
Time (s) at95%
Time (s)at100%
MIP1 + DOP
1×10⁻¹ -4.6 45 48 1×10⁻² -6.6 47 50 5×10⁻³ -6.1 46 49 1×10⁻³ -4.5 52 55 5×10⁻⁴ -4.9 52 55 1×10⁻⁴ -5.5 51 54 5×10⁻⁵ -5.1 53 56
MIP2 + DOP
1×10⁻¹ 4.8 44 47
1×10⁻² 6.2 46 49
5×10⁻³ 4.3 47 50
1×10⁻³ 5.4 50 53
5×10⁻⁴ 4.2 50 53
1×10⁻⁴ 9.2 49 52
5×10⁻⁵ 6 52 55
Selectivity measurement by separation solution method
Potentiometric selectivity coefficients have
been achieved by Separation Solution Method
with using metformin concentrations ranging
(10-1-5×10⁻⁵) M and interfering substances
(methyl paraben, propyl paraben, tri sodium
citrate); the potentiometric measurement of
selectivity coefficients have been done by the
equation below:
Log K pot= [(EB − EA)/ (2.303RT/z F)] + (1 –
zA/zB) log aA
EA, EB; zA, zB; and aA, represent the
potentials, charge numbers, and activities for
the primary A and interfering B ions,
respectively, at aA = aB.
The results obtained for coefficients of
selectivity and interfering ions were listed in
Tables 4 and 5, and the selectivity versus the
species studied are represented in Figures 12
and 13.
FIGURE 12 Selectivity of (MET-MIP1+DOP) electrode with ions via separation solution method

P a g e | 822 Determination of trace metformin in pharmaceutical…
FIGURE 13 Selectivity of (MET-MIP2+DOP) electrode with ions via separation solution method
TABLE 4 Selectivity coefficients for (MET-MIP1+DOP) electrode at different concentrations of metformin
Con.
Concentrations of metformin (M): Concentrations of interference ions (M) Interfering ions
M.P. P.P. T.S.C. EB
(mv) KA,B
EB
(mv) KA,B
EB
(mv) KA,B
10-1 -12.6 0.00294004 -10.2 0.00035104 -9.7 7.1168×10⁻⁵ 10-2 -10.4 0.00294018 -7.5 0.00206729 -8.5 1.0833×10⁻⁵
5×10⁻³ -8.2 0.00687944 -5.3 0.00483726 -7.4 1.8254×10⁻⁵ 1×10⁻³ -6.6 0.03139319 -4.1 0.02317282 -6.2 2.9905×10⁻⁵ 5×10⁻⁴ -4.7 0.05832071 -3.7 0.05165117 -5.8 4.1960×10⁻⁵ 1×10⁻⁴ -2.1 0.11795869 -2.5 0.12383032 -3.1 2.8693×10⁻⁵ 5×10⁻⁵ -1.8 0.22181533 -1.9 0.22452558 -2.6 3.3173×10⁻⁵
TABLE 5 Selectivity coefficients for (MET-MIP2+DOP) electrode at different concentrations of metformin
Con.
Concentrations of metformin (M): Concentrations of interference ions (M) Interfering ions
M.P. P.P. T.S.C. EB
(mv) KA,B
EB
(mv) KA,B
EB
(mv) KA,B
10-1 85.3 0.00304501 84.2 0.00032758 82.8 5.9160×10⁻⁵ 10-2 82.5 0.00325014 81.4 0.00265102 80.5 1.0984×10⁻⁵
5×10⁻³ 81.4 0.00473210 79.5 0.00372491 78.1 9.1312×10⁻⁵ 1×10⁻³ 80.2 0.02939486 77.3 0.02039989 76.6 1.8678×10⁻⁵ 5×10⁻⁴ 78.6 0.04454474 75.2 0.02902691 75.7 1.9460×10⁻⁵ 1×10⁻⁴ 74.5 0.10490296 73.2 0.08905776 73.8 2.0691×10⁻⁵ 5×10⁻⁵ 73.3 0.14739751 69.4 0.09018664 70.7 1.4416×10⁻⁵
Interference studies
Match potential method (MPM) for selectivity measurement
MPM is used for the selectivity coefficients
(Kpot A , B) to determine the electrodes. They
are associated with two ions whatever their
charge is, since MPM theory is dependent on
diffusing electrical layers on both sides
(aqueous, interface membranes). So, it does
not depend on Nicolsky-Eisenman equation.
For the MPM, the selectivity coefficients for

P a g e | 823 S.A. Ismaeel and Y.K. Al-Bayati
equal charge ions (i.e., ZA = ZB) are indicated
as the ratio of the standard and interfering ion
concentrations in aqueous solutions through
the selective surface of the osmotic
membrane, neutral ions pass. The selectivity
coefficients of different charge ions (i.e. ZA #
ZB) not only represented the standard and
interfering ions quantities permeating the
membrane surface (as a function), but also
described the standard ion concentrations
within the initial reference solution and the
value delta EMF. This method uses the
following equation to determine the
selectivity coefficient :-
Kpot A,B = a′A -aA/aB
Kpot A, B =the selectivity coefficient, a′A= act
as the primary ion A activities, aB=interfering
ions. The results are shown in Table 6; the
coefficients of selectivity were computed
through the interfering ion concentration
which gave a potential difference as much as
the amount induced due to the increase in the
concentration of the primary ion.
TABLE 6 Selectivity coefficient of metformin electrodes and (1×10⁻³), (1×10⁻⁴) M of interfering ions determined by match potential method
Membrane Composition
Interfering-Ion (1×10⁻³)M
KMPM ΔE=10
KMPM ΔE=5
MET+MIP1+DOP
M.P 0.78534 0.428571 P.P 0.93251 0.428571
T.S.C 0.77551 0.439285 Interfering-Ion
(1×10⁻⁴)M KMPM
ΔE=10 KMPM ΔE=5
M.P 0.82608 0.39642 P.P 0.94375 0.39926
T.S.C 0.86781 0.40659 Membrane
Composition Interfering-Ion
(1×10⁻³)M KMPM
ΔE=10 KMPM ΔE=5
MET+MIP2+DOP
M.P 0.70314 0.41429
P.P 0.95337 0.34129
T.S.C 0.70204 0.45714
Interfering-Ion (1×10⁻⁴)M
KMPM ΔE=10
KMPM ΔE=5
M.P 0.86957 0.48571
P.P 0.90230 0.27399
T.S.C 0.86092 0.49407
We can notice from the data in the Table
(6) that there is no overlap between
metformin and the interfering ions.
Standard Addition Method (SAM) calculations
During this process, two metformin electrodes
at concentrations (10-3 and 10-4) M were
applied in this following Equation:
Cu=Cs/10ΔE/s(1+Vu/Vs) - (Vu/Vs)
Where: Cu= the unknown solution
concentration; Cs= the standard solution
concentration; Vu= the volume of unknown
solution; Vs= the volume of standard solution;
S= the slope of electrode; E1= electrode
potential (mV) in the sample solution; and E2=
electrode potential (mV) after the addition of
the standard.
They are shown in Tables 7 and 8, and RE%
& RSD % for each technique are listed in
Tables 9 and 10.

P a g e | 824 Determination of trace metformin in pharmaceutical…
TABLE 7 Potential of 10-3M metformin against the volume of standard metformin; the calculation of five additions using MSA and SAM for (MET-MIP1+DOP) electrode
Vs mL added
E /mv Antilog E/S ΔE Antilog ΔE/S VU/VS CU M
0 -185.3 5.9321×10+9 -------- ------- ------- ------ 0.1 -190.9 1.1710×10+10 -5.6 1.9741 100 1.0062×10⁻³ 0.2 -194.1 1.7272×10+10 -8.8 2.9116 50 1.0153×10⁻³ 0.3 -196.4 2.2838×10+10 -11.1 3.8498 3.33 1.0117×10⁻³ 0.4 -198.2 2.8418×10+10 -12.9 4.7905 25 1.0045×10⁻³ 0.5 -199.5 3.3278×10+10 -14.2 5.6098 20 1.0224×10⁻³
TABLE 8 Potential of 10-4 M metformin against the volume of standard metformin; the calculation of five additions using MSA and SAM for (MET-MIP1+DOP) electrode
Vs mL added
E /mv Antilog E/S ΔE Antilog ΔE/S VU/VS CU M
0 -140.1 2.4504×10+8 -------- ------- ------- ------ 0.1 -159.5 2.5849×10+8 -19.4 1.0549×10+1 100 1.0358×10⁻⁴ 0.2 -165 5.0412×10+8 -24.9 2.0573×10+1 50 1.0008×10⁻⁴ 0.3 -168.1 7.3457×10+8 -28 2.9977×10+1 3.33 1.0041×10⁻⁴ 0.4 -170.3 9.5955×10+8 -30.2 3.9159×10+1 25 1.0069×10⁻⁴ 0.5 -172 1.1796×10+9 -31.9 4.8138×10+1 20 1.0092×10⁻⁴
TABLE 9 Potential of 10-3 M metformin against the volume of standard metformin; the calculation of five additions using MSA and SAM for (MET-MIP2+DOP) electrode
Vs mL added
E /mv Antilog E/S ΔE Antilog ΔE/S VU/VS CU M
0 201.1 1.0025×10⁻¹¹ ------- ---------- ------- ------------ 0.1 206.5 1.9792×10⁻¹¹ 5.4 1.9743 100 1.0060×10⁻³ 0.2 209.6 2.9247×10⁻¹¹ 8.5 2.9174 50 1.012310-3 0.3 211.8 3.8586×10⁻¹¹ 10.7 3.8489 33.3 1.012010-3 0.4 213.5 4.7800×10⁻¹¹ 12.4 4.7680 25 1.010410-3 0.5 214.9 5.7019×10⁻¹¹ 13.8 5.6875 20 1.005710-3
TABLE 10 Potential of 10-4 M metformin against the volume of standard metformin; the calculation of five additions using MSA and SAM for (MET-MIP2+DOP) electrode
Vs mL added
E /mv Antilog E/S ΔE Antilog ΔE/S VU/VS CU M
0 105.5 5.9066×10+5 ------- -------------- -------- ------------ 0.1 124.4 6.3863×10+6 18.9 1.0812×10+1 100 1.0080×10⁻⁴ 0.2 129.5 1.2141×10+7 24 2.0555 ×10+1 50 1.0017×10⁻⁴ 0.3 132.4 1.7494×10+7 26.9 2.9618×10+1 33.3 1.0167×10⁻⁴ 0.4 134.6 2.3080×10+7 29.1 3.9075×10+1 25 1.0091×10⁻⁴ 0.5 136.3 2.8591×10+7 30.8 4.8406×10+1 20 1.0035×10⁻⁴
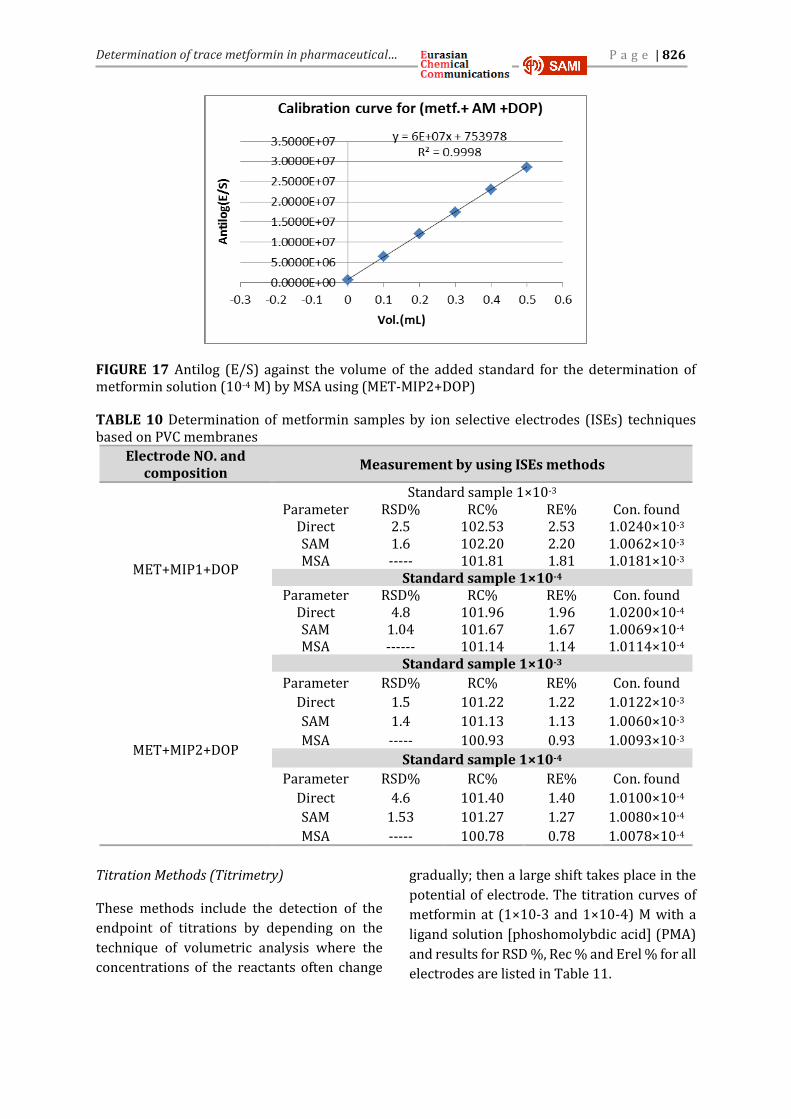
Multiple Standard Addition Method (MSA) Calculations
The measurement in this method were
achieved by using two solution of MET applied
with concentration (1x10⁻³and1x10-4) M. The
calculations were done by plotting the antilog
E/S (Y-axis) against volume of standard
naproxen (X-axis). Figures 14, 15, 16, and 17
show that the results of MET concentrations
were calculated via the electrodes-based MET-
MIP1+DOP, MET-MIP2+DOP, and Table (10)
represents the results to these electrodes. The
calculation of volume (V) mL and results
depended on the equation below:

P a g e | 825 S.A. Ismaeel and Y.K. Al-Bayati
E=E˚ +S log (C+X Vs/Vu)
Where: S= slope; Vs= the volume of added
standard; Vu= the volume of unknown; C= the
concentration of an unknown; and X= the
concentration of added standard.
FIGURE 14 Antilog (E/S) against the volume of the added standard for the determination of metformin solution (10-3 M) by MSA using (MET-MIP1+DOP)
FIGURE 15 Antilog (E/S) versus the volume of the added standard for the determination of metformin solution (10-4 M) by MSA using (MET-MIP1+DOP)
FIGURE 16 Antilog (E/S) against the volume of the added standard for the determination of metformin solution (10-3 M) by MSA using (MET-MIP2+DOP)
P a g e | 826 Determination of trace metformin in pharmaceutical…
FIGURE 17 Antilog (E/S) against the volume of the added standard for the determination of metformin solution (10-4 M) by MSA using (MET-MIP2+DOP)
TABLE 10 Determination of metformin samples by ion selective electrodes (ISEs) techniques based on PVC membranes
Electrode NO. and composition
Measurement by using ISEs methods
MET+MIP1+DOP
Standard sample 1×10⁻³ Parameter RSD% RC% RE% Con. found
Direct 2.5 102.53 2.53 1.0240×10⁻³ SAM 1.6 102.20 2.20 1.0062×10⁻³ MSA ----- 101.81 1.81 1.0181×10⁻³
Standard sample 1×10⁻⁴ Parameter RSD% RC% RE% Con. found
Direct 4.8 101.96 1.96 1.0200×10⁻⁴ SAM 1.04 101.67 1.67 1.0069×10⁻⁴ MSA ------ 101.14 1.14 1.0114×10⁻⁴
MET+MIP2+DOP
Standard sample 1×10⁻³
Parameter RSD% RC% RE% Con. found
Direct 1.5 101.22 1.22 1.0122×10⁻³
SAM 1.4 101.13 1.13 1.0060×10⁻³
MSA ----- 100.93 0.93 1.0093×10⁻³
Standard sample 1×10⁻⁴
Parameter RSD% RC% RE% Con. found
Direct 4.6 101.40 1.40 1.0100×10⁻⁴
SAM 1.53 101.27 1.27 1.0080×10⁻⁴
MSA ----- 100.78 0.78 1.0078×10⁻⁴
Titration Methods (Titrimetry)
These methods include the detection of the
endpoint of titrations by depending on the
technique of volumetric analysis where the
concentrations of the reactants often change
gradually; then a large shift takes place in the
potential of electrode. The titration curves of
metformin at (1×10⁻³ and 1×10⁻⁴) M with a
ligand solution [phoshomolybdic acid] (PMA)
and results for RSD %, Rec % and Erel % for all
electrodes are listed in Table 11.

P a g e | 827 S.A. Ismaeel and Y.K. Al-Bayati
TABLE 11 Sample analyses by using titration method for MET electrode
Electrode No. Concentration (M)
MET – MIP1 + DOP
Sample Measured using PMA as titrant 1×10⁻³ 1.0118×10⁻³ RSD% 1.65 REC% 102.63 RE% 2.63
1×10⁻⁴ 1.0274×10⁻⁴ RSD% 3.7 REC% 102.74 RE% 2.74
MET– MIP2 + DOP
1×10⁻³ 1.0236×10⁻³
RSD% 3.2
REC% 102.36
RE% 2.36
1×10⁻⁴ 1.0149×10⁻⁴
RSD% 2.08
REC% 101.49
RE% 1.49
Applications of pharmaceuticals
Ion selective electrodes were used to assess
metformin in pharmaceuticals based on
molecularly imprinted polymers. These ISEs
were tested using different potentiometric
methods. Solutions for metformin at
concentrations 1×10⁻³ and 1×10⁻⁴ M were
prepared, and Erel%, Rec%, RSD% were
determined for metformin in pharmaceutical
samples. The obtained results are represented
in Tables 12, 13, 14, and 15.
TABLE 12 Sample analysis of pharmaceuticals metformin by using ISE (MET-MIP1+DOP)
Pharmaceutical CHEMLE AG (Germany)
*Direct method *SAM MSA *Titration
method
Concentration prepared (M)
1×10⁻³ 1×10⁻³ 1×10⁻³ 1×10⁻³
*Found 1.02351×10⁻³ 1.0220×10⁻³ 1.0181×10⁻³ 1.0263×10⁻³
*RSD% 3.4 1.66 ----- 3.6 REC% 102.35 102.20 101.81 102.63 RE% 2.35 2.20 1.81 2.63
Pharmaceutical CHEMLE AG (Germany)
*Direct method *SAM MSA *Titration
method Concentration prepared (M)
1×10⁻⁴ 1×10⁻⁴ 1×10⁻⁴ 1×10⁻⁴
*Found 1.0230×10⁻⁴ 1.0205×10⁻⁴ 1.0187×10⁻⁴ 1.0230×10⁻⁴ *RSD% 4.6 1.07 ----- 3.18 REC% 102.27 102.05 101.87 102.30 RE% 2.27 2.05 1.87 2.30
*Each measurement was repeated three times.

P a g e | 828 Determination of trace metformin in pharmaceutical…
TABLE 13 Sample analysis of pharmaceuticals metformin by using ISE (MET-MIP1+DOP)
Pharmaceutical Darmstadt (Germany)
*Direct method
*SAM MSA *Titration
method
Concentration prepared (M)
1×10⁻³ 1×10⁻³ 1×10⁻³ 1×10⁻³
*Found 1.0229×10⁻³ 1.0167×10⁻³ 1.0151×10⁻³ 1.0252×10⁻³ *RSD% 3.5 1.6 ----- 3.4 REC% 102.29 101.67 101.51 102.52 RE% 2.29 1.67 1.51 2.52
Pharmaceutical Darmstadt (Germany)
*Direct method
*SAM MSA *Titration
method Concentration prepared (M)
1×10⁻⁴ 1×10⁻⁴ 1×10⁻⁴ 1×10⁻⁴
*Found 1.0230×10⁻⁴ 1.0248×10⁻⁴ 1.0212×10⁻⁴ 1.0274×10⁻⁴
*RSD% 3.8 1.5 ------ 3.7 REC% 102.28 102.48 102.12 102.74 RE% 2.28 2.48 2.12 2.74
*Each measurement was repeated three times.
TABLE 14 Sample analysis of pharmaceuticals metformin by using ISE (MET-MIP2+DOP)
Pharmaceutical CHEMLE AG (Germany)
*Direct method *SAM MSA *Titration method
Concentration prepared (M)
1×10⁻³ 1×10⁻³ 1×10⁻³ 1×10⁻³
*Found 1.0246×10⁻³ 1.0141×10⁻³ 1.0124×10⁻³ 1.0225×10⁻³ *RSD% 2.4 0.7 …….. 3.1 REC% 102.05 101.41 101.24 102.25 RE% 2.05 1.41 1.24 2.25
Pharmaceutical CHEMLE AG (Germany)
*Direct method *SAM MSA *Titration method
Concentration prepared (M)
1×10⁻⁴ 1×10⁻⁴ 1×10⁻⁴ 1×10⁻⁴
*Found 1.021×10⁻⁴ 1.0133×10⁻⁴ 1.017×10⁻⁴ 1.0252×10⁻⁴ *RSD% 3.1 1.14 …….. 3.4 REC% 102.07 101.33 101.07 102.52 RE% 2.07 1.33 1.07 2.52
*Each measurement was repeated three times.

P a g e | 829 S.A. Ismaeel and Y.K. Al-Bayati
TABLE 15 Sample analysis of pharmaceuticals metformin by using ISE (MET-MIP2+DOP)
Pharmaceutical Darmstadt (Germany)
*Direct method
*SAM MSA *Titration method
Concentration prepared (M)
1×10⁻³ 1×10⁻³ 1×10⁻³ 1×10⁻³
*Found 1.0240×10⁻³ 1.018×10⁻³ 1.0156×10⁻³ 1.0230×10⁻³
*RSD% 2.4 1.5 ……. 3.1 REC% 102.4 101.8 101.56 102.30 RE% 2.4 1.8 1.56 2.30
Pharmaceutical Darmstadt (Germany)
*Direct method
*SAM MSA *Titration method
Concentration prepared (M)
1×10⁻⁴ 1×10⁻⁴ 1×10⁻⁴ 1×10⁻⁴
*Found 1.0210×10⁻⁴ 1.0136×10⁻⁴ 1.0105×10⁻⁴ 1.0285×10⁻⁴ *RSD% 3.9 1.4 …….. 3.9 REC% 102.10 101.36 101.05 102.85 RE% 2.10 1.36 1.05 2.85
*Each measurement was repeated three times.
Conclusion
Metformin is used as a template for
molecularly imprinted electrode sensors
(MIP), and methyl methacrylate (MMA) and
acrylamide (AM) are used as monomers in
different plasticizers. Using a DOP plasticizer-
based electrode, excellent MIP tests with high
sensitivity, moderate selectivity, robust static
response, long-term stability, and application
across a wide pH range were produced. The
objective of the building electrodes is to be
utilized in the pharmaceutical analysis to
determine metformin levels.
Acknowledgements
It’s my pleasure to thank all the staff of Department of Chemistry, College of Science, University of Baghdad, Baghdad, Iraq, for their help.
References
[1] G.Q. Zhang, X.Y. Zhang, Y.X. Luo, Y.S. Li, Y.
Zhao, X.F. Gao, Spectrochim. Acta A Mol. Biomol.
Spectrosc., 2021, 250, 119384. [crossref],
[Google Scholar], [Publisher]
[2] R. Pontarolo, A.C. Gimenez, T.M.G. de
Francisco, R.P. Ribeiro, F.L.D. Pontes, J.C.
Gasparetto, Journal of Chromatography B,
2014, 965, 133-141. [crossref], [Google
Scholar], [Publisher]
[3] O. Vesterqvist, F. Nabbie, B. Swanson, J.
Chromatogr. B: Biomed. Sci. Appl., 1998, 716,
299-304. [crossref], [Google Scholar],
[Publisher]
[4] S. Skrzypek, V. Mirčeski, W. Ciesielski, A.
Sokołowski, R. Zakrzewski, J. Pharm. Biomed.
Anal., 2007, 45, 275-281. [crossref], [Google
Scholar], [Publisher]
[5] Y.K. Al-Bayati, F.I. Aljabari, Asian Journal of
Chemistry, 2016, 28, 1376-1380. [crossref],
[Google Scholar], [Publisher]
[6] C. He, Z. Zhang, D. He, Y. Xiong, Anal.
Bioanal. Chem., 2006, 385, 128-133. [crossref],
[Google Scholar], [Publisher]
[7] V.A. de Silva, C. Suraweera, S.S. Ratnatunga,
M. Dayabandara, N. Wanniarachchi, R.
Hanwella, BMC Psychiatry, 2016, 16, 341.
[crossref], [Google Scholar], [Publisher]
[8] C.R. Triggle, H. Ding, Acta Physiologica,
2017, 219, 138-151. [crossref], [Google
Scholar], [Publisher]
[9] A. Blumenberg, R. Benabbas, R. Sinert, A.
Jeng, S.W. Wiener, J. Med. Toxicol., 2020, 16,
222-229. [crossref], [Google Scholar],
[Publisher]

P a g e | 830 Determination of trace metformin in pharmaceutical…
[10] Y.K. Al-Bayati, A.J. Al-Safi, Baghdad
Science Journal, 2018, 15, 11. [crossref],
[Google Scholar], [Publisher]
[11] A.M.T. Allayla, R.A. Faris, Z.F. Mahdi, Vib.
Spectrosc., 2021, 114, 103252. [crossref],
[Google Scholar], [Publisher]
[12] D. Michel, M.C. Gaunt, T. Arnason, A. El-
Aneed, J. Pharm. Biomed. Anal., 2015, 107,
229-235. [crossref], [Google Scholar],
[Publisher]
[13] S.A. Jabir, Y.K. Al-Bayati, Iraq Journal of
Market Research and Consumer Protection,
2020, 12, 1-11. [crossref], [Google Scholar],
[Publisher]
[14] S.S.M. Hassan, W.H. Mahmoud, M.A.F.
Elmosallamy, A.H.M. Othman, Anal. Chim. Acta,
1999, 378, 299-311. [crossref], [Google
Scholar], [Publisher]
How to cite this article: Shams Aws Ismaeel, Yehya Kamal Al-Bayati. Determination of trace metformin in pharmaceutical preparation using molecularly imprinted polymer based pvc-membrane. Eurasian Chemical Communications, 2021, 3(11), 812-830. Link: http://www.echemcom.com/article_138176.html
Copyright © 2021 by SPC (Sami Publishing Company) + is an open access article distributed
under the Creative Commons Attribution License(CC BY) license
(https://creativecommons.org/licenses/by/4.0/), which permits unrestricted use,
distribution, and reproduction in any medium, provided the original work is properly cited.