CSEIT1725220 | Received :10 Nov 2017 | Accepted : 23 Nov 2017 | November-December-2017 [(2)6: 330-338]
International Journal of Scientific Research in Computer Science, Engineering and Information Technology
© 2017 IJSRCSEIT | Volume 2 | Issue 6 | ISSN : 2456-3307
330
Multivariate Regression Analysis for Coronary Heart Disease
Using SPM Tool Amudavalli L
M.Phil Scholar, Department of Computer Science, Jamal Mohamed College, Trichy, India
ABSTRACT Regression is a data mining (machine learning) technique used to fit an equation to a dataset. In statistical
modeling, regression analysis is a statistical process for estimating the relationships among variables. It includes
many techniques for modeling and analyzing several variables, when the focus is on the relationship between
a dependent variable and one or more independent variables (or 'predictors'). More specifically, regression analysis
helps one understand how the typical value of the dependent variable (or 'criterion variable') changes when any one
of the independent variables is varied, while the other independent variables are held fixed. Most commonly,
regression analysis estimates the conditional expectation of the dependent variable given the independent variables –
that is, the average value of the dependent variable when the independent variables are fixed. Then can implement
multivariate attributes in coronary heart disease datasets. In regression, analyze the multivariate attribute model
which is a generalization of the probit model used to estimate several correlated binary outcomes jointly. In this
project, perform comparative study to various regression algorithms such as CART, Ensemble and bagger, Random
forest and MARS. Classification and regression trees (CART), Ensemble and bagger, Random forest for tree
prediction models can be implemented in prediction model for heart disease datasets. And also propose the MARS
procedure which builds flexible regression models by fitting separate splines for multiple predicted variables.
Finally compare the results in terms of RMSE, MSE, MAD and gain values metrics in data mining.
Keywords : Regression Analysis, Multivariate Attribute, Dependent Variable, Classification And Regression Tree,
Ensemble And Bagger, Random Forest
I. INTRODUCTION
Coronary heart disease (CHD) is a serious threat to
human health, especially for the elderly. Integrative
medicine (IM) specialists have accumulated a large
number of data in the clinical practice of CHD, which
contain important information about diseases,
syndromes, syndrome diagnosis and thinking skills,
prescription medication, treatment, prognosis and
evolution syndrome, and other aspects of development
trends. How to do our clinical researches relying on
these objective, dynamically updated massive clinical
data of IM for CHD, is the primary challenge for us. At
present, on current clinical research methods, due to the
strict limitations in the included crowd and medication
conditions for randomized controlled trials (RCTs), the
studies have high internal validity but poor in external
making difficulty for the findings in promoting
practical application. On basis of practical international
RCTs, real-world study (RWS) concepts and methods
gradually rise, which is to reflect the real world as a
whole through the “real world sample.” It is to choose
interventions according to the actual condition and
willingness of the patient and evaluate the effects of
interventions with more comprehensive coverage of the
crowd using statistical methods such as propensity
score to control confounding bias. Thus, RWS has
strong external validity than the traditional RCTs and
can evaluate the effect of interventions in a real clinical
setting. Therefore, the results are much closer to
clinical practice. Integrative interventions emphasize
individualized treatment, focusing on holistic, complex,
and multiple effects in the evaluation of clinical
efficacy. RWS undoubtedly opens up a new path for
researches of integrative medical in CHD. However,
clinical data of IM in CHD are large in amount and
Volume 2, Issue 6, November-December-2017 | www.ijsrcseit.com | UGC Approved Journal [ Journal No : 64718 ]
331
complex in data types. All are multivalued and multi-
types data, the attribute and label of each record have
one or more options, and the clinical research data also
have more confounding factors, making exploring the
appropriate methodology become a hot topic.
Regression is an interdisciplinary research field, which
combines the latest research achievements such as
statistics, data warehousing, information retrieval,
machine learning, artificial intelligence, high
performance computing, and data visualization. Data
mining techniques are to analyze and dig out data
useful information and knowledge from the mass data
to guide people‟s practices, which is changing the use
patterns of data with a new concept. To analyze
clinical syndrome diagnosis and prescription
experience of CHD in the real world with data mining
methods, it cannot only find clinical rules and improve
clinical diagnostic accuracy of CHD for IM physicians,
but also get a deep understanding of IM academic
thinking and grasp disease treatment rule. Therefore,
using data mining methods for IM study in CHD will
greatly improve the level of clinical diagnosis and
treatment of IM study in CHD and has broad
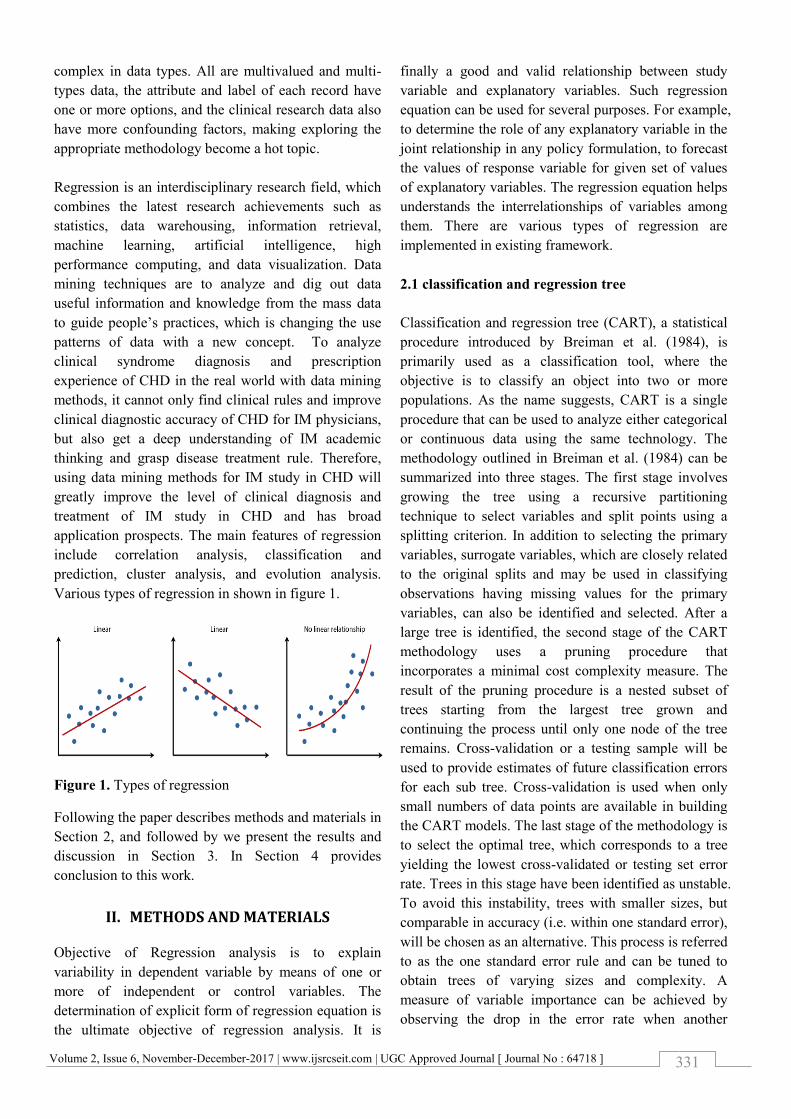
application prospects. The main features of regression
include correlation analysis, classification and
prediction, cluster analysis, and evolution analysis.
Various types of regression in shown in figure 1.
Figure 1. Types of regression
Following the paper describes methods and materials in
Section 2, and followed by we present the results and
discussion in Section 3. In Section 4 provides
conclusion to this work.
II. METHODS AND MATERIALS
Objective of Regression analysis is to explain
variability in dependent variable by means of one or
more of independent or control variables. The
determination of explicit form of regression equation is
the ultimate objective of regression analysis. It is
finally a good and valid relationship between study
variable and explanatory variables. Such regression
equation can be used for several purposes. For example,
to determine the role of any explanatory variable in the
joint relationship in any policy formulation, to forecast
the values of response variable for given set of values
of explanatory variables. The regression equation helps
understands the interrelationships of variables among
them. There are various types of regression are
implemented in existing framework.
2.1 classification and regression tree
Classification and regression tree (CART), a statistical
procedure introduced by Breiman et al. (1984), is
primarily used as a classification tool, where the
objective is to classify an object into two or more
populations. As the name suggests, CART is a single
procedure that can be used to analyze either categorical
or continuous data using the same technology. The
methodology outlined in Breiman et al. (1984) can be
summarized into three stages. The first stage involves
growing the tree using a recursive partitioning
technique to select variables and split points using a
splitting criterion. In addition to selecting the primary
variables, surrogate variables, which are closely related
to the original splits and may be used in classifying
observations having missing values for the primary
variables, can also be identified and selected. After a
large tree is identified, the second stage of the CART
methodology uses a pruning procedure that
incorporates a minimal cost complexity measure. The
result of the pruning procedure is a nested subset of
trees starting from the largest tree grown and
continuing the process until only one node of the tree
remains. Cross-validation or a testing sample will be
used to provide estimates of future classification errors
for each sub tree. Cross-validation is used when only
small numbers of data points are available in building
the CART models. The last stage of the methodology is
to select the optimal tree, which corresponds to a tree
yielding the lowest cross-validated or testing set error
rate. Trees in this stage have been identified as unstable.
To avoid this instability, trees with smaller sizes, but
comparable in accuracy (i.e. within one standard error),
will be chosen as an alternative. This process is referred
to as the one standard error rule and can be tuned to
obtain trees of varying sizes and complexity. A
measure of variable importance can be achieved by
observing the drop in the error rate when another

Volume 2, Issue 6, November-December-2017 | www.ijsrcseit.com | UGC Approved Journal [ Journal No : 64718 ]
332
variable is used instead of the primary split. Basically
the more frequent a variable appears as a primary or
surrogate split, the higher the importance score
assigned.
At the first step, all possible dichotomizations of all
continuous variables (above vs. below a given
threshold) and of all categorical variables are
considered. Using each possible dichotomization, all
possible ways of partitioning the sample into two
distinct subsets is considered. That binary partition that
results in the greatest reduction in impurity is selected.
This process is then repeated iteratively until a
predefined stopping rule is satisfied. For classification,
a subject's class can be determined using the status that
was observed for the majority of subjects within that
subset to which the given subject belongs (i.e.
classification by majority vote). For prediction, the
predicted probability of the event for a given subject
can be estimated using the proportion of subjects who
have the condition of interest amongst all the subjects
in the subset to which the given subject belongs. CART
analysis uses binary recursive partitioning to split the
original node into two nodes. Rood node was first split
by trait anxiety, which indicating trait anxiety is the
most significant independent variable and the second
child node was split down by exercise habit. This
process repeats until an optimal tree, for which each
terminal node indicates a specific pattern of subgroups,
is established. All of the information in the database
was able to be analyzed in a decision tree model, rather
than through linear regression, which usually selects
certain independent variables based on the literature or
clinical experience. The CART tree structure is shown
in figure 2
Figure 2. CART tree structure
2.2 ensemble bagging and boosting
Ensemble Data Mining Methods also known as
Committee Methods or Model Combiners are machine
learning methods that leverage the power of multiple
models to achieve better prediction accuracy than any
of the individual models could on their own.
Ensemble Classifier Methods:
Bagging
Boosting
Random Subspace
Recently bagging, boosting and the random subspace
method have become popular combining techniques for
improving weak classifiers.
Bagging: Bootstrap aggregation, or bagging, is a
technique proposed by that can be used with many
classification methods and regression methods to
reduce the variance associated with prediction, and
thereby improve the prediction process. It is a relatively
simple idea many bootstrap samples are drawn from
the available data some prediction method is applied to
each bootstrap sample, and then the results are
combined, by averaging for regression and simple
voting for classification, to obtain the overall prediction,
with the variance being reduced due to the averaging.
Boosting: The Boost family of algorithms also known
as boosting is another category of powerful ensemble
methods. It explicitly alters the distribution of training
data fed to every individual classifier specifically
weight so each training sample. Initially the weights are
uniform for all the training samples. During the
boosting procedure adjusted after the training of each
classifier is completed. For misclassified samples the
weights are increased while for correctly classified
samples are decreased. The final ensemble is
constructed by combining individual classifiers
according to their own accuracies.
Random Subspace: This method takes the advantage of
high dimensionality and is an effective counter measure
for the traditional problem of the curse of
dimensionality. Its merit can be attributed to the high
ensemble diversity which compensates for the possible
deficiency of accuracies in individual classifiers. In
random subspace feature subspaces are picked at
random from the original feature space and individual

Volume 2, Issue 6, November-December-2017 | www.ijsrcseit.com | UGC Approved Journal [ Journal No : 64718 ]
333
classifiers are created only based on those attributes in
the chosen feature subspaces using the original training
set. The outputs from different individual classifiers are
combined by the uniform majority voting to give the
final prediction. The ensemble classifier is shown in
figure 3
Figure 3. Ensemble Bagging and Boosting
2.3 random forest
Random Forest is essentially an ensemble of un-pruned
classification trees. It gives excellent performance on a
number of practical problems, largely because it is not
sensitive to noise in the data set, and it is not subject to
over-fitting. It works fast, and generally exhibits a
substantial performance improvement over many other
tree-based algorithms. Random forests are built by
combining the predictions of several trees, each of
which is trained in isolation. Unlike in boosting where
the base models are trained and combined using a
sophisticated weighting scheme, typically the trees are
trained independently and the predictions of the trees
are combined through averaging. There are three main
choices to be made when constructing a random tree.
These are
The method for splitting the leafs.
The type of predictor to use in each leaf.
The method for injecting randomness into the trees.
In Brieman‟s early work each individual tree is given
an equal vote and later version of Random Forest
allows weighted and unweighted voting. The technique
on which Random Forest ensemble is formed can be
considered over following parameters:
i) Base Classifier: It describes the base classifier used
in the Random Forest ensemble. Base classifier can be
decision tree, Random tree, or extremely randomized
tree.
ii) Split Measure: If base classifier of Random Forest is
decision tree, then which split measure is found at each
node of the tree to perform the splitting. To perform
splitting Gini index, Info gain etc are used.
iii) Number of Passes: For building Random Forest
classifier, if single pass is sufficient or multiple passes
through data are needed
iv) Combine Strategy: In Random Forest ensemble, all
the base classifiers generated are used for classification.
At the time of classification, how the results of
individual base classifiers are combined is decided by
the combine strategy.
v) Number of attributes used for base classifier
generation: This parameter gives the number of how
many attributes are to be used which is randomly
selected from the original set of attributes at each node
of the base decision tree. Filter and Wrapper these are
main techniques used for feature selection and
extraction.
Each tree of Random Forest is grown, are described as
follows: Suppose training data size containing N
number of records, then N records are sampled at
random but with replacement, from the original data,
this is known as bootstrap sample along with M
number of attributes. This sample will be used for the
training set for growing the tree. If there are N input
variables, a number n << N is selected such that at each
node, n variables are selected at random out of N and
the best split on these m attributes is used to split the
node. The value of m is held constant during forest
growing. The decision tree is grown to the largest
extent possible. A tree forms “inbag” dataset by
sampling with replacement member from the training
set. It is checked whether sample data is correctly
classified or not using out of bag error with the help of
out of bag data which is normally one third of the
“inbag” data. Prediction is made by aggregating
(majority vote for classification or averaging for
regression) the predictions of the ensemble
The overall process of Random forest algorithm is
shown in figure 4

Volume 2, Issue 6, November-December-2017 | www.ijsrcseit.com | UGC Approved Journal [ Journal No : 64718 ]
334
Figure 4. Random Forest Algorithm
2.4 multivariate adaptive regression splines (mars)
tool
Nowadays healthcare industry generates massive
amount of data about patients. Data analysis is essential
for medical decision making and supervision.
Analyzing and processing the enormous amounts of
data generated by healthcare industry are too complex
by conventional method. In data mining, classification
is a technique used to predict the target classes
accurately for each case. Prediction is a technique used
to predict the future from the historical facts. In the
healthcare sector, disease caused by a particular
symptom cannot be well depicted using a single-label
dataset, whereas multi-label dataset can be used to
resolve this problem. Multi-label classification is the
classification crisis where multiple labels should be
assigned to each instance. Feature selection is an
important step in regression and also for dimensionality
reduction. As medical information is with multiple
attributes, medical data mining differs from other one.
Diagnosis of most of the diseases is expensive as many
tests are required to predict the disease. By using data
mining techniques we can reduce the cost of diagnosis
by avoiding many tests by selection of those attributes
which are really important for prediction of disease.
Dimensionality reduction plays an important role in the
field of medicine as it contains multiple attributes.
Multi-label classification was mainly provoked by the
task of text categorization, music, and medical analysis.
Multi-label classification uses two methods for
classification. First, problem transformation method
which converts the multi-label problem into a set of
binary classification problem then the problem can be
handled by the single-label classifier. Second,
algorithm adaptation method, adapts the algorithm
directly to perform the multi-label classification. In
multi-label, the main issue is to select the features for
multiple classes. Features available in the multi-label
dataset are entirely dependent on all the class labels.
The feature selection is the process of selecting the
relevant features which are the subset of the features.
The features present in the dataset can be used to
classify the data with accurate prediction. For this,
multivariate adaptive regression splines (MARS) tool is
used to handle the complex data and for the selection of
optimistic feature subset for the multi-label data.
MARS essentially builds flexible models by fitting
piecewise linear regressions; that is, the nonlinearity of
a model is approximated through the use of separate
regression slopes in distinct intervals of the
independent variable space. Therefore, the slope of the
regression line is allowed to change from one interval
to the other as the two “knot” points are crossed. The
variables to use and the end points of the intervals for
each variable are found via a fast but intensive search
procedure. In addition to searching variables one by
one, MARS also searches for interactions between
variables, allowing any degree of interaction to be
considered. Feature selection in the multi-label dataset
is a challenging task due to complex interaction among
features and class labels. Therefore, the multivariate
adaptive regression spline (MARS) is used to classify
and to select the important features. MARS handles
large dataset and makes prediction quickly. The
optimal MARS model is selected in a two-stage
process. Firstly, MARS constructs a very large number
of basis functions (BF), which are selected to over-fit
the data initially, where variables are allowed to enter
as continuous, categorical, or ordinal, the formal
mechanism by which variable intervals are defined, and
they can interact with each other or be restricted to
enter in only as additive components. In the second
stage, basis functions are deleted in the order of least
contribution using the generalized cross-validation
(GCV) criterion. A measure of variable importance can
be assessed by observing the decrease in the calculated
GCV when a variable is removed from the model.
Missing values can also be handled in MARS by using
dummy variables indicating the presence of the missing
values. By allowing for any arbitrary shape for the
function and interactions, and by using the above-
mentioned two-stage model building procedure, MARS

Volume 2, Issue 6, November-December-2017 | www.ijsrcseit.com | UGC Approved Journal [ Journal No : 64718 ]
335
is capable of reliably tracking the very complex data
structures that often hide in high-dimensional data.
Let y be the target output and X=( be a
matrix of P input variables. Then it is assumed that the
data are generated from an unknown „true‟ model. In
case of a continuous response this would be
( ) = f(X)+e in which e is the
distribution of the error. MARS approximates the
function f by applying basis functions (BFs). BFs are
splines (smooth polynomials), including piece-wise
linear and piece-wise cubic functions. For simplicity,
only the piece-wise linear function is expressed. Piece-
wise linear functions are of the form max(0, x−t) with a
knot occurring at value t. The equation max(.) means
that only the positive part of (.) is used otherwise it is
given a zero value. Formally
( {
The MARS model, f(X), is constructed as a linear
combination of BFs and their interactions, and is
expressed as
( ∑ (
where each λm is a basis function. It can be a spline
function, or the product of two or more spline functions
already contained in the model (higher orders can be
used when the data warrants it; for simplicity, at most
second order is assumed in this paper). The coefficients
β are constants, estimated using the least-squares
method. The aim of the backward deletion procedure is
to find a close to optimal model by removing
extraneous variables. The backward pass prunes the
model by removing terms one by one, deleting the least
effective term at each step until it finds the best sub-
model. Model subsets are compared using the less
computationally expensive method of Generalized
Cross-Validation (GCV).
III. RESULTS AND DISCUSSION
We can implement this system for uploading the heart
datasets from UCI Repository from this link
http://archive.ics.uci.edu/ml/datasets/Heart+Disease.
And we can perform regression analysis using tool
named as Salford Predictive modeler for WINDOWS
OS with any configuration. The imported datasets and
variables are shown in Table 1. Data used for present
work is obtained from UCI (University of California,
Irvine C.A) Centre for machine learning and intelligent
systems. The data have been collected from 303
patients are used for proposed work. This database
contains 76 attributes, 13 of them are available for
experiments but we have used only 11 of them which
are required for coronary heart disease. The attributes
that we have considered in this proposed work are:
Table 1. Dataset description
S.No Attribute Description
1 Age age in years
2 Sex Sex ( 1 = Male, 0 = Female)
3 Cp Chest pain type 1= typical
Angina
2 = Atypical
angina
3 = Non-Anginal
Pain
4 =
Asymptomatic
4 Trestbps Resting Blood pressure
5 Chol Serum Cholestoral
6 Fbs Fasting Blood sugar
7 Restecg Resting Electrocardiographic
results
0= Normal
1= Abnormality
2 = Ventricular hypertrophy
8 Thalach Maximum Heart rate achieved
9 Exang Exercise induced angina 1= yes
0=no
10 Slope The slope of the peak exercise ST
segment
1 = Upsloping
2 = Flat
3 = Downsloping
11 Diag Diagnosis
0 = Normal
1 = Heart Disease
Then we can choose target and predictive information.
From the above table, we can set target variable as
Diag and Predictive variable as Age and Gender.

Volume 2, Issue 6, November-December-2017 | www.ijsrcseit.com | UGC Approved Journal [ Journal No : 64718 ]
336
Figure 5. Upload dataset
The overall variables, records, numeric values are shown in
figure 5 and view all records in figure 6
Figure 6. View All Records
Target and predictive variable settings can be shown in
figure 7
Figure 7. Target and Predictive variable settings
Then perform various regression model MARS. The
results of all algorithms are shown in the figure 8
Figure 8. MARS performance

Volume 2, Issue 6, November-December-2017 | www.ijsrcseit.com | UGC Approved Journal [ Journal No : 64718 ]
337
Figure 9. Measurements of MARS
Figure 10. Gain values for MARS
From above model construction we can evaluate the
performance of each algorithm and compare the
performance based on test regression measurements
and shown in table and performance graph. The
performance is listed in table 2
Table 2. Performance of various algorithms
Algorithms RMSE MSE MAD
CART Decision tree 0.44604 0.198 0.397
CART ensemble tree 0.44603 0.195 0.39
Random forest 0.50248 0.252 0.421
MARS Regression 0.4413 0.194 0.389
A. RMSE performance
B. MSE performance
C. MAD performance
0.410.420.430.440.450.460.470.480.490.5
0.51
RMSE
RMSE
00.050.1
0.150.2
0.250.3
MSE
MSE
0.370.380.390.4
0.410.420.43
MAD
MAD

Volume 2, Issue 6, November-December-2017 | www.ijsrcseit.com | UGC Approved Journal [ Journal No : 64718 ]
338
Figure 11. Performance Graph of RMSE, MSE and
MAD measurements
From the above comparison, can be shown in fig 11,
MARS outperforms than the existing algorithms and
provides reduce number of RMSE, MAE and MAD
values and Provide GCV rate is 0.207 for 303 patients
datasets.
IV. Conclusion
Using data mining technology for disease prediction
and diagnosis has become the focus of attention. Data
mining technology provides an important means for
extracting valuable medical rules hidden in medical
data and acts as an important role in disease prediction
and clinical diagnosis. There is an increasing interest in
using regression trees to identify subgroups of heart
patients at increased risk for adverse events and
outcomes. In the current study, have demonstrated,
using a large sample of patients hospitalized with
regression. But regression tree methods did not predict
the patients as accurately as did conventional logistic
regression. Furthermore, demonstrated that the
predictive performance of conventional logistic
regression was comparable to that of modern flexible
regression method such as MARS models. This study
is a comparison analysis between various
integrated and enhanced regression methods.
Then aimed at using the SPM tool for regression
analysis of various regression algorithms in the tool by
setting the target and predictive attributes from the data
set and conclude the best by the various performance
measures such as RMSE, MSE and MAD values. The
performance measures are taken as the deviation and
error rate of the various regression algorithms. Among
them MARS proves to the best of all which is
concluded by the minimum error value and minimum
deviation. In future extend the framework to implement
neural network algorithms for prediction target
variables for classification with improved accuracy
results.
V. REFERENCES
[1]. Zhang, Wengang, and Anthony Teck Chee Goh.
"Nonlinear structural modeling using multivariate
adaptive regression splines." (2015).
[2]. Leathwick, J. R., et al. "Using multivariate
adaptive regression splines to predict the
distributions of New Zealand's freshwater
diadromous fish." Freshwater Biology 50.12
(2005): 2034-2052.
[3]. Han, Qiuyi, et al. "SLANTS: Sequential Adaptive
Nonlinear Modeling of Vector Time Series."
arXiv preprint arXiv:1610.02725 (2016).
[4]. Lu, Chi-Jie, Tian-Shyug Lee, and Chia-Mei Lian.
"Sales forecasting for computer wholesalers: A
comparison of multivariate adaptive regression
splines and artificial neural networks." Decision
Support Systems 54.1 (2012): 584-596.
[5]. Paciorek, Christopher J., and Mark J. Schervish.
"Nonstationary covariance functions for Gaussian
process regression." Advances in neural
information processing systems. 2004.
[6]. Rossel, RA Viscarra, and Thorsten Behrens.
"Using data mining to model and interpret soil
diffuse reflectance spectra." Geoderma 158.1
(2010): 46-54.
[7]. Menon, Ramkumar, et al. "Multivariate adaptive
regression splines analysis to predict biomarkers
of spontaneous preterm birth." Acta obstetricia et
gynecologica Scandinavica 93.4 (2014): 382-391.
[8]. Emamgolizadeh, S., et al. "Estimation of soil
cation exchange capacity using genetic expression
programming (GEP) and multivariate adaptive
regression splines (MARS)." Journal of
Hydrology 529 (2015): 1590-1600.
[9]. Zhang, Wengang, et al. "Assessment of soil
liquefaction based on capacity energy concept and
multivariate adaptive regression splines."
Engineering Geology 188 (2015): 29-37.
[10]. Zakeri, Issa F., et al. "Cross-sectional time series
and multivariate adaptive regression splines
models using accelerometry and heart rate predict
energy expenditure of preschoolers." The Journal
of nutrition 143.1 (2013): 114-122.
Recommended