Microalgae Biofuels and Carbon Cycling
Prepared for the 2009 Annual Conference GA A&WMA
Umakanta Jena
&
Nisha Vaidyanathan
Biorefining and Carbon Cycling Program
Department of Biological & Agricultural Engineering
The University of Georgia

Why Biomass?
Broad Problems: (1) Energy crisis and (2) global warming
U.S energy consumption 97 quads
(2001).
20 million bbl oil/ day, 55% imported, will
increase to 68% by 2025.
3% of total energy (2.9 quads) comes
from biomass.
National Target:
30% energy from biomass by 2030, 35
billion gallons of biofuel by 2017.
(USDA-DOE, 2005)
Need an increase in the biomass use for energy by five times.

U.S. leads among the producers of green house gas (GHG)
emissions in the world
2. Global warming

Highest biomass productivity, 100 g/m2/day
(365 tones/ha/yr against 70 tones/ha/yr for energy cane).
No competition with food unlike other biofuels
Uses waste water for growth (waste water treatment media)
Net GHG reduction as it is carbon neutral
(1.6-1.8 g of CO2 needed for biosynthesis of 1 g dry algalbiomass).
Why Microalgae ?

Production of biomass
◦ Cultivation
◦ Harvesting
Processing of biomass
Algae to biofuel: Major challenges

Attributes of Algae Production Costs
Algae Production
Costs
Major purchased equipment
Installation
Building
InfrastructureFertilizers
Labor
Electricity
Water OtherCO2

(Chisti, 2008;
Shen, 2009)

Present Algae Cultivation Systems-Open Ponds (suspended algae cultivation)
(Shen, 2009)

Photobioreactors for suspended algae cultivation
(Tredici, 1999)

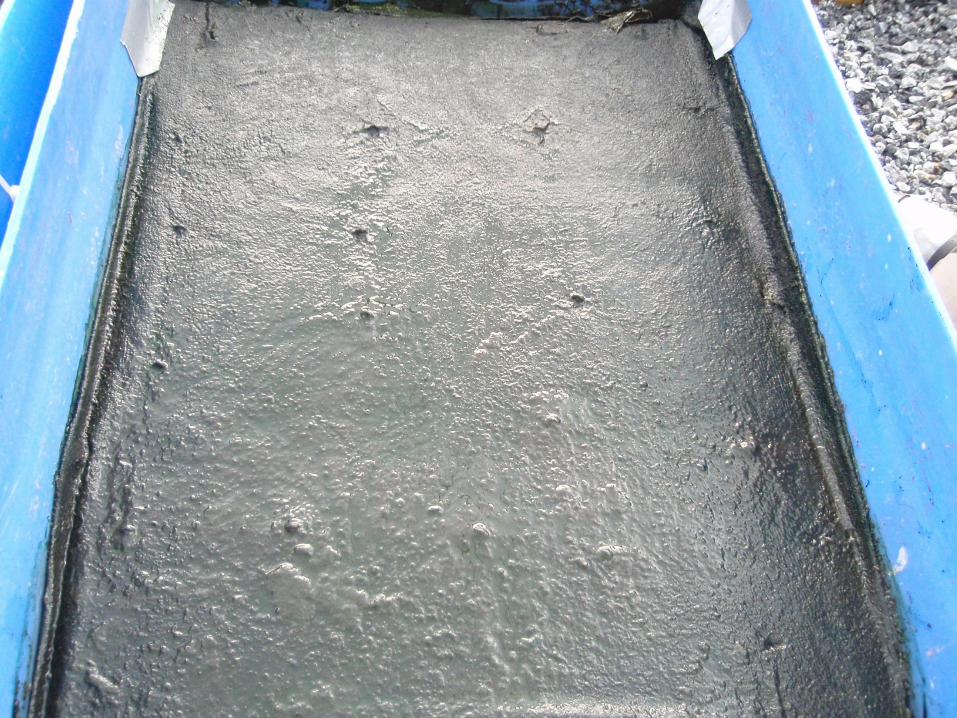
Immobilized algae cultivation systemsfor Attached algae
Enclosure methods :(a) cells in a polymer matrix sheet; (b) cells in a gel bead
Non enclosure methods- Algal Turf Scrubber Technology developed for attached algae cultivation
(Shen, 2009)

Dewatering or harvesting
Low productivities
Improper mixing of water
Contamination
Predation
Highly technical and hence least economical

A substrate material. Cells grow attached on
this substrate. Initial attachment by
bacteria. Algae starts dominating
the substrate with the help of bacteria.
Mature biomat formation with highest dominance by algae. (Adey, 1980)

To develop an advanced cultivation system for algal biomat production using high strength industrial wastewater for bioremediation, carbon cycling and bioenergy applications.

Standard reactor configuration

Attached algae cultivation systems at UGA Bioconversion laboratory

Preliminary experimental details
Substrates- Geotextile and polymer materials
Growth media- Tap water and industrial wastewater.
Months: April-July 2009
pH of water- 7.5
Span of each experiment- 21 days


Results and discussion
S1-Substrate 1 (Polymer material)S2-Substrate 2 (Geotextile material)
0
5
10
15
20
25
S1 S2 S1 S2 S1 S2 S1 S2
Mixed culture A Ulothrix Mixed culture B
g/m
²/d
ay
Biomass Productivity
Harvest1 Harvest2 Harvest3
Tap WaterDalton Utilities Raw Water

VARIABLES
GROWTH MEDIA
TAP WATER INDUSTRIAL WASTEWATER
1.Microbial consortia Chlamydomonas, Diatoms, Thin
filaments, Bacteria
Oscillatoria, Diatoms, Ulothrix,
Chlamydomonas, Nostoc,
Characium sp., Anabaena, Thin
filaments, Bacteria
2.Productivity
(g/m2/day) 7.7 15.0
3. Structural Compositions (%)
Carbohydrates 17 25.0
Proteins 44.0 41.5
Lipids 3.2 8.8

35
7.67
0.6
49.8
Algae grown with tap water
46
8.49.5
0.77
35.33
Algae grown with
industrial wastewater
Carbon (%)
Hydrogen (%)
Nitrogen (%)
Sulphur (%)
Other (%)

Nutrient removal potential
- Efficient wastewater treatment with
83% nitrogen, 47% ammonia and 76%
phosphate removals.
• - Low water evaporation losses from
• reservoir.
0
20
40
60
80
100
0 1 2 3 4 5 6 7
%re
mo
val
Time (days)
%Nitrogen removal
%removal
0
20
40
60
80
100
0 1 2 3 4 5 6 7
%re
mo
val
Time (days)
%Ammonia removal
%removal
0
20
40
60
80
100
0 1 2 3 4 5 6 7
%re
mo
val
Time (days)
%Phosphate removal
%removal

Future work
Improve the reactor configuration to an
advanced and robust system.
Experiment different optimizing
conditions for best biomat productivity.
Assess the cost economics of the
improved bioreactors in comparison open
pond cultivation systems

Next step??Processing of
Microalgae into fuels
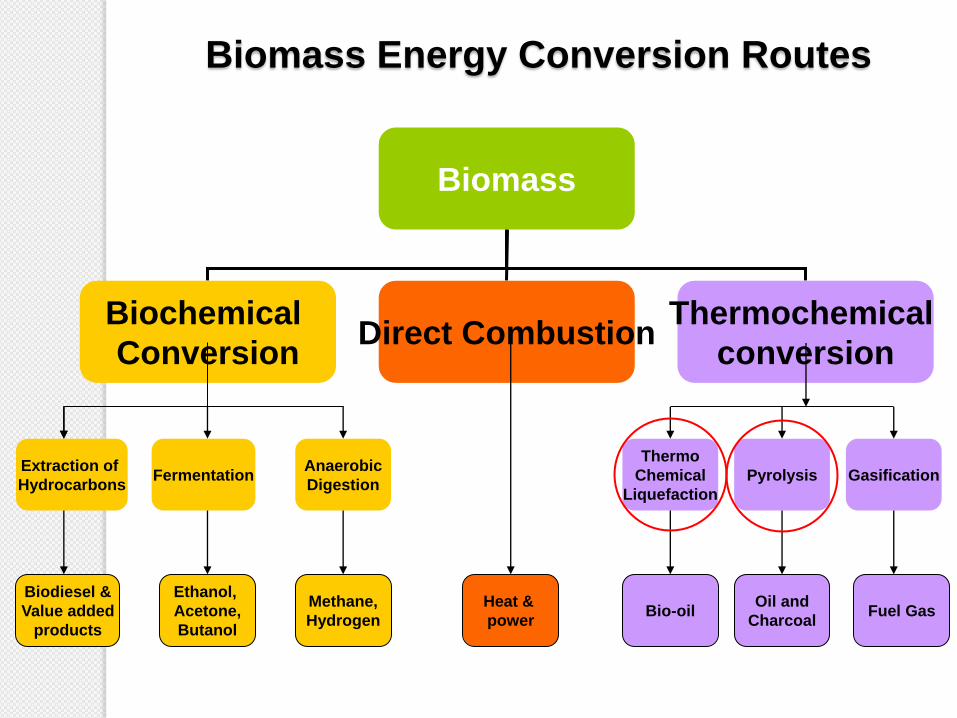
Biomass Energy Conversion Routes
Biomass
Biochemical
ConversionDirect Combustion
Thermochemical
conversion
FermentationAnaerobic
Digestion
Extraction of
Hydrocarbons
Thermo
Chemical
Liquefaction
Pyrolysis Gasification
Ethanol,
Acetone,
Butanol
Methane,
Hydrogen
Biodiesel &
Value added
products
Heat &
powerBio-oil
Oil and
CharcoalFuel Gas

What is pyrolysis
Heating of biomass in absence of oxygen

Thermochemical Liquefaction
Solubility, density, ionic properties, chemical potential, reactivity of water
change drastically as it approaches towards critical point
(Matsumura et al, 2006)
Hydrothermal conversion under high pressure
Tarry material is the
precursor to biocrude or bio-
oil

Our research goal
Investigate the production of bio-oil (biocrude) from
microalgae by two thermochemical conversion
processes

Compositional Analysis
Ultimate analysis
Biocrude
Se
pa
rati
on
TCC Process
Proximate
Analysis
Bomb Calorimeter
Analysis
GC-MS
GC Analysis
Sta
tistical A
naly
sis
Microalgae
Gas
Aqueous phase
Experimental Methodology
Solid residue
HPLC Analysis
Reactio
n m
ixtu
re

1. N2 gas cylinder, 2. Flow meter, 3. Heating furnace, 4. Reactor,
5. Thermocouple, 6. Data logger, 7. Sample, 8. Condenser set
up, 9. Ice bath, 10. Gas vent
1
2
34
7
8
9
10
6
5
8
Experimental Set up for Batch Pyrolysis

P
rpm
Gas sample
Water in
7 8
1 2
11
10
9
1-Reactor, 2-Heater
unit 3-Power relay
4-Pressure sensor
5-Thermocouple,
6- Stirrer assembly,
7- Controllers,
8- Computer,
9-Condenser for liquid
sampling, 10-Valves 11-
N2 gas cylinder
3
4
5
6
10
10
10
Power supply
Experimental set up for TCL
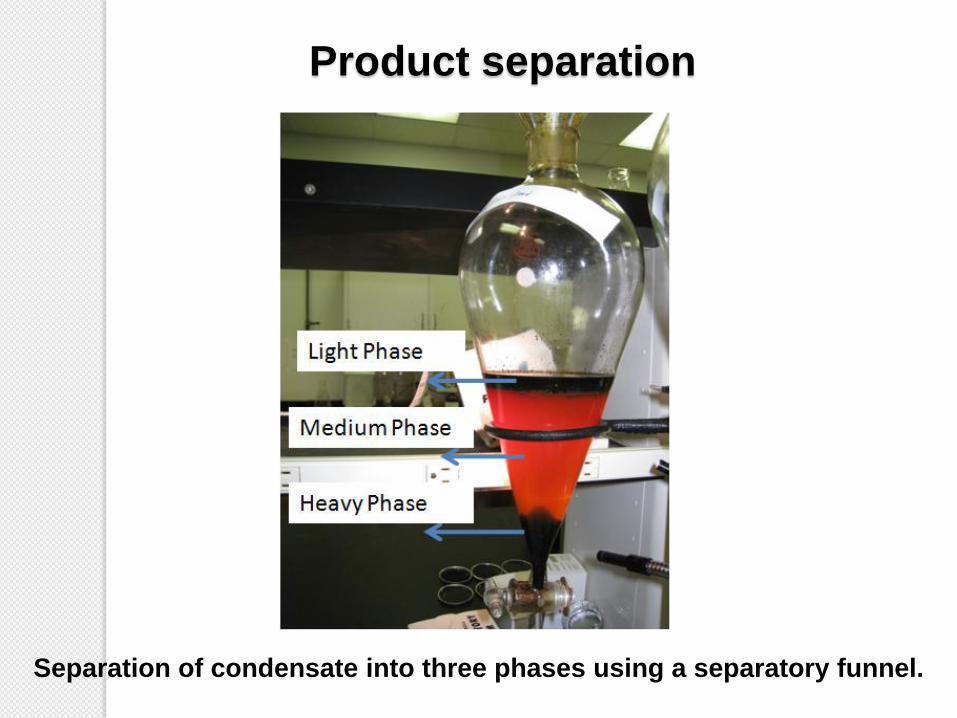
Separation of condensate into three phases using a separatory funnel.
Product separation

Results: Feedstock composition
Composition Algae feedstock
Proximate analysis (%)
Moisture 6.04±0.02
Volatiles 80.70±0.05
Ashes 6.60±0.05
Fixed carbon 15.25±0.06
Ultimate analysis (%)
C 45.16±0.19
H 7.14±0.20
N 10.56±0.04
S 0.74±0.01
Higher heating value, (HHV) in MJ/kg 20.52±0.23
* Biochemical composition, (%)
Protein 68.64±0.26
Lipids 13.30
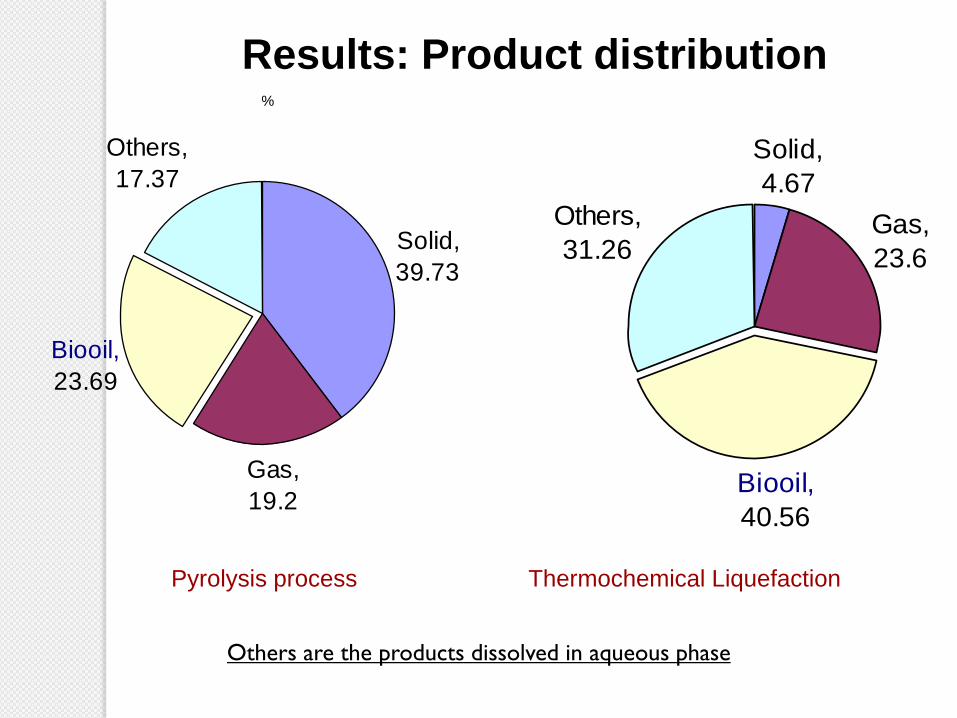
Results: Product distribution
Thermochemical LiquefactionPyrolysis process
Others are the products dissolved in aqueous phase
%
Solid,
39.73
Gas,
19.2
Others,
17.37
Biooil,
23.69
Solid,
4.67
Gas,
23.6
Biooil,
40.56
Others,
31.26

Results: Biocrude Vs petroleum crude oil
Biocrude
from
Pyrolysis
Biocrude
from
TCL
Petrocrude
(Matar and
Hatch, 2001)
Elemental analysis
Carbon, wt% 67.52 74.66 84.6
Hydrogen, wt% 9.83 10.57 12.8
Nitrogen, wt% 10.71 7.13 0.4
Sulfur, wt% 0.45 0.81 1.5
Oxygen, wt% 11.34 9.63 0.5
Viscosity, Cp 23.36 82.63 23
Heating value, MJ/kg 28.03 30.82 42
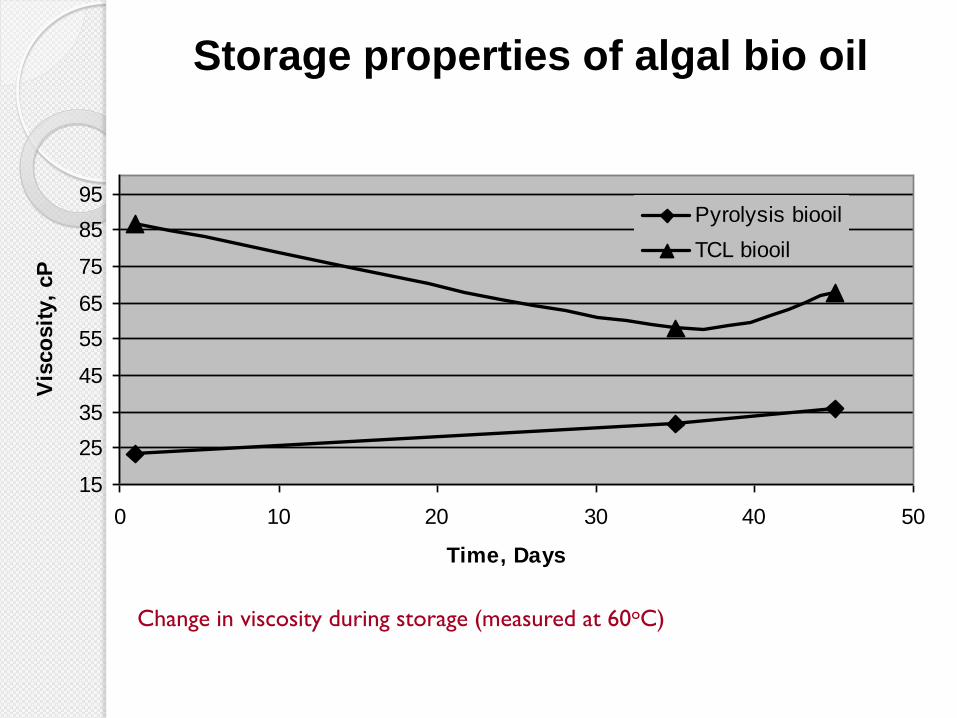
15
25
35
45
55
65
75
85
95
0 10 20 30 40 50
Time, Days
Vis
co
sit
y,
cP
Pyrolysis biooil
TCL biooil
Storage properties of algal bio oil
Change in viscosity during storage (measured at 60oC)

Results: Analysis of biocrude
5 . 0 0 1 0 . 0 0 1 5 . 0 0 2 0 . 0 0 2 5 . 0 0 3 0 . 0 00
1 0 0 0 0 0
2 0 0 0 0 0
3 0 0 0 0 0
4 0 0 0 0 0
5 0 0 0 0 0
6 0 0 0 0 0
7 0 0 0 0 0
8 0 0 0 0 0
9 0 0 0 0 0
1 0 0 0 0 0 0
1 1 0 0 0 0 0
1 2 0 0 0 0 0
1 3 0 0 0 0 0
1 4 0 0 0 0 0
1 5 0 0 0 0 0
1 6 0 0 0 0 0
1 7 0 0 0 0 0
1 8 0 0 0 0 0
1 9 0 0 0 0 0
2 0 0 0 0 0 0
T im e -->
A b u n d a n c e
T I C : J 1 N C 3 5 0 . D \ d a t a . m s
2 . 9 8 4
3 . 6 7 3
4 . 5 2 4 5 . 4 1 2
8 . 2 9 2
1 0 . 1 9 5
1 1 . 9 6 3
1 2 . 4 9 4
1 4 . 3 0 3
1 5 . 8 7 1
1 7 . 3 0 51 7 . 3 9 21 7 . 4 7 01 7 . 5 3 2
1 8 . 5 4 9
1 9 . 4 9 2
2 0 . 0 5 72 0 . 4 7 82 0 . 5 4 62 0 . 8 2 9
2 1 . 2 7 8
2 1 . 3 4 62 2 . 1 1 0
2 2 . 4 1 6
2 2 . 8 4 32 3 . 4 0 9
2 3 . 6 4 8
2 3 . 8 3 7
2 4 . 0 5 02 5 . 4 9 22 5 . 5 6 9
2 5 . 9 6 12 6 . 3 8 52 6 . 7 8 12 6 . 9 3 2
2 8 . 1 8 0
2 8 . 2 5 0
Hexadecanoic acid
PhenolsIndolesFuran
Pentanones
Pentadecence
BenzenamineCyclohexanol
Pentadecanoic acidAlkanes
Carboxylic acids
Styrene
Majority of the compounds of bio-crude (Phenol, furan, styrene, indole,
alkanes, benzene, cyclohexane) are basic components of the petroleum
crude oil.

Results: Other co-products
0
10
20
30
40
50
60
70
80
Carbon dioxide Carbon
monoxide
Hydrogen Methane Methyl acetylene
%
Spirulina Mixed algae
0
5
10
15
20
25
Sp/Cat5/30 min Sp/Cat5/60 min SP/NC/60 min MA/NC/60 min
Treatments
Yie
ld,
g/k
g o
f alg
ae
Ethanol Formate Succinate
Gas analysis
CO2 is the major product.
H2, CH4 and C2H5 are high
energy value gases and
can be used as fuel gas
Aqueous phase
analysis
Ethanol, formate and
succinates are the major
products, can be used
as fuels/ chemicals

Major conclusions
Microalgae have potential for biofuel in the form of biocrude that has similar fuel properties as the petroleum crude oil.
About 25-30% and 36-48% biocrude could be produced from spirulina platensis via pyrolysis and TCL respectively .

Benefits: Conceptual microalgae biorefineries
Algae cultivation
and harvesting
Microalgae TCC
Processing
SyngasBiocrude Solid/ char
Land use
(Fertilizer)
Carbon
catalysts
UpgradingTransesterification Upgrading
BiodieselTransport
fuel
Upgrading
Combustion for
maintaining
temperature and
CO2 level
Aqueous phase
Recycled
water
Industrial Waste waterCO2
Chemicals

Social
(Biofuels,
new jobs, science
& technology)
Environment
(GHG reduction,
water quality)
Economic
(New business
Opportunities)
Is the concept sustainable ??

Acknowledgements
United States Department of Energy
Dalton Utilities, GA
UGA Biorefining and Carbon Cycling Program
Dr K C Das
Dr Senthil Chinnasamy
Dr Ashish Bhatnagar
Joby Miller

THANK YOU !!!
QUESTIONS?

Methodology: Product Separation
Microalgae
Liq
uefa
ctio
n
Gas
Reaction mixture
Water soluble
Aqueous phase Bio-crude
Water insoluble
Washing with water and filtration
Acetone soluble
Washing with acetone and filtration
Acetone insoluble
Solid residue
Evaporation Drying

100biomassstartingofWeight
biocrudeofWeight(%)yieldBiocrude
100biomassstartingofWeight
gasofWeight(%)yieldGas
100biomassstartingofWeight
residuesolidofWeight(%)yieldSolid
solid)gascrude(bioofyield%100(%)yieldOthers
Methodology: response terms
100valueHeatbiomassstartingofWeight
valueHeatresiduesolidofWeightvalueHeatbiomassstartingofWeight(%)CCE
Carbon conversion efficiency (CCE)

(1) Computer connected to thermocouples, (2) Carrier gas cylinder, (3) Mass flow
controller (4) Oven, (5) Pyrolysis reactor, (6) Thermocouples , (7) Condensing traps
2
1
3
45
6
7
Batch Pyrolysis Experimental Set up
Vent
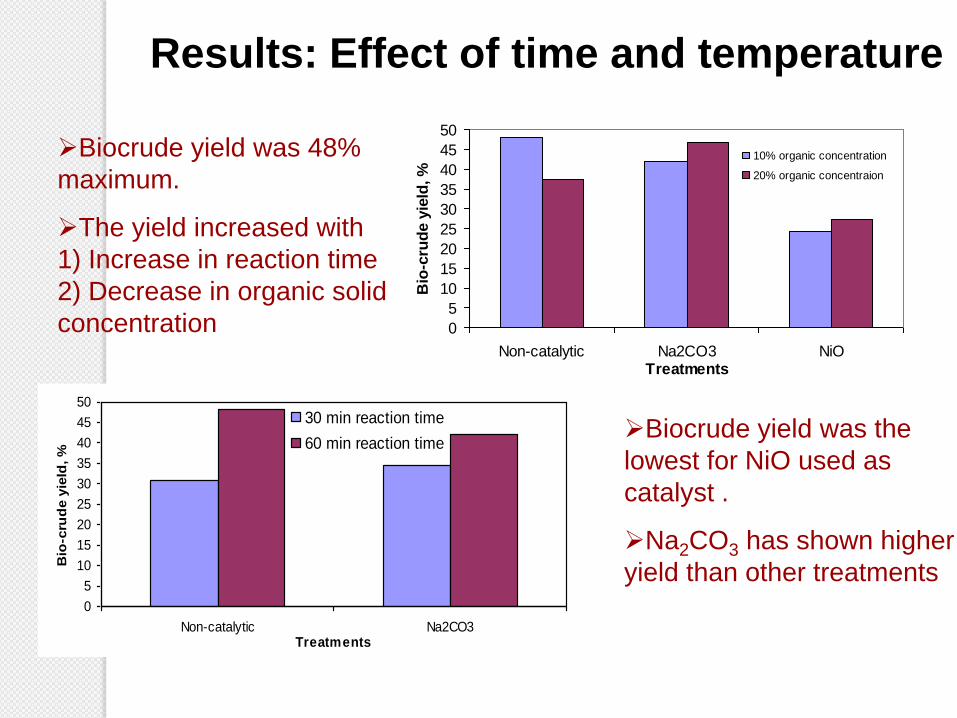
Results: Effect of time and temperature
0
5
10
15
20
25
30
35
40
45
50
Non-catalytic Na2CO3 NiOTreatments
Bio
-cru
de y
ield
, %
10% organic concentration
20% organic concentraion
0
5
10
15
20
25
30
35
40
45
50
Non-catalytic Na2CO3Treatments
Bio
-cru
de y
ield
, %
30 min reaction time
60 min reaction time
Biocrude yield was 48%
maximum.
The yield increased with
1) Increase in reaction time
2) Decrease in organic solid
concentration
Biocrude yield was the
lowest for NiO used as
catalyst .
Na2CO3 has shown higher
yield than other treatments

Bio-oil
Char as Soil
conditioner
Pyrolysis Process
Heating Biomass
in absence of oxygenGaseous products
Recommended