International Journal of Solids and Structures 60–61 (2015) 107–124
Contents lists available at ScienceDirect
International Journal of Solids and Structures
journal homepage: www.elsevier .com/locate / i jsols t r
Mechanical response of Ti–6Al–4V octet-truss lattice structures
http://dx.doi.org/10.1016/j.ijsolstr.2015.02.0200020-7683/� 2015 Elsevier Ltd. All rights reserved.
⇑ Corresponding author. Tel.: +1 434 982 5678.E-mail address: [email protected] (L. Dong).
Liang Dong a,⇑, Vikram Deshpande b, Haydn Wadley a
a Department of Materials Science and Engineering, University of Virginia, Charlottesville, VA 22903, United Statesb Engineering Department, Trumpington Street, University of Cambridge, UK
a r t i c l e i n f o a b s t r a c t
Article history:Received 11 December 2014Received in revised form 8 January 2015Available online 19 February 2015
Keywords:Octet-truss latticeElastic stiffnessStrengthTitanium alloys
A simple snap-fit and vacuum brazing method has been developed to fabricate three dimensional spacefilling octet-truss lattice structures from Ti–6Al–4V alloy sheets. Using strut lengths of 7–25 mm resultedin a relative density of the lattices ranging from 2% to 16%. The lattice elastic stiffness constants andstrengths have been characterized under through-thickness compression and in-plane shear as a functionof their relative density, and are shown to be well predicted by previously proposed micromechanicalmodels adapted to account for the increased nodal mass and strut separations of the snap-fit latticedesign. The Ti–6Al–4V octet-truss lattices exhibit excellent mechanical properties compared to othercellular material – cell topology combinations, and appear to be promising candidates for high tem-perature applications where a robust mechanical performance is required.
� 2015 Elsevier Ltd. All rights reserved.
1. Introduction
There are many ways to create 3D space filling cellular materials.Periodic cellular structures, are constructed from unit cells withhoneycomb (Bitzer, 1997; Wadley, 2003, 2006; Dharmasena,2008; Russell et al., 2008), tetrahedral (Sypeck, 2002; Kooistra,2004, 2007; Lim and Kang, 2006), 3D Kagome (Lim and Kang,2006; Lee et al., 2007; Park et al., 2011), octet truss (Bitzer, 1997;Fuller, 1961) and pyramidal (Kooistra, 2007; Queheillalt, 2005;Finnegan et al., 2007; Queheillalt et al., 2008) arrangements of websor struts. Tetrahedral, pyramidal and 3D Kagome unit cells requirestruts or webs to connect their out of plane members in order forthem to become statically determinant, stretch-dominated struc-tures (Deshpande et al., 2001). Space filling, structurally efficientlattices can then be constructed by the assembly of these unit cellsin three dimensions. These statically determinate lattice structurescan act as a material in the sense that their properties are indepen-dent of the size of the sample, provided its exterior dimensions arelarge compared to those of its cells. However, in some sandwichpanel applications (Sypeck, 2002; Kooistra, 2004, 2007; Wanget al., 2003) it may be preferable to use only the out of plane websor struts to maintain separation of the face sheets while utilizingthe faces to ensure unit cell static determinacy. Foams made frompolymers, metals or ceramics with interconnected or closed cellsalso provide a means for filling space with a random arrangementof cells (San Marchi et al., 2002). However, their cells have a vari-
able (but low) strut or web nodal connectivity, and are bendingdominated structures with moduli and strengths that decreaserapidly as the fraction of solid material (their relative density) isdecreased (Deshpande et al., 2001).
Lattice structures with open cell intermediate face sheetsbetween the layers of inclined struts, such as the octet-truss lattice(Bitzer, 1997; Fuller, 1961), have attracted considerable recentinterest since they are structurally more efficient than foams of asimilar density made from the same material. Recent castingapproaches have demonstrated the possibility of making octet-truss lattices with strut lengths in the 5–10 mm range(Deshpande et al., 2001), while self-propagating waveguide or laserbased stereo-lithographic methods, when combined with electro-less nickel plating or vapor deposition have enabled fabricationof micrometer scale structures (Torrents et al., 2012; Zheng et al.,2014; Bauer et al., 2014) offering opportunities to exploit otherfunctionalities of materials available in the small length scale limit.
An octet-truss lattice structure is illustrated in Fig. 1, and wasfirst proposed by Fuller (1961), as a method for filling 3D spacewith a structurally efficient truss structure of arbitrary cell size.Its nodes form a face centered cubic structure, Fig. 1(b). Since thestructure has a high nodal connectivity of 12, its mechanicalresponse is stretch-dominated (Deshpande et al., 2001). Whenmade from high specific modulus and strength materials, theoctet-truss lattice is therefore a weight efficient, stress supportingcellular topology, with a stiffness and strength predicted to scalelinearly with relative density, �q (the density of the structure dividedby that of the material from which it is made) (Wadley, 2006).

Fig. 1. (a) An octet-truss lattice constructed by the 3D packing of unit cells. (b) A unit cell of the face centered cubic crystal symmetry octet-truss lattice is composed of acentral octahedral cell constructed with 12 struts that is bounded by 8 edge tetrahedrons. Each node within the octet lattice lies at the intersection of 12 struts.
Fig. 2. Material property charts comparing material stiffness (a) and strength (b) incompression against density. The experimental data (unit cell response, Table 2)and predicted range of these properties for the Ti–6Al–4V octet-truss latticestructure fabricated here (Ti–6Al–4V snap fit octet lattice) have been included forcomparison with other octet lattice truss materials. The grey shaded areas defineregions that cannot be reached under ambient conditions.
108 L. Dong et al. / International Journal of Solids and Structures 60–61 (2015) 107–124
Material property charts are a useful way to compare themechanical properties of low density materials. Fig. 2 shows thedensity dependent modulus and strength under compressive load-ing for low density foams (polymer, metal and alumina) and spacefilling lattice structures made from investment cast Al–7Si–0.3Mg(Deshpande et al., 2001), Ti–6Al–4V and Ti–6Al–2Sn–4Zr–2Moalloys (Li et al., 2008a,b), similar structures made by electrodeposi-tion of Ni–7P (Torrents et al., 2012; Zheng et al., 2014), from carbonfiber laminate composites (Cheung and Gershenfeld, 2013), photo-sensitive HDDA polymers (Zheng et al., 2014), and by the vapordeposition of alumina (Zheng et al., 2014; Bauer et al., 2014). Themoduli and strengths of both foams and lattices scale with thoseof the materials from which they are made (Gibson and Ashby,1999; Ashby, 2000), but foams are substantially more compliantand weaker than lattice topology counterparts (made with thesame density and material) for reasons identified above.
Octet-truss lattice structures made from low density metalalloys with strut diameters in the millimeter range are potentialcandidates for stress supporting aerospace applications. Light-weight aluminum alloy octet-truss lattice structures have beenmade by an investment casting (Deshpande et al., 2001) and by3D additive manufacturing methods (Rosen, 2007; Chu et al.,2010; Williams et al., 2011). However, these processes remain dif-ficult to implement with the highest strength to weight ratio alloysof aerospace interest. There is particular interest in making octet-truss structures from titanium alloys since their strength to weightratio is approximately twice that of aluminum alloys. Many titani-um alloys can also be used at continuous service temperatures wellabove the limits of other light metal alloys based on aluminum ormagnesium (Kulekci, 2008; Ye, 2003). Some titanium alloys alsohave excellent corrosion resistance, and are therefore widely usedin chemical processing equipment (Couper et al., 2009), and heatexchangers (Lu et al., 1998; Boomsma et al., 2003). The Ti–6Al–4V alloy is the most widely used titanium alloy, and accounts formore than 50% of total titanium usage. Its uses include aircraft tur-bine engine and structural components, fasteners, high perfor-mance automotive parts, and a variety of marine applications(Boyer et al., 1993; Ritchie et al., 1999; Brewer et al., 1998; Boyerand Briggs, 2005; Froes et al., 2004; Gorynin, 1999).
Titanium alloy lattice structures have been fabricated withaerospace-quality investment casting techniques (Li et al.,2008a,b). While this approach has the potential to enable fabrica-tion of complex shaped structures, it is costly to implement, andrequires development of methods to detect and repair the castingdefects often present in investment cast lattice structures (Wanget al., 2003). Because of the cost and complexity of the titaniuminvestment fabrication process, there is very limited mechanical
property data for titanium-based lattice structures as a functionof their relative density, Fig. 2.

L. Dong et al. / International Journal of Solids and Structures 60–61 (2015) 107–124 109
Here, we explore the use of a simple ‘‘snap-fit’’ method(Finnegan et al., 2007) for fabricating the struts and open facesheets of planar octet-truss structures from thin plate material.This assembly method is combined with vacuum brazing tofabricate octet-truss lattices from a Ti–6Al–4V alloy sheet. Themechanical responses of the titanium octet-truss lattices undercompression and shear have been experimentally investigated,and their compressive and shear strengths and moduli determinedas a function of lattice density, and compared with microme-chanical predictions to evaluate the inter relationships betweenlattice topology, material properties and relative density.
2. Lattice fabrication, relative density and solid materialproperties
2.1. Lattice fabrication
The octet-truss lattice structures were fabricated from Ti–6Al–4V sheets of a single thickness, t = 1.59 mm, in a three step processsummarized schematically in Fig. 3. The truss row patterns,Fig. 3(a), and intermediate (open cell) face sheets, Fig. 3(c), werewater jet cut from as-received Ti–6Al–4V sheets forming thegeometries shown in the two figures. Rows of trusses werecollinearly aligned and a second collinear array, oriented at 90�to the first, was snap-fit attached to their tops forming a [0�/90�]arrangement of trusses enclosing a pyramidal void shape,Fig. 3(b). Control of the slot tolerance in the nodal regions enableda mechanically stable snap-fitted plane of pyramidal trusses to beassembled in this way. The truss layer planes were then snap-fittedinto the crosses of the intermediate face sheet and the processrepeated to form the octet-truss lattice, Fig. 3(d). Samples withsquare cross section trusses of width t, and various lengths, l, weremade to enable study of the truss slenderness ratio, t/l, uponmechanical response. The geometric parameters defining thestructures assembled for testing are defined in Fig. 4 and their val-ues summarized in Table 1 for each test structure. The maximumgap (determined by the tolerances of the water-jet cutting process)between struts meeting at the nodes was about 90 lm.
The snap-fit lattice was bonded using a vacuum brazingapproach. A 40Ti–20Cu–20Ni–20Zr (wt.%) braze alloy (Lucas Mil-haupt) was first applied to the nodal regions of the assembledstructure. The alloy was applied as a powder carried in a polymerbinder. Brazing was accomplished by placing the lattice structuresin a high-temperature vacuum brazing furnace and heating at10 �C/min to 500 �C, holding for 20 min to volatilize and removethe polymer binder from the furnace, and then heating to 900 �Cfor 30 min at a chamber pressure of �5 � 10�2 Pa. This braze alloyhas a solidus temperature of 848 �C. Once melted, it wetted thistitanium alloy well, and flowed freely to fill small gaps at the nodesat the brazing temperature used in the study. After brazing, thefurnace was cooled at a rate of 45 �C/min, to 600 �C, at which tem-perature a 20 min annealing was performed to reduce internalresidual stress. The furnace was finally cooled to ambient tem-perature at a rate of 15 �C/min.
The strength of a brazed bond between two plates generallydecreases as the gap between them increases. Lap shear test cou-pons with gaps of �90 lm were included in the brazing runs andsubsequently tested, in accordance with the ASTM D1002 standard,to ensure adequate bond strength was achieved. The measuredshear strength of 40Ti–20Cu–20Ni–20Zr bonded Ti–6Al–4V sheetswas found to be approximately 450 MPa for a brazed joint gap ofabout 90 lm.
Photographs taken from several orientations of one of thebrazed lattice structures later used for compression testing areshown in Fig. 5. Octet-truss lattice structures for shear testing werealso manufactured with solid external face sheets to facilitate grip-
ping in a shear test fixture. Since the in-plane shear response of theoctet-truss core is anisotropic, the response is dependent on thedirection of shearing. The unit cell sketched in Fig. 4(c) specifiesthe shearing direction by the angle, a = 45� or 0�. Photographs ofthe shear samples for testing in both a = 45� and 0� orientationsare shown in Fig. 6 during their assembly process so that the orien-tation of the lattice can be clearly seen. The top row of photographsshows that a two cell wide, octet-truss core, orientated witha = 45� can have either two or three nodal connections with thesolid face sheet through which shear loads were applied. Sincethe number of nodal connections at the edge of a shear sampleinfluences the mechanical response, samples with two edgegeometries (identified as Type I and II), were fabricated, and alsoshown at various stages of assembly in Fig. 6(a) and (b).
2.2. Relative density
A schematic drawing of the octahedral unit cell of the snap-fitlattice is shown in Fig. 4(c) together with coordinate systems usedlater. It also defines the geometric parameters of the lattice. Notethat for the square cross section truss, t = w, and we selected a trussinclination angle x = 45� to balance the compressive and shearresponses of the structure. By calculating the volumes of regionsoccupied by material, and scaling this by the unit cell volume,the relative density, �q of the octahedral unit cell of the snap-fitoctet-truss lattice (including nodal mass contributions) is given by;
�q ¼6ffiffiffi2p
lt2 þ K1 � K2t þ 2ffiffiffi2p
t2� �
t
ðlþ K3Þðlþ K4Þ2ð1Þ
where,
K1 ¼ffiffiffi2pðbþ 2mÞ2 þ 2
ffiffiffi2p
hðbþ cÞ þ 4ffiffiffi2p
bhtab
K2 ¼ ð2ffiffiffi2pþ 2Þb� 2c þ 2
ffiffiffi2pðhþ htabÞ þ 8m
K3 ¼ffiffiffi2pðhþ 2htabÞ;
K4 ¼ffiffiffi2p
2ðbþ cÞ
and the geometric parameters are defined on Fig. 4.Eq. (1) was arranged in this way to separate volume contribu-
tions from the trusses (first term of the numerator) and nodes.Some further simplification can be achieved by introducing non-di-mensional lengths; �t ¼ t=l, �b ¼ b=l, �c ¼ c=l; �htab ¼ htab=l, �h ¼ h=l and�m ¼ m=l. As a result, �K1 ¼ K1=l2, �K2 ¼ K2=l, �K3 ¼ K3=l, and�K4 ¼ K4=l, whereupon;
�q ¼6ffiffiffi2p
�t2 þ �K1 � �K2�t þ 2ffiffiffi2p
�t2� �
�t
ð1þ �K3Þð1þ �K4Þ2 ð2Þ
It can be shown that in the limit of vanishing node size, Eq. (1)reduces, in a first order approximation, to the relative densityexpression for the ideal octet-truss lattice;
�qoct ¼ 6ffiffiffi2p t
l
� �2
ð3Þ
Octet-truss lattice structures, with the extra mass of nodal mate-rial accounted for, have a relative density given by Eq. (1), and werefabricated with relative densities ranging from 2% to 16% by allow-ing the strut length l to vary between 7 and 25 mm. All the latticestructures had square cross section struts with a width, w and thick-ness t = 1.59 mm, and node widths defined by b = 4.76 mm and

Fig. 3. Schematic illustration of the ‘‘snap-fit’’ truss fabrication and assembly method for making the Ti–6Al–4V octet-truss lattice.
110 L. Dong et al. / International Journal of Solids and Structures 60–61 (2015) 107–124
c = 2.24 mm. The relative densities calculated by either Eq. (1) (or byEq. (3)) ranged from 2.4% (or 3.4%) for the lowest density sample to15.9% (or 43.3%) for the highest density sample.
2.3. Solid material characterization
A low magnification micrograph of the nodal region of a brazedlattice structure taken in the backscattered electron imaging (BSE)mode1 is shown in Fig. 7(a). It can be seen that the braze alloy wet-ted the Ti–6Al–4V base metal and was drawn into both the narrowand wider gaps between the truss members. High magnificationviews of both narrow and wider gap areas, marked by dashed boxesin Fig. 7(a) at the central bond line are shown in Fig. 7(b) and (c).Since the brazing temperature (900 �C) was below the b-phase tran-sus temperature (980 �C) for the Ti–6Al–4V alloy (Donachie, 2000),the original equiaxed a-grain and intergranular b-phase microstruc-ture of the original alloy was preserved. The average grain diameterof the a-phase was about 7 lm, while the average thickness of theb-phase was less than 1 lm, Fig. 8.
A brazed joint typically consisted of three zones marked 1, 2and 3, Fig. 7(b). Region 1 was the diffusion zone with a fineWidmanstätten structure in the base alloy near the interface(Onzawa et al., 1990; Botstein and Rabinkin, 1994; Lugscheiderand Broich, 1995). Region 2 was a b-titanium rich zone next tothe diffusion zone, while region 3 was a brittle intermetallic phaserich zone at the center of the braze filled region (at center ofFig. 7(b)). The central (brittle intermetallic phase rich) zone couldbe eliminated when the brazing joint clearance was sufficientlysmall, as shown in Fig. 7(c). In this case, the brazed joint consistedof only the diffusion and b-titanium phase zones with a totalthickness of approximately 90 lm. Elemental distribution maps
1 Lighter grey contrast regions correspond to areas with a higher concentration ofhigh atomic number elements.
corresponding to regions (b) and (c) of Fig. 7 are shown inFig. 7(d) and (e) respectively. They show the spatial distributionof the alloy elements (Ti, Al, V) and those of the braze alloy(Zr, Ni, and Cu) for both the narrow and wide gap regions of a brazejoint. Substantial lateral diffusion of Zr, Cu and Ni into the titaniumalloy had occurred in the narrow clearance region of a joint. How-ever, the intermetallic rich region at the center of the wider gapregions of a joint retained substantial Cu, Zr and Ni from the brazealloy following the brazing recipe used here.
In order to later predict lattice mechanical properties, the uni-axial tensile response of Ti–6Al–4V alloy subjected to the samethermal history as the lattice structures was measured. The tensileresponse measured at a strain rate of 10�4 s�1 is shown in Fig. 9.The elastic (Young’s) modulus, Es and 0.2% offset yield strength,rys were 123 GPa and 932 MPa, respectively. The tangent modulus,Et (given by the slope of the true stress–true strain response of thesolid material at the inelastic bifurcation stress, rIE) was obtainedby differentiation of a modified Ramberg–Osgood fit (Rasmussen,2003) to the measured stress–strain responses. The inelastic bifur-cation stress was obtained using the tangent modulus theory (Gereand Timoshenko, 1984; Shanley, 1967) as discussed in Section 4.2.
3. Compression and shear responses
The Ti–6Al–4V octet-truss lattices were tested at ambient tem-perature in free compression and shear at a nominal strain rate of3 � 10�4 s�1 in accordance with ASTM standards C365 and C273.The ASTM C273 standard specifies use of a compression shear plateconfiguration and a length to thickness ratio of the shear sandwichpanel larger than 12:1; however, a smaller length to thickness ratiois also acceptable as later clarified by Adams (Adams, 2007). Theshear samples used here had a length to thickness ratio of about4:1. The shear response was also dependent upon the directionof loading with respect to the lattice orientation. Tests were

Fig. 4. The geometries with relevant design variables identified of (a) the out ofplane trusses and (b) the intermediate truss layer, (c) the unit cell of the snap-fitmodified octet-truss lattice with the Cartesian co-ordinate system and loadingdirections also specified.
L. Dong et al. / International Journal of Solids and Structures 60–61 (2015) 107–124 111
therefore conducted at two orientations to determine the twoindependent in-plane shear tensor strength and moduluscomponents. The measured load cell forces were used to calculatethe compressive and shear stresses applied to the structure. The
Table 1Node and strut dimensions for the octet-truss lattices used in this study (unit: mm).
t w b c h
1.588 1.588 4.763 2.235 0.953
sample side lengths are defined using Figs. 5 and 6, as the distancesbetween the left-and-right edges of the samples while the top-and-bottom edges were defined by the out-of-plane edge struts.The volume occupied by the extra edge nodes was not taken intoaccount since they contribute neither stiffness nor strength (theycould be trimmed off if necessary without changing the mechani-cal response). The loading directions are shown in Fig. 4(c). A laserextensometer measured the compressive strain by monitoring thedisplacements of the top and bottom perforated intermediate sur-face layers, and the shear strain by monitoring the displacementsof the shear plates. Unloading–reloading cycles were conductedprior to the onset of inelastic deformation in order to determinethe elastic stiffness components of the specimens.
3.1. Compression results
The z (through-thickness) direction compressive stress–strainresponses of the lattice structures are shown in Fig. 10. The respon-se exhibited characteristics typical of cellular structures including;a region of nominally elastic response, yielding, plastic strain hard-ening to a peak in strength, followed by a drop in flow stress to aplateau region and finally rapid hardening associated with contactof the deformed struts with each other (densification). In contrastto many foam topology materials, the drop in flow stress afterattainment of lattice strength was very large, and indicative of amechanical instability. Photographs of the lattice structures show-ing characteristic plastic deformation behaviors in compression areshown in Fig. 11.
The lowest relative density lattice (�q ¼ 2:4%) failed by elasticbuckling of the struts. Higher density samples failed by inelasticbuckling or yielding of the out-of-plane strut members as thelattice strength was achieved. The out-of-plane struts continuedto buckle with increasing plastic strain, which resulted inincreased deflection of the struts and asymmetrical loading atthe nodes which caused nodal rotation. Strut buckling wasaccompanied by a significant drop in flow stress. The in-planestruts were also subjected to torsion and bending deformationsdue to nodal rotations. Lateral (Poisson) expansion of the latticeswas also observed during compression without a lateral bound-ary constraint. Plastic hinges were formed near the middle andtwo ends of the out-of-plane struts. Truss fracture was finallyobserved at the plastic hinges of the out-of-plane struts, andfor in-plane struts near their nodal connections due to the sig-nificant deformation induced by the combined tension, bendingand torsion loading in these regions. The buckled trusses eventu-ally contacted each other at the densification strain coincidentwith rapid hardening of the flow stress versus strain curve. Itis noted here that the flow stress dropped quickly after the peakin strength, which indicates less than the ideal energy absorp-tion seen in some other structures (San Marchi et al., 2002;Gibson and Ashby, 1999; Holloman et al., 2013). This effect isattributed to the buckling instability of struts made from a lowstrain hardening rate (tangent modulus) Ti–6Al–4V alloy. Table 2summarizes the relative densities (calculated using Eq. (1)), t/lratios, elastic compressive moduli and compressive strengths ofthe octet-truss lattice compression specimens.
The octet truss does not have long range buckling modes and sowe expect the one layer structure to give representative results forthe peak strength. However, post-peak collapse bands may be
htab x t0 m R
1.588 45� 1.270 1.346 5.080

Fig. 5. Photographs of a Ti–6Al–4V octet-truss lattice compression specimen with a relative density of 4.6%; (a) view in the compression loading direction, (b) a side viewshowing the out-of-plane pyramidal struts and (c) an isometric view. (d) Shows a close-up of a brazed node at the side of the sample where three struts from above and belowmeet two of the intermediate layer at a sample edge node.
Fig. 6. Photographs of octet-truss shear test structures with a relative density of 10.4%. (a) Corresponds to a Type I sample subsequently loaded at a = 45�, (b) to a Type IIsample also loaded at a = 45� and (c) is a sample to be tested at a = 0�. Photographs of the corresponding disassembled parts before brazing are used to illustrate the internaltruss structures.
112 L. Dong et al. / International Journal of Solids and Structures 60–61 (2015) 107–124
affected by the specimen size employed and will require investiga-tion in future studies.
3.2. Shear results
The (001) in-plane shear stress–strain responses of the latticestructures are shown in Fig. 12 for a = 45� and 0�. For test orienta-tions with a = 45�, each unit cell has four out-of-plane strut mem-
bers loaded in compression and four in tension; whereas, in thecase of shear loading in the a = 0� direction, a unit cell has onlytwo out-of-plane strut members loaded in compression and twoin tension. The a = 45� samples were fabricated to investigate theeffect of the edge nodal connectivity. The Type I samples had a con-cave edge truss geometry, Fig. 12(a), while that of the Type II coreswas convex, Fig. 12(b). It is evident that an end nodal deflection inthe z (through-thickness) direction will occur for a = 45� Type II
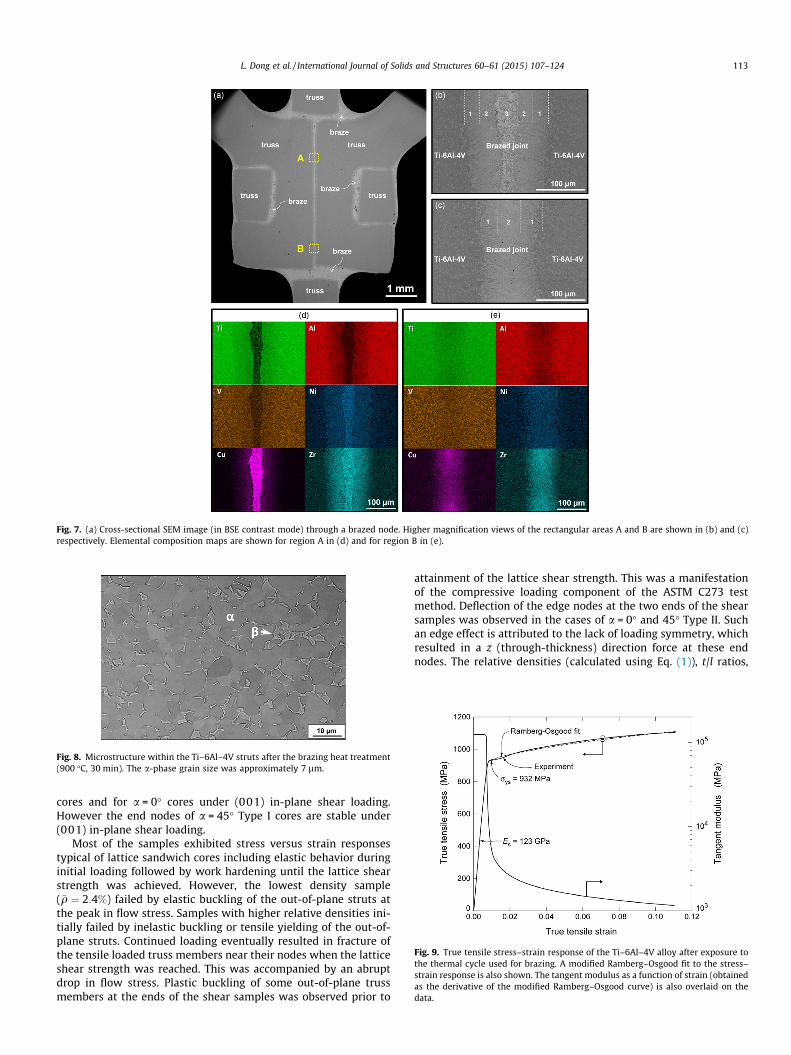
Fig. 7. (a) Cross-sectional SEM image (in BSE contrast mode) through a brazed node. Higher magnification views of the rectangular areas A and B are shown in (b) and (c)respectively. Elemental composition maps are shown for region A in (d) and for region B in (e).
Fig. 8. Microstructure within the Ti–6Al–4V struts after the brazing heat treatment(900 �C, 30 min). The a-phase grain size was approximately 7 lm.
Fig. 9. True tensile stress–strain response of the Ti–6Al–4V alloy after exposure tothe thermal cycle used for brazing. A modified Ramberg–Osgood fit to the stress–strain response is also shown. The tangent modulus as a function of strain (obtainedas the derivative of the modified Ramberg–Osgood curve) is also overlaid on thedata.
L. Dong et al. / International Journal of Solids and Structures 60–61 (2015) 107–124 113
cores and for a = 0� cores under (001) in-plane shear loading.However the end nodes of a = 45� Type I cores are stable under(001) in-plane shear loading.
Most of the samples exhibited stress versus strain responsestypical of lattice sandwich cores including elastic behavior duringinitial loading followed by work hardening until the lattice shearstrength was achieved. However, the lowest density sample(�q ¼ 2:4%) failed by elastic buckling of the out-of-plane struts atthe peak in flow stress. Samples with higher relative densities ini-tially failed by inelastic buckling or tensile yielding of the out-of-plane struts. Continued loading eventually resulted in fracture ofthe tensile loaded truss members near their nodes when the latticeshear strength was reached. This was accompanied by an abruptdrop in flow stress. Plastic buckling of some out-of-plane trussmembers at the ends of the shear samples was observed prior to
attainment of the lattice shear strength. This was a manifestationof the compressive loading component of the ASTM C273 testmethod. Deflection of the edge nodes at the two ends of the shearsamples was observed in the cases of a = 0� and 45� Type II. Suchan edge effect is attributed to the lack of loading symmetry, whichresulted in a z (through-thickness) direction force at these endnodes. The relative densities (calculated using Eq. (1)), t/l ratios,

Fig. 10. Compressive stress–strain responses of snap-fit Ti–6Al–4V octet-trusslattice samples with different relative densities.
114 L. Dong et al. / International Journal of Solids and Structures 60–61 (2015) 107–124
elastic shear moduli and shear strengths of shear samples are sum-marized in Tables 3–5.
4. DFA and generalized models for octet-truss lattice
The mechanical properties of the ideal octet-truss latticematerial (attained in the limit of vanishing node volume) havebeen analyzed by Deshpande et al. (2001). This DFA modelexamined an ideal octahedral cell, and the results apply to the
Fig. 11. Photographs of (a) the (100) and (b) the (110) planes of a lattice with �q ¼ 4:6%
total strain, e, increased.
octet-truss lattice constructed by a 3-D stacking of such octahedralunit cells. It was shown that for small t/l, the contribution to overallstiffness of the octet-truss lattice from the bending of the struts wasnegligible compared to that from strut stretching. The DFA modelassumed pin-joined struts, and applied a first order approximation
to the relative density with the form �qoct ¼ 6ffiffiffi2p
tl
� �2 (Eq. (3)) whichslightly overestimates the relative density due to a double countingof the small nodal volume. The DFA model assumed the octahedralcell had a ‘‘face-centered-cubic’’ symmetry; there are three indepen-dent elastic compliance constants, Sij (the contracted indices i and jare ordered pairs of Cartesian indices) for a cubic system, i.e., theset {Sxxxx, Sxxyy, Syzyz} (equivalent to {S11, S12, S44} with contractedindices), and the linear elastic strain, ei and stress, rj tensor relation-ship took the form (with Cartesian indices);
exx
eyy
ezz
eyz
exz
exy
2666666664
3777777775¼
Sxxxx Sxxyy Sxxyy 0 0 0Sxxyy Sxxxx Sxxyy 0 0 0Sxxyy Sxxyy Sxxxx 0 0 0
0 0 0 Syzyz 0 00 0 0 0 Syzyz 00 0 0 0 0 Syzyz
2666666664
3777777775
rxx
ryy
rzz
ryz
rxz
rxy
2666666664
3777777775
ð4aÞ
where the components of elastic compliance matrix are given by;
Sxxxx Sxxyy Sxxyy 0 0 0Sxxyy Sxxxx Sxxyy 0 0 0Sxxyy Sxxyy Sxxxx 0 0 0
0 0 0 Syzyz 0 00 0 0 0 Syzyz 00 0 0 0 0 Syzyz
2666666664
3777777775¼ 1
�qoctEs
9 �3 �3 0 0 0�3 9 �3 0 0 0�3 �3 9 0 0 00 0 0 12 0 00 0 0 0 12 00 0 0 0 0 12
2666666664
3777777775ð4bÞ
during compression. The development of inelastic truss buckling can be seen as the

Table 2Relative densities, t/l ratio, experimental and unit cell compressive moduli and strengths of the manufactured snap-fit Ti–6Al–4V octet-truss lattice compression specimens. Therelative densities were calculated using Eq. (1).
Strut length(l, mm)
t/l Relativedensity (�q) (%)
Sample compressivestiffness (GPa)
Unit cell compressivestiffness (GPa)
Sample compressivestrength (MPa)
Unit cell compressivestrength (MPa)
Energy absorption per unitvolume, Wv (MPa)
25.400 0.063 2.4 0.49 0.39 4.2 3.5 0.5216.891 0.094 4.6 0.97 0.78 14.1 11.9 2.9912.014 0.132 7.8 2.04 1.64 26.3 22.5 6.119.728 0.163 10.4 2.69 2.16 35.7 30.8 9.528.433 0.188 12.6 3.49 2.81 44.2 38.4 12.247.010 0.226 15.9 4.94 3.98 56.5 49.4 21.16
L. Dong et al. / International Journal of Solids and Structures 60–61 (2015) 107–124 115
where Es refers to the Young’s modulus of the strut material. Theprincipal material axes, as shown in Fig. 4(c), are defined as a Carte-sian co-ordinate system for the analysis.
4.1. Stiffness predictions
The DFA model (Deshpande et al., 2001) predicts the z ([001]through-thickness) direction Young’s modulus;
Ezz ¼ REel �qoctEs ¼
19
�qoctEs ð5Þ
where REel is the elastic compressive modulus coefficient with a val-
ue of 1/9, �qoct is the relative density given by Eq. (3), and Es is theYoung’s modulus of the solid material from which the lattice was
constructed. The relative compressive modulus, EzzEs¼ 2
ffiffi2p
3tl
� �2, is lin-early related to the elastic compressive modulus coefficient andthe ideal octet relative density, �qoct.
The (001) in-plane shear modulus is given by;
Gzx ¼ RGel �qoctEs ¼
112
�qoctEs ð6Þ
where RGel is an elastic shear modulus coefficient with a value of
1/12, and the relative (001) in-plane shear modulus is GzxEs¼
ffiffi2p
2tl
� �2.
The relative shear modulus, GzxEs
is therefore linearly related to the
elastic shear modulus coefficient, RGel, and the ideal octet relative
density, �qoct. The cubic symmetry dictates that the (001) in-planeshear modulus is independent of the shear direction in this plane.
The DFA model predicts density independent (constant) elastic
stiffness coefficients REel and RG
el
� �; a consequence the DFA models
analysis of an ideal octahedral cell without the nodal volume ofreal samples taken into account. This can be addressed using thefree body diagram method (Finnegan et al., 2007), which showsthat the total external force required for each individual strut toachieve an identical state of strain is a constant. As shown inAppendix B, the elastic modulus coefficient, Rel, is linearly relatedto the specimens octahedral cell height (H), its cross-section area(A), and the relative density �q now given by Eq. (1);
Rel ¼ KelH
lA�qð7aÞ
The relative compressive modulus is then given by;
Ezz
Es¼ RE
el �q ¼ KEel
HlA
ð7bÞ
The relative (001) in-plane shear modulus is given by;
GEs¼ RG
el �q ¼ KGel
HlA
ð7cÞ
where Kel is a constant with KEel ¼ 2
3 t2 for the compressive modulus
coefficient, and KGel ¼ 1
2 t2 for the (001) in-plane shear modulus coef-
ficient. The specimen octahedral cell height (H), its cross-sectionalarea (A) and the relative density (�q) are all now functions of thenodal geometry of the lattices tested here.
In the limiting DFA model case, H ¼ffiffiffi2p
l, and A ¼ l2, and thecompressive modulus coefficient, relative compressive modulus,shear modulus coefficient, and relative shear modulus given by
Eq. (7) reduce to 19, 2
ffiffi2p
3tl
� �2, 112, and
ffiffi2p
2tl
� �2 respectively (i.e. the DFAmodel predictions). Eq. (7) is subsequently referred to as a gener-alized octet-truss lattice elastic modulus model which can be usedto analyze the snap-fit octet-truss lattice whose struts do not makecontact at a node (non-zero values of b, c, h, htab, m, in Fig. 4) andtherefore contains extra nodal mass.
4.2. Strength predictions
4.2.1. Compressive strengthA stretch dominated cellular lattice may collapse under com-
pressive loading by elastic or inelastic buckling, or by plastic yield-ing depending on the slenderness (t/l ratio for a solid strut oflength l and square cross section of side length t) of the struts.
At high relative densities, l tends towards t, and a lattice will failby yielding of the low aspect ratio struts. Lattice strength, rpk thenlinearly scales with the yield strength, rys of the solid material, andthe load bearing area (i.e. relative density, �q) of the lattice;
rpk ¼ rys �qRr ð8Þ
where Rr is a lattice topology (strut orientation) dependentstrength coefficient (Wadley, 2006).
At low densities, struts are slender enough to collapse by elasticbuckling prior to compressive plastic yielding, and lattice strengthis obtained by replacing the strut material yield strength, rys in Eq.(8), with the elastic buckling stress given by;
rE ¼k2p2EsI
Al2¼ k2p2Es
12tl
� �2
ð9Þ
where I is the second moment of area of the strut, A is the strutcross-sectional area (I ¼ t4
12 ; A ¼ t2, for a solid strut with squarecross section of side length t) and the factor k is determined bythe end conditions on the buckling struts. If the ends of the strutsare pin-jointed, and can freely rotate k = 1 while selection of k = 2corresponds to a strut whose ends are buried and cannot rotate dur-ing buckling.
At intermediate relative densities, buckling occurs after thestress in the strut has exceeded the proportional limit of the solidmaterial, but before the stress attains the ultimate strength of thesolid. In this case, the compressive strength of the lattice is con-trolled by inelastic buckling at an inelastic bifurcation stress givenby the tangent modulus theory (Gere and Timoshenko, 1984;Shanley, 1967). In this case the compressive strength is found byreplacing Es in Eq. (9) by the tangent modulus Et at an inelasticbifurcation stress level, i.e., by replacing rE with rIE given by:

Fig. 12. Shear stress–strain responses for (a) Type I and (b) Type II Ti–6Al–4V octet-truss lattice shear specimens of different relative densities loaded in the a = 45� direction.Lattice responses when loaded in the a = 0� direction are shown in (c). Photographs revealing the failure modes are also shown for Type I (d) Type II (e) and a = 0� (f) shearsamples all with �q ¼ 4:6%.
116 L. Dong et al. / International Journal of Solids and Structures 60–61 (2015) 107–124
rIE ¼k2p2EtI
Al2 ¼ k2p2Et
12tl
� �2
ð10Þ
The DFA model for the ideal octet-truss lattice assumed thestrut material to be elastic-perfectly plastic with a tangent modu-lus of zero; therefore the only mechanisms for lattice failure wereelastic buckling and plastic yielding. In the case of an ideal octet-truss lattice with a vanishing node size, and with the principal axesdefined as shown in Fig. 4(c), the DFA model Deshpande et al., 2001predicts the z (or [001]) direction compressive strength when theelastic buckling failure mechanism is operative;
rpkzz ¼
p2Es
36�qoct
tl
� �2
ð11Þ
The DFA model assumes k = 1 for the end conditions of thestruts, though the precise value is likely to be influenced by thenode design and the mechanical properties of the solid materialused to make the structure.
In the case of plastic yielding governed failure;
rpkzz ¼
13
�qoctrys ð12Þ

Table 3Relative densities, t/l ratio, experimental and unit cell shear moduli and strengths ofthe manufactured snap-fit Ti–6Al–4V octet-truss lattice shear specimens (a = 0�). Therelative densities were calculated using Eq. (1).
Strutlength(l, mm)
t/l Relativedensity(�q) (%)
Sampleshearstiffness(GPa)
Unit cellshearstiffness(GPa)
Sampleshearstrength(MPa)
Unit cellshearstrength(MPa)
25.400 0.063 2.4 0.35 0.28 2.3 1.916.891 0.094 4.6 0.69 0.55 6.7 5.612.014 0.132 7.8 — — — —9.728 0.163 10.4 1.88 1.48 16.9 14.38.433 0.188 12.6 — — — —7.010 0.226 15.9 3.60 2.84 28.5 24.4
L. Dong et al. / International Journal of Solids and Structures 60–61 (2015) 107–124 117
For a material with a non-zero tangent modulus, the inelasticbuckling criterion can be simply obtained by replacing Es in Eq.(11) with Et, to give;
rpkzz ¼
p2Et
36�qoct
tl
� �2
ð13Þ
In Eqs. (11)–(13), �qoct refers to that given by Eq. (3).The snap-fit octet-truss lattice structures fabricated here have a
considerable node volume and struts ends are laterally separatedwhich requires the nodal geometry to be explicitly addressed.Since the total external force required for each individual strut toachieve an identical state of strain is a constant, a more generalexpression for the compressive strength coefficient (Rr), assumingpin-joined struts (k = 1), as a function of the specimen octahedralcell cross-sectional area, A and relative density, �q was derived inAppendix B;
Rr ¼ Krrc
A�qð14aÞ
and the relative compressive strength is defined as
rpkzz
rys¼ Rr �q ¼ Kr
rc
Að14bÞ
where Kr is a constant ¼ 2ffiffi2p
t2
rysand rc refers to the collapse strength
of a single strut, given by rys in the case of the plastic yielding fail-ure mode or the critical buckling stresses given by Eqs. (9) and (10)for the corresponding buckling failure modes, and �q in Eq. (14) isthat defined in Eq. (1). It can be shown that in the limit of vanishingnodal volume, Eq. (14) reduces to the DFA model prediction (Eqs.(11)–(13)).
4.2.2. The (0 0 1) in-plane shear strengthThe (001) in-plane shear strength depends on the shear loading
direction in the plane. For a ¼ 0�, the measured shear strength spk0�
is spkzx, with the principal axes defined as shown in Fig. 4(c). The DFA
model for an ideal octet-truss lattice with vanishing node volume
Table 4Relative densities, t/l ratio, experimental shear moduli and strengths of themanufactured snap-fit Ti–6Al–4V octet-truss lattice shear specimens (a = 45�, TypeI). The relative densities were calculated using Eq. (1).
Strut length(l, mm)
t/l Relative density(�q) (%)
Shear stiffness(GPa)
Shear strength(MPa)
25.400 0.063 2.4 0.31 2.616.891 0.094 4.6 0.61 8.512.014 0.132 7.8 1.14 15.79.728 0.163 10.4 1.76 21.08.433 0.188 12.6 2.33 26.77.010 0.226 15.9 2.56 34.4
predicts (Deshpande et al., 2001) that failure by elastic bucklingresults in a lattice shear strength given by;
spk0� ¼ spk
zx ¼p2Es
72�qoct
tl
� �2
ð15Þ
For failure by plastic yielding;
spk0� ¼ spk
zx ¼16
�qoctrys ð16Þ
When failure occurs by inelastic buckling;
spk0� ¼ spk
zx ¼p2Et
72�qoct
tl
� �2
ð17Þ
In Eqs. (15)–(17) �qoct is that defined in Eq. (3).
In the case of a ¼ 45�, the measured shear strength, spk45� , of the
ideal octet-truss lattice when failure occurs by elastic buckling isgiven by;
spk45� ¼
ffiffiffi2p
p2Es
72�qoct
tl
� �2
ð18Þ
When failure occurs by plastic yield, the shear strength is;
spk45� ¼
ffiffiffi2p
6�qoctrys ð19Þ
While for inelastic buckling, the shear strength is given by;
spk45� ¼
ffiffiffi2p
p2Et
72�qoct
tl
� �2
ð20Þ
Eqs. (18)–(20) are DFA model predictions, and �qoct thereforerefers to that given by Eq. (3).
A more general expression for the (001) in-plane shear strengthcoefficient (Rs) of the snap-fit octet-truss lattice can be written as afunction of the specimen cross-sectional area, A and relative densi-ty, �q (see Appendix B);
Rs ¼ Ksrc
A�qð21aÞ
While the relative (001) in-plane shear strength is;
srys¼ Rs �q ¼ Ks
rc
Að21bÞ
where Ks is a constant. For a ¼ 0�, Ks ¼ffiffi2p
t2
ryswhile for a ¼ 45�,
Ks ¼ 2t2
rys, if it is assumed that the struts are pin-joined. In Eq. (21),
�q now refers to that given by Eq. (1).
5. Comparison of predictions with measurements
Before comparisons between the measured and modeled prop-erties of the snap-fit lattice can be made, it is necessary to adjustthe measured properties of the compression, Fig. 5(c) and a ¼ 0�
shear samples, Fig. 6(c), to account for edge struts that belong to
Table 5Relative densities, t/l ratio, experimental shear moduli and strengths of themanufactured snap-fit Ti–6Al–4V octet-truss lattice shear specimens (a = 45�, TypeII). The relative densities were calculated using Eq. (1).
Strut length(l, mm)
t/l Relative density(�q) (%)
Shear stiffness(GPa)
Shear strength(MPa)
25.400 0.063 2.4 0.22 2.016.891 0.094 4.6 0.41 6.212.014 0.132 7.8 — —9.728 0.163 10.4 1.07 15.68.433 0.188 12.6 — —7.010 0.226 15.9 1.89 25.6

Fig. 13. Comparisons between the measured and model predicted relative elastic moduli (normalized by solid material modulus) as a function of (t/l)2 and relative density �qfor the snap-fit lattice. The corresponding predictions of the DFA model (which assumes a vanishing node volume) and the generalized octet-truss lattice model (whichaccounts for the nodal separation and additional nodal mass of the snap-fit structure) are shown in (a) and (c) as a function of the strut aspect ratio. ‘‘Generalized latticemodel’’ is the abbreviation of ‘‘generalized octet-truss lattice model’’.
118 L. Dong et al. / International Journal of Solids and Structures 60–61 (2015) 107–124
the unit cells of a larger area sample. These edge struts of partialunit cells contribute both stiffness and strength to the samplesmechanical response. If it is assumed the edge struts of adjacentcells behave in the same manner as their inner strut counterparts,the total force required to deform the counterpart lattice withoutredundant edge struts can be shown (by taking the ratio of thenumber of out-of-plane struts that contribute stiffness/strengthin lattices without extra edge struts to the total number of out-of-plane struts in the tested samples. All the out-of-plane strutscontribute stiffness/strength for compression samples, whereasonly the 0� orientated out-of-plane struts are taken into accountfor the a ¼ 0� shear samples) to be 4/5 that of the snap-fit latticesamples actually tested. The strength of a lattice without extraedge struts is then given by this applied force divided by itscross-sectional area, and is subsequently defined as the unit cellstrength; the unit cell stiffness is then obtained as this stress divid-ed by the imposed strain. It is noted here that the manufacturedsamples have a height of H + t; whereas, the octahedral cell asshown in Fig. 4(c) has a height of H. Tables 2 and 3 summarizethe sample and unit cell moduli and strengths of both the compres-sion and a ¼ 0� shear lattice samples. Since there are no redundantout-of-plane edge struts in the a ¼ 45� shear lattice samples testedhere; the definition of ‘‘unit cell stiffness/strength’’ was not used inthe a ¼ 45� case.
The mechanical properties of a lattice reviewed in Section 4, area function of its number and orientation of struts and the strut t/lratio, as well as strut material mechanical properties. The nodes
are parasitic mass which do not change the strut response, as longas k, the factor accounting for the rotational stiffness of the trussends, is not affected. The unit cell elastic moduli for compression
and a ¼ 0� shear samples are therefore plotted against tl
� �2, inFig. 13(a) and (c), and the relative compressive and shear strengths
against tl
� �2 in Figs. 14(a) and 15(a) and (c) since this abscissa scaleswith the relative density of both an ideal octet-truss lattice and thesnap-fit structure. The DFA model predictions are overlaid on theseresults. The elastic moduli are also plotted against the snap-fitstructures relative density, �q, which includes the parasitic nodalmass (as given by Eq. (1)), in Fig. 13(b) and (d), and the strengthdata in Figs. 14(b) and 15(b) and (d). Generalized octet-truss lattice
model predictions are plotted against both tl
� �2 and the snap-fitstructures relative density, �q, which takes into account the extranodal volume, on all the figures.
The relative elastic moduli (Ezz=Es and G=Es) for the snap-fit Ti–6Al–4V octet-truss lattice structure deduced from the measuredunit cell relative elastic moduli for compression and a ¼ 0� shear
samples are shown in Fig. 13 as a function of tl
� �2 and the snap-fit structures relative density �q. Examination of Fig. 13(a) and (b)shows that the compressive modulus data is over predicted bythe DFA model but is in excellent agreement with the generalizedoctet-truss lattice model which accounts for actual nodal geometryof the tested samples. Fig. 13(c) and (d) show three sets ofexperimental data for the relative shear moduli measured ata = 0�, and for both the Type I and II shear structures tested at

L. Dong et al. / International Journal of Solids and Structures 60–61 (2015) 107–124 119
a = 45�. It is evident that the DFA model is unable to predict thesnap-fit structures responses; a consequence of the strut separa-tion at the nodes. By taking into account the nodal geometry, thegeneralized octet-truss lattice model predictions agree well withthe a = 45� Type I and a = 0� measurements. However, the general-ized shear modulus model is still unable to predict the a = 45� TypeII structure response as well. In the DFA model, nodal rotationsduring shear loading were constrained by symmetry during theanalysis. In the a = 45� Type II case experiments, insufficient nodalconnectivity at the end nodes of the finite length samples led tosubstantial nodal rotation, Fig. 12(e). The edge struts connectingthese end nodes then made a reduced (negligible) contribution tothe core stiffness since they underwent little axial (stretching)deformation. If the stiffness contribution from the edge struts con-necting the end nodes (a quarter of the struts) is neglected, theshear stiffness of the as manufactured a = 45� Type II core wouldbe approximately 3/4 (by taking the ratio of the number of out-of-plane struts that contribute stiffness to the total number ofout-of-plane struts in the tested a = 45� Type II shear samples) thatof a = 45� Type I core. The generalized octet-truss lattice shear stiff-ness model prediction for the a = 45� has been multiplied by 3/4,and is shown to then be in good agreement with the a = 45� Type
II measurement when plotted against tl
� �2 in Fig. 13(c) or the snap-fit structures relative density in Fig. 13(d).
The relative unit cell compressive strength as a function of the
snap-fit structures tl
� �2 ratio and relative density are shown inFig. 14(a) and (b). The unit cell data is compared with both theDFA model and generalized octet-truss lattice model predictions.The trend in the experimental data changed abruptly at�q ¼ 0:046 as the failure mechanism changes from elastic to inelas-tic buckling of the out-of-plane struts. The measurements are ingood agreement with the generalized octet-truss lattice modelsfor these two mechanisms: at low relative density (�q < 0:046),the measurements follow the elastic buckling model. The measure-ments then become consistent with the inelastic buckling modelwhen �q > 0:046. Since the Ti–6Al–4V alloy exhibits low strainhardening, the inelastic buckling model converges rapidly withthe plastic yielding model when �q > 0:10. The generalized octet-truss lattice model slightly underestimated the compressivestrength for �q > 0:13; consistent with increased node rotationresistance for high t/l ratios. The generalized octet-truss latticemodel assumed pin-joined struts at these nodes, (k = 1). Howeverthe nodes of the stubby struts appear to have a rotational stiffnessk that lies between 1 and 2 for the octet-truss lattice structuresmade here.
Fig. 15 shows the relative (001) in-plane shear strength ofthe shear samples versus their relative density and comparesthem with both the DFA model and the generalized octet-trusslattice model predictions for (a) a = 45� (001) in-plane shearand (b) a a = 0� (001) in-plane shear. Like the compressiveresponses, the experimental data changed abruptly at�q ¼ 0:046, which is consistent with a change of failure modefrom elastic to inelastic buckling. Again, the DFA model is notable to predict the shear strengths of the snap-fit lattices. Thegeneralized octet-truss lattice model is able to predict the shearstrength of the a = 0� and Type I a = 45� samples: the measure-ments follow the elastic buckling mode at low relative density(�q < 0:046), with a transition to the inelastic buckling mode at�q � 0:046, and to the plastic yielding mode beyond �q � 0:1.However, the generalized octet-truss lattice model fails to pre-dict the case of a = 45� Type II. The discrepancies again arisefrom the sample edge effect as mentioned above: the out-of-plane edge struts connecting the end nodes suffer minimal axialdeformations, and thus make a negligible contribution to the in-plane shear strength of the core. Since the fraction of out-of-
plane struts that do not suffer an edge effect is 3/4 of the totalpyramidal struts, we estimate that the in-plane shear strengthof the a = 45� Type II cores should be approximately 3/4 thatof a = 45� Type I cores; the measurements are consistent withthis prediction by multiplying 3/4 to the generalized octet-trusslattice model shear strength prediction for a = 45� Type I cores(Fig. 15(c)). Comparison of model results and measurementsindicates that for low aspect ratio octet-truss lattice structures,the in-plane shear strength is sensitive to boundary conditionswhen the edge nodes have insufficient nodal connectivity toinduce strut stretching.
6. Comparisons with competing materials
The measured compressive moduli and strengths of the snap-fitTi–6Al–4V octet-truss lattices investigated here were included inthe material property charts of Fig. 2. These two maps do not showthe properties of other anisotropic topology cellular structures,which excel in performance under some loading conditions butare inferior in others. The properties of the titanium octet-truss lat-tice are clearly superior to the lattice structures made from invest-ment cast Al–7Si–0.3Mg (Deshpande et al., 2001), Ti–6Al–4V, andTi–6Al–2Sn–4Zr–2Mo alloys (Li et al., 2008a,b), as well as Ni–7Pdeposited via electrodeposition (Torrents et al., 2012), latticesmade from carbon fiber laminate composites (Cheung andGershenfeld, 2013), photosensitive HDDA polymers and vapordeposited alumina (with solid trusses) (Zheng et al., 2014), andare very competitive with the Al2O3-polymer hybrid octet-trusslattices (Bauer et al., 2014).
The Ti–6Al–4V octet-truss lattices investigated here are morerobust than brittle Al2O3 counterparts, and are expected to retaingood dimensional stability during loading at temperature up toapproximately 400 �C. However, a solid truss has a lower secondarea moment than a hollow truss and thus a lower resistance toelastic buckling; the strengths of the titanium octet-truss latticeswith solid trusses loaded in compression are therefore inferior tothe electrodeposited hollow truss alumina and Ni–7P octet-trusslattices (Zheng et al., 2014) for densities lower than 0.18 Mg/m3
where the elastic buckling failure mechanism of the solid strutsis dominant (solid model prediction line shown in Fig. 2(b)). How-ever, it is evident that the predicted compressive moduli of thetitanium octet-truss lattices are superior to the hollow truss Ni–7P octet-truss lattices (Zheng et al., 2014) and very competitivewith the hollow truss alumina octet-truss lattices (Zheng et al.,2014) at the lower density range (<0.18 Mg/m3).
The shear moduli and strengths of the Ti–6Al–4V octet-trusslattices are compared with those of metal and polymer foamsand several engineering alloys and carbon fiber reinforced poly-mers (CFRP) in Fig. 16. They are significantly superior to foamedstructures and may therefore provide interesting opportunitiesfor high temperature sandwich panel and thermal managementapplications.
7. Conclusions
1. Ti–6Al–4V octet-truss lattice structures with relative densitiesin the range 2–16% have been manufactured via a snap-fitand vacuum brazing approach.
2. The lattice structures elastic stiffness constants and strengthshave been measured under through-thickness free compression
and in-plane shear loading as a function of tl
� �2 and the snap-fitstructures relative density. The failure mechanism changesfrom elastic buckling to inelastic buckling at a relative densityof about 0.05.

Fig. 14. Predicted and measured relative compressive strength (normalized by thesolids yield strength) plotted against (a) (t/l)2 and (b) relative density �q of the snap-fit structure. Both the DFA model and generalized octet-truss lattice modelpredictions are shown in (a) as a function of strut aspect ratio. ‘‘Generalized latticemodel’’ is the abbreviation of ‘‘generalized octet-truss lattice model’’.
120 L. Dong et al. / International Journal of Solids and Structures 60–61 (2015) 107–124
3. The moduli and strengths of the manufactured octet-truss lat-tice structures are well predicted by a generalized octet-trusslattice model. However, the (001) in-plane shear moduli andstrengths are sensitive to boundary conditions for small aspectratio octet-truss lattice structures.
4. The Ti–6Al–4V octet-truss lattices exhibit excellent overallmechanical properties competitive with existing materials andtopologies, and appear to be a promising candidate for hightemperature, sandwich panel and other applications.
Acknowledgments
We are grateful for the support of this work by the DARPAMCMA program (Grant Number W91CRB-10-1-005) managed byDr. Judah Goldwasser.
Appendix A. Modified Ramberg–Osgood fitting
The true tensile stress–strain curve was separated into twoparts and fitted separately.
For r < r0:2, n = 85, E0 = 123 GPa, r0:2 ¼ 932 MPa, Ramberg–Osgoodfitting
e ¼ rE0þ 0:002
rr0:2
� �n
For r > r0:2, a modified Ramberg–Osgood fitting (Rasmussen,2003) was applied by moving both vertical and horizontal axesfrom the origin to a selected point which enabled a smoothtransition between the two fitting curves. This new origin hadcoordinates e1 ¼ 0:0085, r1 ¼ 925 MPa, with an initial Young’smodulus E1 = 9.77 GPa, The fitting coefficients for the modifiedRamberg–Osgood relation were then n ¼ 1:7, eu ¼ 0:1105,ru ¼ 1110 MPa, with
e� e1 ¼r� r1
E1þ eu � e1 �
ru � r1
E1
� �r� r1
ru � r1
� �n
Appendix B. Generalized octet-truss lattice model
B.1. Compression
B.1.1. Compressive modulusConsider an edge clamped out-of-plane strut of the octahedral
cell with length l and square cross section of side length t as shownin Fig. A1(a). During free compression, both ends of an out-of-planestrut are able to move due to the Poisson effect of the octahedralcell. Fig. A1 illustrates the deformation behavior of an end clampedout-of-plane strut when the octahedral cell is under free compres-sion. The corresponding free body diagram of such a strut is shownin Fig. A1(b). With an imposed displacement at one end along zdirection denoted as dzz, the lateral displacement at the other endalong x direction denoted as dxx, the axial force FA and shear forceFS in the strut are given by elementary beam theory
FA ¼ Est2 ðdzz sin x� dxx cos xÞl
ðA-1aÞ
FS ¼12EsIðdzz cos xþ dxx sinxÞ
l3 ðA-1bÞ
where Es is the Young’s modulus of the solid material, x is strutinclined angle (=45�), I is the second moment of area of the strutcross section given by I = t4/12 for square cross section of sidelength t. The total applied force, Fstrut, on such a single strut in thez direction follows as
Fstrut ¼ FA sinxþ FS cos x ðA-2aÞ
Eq. (A-2a) applies for fixed-end (built-in) struts (k = 2); for pin-joined struts (k = 1), the contribution to the stiffness due to thebending of the struts is negligible, and Eq. (A-2a) reduces to
Fstrut ¼ FA sinx ¼ Est2ðdzz � dxxÞ2l
ðA-2bÞ
In the case of pin-joined struts, the basic force analysis showedthat the lateral displacement dxx is related to the vertical displace-ment dzz by
dxx ¼13
dzz ðA-3Þ
Therefore, Eq. (A-2b) reduces to
Fstrut ¼ FA sinx ¼ Est2dzz
3lðA-4Þ
Now consider the octahedral cell sketched in Fig. A1(a). Thetotal force, F, applied on the octahedral cell in the z direction isequal to 4Fstrut; stress, rzz and strain, ezz applied to the octahedralcell are related to the force F and displacement dzz via;
rzz ¼FA¼ 4Est2dzz
3lAðA-5Þ

Fig. 15. Predicted and measured relative shear strength for a = 45� plotted against (a) (t/l)2 and (b) relative density �q of the snap-fit structure. Both the DFA model andgeneralized octet-truss lattice model predictions are shown in (a) and (c). Analogous results for loading at a = 0� are shown in (c) and (d). ‘‘Generalized lattice model’’ is theabbreviation of ‘‘generalized octet-truss lattice model’’.
L. Dong et al. / International Journal of Solids and Structures 60–61 (2015) 107–124 121
and
ezz ¼2dzz
HðA-6Þ
where H is octahedral cell height H ¼ 2ðl sinxþ hþ 2htabÞ, A is
cross-sectional area (A ¼ 2l cos xþbþcffiffi2p
� �2), as shown in Fig. 4(c). The
effective Young’s modulus Ezz of the octahedral cell in free compres-sion is then given by;
Ezz ¼rzz
ezz¼ 2t2
3HlA
Es ðA-7Þ
Eq. (A-7) can be expressed in terms of the relative compressivemodulus as
Ezz
Es¼ 2t2
3HlA¼ Kel
HlA
ðA-8Þ
with Kel ¼ 23 t2.
B.1.2. Compressive strengthEq. (A-5) gives the compressive stress rzz applied to the octahe-
dral cell in the z direction; the corresponding axial stress rA in anout-of-plane strut is given by
rA ¼Esðdzz � dxxÞffiffiffi
2p
l¼
ffiffiffi2p
Esdzz
3lðA-9Þ
Therefore, the stress applied to the octahedral cell, rzz, can beexpressed in terms of the axial stress, rA, in an out-of-plane strut;
rzz ¼2ffiffiffi2p
t2
ArA ðA-10Þ
The out-of-plane strut can support load until its collapsestrength rc is achieved. Therefore, the lattice strength is given by
rpkzz ¼
2ffiffiffi2p
t2
Arc ðA-11Þ
Eq. (A-11) can be expressed in terms of the relative compressivestrength of the lattice as
rpkzz
rys¼ 2
ffiffiffi2p
t2rc
rysA¼ Kr
rc
AðA-12Þ
where Kr is a constant =2ffiffi2p
t2
rys; rys is the yield strength of the solid
material.
B.2. (001) in-plane shear
B.2.1. (001) in-plane shear modulusConsider the octahedral cell sketched in Fig. A1(a) with an
applied in-plane shear displacement d0 applied to the top node ofthe octahedral cell in the direction defined by an angle a(0� 6 a 6 45�, due to symmetry). Such a displacement can beresolved into two components perpendicular to each other as;
d0x ¼ d0 cos a ðA-13aÞ
and
d0y ¼ d0 sin a ðA-13bÞ

Fig. 16. Material property charts showing (a) the shear modulus and (b) the shearstrength experimental data (45� Type I) and model predictions (solid curves) for thesnap-fit Ti–6Al–4V octet lattices investigated here. The shear properties of polymerand metal foams and several solid materials are also shown for comparison.
122 L. Dong et al. / International Journal of Solids and Structures 60–61 (2015) 107–124
Fig. A1(c) shows an edge clamped strut with length of l and sidelength t (width equals to length) and its free body diagram repre-senting a single out-of-plane strut of an octahedral cell. Symmetry
Fig. A1. Sketch of the deformation of a single out-of-plane strut under uniaxial compressiand shear forces present when the unit cell is under uniaxial free compression (b) or in
condition dictates that displacements and rotations of nodes apartfrom the top and bottom shown in Fig. A1(a) are constrained. Theaxial and shear displacements applied to the strut within the planeparallel to the d0x direction are;
d0a ¼ d0x cos x ðA-14aÞ
and
d0s ¼ d0x sin x ðA-14bÞ
with such a strut subjected to either compression or tensile dis-placement. According to elementary beam theory, the axial andshear forces in such a strut are given by
F 0A ¼ Est2 d0x cos xl
ðA-15aÞ
and
F 0S ¼12EsId
0x sin x
l3 ðA-15bÞ
The total force applied along the d0x direction of a unit cell is
F 0x ¼ 2 F 0A cos xþ F 0S sin x� �
¼ Est2d0xl
1þ tl
� �2" #
ðA-16aÞ
The force applied along the d0y direction is;
F 0y ¼ 2 F 0A cos xþ F 0S sin x� �
¼Est2d0y
l1þ t
l
� �2" #
ðA-16bÞ
It is noted that Eq. (A-16) was derived assuming fixed-end(built-in) struts (k = 2); for pin-joined struts (k = 1), the contribu-tion to the stiffness due to the bending of the struts is negligible,
and the ðt=lÞ2 related terms (i.e., F 0S terms) in Eq. (A-16) disappear,and the total shear force, F 0, applied on the unit cell is then
F 0 ¼ffiffiffiffiffiffiffiffiffiffiffiffiffiffiffiffiffiffiF 02x þ F 02y
q¼ Est2d0
lðA-17Þ
The total shear stress applied on the unit cell is thus
s ¼ F 0
A¼ Est2d0
AlðA-18Þ
The shear strain
c ¼ 2d0
HðA-19Þ
on and in shear. Free body diagram for such a strut showing the combination of axialshear (c).

L. Dong et al. / International Journal of Solids and Structures 60–61 (2015) 107–124 123
Therefore, the shear modulus of the lattice is
G ¼ sc¼ t2H
2AlEs ðA-20Þ
Eq. (A-20) can be expressed in terms of the (001) in-plane rela-tive shear modulus as
GEs¼ t2H
2Al¼ Kel
HAl
ðA-21Þ
with Kel ¼ 12 t2.
B.2.2. (001) in-plane shear strengthEq. (A-18)represents the total shear stress applied on the unit
cell ((001) in-plane shear). The axial stress in an out-of-plane strutis given by
rA ¼Esd
0 cos affiffiffi2p
lðA-22Þ
Therefore, the (001) in-plane shear stress applied to the octahe-dral cell, s, can be expressed in terms of the axial stress, rA, in anout-of-plane strut;
s ¼ rA
ffiffiffi2p
t2
A cos aðA-23Þ
The out-of-plane strut can support load until its collapsestrength rc is achieved. Therefore, the lattice shear strength isgiven by
spk ¼ rc
ffiffiffi2p
t2
A cos aðA-24Þ
Eq. (A-24) can be expressed in terms of the (001) in-plane rela-tive shear strength of the lattice as
spk
rys¼
ffiffiffi2p
t2
rys cos arc
A¼ Ks
rc
AðA-25Þ
where Ks is a constant =ffiffi2p
t2
rys cos a.
Appendix C. Brazed joint minimum shear strength prediction
For the octahedral cell shown in Fig. 4(c), the contact area ofpyramidal struts with the intermediate layer at a node is given by;
Anode ¼ 2bt � t2 ðA-26Þ
Eq. (A-24) indicates that the peak shear force applied to theoctahedral cell is
spkA ¼ rc
ffiffiffi2p
t2
cos aðA-27Þ
To avoid node shear fracture dominated behavior, the brazedjoint requires a sufficient shear strength to prevent node shearfracture prior to the attainment of peak stress under (001) in-plane shear. The minimum shear strength required for the brazedjoint, sbraze is therefore,
sbraze Anode P spkA ¼ rc
ffiffiffi2p
t2
cos aðA-28Þ
When a ¼ 45�,
sbraze P rc2t
2b� tðA-29Þ
If we conservatively take rc ¼ 1:1 GPa (see Fig. 9) as the col-lapse strength of a single solid strut (an upper limit for rc),sbraze P 440 MPa. The measured shear strength of the brazed joint
was 450 MPa; just sufficient to prevent node shear fracture becom-ing the dominate failure mechanism for the shear samplesmanufactured and tested here.
It is also noted that, the node area (2bt � t2) used for the calcu-lation above is an overly conservative estimate of brazed joint sur-face area (i.e. the trusses contact area) at a node. In reality, thebrazed joint surface area at a node is larger ð6bt � t2Þ, as the inter-mediate layer struts also meet the pyramidal struts at this node.
References
Adams, D.F., 2007. Shear testing of sandwich panel core materials. High-Performance Compos. 15, 8–9.
Ashby, M.F., 2000. Metal Foams: A Design Guide. Butterworth-Heinemann.Bauer, Jens, Hengsbach, Stefan, Tesari, Iwiza, Schwaiger, Ruth, Kraft, Oliver, 2014.
High-strength cellular ceramic composites with 3D microarchitecture. Proc.Natl. Acad. Sci. 111, 2453–2458.
Bitzer, T., 1997. Honeycomb technology. Chapman & Hall, London.Boomsma, K., Poulikakos, D., Zwick, F., 2003. Metal foams as compact high
performance heat exchangers. Mech. Mater. 35, 1161–1176.Botstein, O., Rabinkin, A., 1994. Brazing of titanium-based alloys with amorphous
25wt.% Ti-25wt.% Zr-50wt.% Cu filler metal. Mater. Sci. Eng., A 188, 305–315.Boyer, R.R., Briggs, R.D., 2005. The use of b titanium alloys in the aerospace industry.
J. Mater. Eng. Perform. 14 (6), 681–685.Boyer, R., Collings, E.W. (Eds.), 1993. Materials Properties Handbook: Titanium
Alloys. ASM International.Brewer, W.D., Bird, R.K., Terryl, A.W., 1998. Titanium alloys and processing for high
speed aircraft. Mater. Sci. Eng., A 243, 299–304.Cheung, K.C., Gershenfeld, N., 2013. Reversibly assembled cellular composite
materials. Science 341, 1219–1221.Chu, J., Engelbrecht, S., Graf, G., Rosen, D.W., 2010. A comparison of synthesis
methods for cellular structures with application to additive manufacturing.Rapid Prototyping J. 16, 275–283.
Couper, J.R., Penney, W.R., Fair, J.R., 2009. Chemical Process Equipment revised 2ndEdition: Selection and Design, second ed. Gulf Professional Publishing.
Deshpande, V.S., Ashby, M.F., Fleck, N.A., 2001. Foam topology: bending versusstretching dominated architectures. Acta Mater. 49, 1035–1040.
Deshpande, V.S., Fleck, N.A., Ashby, M.F., 2001. Effective properties of the octet-trusslattice material. J. Mech. Phys. Solids 49, 1747–1769.
Dharmasena, Kumar P., Wadley, Haydn N.G., Xue, Zhenyu, Hutchinson, John W.,2008. Mechanical response of metallic honeycomb sandwich panel structuresto high-intensity dynamic loading. Int. J. Impact Eng. 35, 1063–1074.
Donachie, M.J., 2000. Titanium: A Technical Guide. ASM International.Finnegan, K., Kooistra, G., Wadley, H.N., Deshpande, V.S., 2007. The compressive
response of carbon fiber composite pyramidal truss sandwich cores. Int. J.Mater. Res. 98, 1264–1272.
Froes, F.H., Friedrich, H., Kiese, J., Bergoint, D., 2004. Titanium in the familyautomobile: the cost challenge. JOM 56, 40–44.
Fuller, R.B., 1961, Octet Truss. U.S. Patent No. 2,986,241.Gere, J.M., Timoshenko, S.P., 1984. Mechanics of Materials. PWS Engineering,
Boston.Gibson, L.J., Ashby, M.F., 1999. Cellular Solids: Structure and Properties. Cambridge
University Press.Gorynin, I.V., 1999. Titanium alloys for marine application. Mater. Sci. Eng., A 263,
112–116.Holloman, Ryan, Deshpande, Vikram, Hanssen, Arve, Fleming, Katherine, Scully,
John, Wadley, Haydn, 2013. Tubular aluminum cellular structures: fabricationand mechanical response. J. Mech. Mater. Struct. 8, 65–94.
Kooistra, Gregory W., Deshpande, Vikram S., Wadley, Haydn N.G., 2004.Compressive behavior of age hardenable tetrahedral lattice truss structuresmade from aluminium. Acta Mater. 52, 4229–4237.
Kooistra, Gregory W., Wadley, Haydn N.G., 2007. Lattice truss structures fromexpanded metal sheet. Mater. Des. 28, 507–514.
Kulekci, M.K., 2008. Magnesium and its alloys applications in automotive industry.Int. J. Adv. Manuf. Technol. 39, 851–865.
Lee, Yong-Hyun, Lee, Byung-Kon, Jeon, Insu, Kang, Ki-Ju, 2007. Wire-woven bulkKagome truss cores. Acta Mater. 55, 6084–6094.
Li, Q., Chen, Y.C.E.Y., Douglas, R.B., Dunand, D.C., 2008a. Mechanical properties ofcast Ti–6Al–4V lattice block structures. Metall. Mater. Trans. A 39, 441–449.
Li, Q., Chen, Y.C.E.Y., Douglas, R.B., Dunand, D.C., 2008b. Mechanical properties ofcast Ti–6Al–2Sn–4Zr–2Mo lattice block structures. Adv. Eng. Mater. 10, 939–942.
Lim, Ji-Hyun, Kang, Ki-Ju, 2006. Mechanical behavior of sandwich panels withtetrahedral and Kagome truss cores fabricated from wires. Int. J. Solids Struct.43, 5228–5246.
Lu, T.J., Stone, H.A., Ashby, M.F., 1998. Heat transfer in open-cell metal foams. ActaMater. 46, 3619–3635.
Lugscheider, E., Broich, U., 1995 May. Mechanical properties of high-temperaturebrazed titanium materials, American Welding Society, Welding ResearchSupplement, pp. 169–176.
Onzawa, T., Suzumura, A., Ko, M.W., 1990. Brazing of titanium using low-melting-point Ti-based filler metals. Weld. J. 69, 462–467.

124 L. Dong et al. / International Journal of Solids and Structures 60–61 (2015) 107–124
Park, J.S., Joo, J.H., Lee, B.C., Kang, K.J., 2011. Mechanical behaviour of tube-wovenKagome truss cores under compression. Int. J. Mech. Sci. 53 (1), 65–73.
Queheillalt, Douglas T., Wadley, Haydn N.G., 2005. Pyramidal lattice truss structureswith hollow trusses. Mater. Sci. Eng., A 397, 132–137.
Queheillalt, Douglas T., Murty, Yellapu, Wadley, Haydn N.G., 2008. Mechanicalproperties of an extruded pyramidal lattice truss sandwich structure. ScriptaMater. 58, 76–79.
Rasmussen, K.J.R., 2003. Full range stress strain curves for stainless steel alloys. J.Constr. Steel Res. 59, 47–61.
Ritchie, R.O., Boyce, B.L., Campbell, J.P., Roder, O., Thompson, A.W., Milligan, W.W.,1999. Thresholds for high-cycle fatigue in a turbine engine Ti–6Al–4V alloy. Int.J. Fatigue 21, 653–662.
Rosen, D.W., 2007. Computer-aided design for additive manufacturing of cellularstructures. Comput.-Aided Des. Appl. 4, 585–594.
Russell, Benjamin, Deshpande, Vikram, Wadley, Haydn, 2008. Quasistaticdeformation and failure modes of composite square honeycombs. J. Mech.Mater. Struct. 3, 1315–1340.
SanMarchi, C., Mortensen, A., 2002. Handbook of Cellular Metals. Wiley-VCH Verlag,Weinheim Germany.
Shanley, F.R., 1967. Mechanics of Materials. McGraw-Hill, New York.
Sypeck, David J., Wadley, Haydn N.G., 2002. Cellular metal truss core sandwichstructures. Adv. Eng. Mater. 4, 759–764.
Torrents, A., Schaedler, T.A., Jacobsen, A.J., Carter, W.B., Valdevit, L., 2012.Characterization of nickel-based microlattice materials with structural hierarchyfrom the nanometer to the millimeter scale. Acta Mater. 60, 3511–3523.
Wadley, Haydn N.G., Fleck, Norman A., Evans, Anthony G., 2003. Fabrication andstructural performance of periodic cellular metal sandwich structures. Compos.Sci. Technol. 63, 2331–2343.
Wadley, Haydn N.G., 2006. Multifunctional periodic cellular metals. Philos. Trans. R.Soc. A: Math. Phys. Eng. Sci. 364, 31–68.
Wang, J., Evans, A.G., Dharmasena, K., Wadley, H.N.G., 2003. On the performance oftruss panels with Kagome cores. Int. J. Solids Struct. 40, 6981–6988.
Williams, C.B., Cochran, J.K., Rosen, D.W., 2011. Additive manufacturing of metalliccellular materials via three-dimensional printing. Int. J. Adv. Manuf. Technol. 53,231–239.
Ye, H., 2003. An overview of the development of Al–Si-alloy based material forengine applications. J. Mater. Eng. Perform. 12, 288–297.
Zheng, Xiaoyu, Lee, Howon, Weisgraber, Todd H., Shusteff, Maxim, Deotte, Joshua R.,Duoss, Eric, Kuntz, Joshua D., et al., 2014. Ultra-light, ultra-stiff mechanicalmetamaterials. Science 344, 1373–1377.
Recommended