MasterScope SystemManager GFunction Introduction
NEC Corporation
2018

Function Lists
3 © NEC Corporation 2018
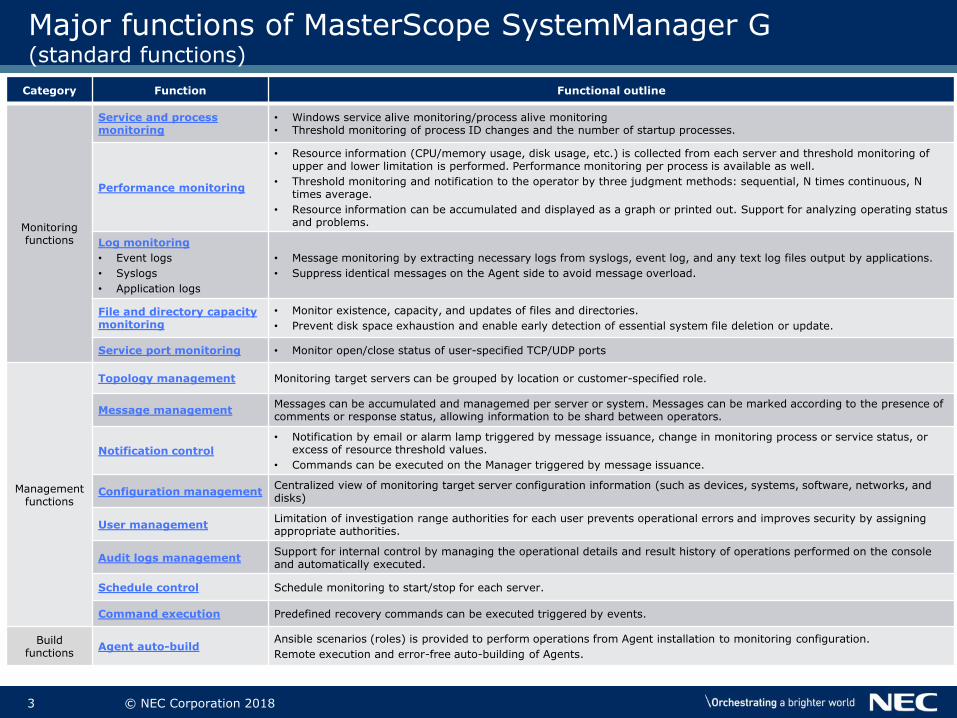
Major functions of MasterScope SystemManager G (standard functions)
Category Function Functional outline
Monitoring functions
Service and process monitoring
• Windows service alive monitoring/process alive monitoring• Threshold monitoring of process ID changes and the number of startup processes.
Performance monitoring
• Resource information (CPU/memory usage, disk usage, etc.) is collected from each server and threshold monitoring of upper and lower limitation is performed. Performance monitoring per process is available as well.
• Threshold monitoring and notification to the operator by three judgment methods: sequential, N times continuous, N times average.
• Resource information can be accumulated and displayed as a graph or printed out. Support for analyzing operating status and problems.
Log monitoring
• Event logs
• Syslogs
• Application logs
• Message monitoring by extracting necessary logs from syslogs, event log, and any text log files output by applications.
• Suppress identical messages on the Agent side to avoid message overload.
File and directory capacity monitoring
• Monitor existence, capacity, and updates of files and directories.
• Prevent disk space exhaustion and enable early detection of essential system file deletion or update.
Service port monitoring • Monitor open/close status of user-specified TCP/UDP ports
Management functions
Topology management Monitoring target servers can be grouped by location or customer-specified role.
Message managementMessages can be accumulated and managemed per server or system. Messages can be marked according to the presence of comments or response status, allowing information to be shard between operators.
Notification control
• Notification by email or alarm lamp triggered by message issuance, change in monitoring process or service status, or excess of resource threshold values.
• Commands can be executed on the Manager triggered by message issuance.
Configuration managementCentralized view of monitoring target server configuration information (such as devices, systems, software, networks, and disks)
User managementLimitation of investigation range authorities for each user prevents operational errors and improves security by assigning appropriate authorities.
Audit logs managementSupport for internal control by managing the operational details and result history of operations performed on the console and automatically executed.
Schedule control Schedule monitoring to start/stop for each server.
Command execution Predefined recovery commands can be executed triggered by events.
Build functions
Agent auto-buildAnsible scenarios (roles) is provided to perform operations from Agent installation to monitoring configuration.
Remote execution and error-free auto-building of Agents.
4 © NEC Corporation 2018
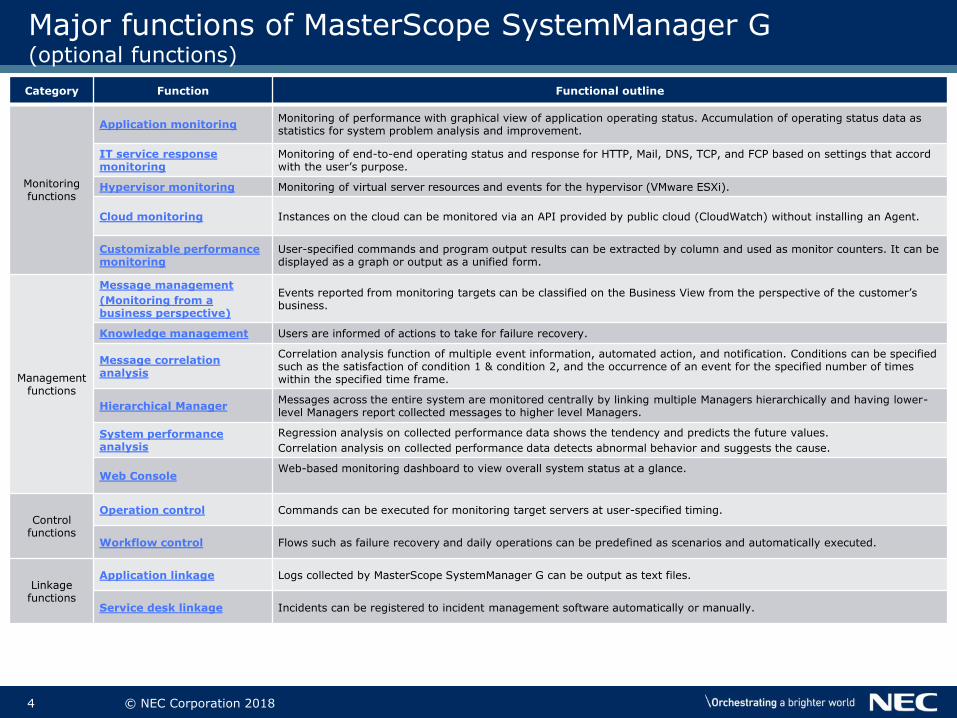
Major functions of MasterScope SystemManager G (optional functions)
Category Function Functional outline
Monitoring functions
Application monitoringMonitoring of performance with graphical view of application operating status. Accumulation of operating status data as statistics for system problem analysis and improvement.
IT service response monitoring
Monitoring of end-to-end operating status and response for HTTP, Mail, DNS, TCP, and FCP based on settings that accord with the user’s purpose.
Hypervisor monitoring Monitoring of virtual server resources and events for the hypervisor (VMware ESXi).
Cloud monitoring Instances on the cloud can be monitored via an API provided by public cloud (CloudWatch) without installing an Agent.
Customizable performance monitoring
User-specified commands and program output results can be extracted by column and used as monitor counters. It can be displayed as a graph or output as a unified form.
Management functions
Message management
(Monitoring from a business perspective)
Events reported from monitoring targets can be classified on the Business View from the perspective of the customer’s business.
Knowledge management Users are informed of actions to take for failure recovery.
Message correlation analysis
Correlation analysis function of multiple event information, automated action, and notification. Conditions can be specified such as the satisfaction of condition 1 & condition 2, and the occurrence of an event for the specified number of times within the specified time frame.
Hierarchical ManagerMessages across the entire system are monitored centrally by linking multiple Managers hierarchically and having lower-level Managers report collected messages to higher level Managers.
System performance analysis
Regression analysis on collected performance data shows the tendency and predicts the future values.
Correlation analysis on collected performance data detects abnormal behavior and suggests the cause.
Web ConsoleWeb-based monitoring dashboard to view overall system status at a glance.
Control functions
Operation control Commands can be executed for monitoring target servers at user-specified timing.
Workflow control Flows such as failure recovery and daily operations can be predefined as scenarios and automatically executed.
Linkage functions
Application linkage Logs collected by MasterScope SystemManager G can be output as text files.
Service desk linkage Incidents can be registered to incident management software automatically or manually.

Function Detail
6 © NEC Corporation 2018
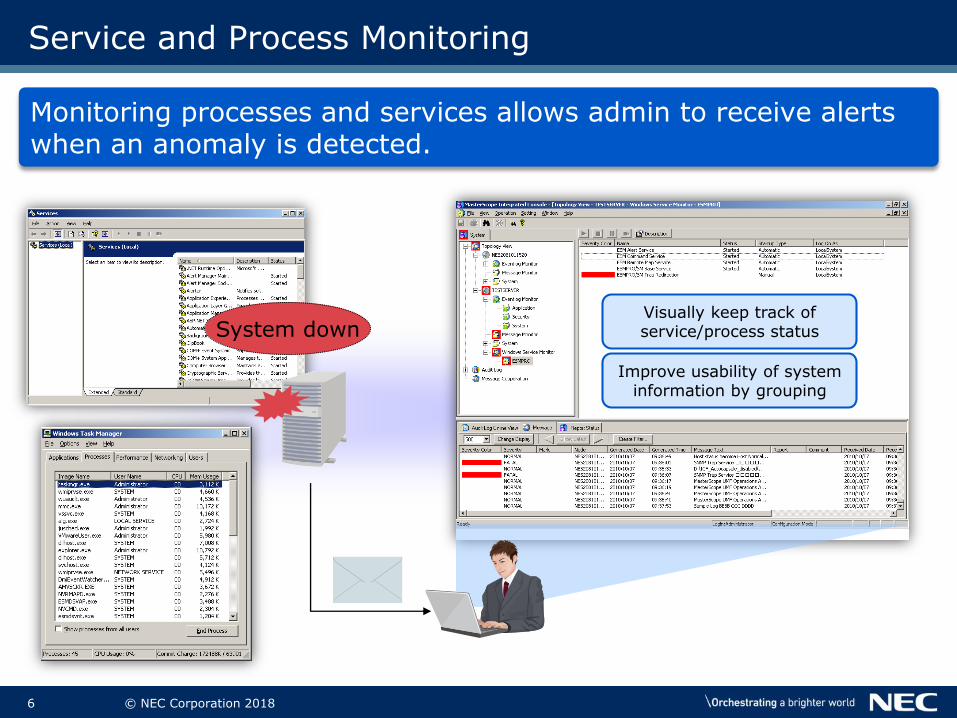
Service and Process Monitoring
Monitoring processes and services allows admin to receive alerts when an anomaly is detected.
System down
Improve usability of system information by grouping
Visually keep track of service/process status
7 © NEC Corporation 2018
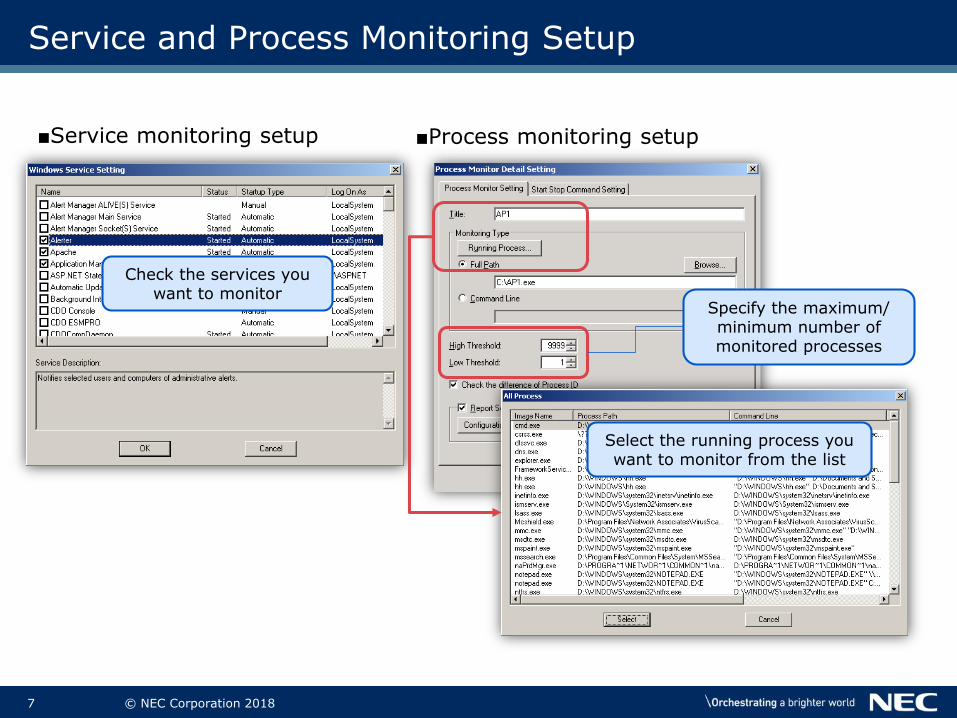
Service and Process Monitoring Setup
Check the services you want to monitor
■Service monitoring setup ■Process monitoring setup
Select the running process you want to monitor from the list
Specify the maximum/ minimum number of monitored processes
8 © NEC Corporation 2018
Performance Monitoring
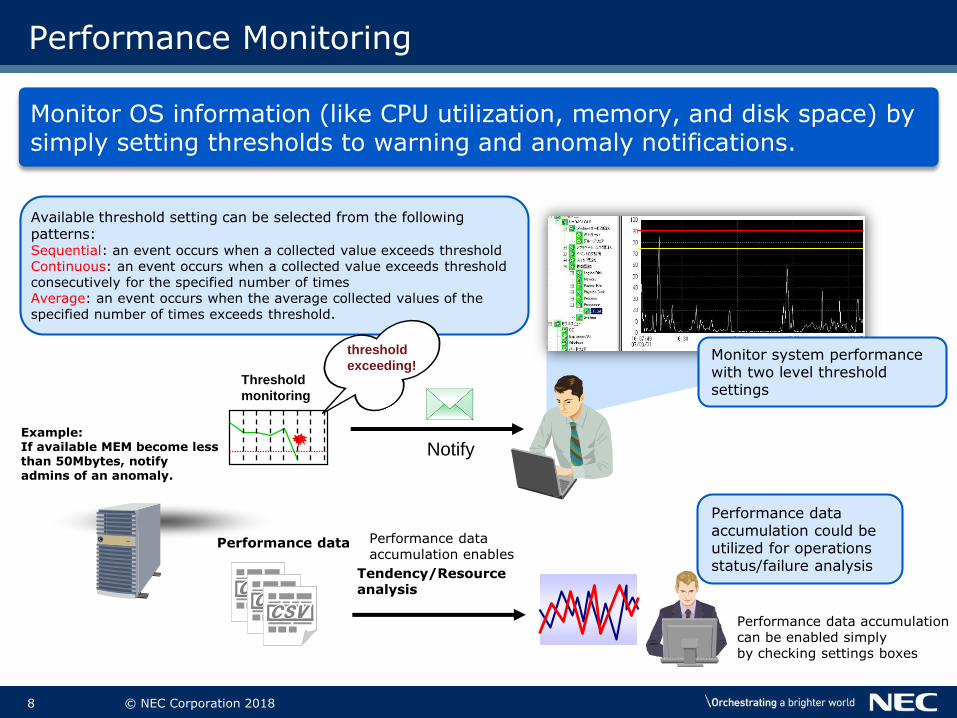
Monitor OS information (like CPU utilization, memory, and disk space) by simply setting thresholds to warning and anomaly notifications.
Threshold
monitoring
Performance data
Notify
Tendency/Resourceanalysis
Performance data accumulation could be utilized for operations status/failure analysis
Monitor system performance with two level threshold settings
Available threshold setting can be selected from the following patterns:Sequential: an event occurs when a collected value exceeds thresholdContinuous: an event occurs when a collected value exceeds threshold consecutively for the specified number of timesAverage: an event occurs when the average collected values of the specified number of times exceeds threshold.
threshold
exceeding!
Performance dataaccumulation enables
Performance data accumulationcan be enabled simplyby checking settings boxes
Example:If available MEM become lessthan 50Mbytes, notifyadmins of an anomaly.
9 © NEC Corporation 2018
Reporting (Multi-Graph View)
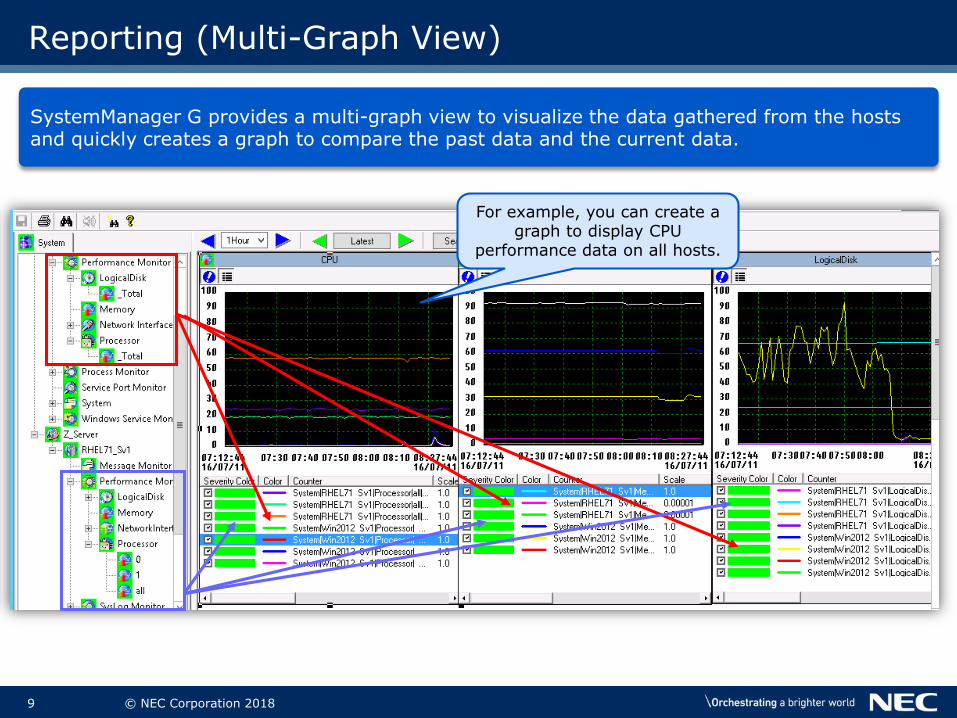
SystemManager G provides a multi-graph view to visualize the data gathered from the hosts and quickly creates a graph to compare the past data and the current data.
For example, you can create a graph to display CPU
performance data on all hosts.

10 © NEC Corporation 2018
Reporting (Print view)
Report the performance data collected on SystemManager G to a PDF file.
Reporting the performance data in predefined intervals (weekly/monthly/yearly)
Administrator
Graph of performance data
Maximum, minimum and
average of each counter
History of each counter
11 © NEC Corporation 2018
Log Monitoring (event log/syslog/application log)
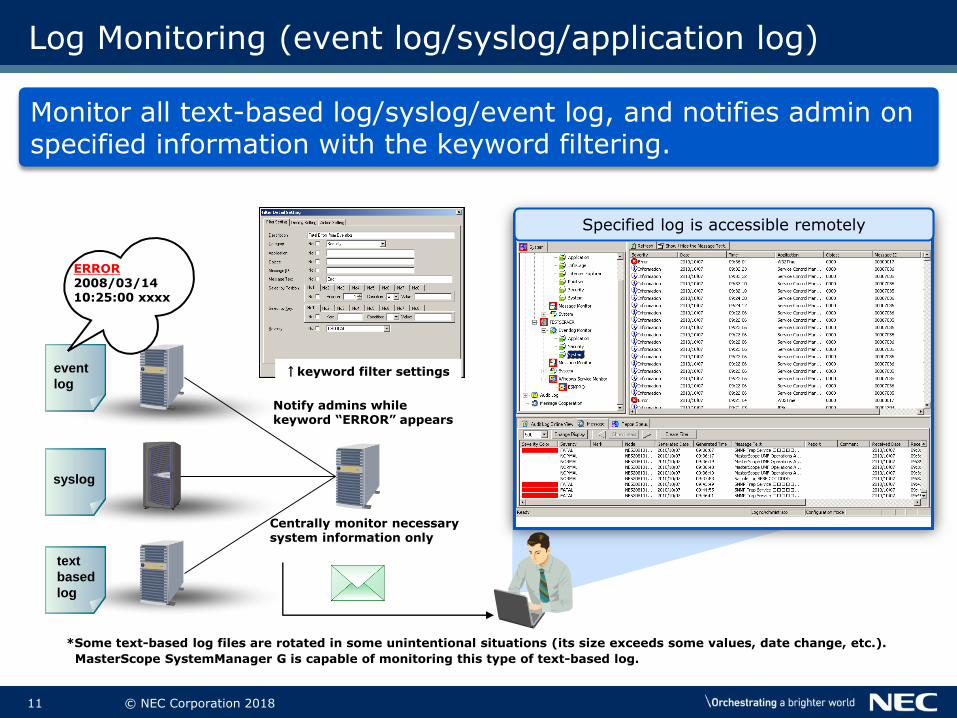
Monitor all text-based log/syslog/event log, and notifies admin on specified information with the keyword filtering.
*Some text-based log files are rotated in some unintentional situations (its size exceeds some values, date change, etc.).
MasterScope SystemManager G is capable of monitoring this type of text-based log.
event
log
text
based
log
syslog
ERROR 2008/03/14 10:25:00 xxxx
Specified log is accessible remotely
Notify admins while keyword “ERROR” appears
Centrally monitor necessarysystem information only
↑keyword filter settings
12 © NEC Corporation 2018
(Ref) Keyword Filtering
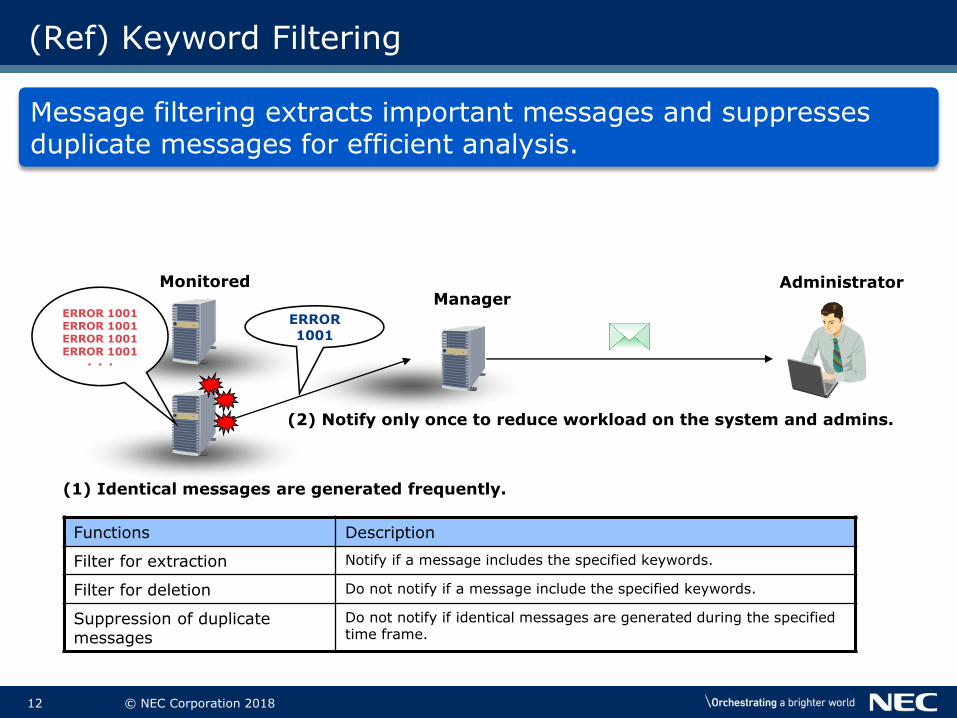
Message filtering extracts important messages and suppresses duplicate messages for efficient analysis.
Functions Description
Filter for extraction Notify if a message includes the specified keywords.
Filter for deletion Do not notify if a message include the specified keywords.
Suppression of duplicate messages
Do not notify if identical messages are generated during the specified time frame.
MonitoredManager
Administrator
(1) Identical messages are generated frequently.
(2) Notify only once to reduce workload on the system and admins.
ERROR 1001ERROR 1001ERROR 1001ERROR 1001
・・・
ERROR 1001
13 © NEC Corporation 2018
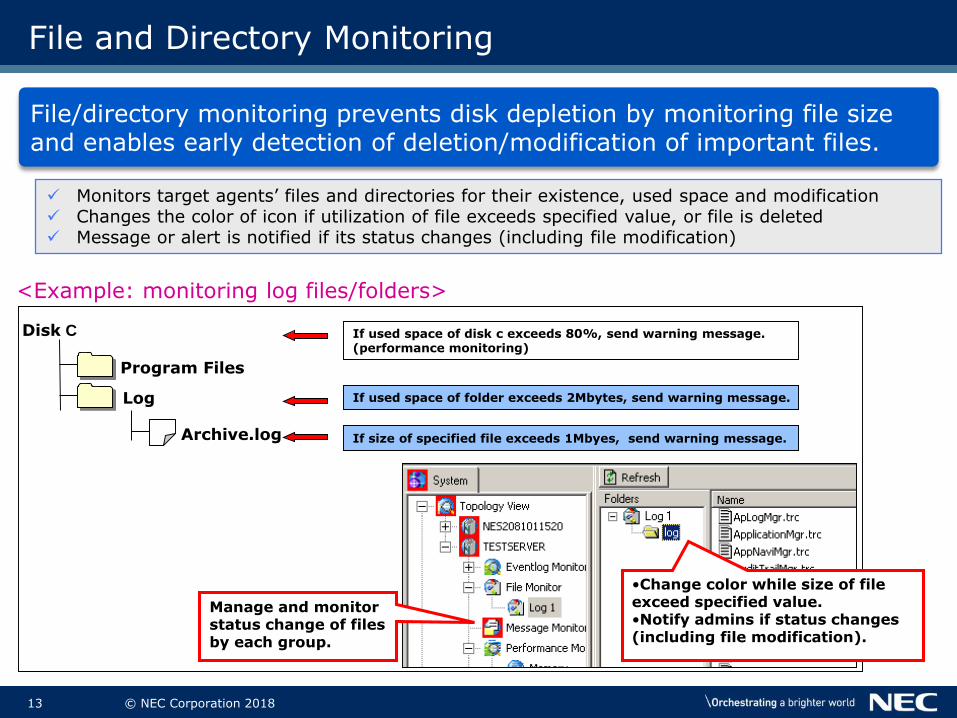
File and Directory Monitoring
File/directory monitoring prevents disk depletion by monitoring file size and enables early detection of deletion/modification of important files.
Monitors target agents’ files and directories for their existence, used space and modification Changes the color of icon if utilization of file exceeds specified value, or file is deleted Message or alert is notified if its status changes (including file modification)
Disk C
Program Files
Log If used space of folder exceeds 2Mbytes, send warning message.
If size of specified file exceeds 1Mbyes, send warning message.
<Example: monitoring log files/folders>
Archive.log
If used space of disk c exceeds 80%, send warning message.(performance monitoring)
•Change color while size of file exceed specified value.•Notify admins if status changes(including file modification).
Manage and monitor status change of files by each group.

14 © NEC Corporation 2018
Service Port Monitoring
Monitor TCP/UDP port (ftp, telnet, http, etc.) on the agent. Show message on message view if the status of monitored port is changed.
SystemManager(AG)
NICNIC
Remote agent can monitor the port on a remote host
SystemManager(RemoteAG)
Host A
Host B
Service Port Monitor Setting

15 © NEC Corporation 2018
NEC
NEC DataCenter
Rack01
Manage servers in NEC
Manage servers on datacenter in NEC
Manage servers on rack01
Trouble on a server in rack01
Check the red colored icons to see the install location of the failed server.
Topology Management(from the view point of managing server)
Topology view allows you not only to monitor server physically, but also
to manage servers with information about location and role.
16 © NEC Corporation 2018
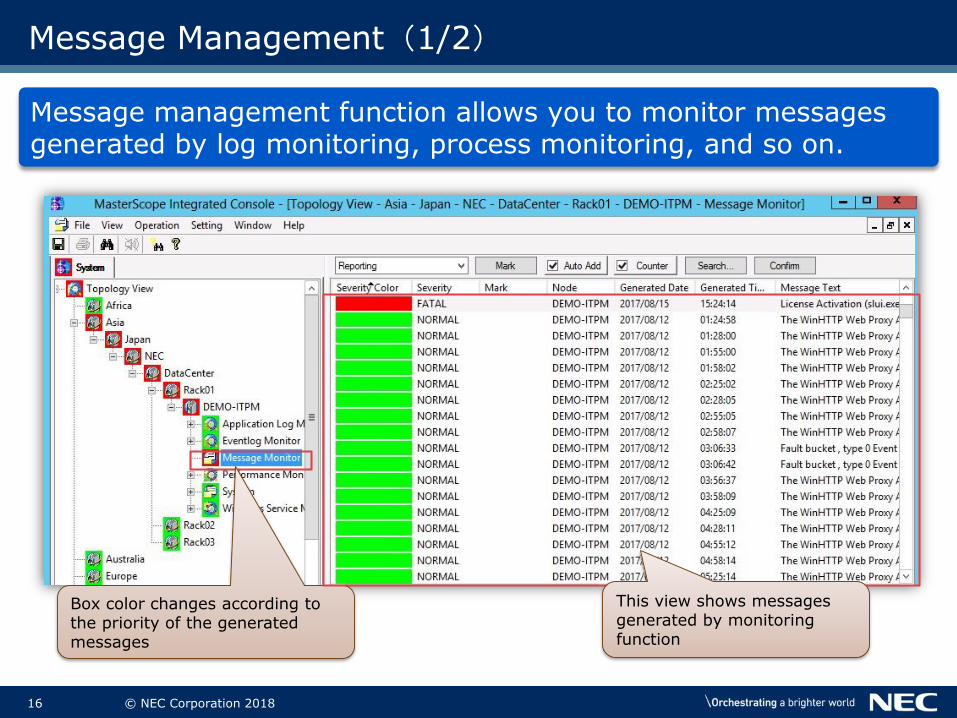
Box color changes according to the priority of the generated messages
This view shows messages generated by monitoring function
Message Management(1/2)
Message management function allows you to monitor messages generated by log monitoring, process monitoring, and so on.

17 © NEC Corporation 2018
Message Management(2/2)
Messages can be displayed per server or for all monitored servers in one console.
This view shows generated messages from all monitored servers.When Network Manager has been installed in, messages from monitoring network devices are also displayed in this view.
This view shows generated messages per monitored server.
18 © NEC Corporation 2018
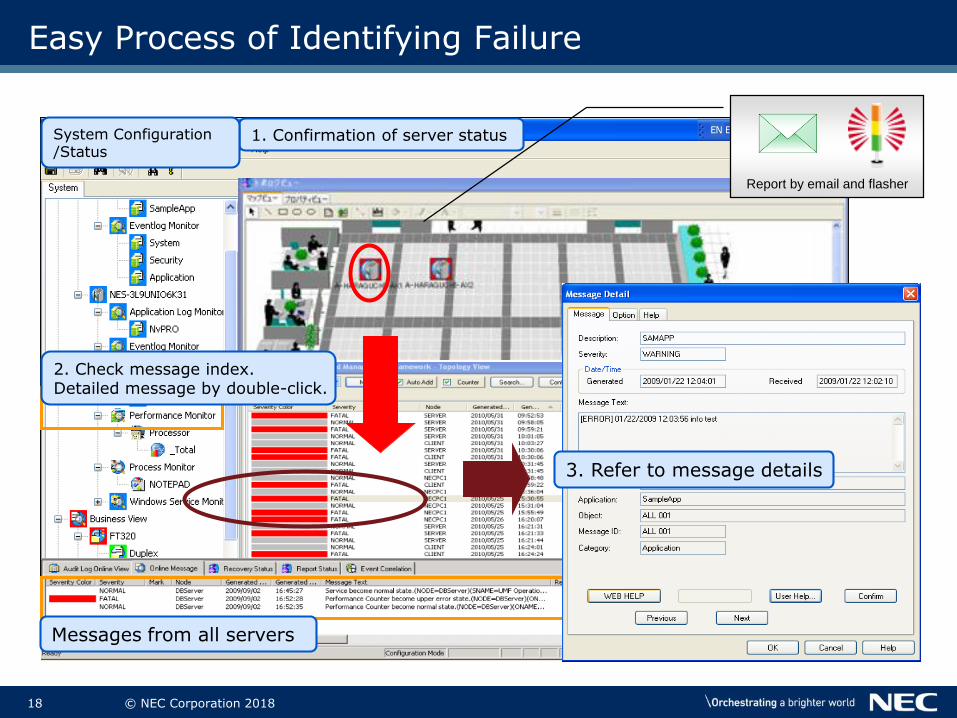
Easy Process of Identifying Failure
2. Check message index. Detailed message by double-click.
1. Confirmation of server status
Report by email and flasher
System Configuration /Status
3. Refer to message details
Messages from all servers

19 © NEC Corporation 2018
Share Recovery Status
Status
Details on troubleshooting steps(Information sharing)
Registering troubleshooting steps to messages enables team members to
share the current working status, ensuring a smooth handover.

20 © NEC Corporation 2018
Notification Control
Automatically send e-mail and execute recovery command in case of failure.
Lightning
Agent
Administrator
Command Execution
MonitoringManager
Failure
This is alert from MasterScope.-----------------------------------------Date :2016/06/06Time :10:22:32----------------------------------------------------------------------------------Node:DB Server01Severity:CriticalApplication:OracleObject:OracleMonitor----------------------------------------------------------------------------------Message ID :00410102Message:Failed to connect to database
Receive current machine status by e-mail
Execute pre-defined command according
to failure events
21 © NEC Corporation 2018
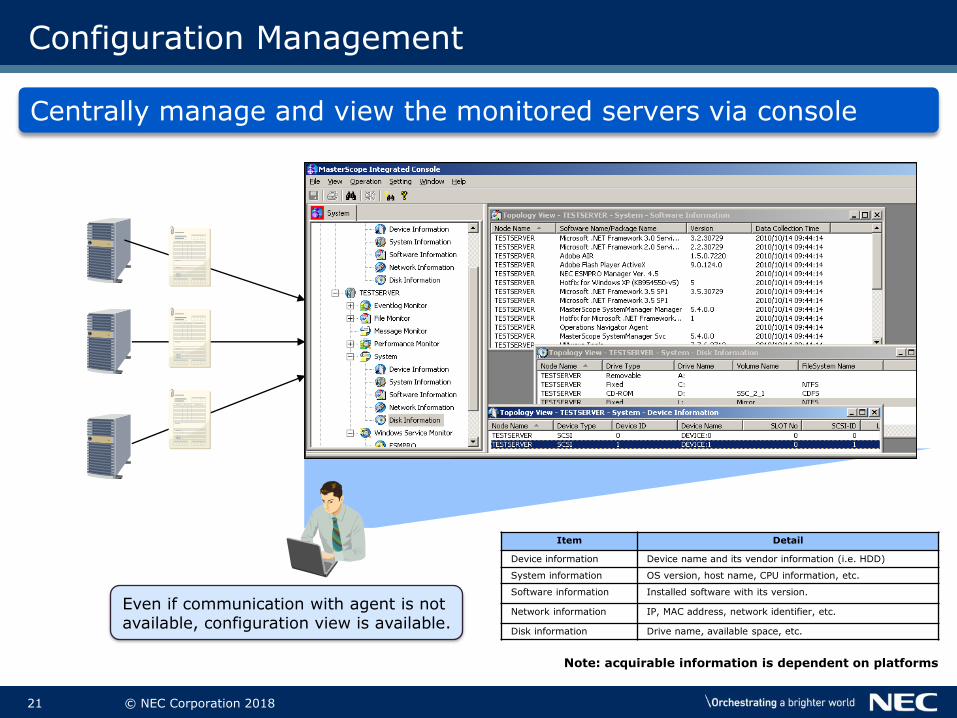
Configuration Management
Centrally manage and view the monitored servers via console
Even if communication with agent is not available, configuration view is available.
Item Detail
Device information Device name and its vendor information (i.e. HDD)
System information OS version, host name, CPU information, etc.
Software information Installed software with its version.
Network information IP, MAC address, network identifier, etc.
Disk information Drive name, available space, etc.
Note: acquirable information is dependent on platforms

22 © NEC Corporation 2018
User Management
Assigns operating permission to each user to prevent operation mistakes and enhance security
Flexibly control access scope helps users ignore unnecessary information.
System A System B
Manager
Operator A Operator B
■Operator can see only his own servers■Admin can see overall system information
Admin
Permission Details
Reference Refer to the information of the system.
Operation Perform operations such as confirming messages and starting/stopping processes/Windows services.
Configuration Define configuration with the configuration mode.
License Register and manage licenses.
User Management Create users/groups and assign permissions to them.
Set permission and add users to group.
23 © NEC Corporation 2018
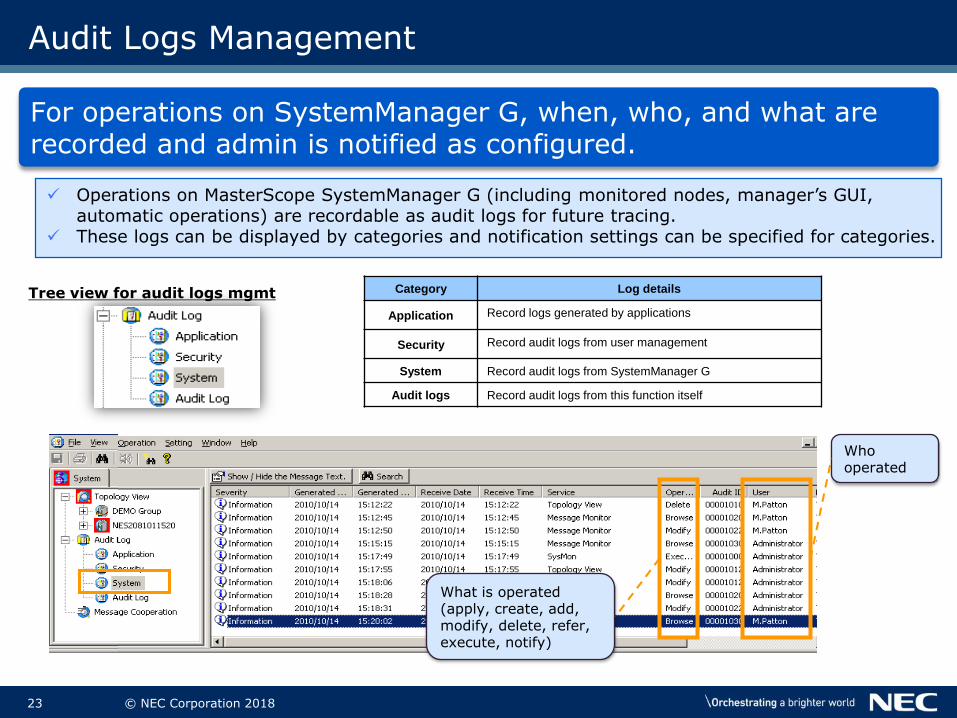
Audit Logs Management
For operations on SystemManager G, when, who, and what are recorded and admin is notified as configured.
Operations on MasterScope SystemManager G (including monitored nodes, manager’s GUI, automatic operations) are recordable as audit logs for future tracing.
These logs can be displayed by categories and notification settings can be specified for categories.
Tree view for audit logs mgmt Category Log details
Application Record logs generated by applications
Security Record audit logs from user management
System Record audit logs from SystemManager G
Audit logs Record audit logs from this function itself
Who operated
What is operated(apply, create, add, modify, delete, refer, execute, notify)

24 © NEC Corporation 2018
Schedule Control
SystemManager G can start and stop monitoring according to pre-defined schedule.
It allows you to set monitoring schedule per server
25 © NEC Corporation 2018
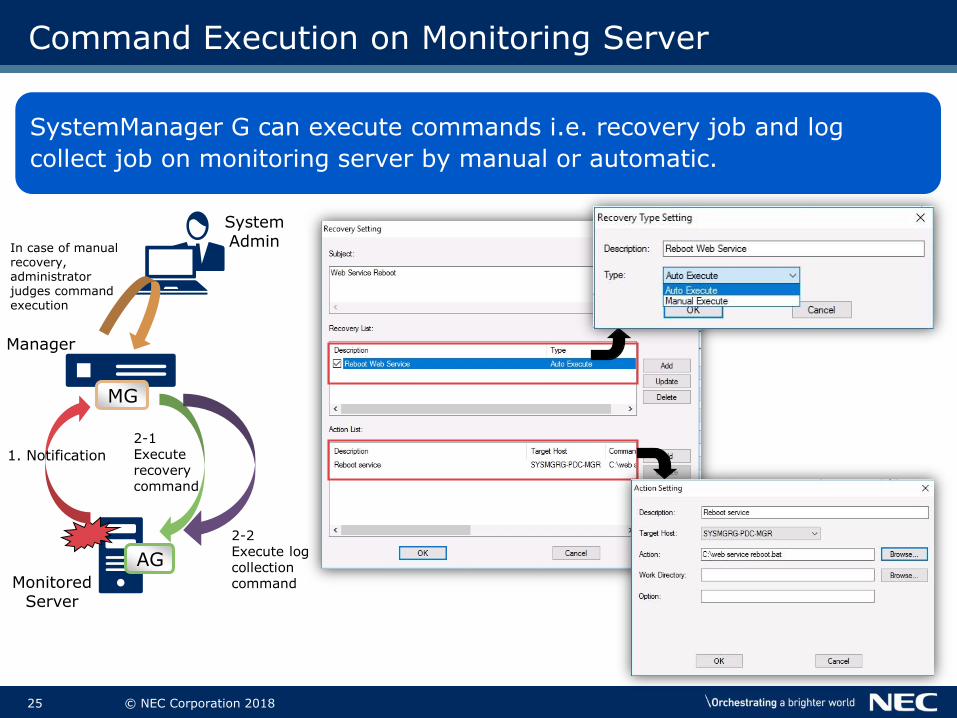
Command Execution on Monitoring Server
SystemManager G can execute commands i.e. recovery job and log
collect job on monitoring server by manual or automatic.
Manager
MonitoredServer
1. Notification
2-1Execute recovery command
2-2Execute log collection command
In case of manual recovery,administrator judges commandexecution
AG
MG
SystemAdmin
26 © NEC Corporation 2018
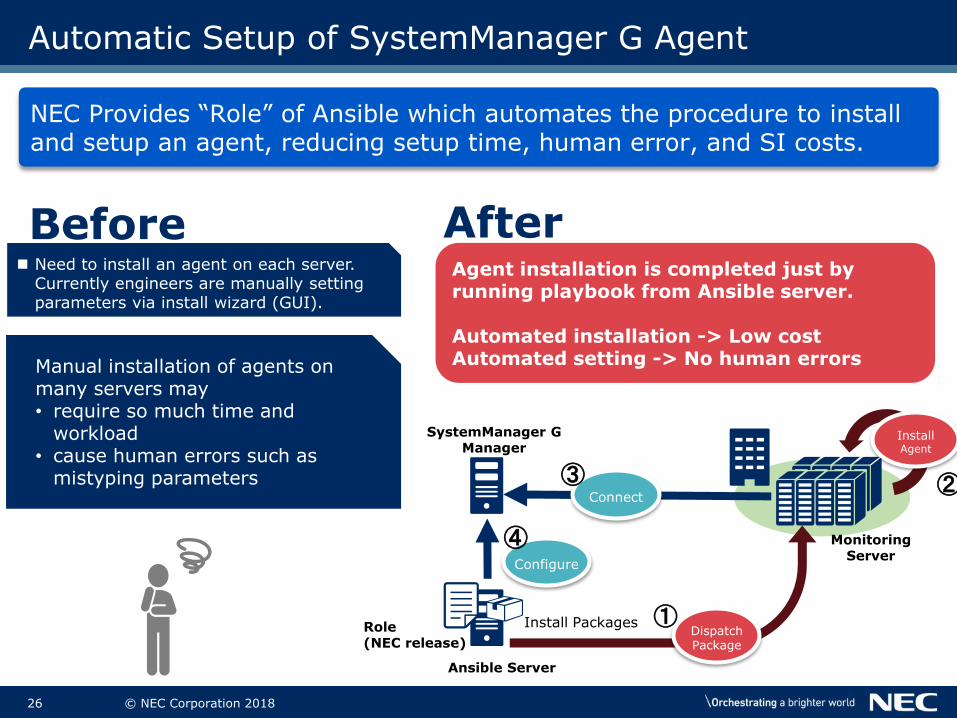
Manual installation of agents on many servers may• require so much time and
workload• cause human errors such as
mistyping parameters
Automatic Setup of SystemManager G Agent
NEC Provides “Role” of Ansible which automates the procedure to install and setup an agent, reducing setup time, human error, and SI costs.
AfterBeforeAgent installation is completed just by running playbook from Ansible server.
Automated installation -> Low costAutomated setting -> No human errors
Need to install an agent on each server.Currently engineers are manually setting parameters via install wizard (GUI).
SystemManager GManager
Ansible Server
①
②
Install PackagesDispatchPackage
Connect
③
Configure
Role(NEC release)
MonitoringServer
InstallAgent
④

27 © NEC Corporation 2018
Application Monitoring
Monitor application performance by simply setting thresholds for warning and anomaly.
Thresholdmonitoring
Performance data
Notify
Tendency/Resourceanalysis
Performance data accumulation could be utilized in operations status/failure analysis
Monitor performance with two level threshold settings
Available threshold setting can be selected from the following patterns:Sequential: an event occurs when a collected value exceeds thresholdContinuous: an event occurs when a collected value exceeds threshold consecutively for the specified number of timesAverage: an event occurs when the average collected values of the specified number of times exceeds threshold.
thresholdexceeding!
Performance dataaccumulation enables
Performance data accumulationcan be enabled simplyby checking settings boxes
OptionOracle Monitoring etc.
If buffer cache hits of Oraclebecome less than threshold,
please notify

28 © NEC Corporation 2018
Support Application Lists
The following table provides support platform information.
Middleware Support version
Data BaseOracle Database ・ Oracle 11gR2, 12cR1, 12cR2
SQL Server ・ SQL Server 2008 SP4, 2008R2 SP3, 2012 SP3, 2014 SP1/SP2, 2016(SP1), 2017
Web/AP Server
IIS ・ IIS 7.0, 7.5, 8.0, 8.5, 10.0
WebLogic Server ・ WebLogic Server 11gR1, 12cR1, 12cR2
WebSphere
Application Server
・ WebSphere Application Server 7.0, 8.0, 8.5
Apache HTTP Server ・ Apache 2.2, 2.4
Apache Tomcat ・ Tomcat 6.0, 7.0, 8.0, 8.5
OthersSAP
・ SAP ERP 6.0
・ SAP NetWeaver 7.0, 7.3
Java application ・ Running applications on Java 6, 7, 8, 9
OptionOracle Monitoring etc.
29 © NEC Corporation 2018
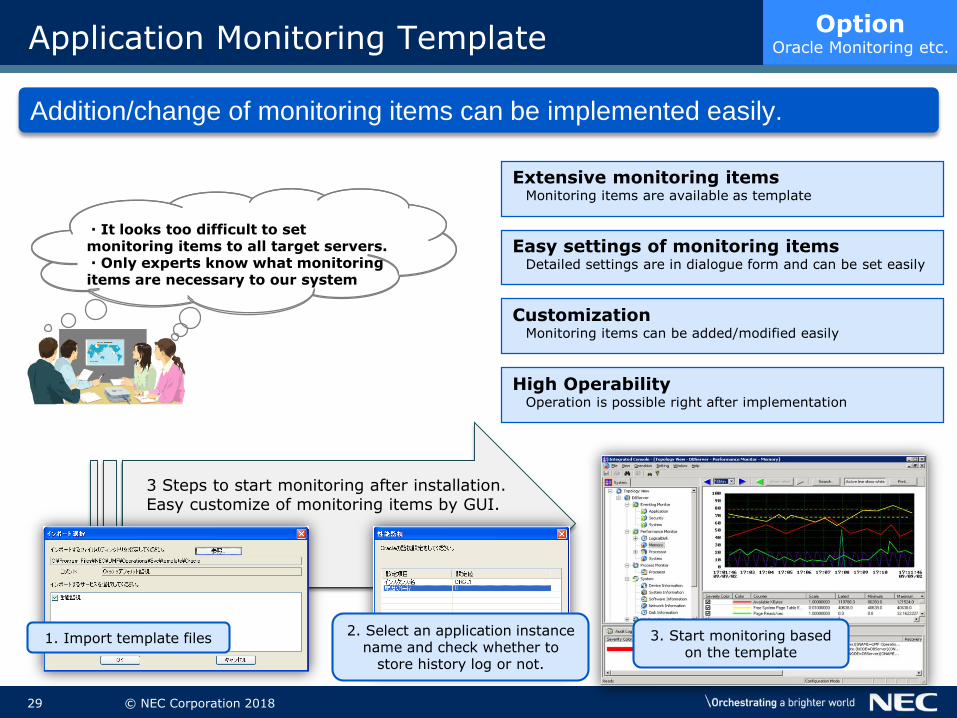
Application Monitoring Template
Addition/change of monitoring items can be implemented easily.
Extensive monitoring itemsMonitoring items are available as template
Easy settings of monitoring itemsDetailed settings are in dialogue form and can be set easily
CustomizationMonitoring items can be added/modified easily
High OperabilityOperation is possible right after implementation
1. Import template files2. Select an application instance
name and check whether to store history log or not.
3. Start monitoring based on the template
3 Steps to start monitoring after installation.Easy customize of monitoring items by GUI.
・It looks too difficult to set monitoring items to all target servers.・Only experts know what monitoring items are necessary to our system
OptionOracle Monitoring etc.

30 © NEC Corporation 2018
IT Service Response Monitoring
Request
Response
Access periodically
Manager SystemAdministrator
Probe
Periodic execution of specified operation scenario
SystemManger GIT Service Response Monitoring
Accesses Web System periodically using Probe (simulate users) and monitors availability and end-to-end performance.
Monitoring Terminal
Refer to data
Alert Notification
Data
Note: Scenario is a record of executed operation in the browser. It is used to access IT server for monitoring.
Online Processing
Web Server
DNS Server
FTP Server
Mail Server
IT Service Monitoring items
HTTP(Web Scenario)
DNS, FTP, Mail, TCP
OptionIT Service Response
Monitor
Connection
31 © NEC Corporation 2018
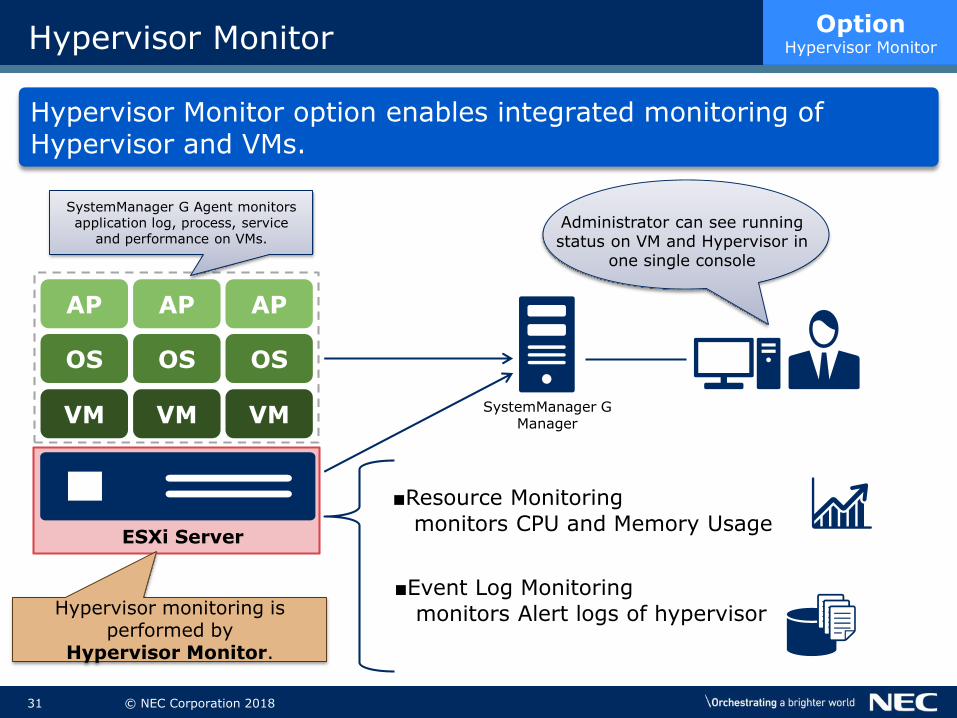
Hypervisor Monitor
Hypervisor Monitor option enables integrated monitoring of Hypervisor and VMs.
ESXi Server
■Resource Monitoring
monitors CPU and Memory Usage
■Event Log Monitoring
monitors Alert logs of hypervisorHypervisor monitoring is performed by
Hypervisor Monitor.
Administrator can see running status on VM and Hypervisor in
one single console
VM VMVM
OS OS OS
AP AP AP
SystemManager G Agent monitors application log, process, service
and performance on VMs.
SystemManager GManager
OptionHypervisor Monitor
32 © NEC Corporation 2018
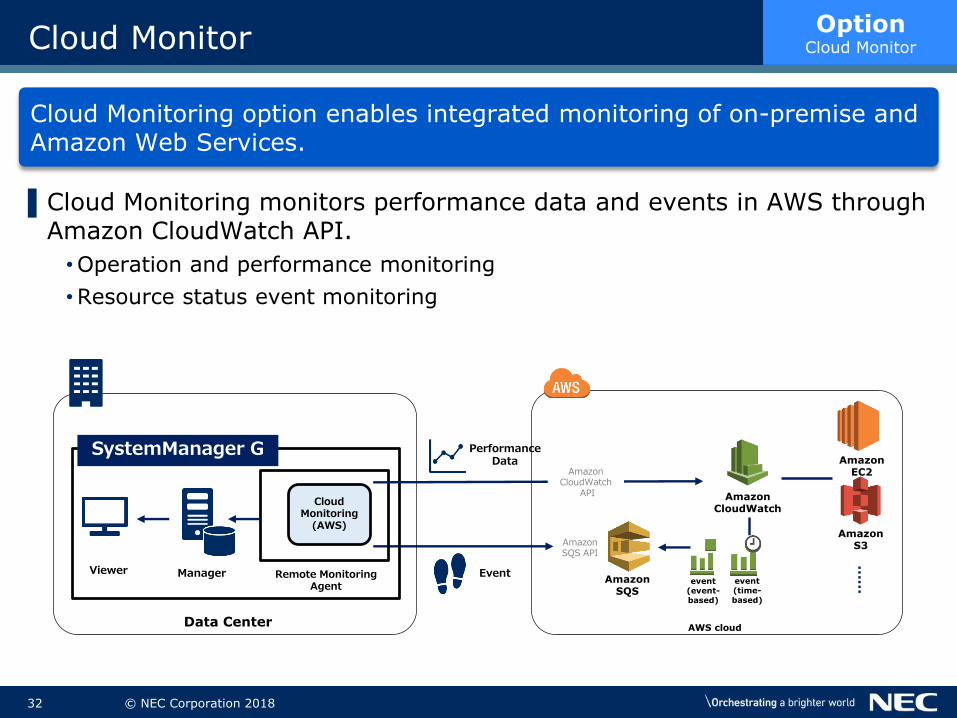
Cloud Monitor
Cloud Monitoring option enables integrated monitoring of on-premise and Amazon Web Services.
▌Cloud Monitoring monitors performance data and events in AWS through Amazon CloudWatch API.
• Operation and performance monitoring
• Resource status event monitoring
OptionCloud Monitor
Amazon EC2
Amazon CloudWatch
AmazonSQS
Cloud Monitoring
(AWS)
Remote Monitoring Agent
Viewer Manager
Data CenterAWS cloud
SystemManager G
AmazonS3
event (event-based)
PerformanceData
event (time-based)
Amazon SQS API
Amazon CloudWatch
API
Event
33 © NEC Corporation 2018
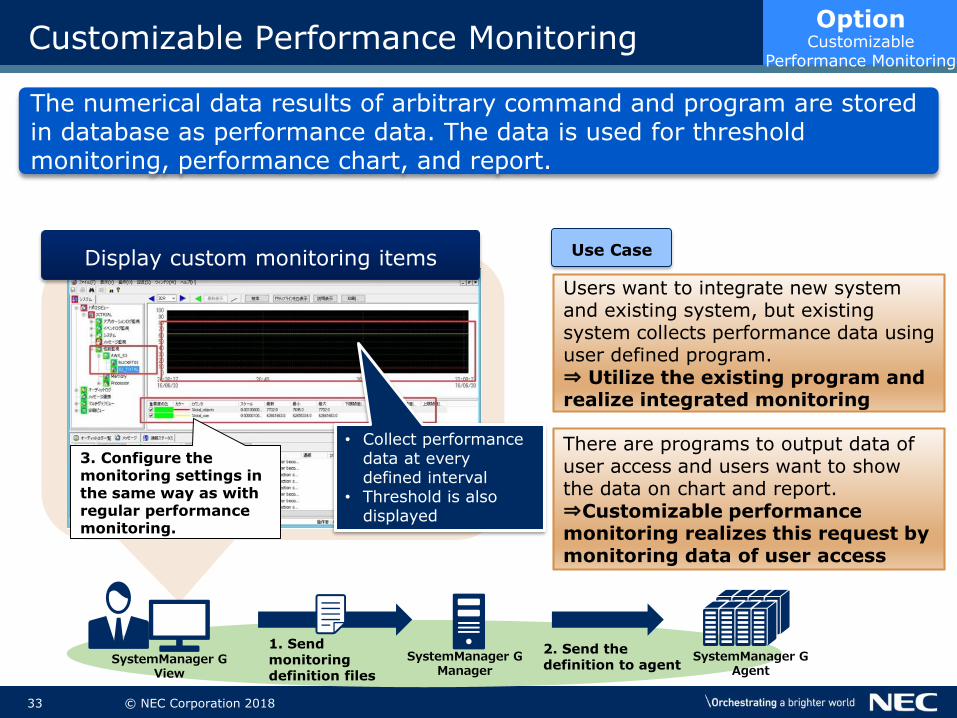
Customizable Performance Monitoring
The numerical data results of arbitrary command and program are stored in database as performance data. The data is used for threshold monitoring, performance chart, and report.
Users want to integrate new system and existing system, but existing system collects performance data using user defined program.⇒ Utilize the existing program and realize integrated monitoring
There are programs to output data of user access and users want to show the data on chart and report.⇒Customizable performance monitoring realizes this request by monitoring data of user access
Use Case
OptionOption
CustomizablePerformance Monitoring
1. Send monitoring definition files
2. Send the definition to agent
3. Configure the monitoring settings in the same way as with regular performance monitoring.
• Collect performance data at every defined interval
• Threshold is also displayed
SystemManager GView
SystemManager GManager
SystemManager GAgent
Display custom monitoring items
34 © NEC Corporation 2018
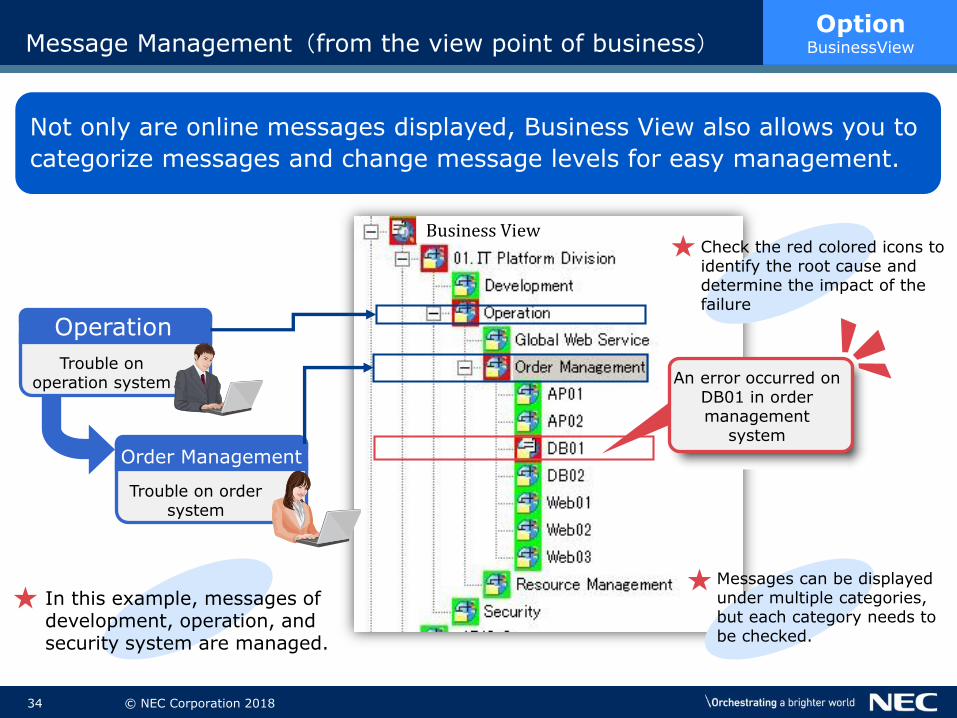
Operation
Order Management
Trouble on operation system
Trouble on order system
In this example, messages of development, operation, and security system are managed.
An error occurred on DB01 in order management
system
Messages can be displayed under multiple categories, but each category needs to be checked.
Check the red colored icons to identify the root cause and determine the impact of the failure
Message Management(from the view point of business)
Not only are online messages displayed, Business View also allows you to
categorize messages and change message levels for easy management.
OptionBusinessView
Business View
35 © NEC Corporation 2018
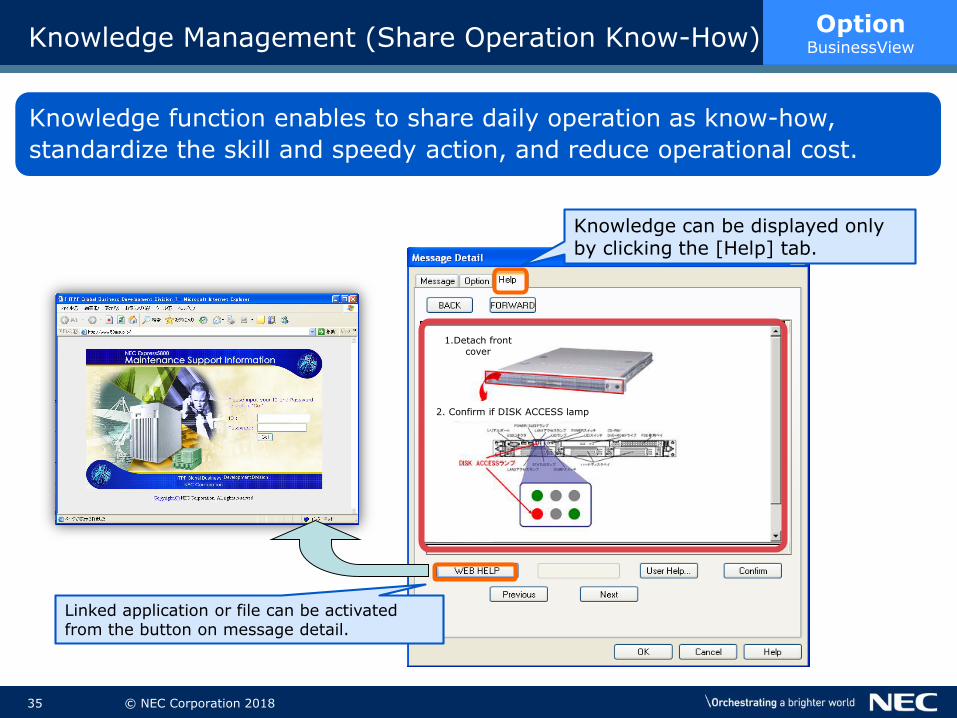
Knowledge Management (Share Operation Know-How)
Knowledge function enables to share daily operation as know-how,
standardize the skill and speedy action, and reduce operational cost.
OptionBusinessView
Knowledge can be displayed only by clicking the [Help] tab.
Linked application or file can be activated from the button on message detail.
1.Detach front cover
2. Confirm if DISK ACCESS lamp
36 © NEC Corporation 2018
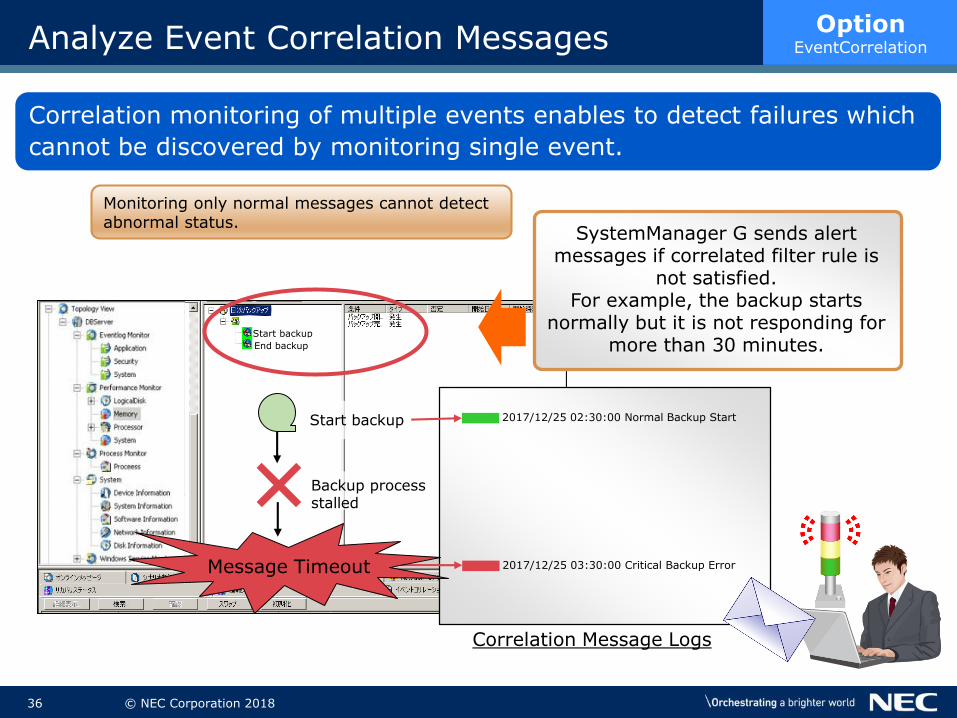
Analyze Event Correlation Messages
2017/12/25 02:30:00 Normal Backup StartStart backup
×2017/12/25 03:30:00 Critical Backup Error
SystemManager G sends alert messages if correlated filter rule is
not satisfied.For example, the backup starts
normally but it is not responding for more than 30 minutes.
Backup processstalled
Correlation Message Logs
Monitoring only normal messages cannot detect abnormal status.
Correlation monitoring of multiple events enables to detect failures which
cannot be discovered by monitoring single event.
OptionEventCorrelation
Message Timeout
Start backup
End backup
37 © NEC Corporation 2018
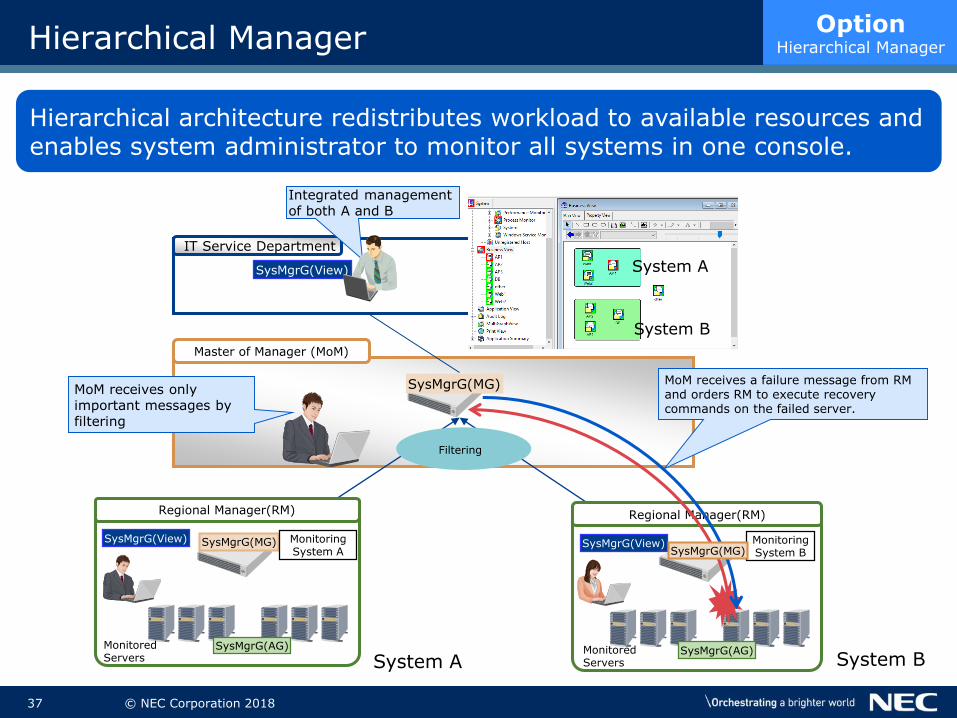
Hierarchical Manager
IT Service Department
Master of Manager (MoM)
拠点A 拠点BRegional Manager(RM) Regional Manager(RM)
SysMgrG(AG) SysMgrG(AG)MonitoredServers
SysMgrG(View)
System B
SysMgrG(View) SysMgrG(View)
MoM receives only important messages by filtering
Integrated management of both A and B
SysMgrG(MG)
SysMgrG(MG) Monitoring System A
Monitoring System B
Hierarchical architecture redistributes workload to available resources and enables system administrator to monitor all systems in one console.
MonitoredServers
MoM receives a failure message from RM and orders RM to execute recovery commands on the failed server.
Filtering
SysMgrG(MG)
OptionHierarchical Manager
System A
System A
System B
38 © NEC Corporation 2018
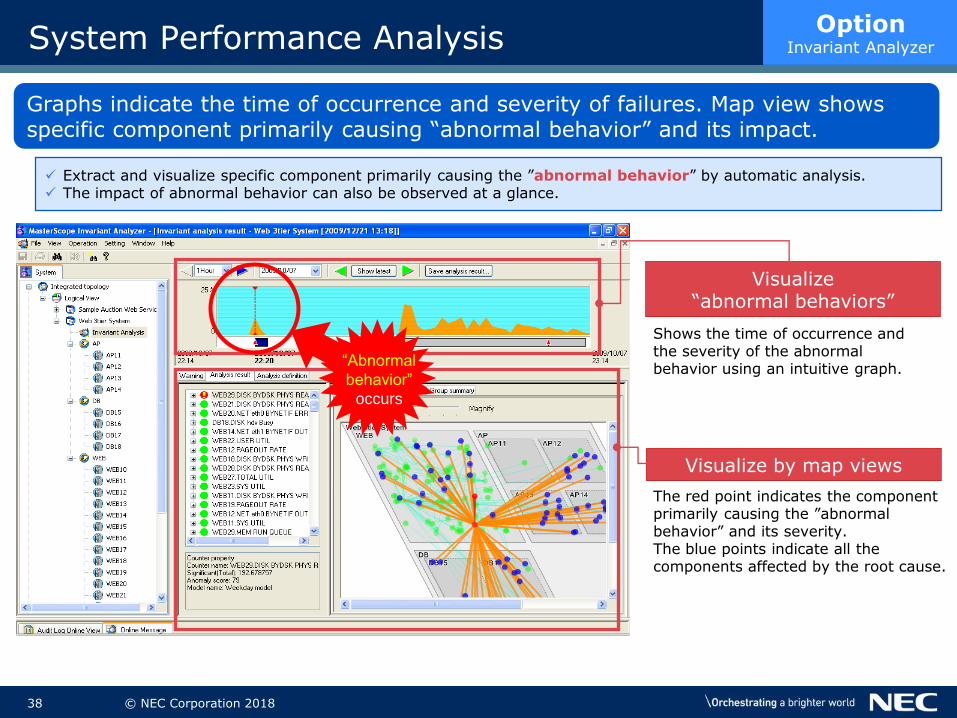
System Performance Analysis
Extract and visualize specific component primarily causing the ”abnormal behavior” by automatic analysis. The impact of abnormal behavior can also be observed at a glance.
Visualize “abnormal behaviors”
Shows the time of occurrence and the severity of the abnormal behavior using an intuitive graph.
Visualize by map views
Graphs indicate the time of occurrence and severity of failures. Map view shows specific component primarily causing “abnormal behavior” and its impact.
OptionInvariant Analyzer
The red point indicates the component primarily causing the ”abnormal behavior” and its severity.The blue points indicate all the components affected by the root cause.
“Abnormal
behavior”
occurs

39 © NEC Corporation 2018
MasterScope SystemManager G Invariant Analyzer Option can resolve it
Silent Failure Detection
NW Specialist
DB Specialist
HW Admin
AP Admin
Web AP DB
Is this thecause?
Too much infoto search…
Silent failureoccurred
System Admin
Users
Response is so slow…
This lookssuspicious…I can’t find
any error messages
What is the problem?
Period while Silent failure is undetected Analyze failure and localize root cause
TroubleShooting
SilentFailure
No error messagesUser
escalationIt takes too long time to detect root cause
Silent failure occurs often in complex large-scale IT systems and it is difficult to resolve the failure. Silent failure may generate performance degradation caused by undetectable bottlenecks.
For failures without error messages, various system components need to
be checked by specialists with specific skills and experience.
OptionInvariant Analyzer
40 © NEC Corporation 2018
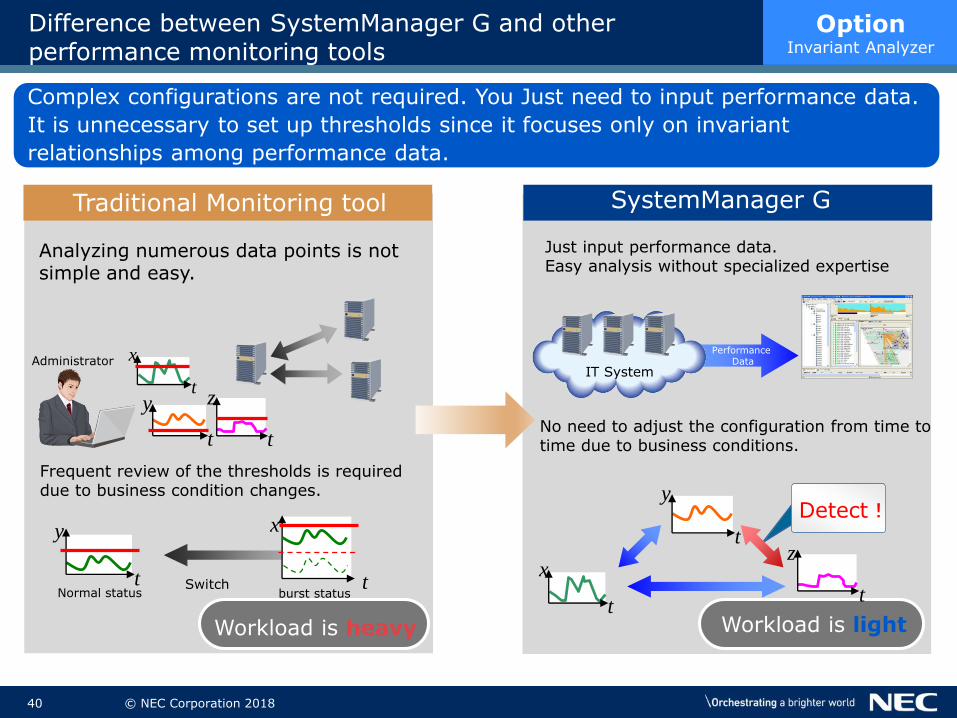
Difference between SystemManager G and otherperformance monitoring tools
Workload is heavy
Administrator
Analyzing numerous data points is not simple and easy.
Frequent review of the thresholds is required due to business condition changes.
Just input performance data.Easy analysis without specialized expertise
No need to adjust the configuration from time to time due to business conditions.
Normal status burst statusSwitch
x
tt
y
z
tt
y
x
t
x
t
t
y
SystemManager GTraditional Monitoring tool
Workload is light
Performance Data
IT System
z
t
Detect!
Complex configurations are not required. You Just need to input performance data.
It is unnecessary to set up thresholds since it focuses only on invariant
relationships among performance data.
OptionInvariant Analyzer
41 © NEC Corporation 2018
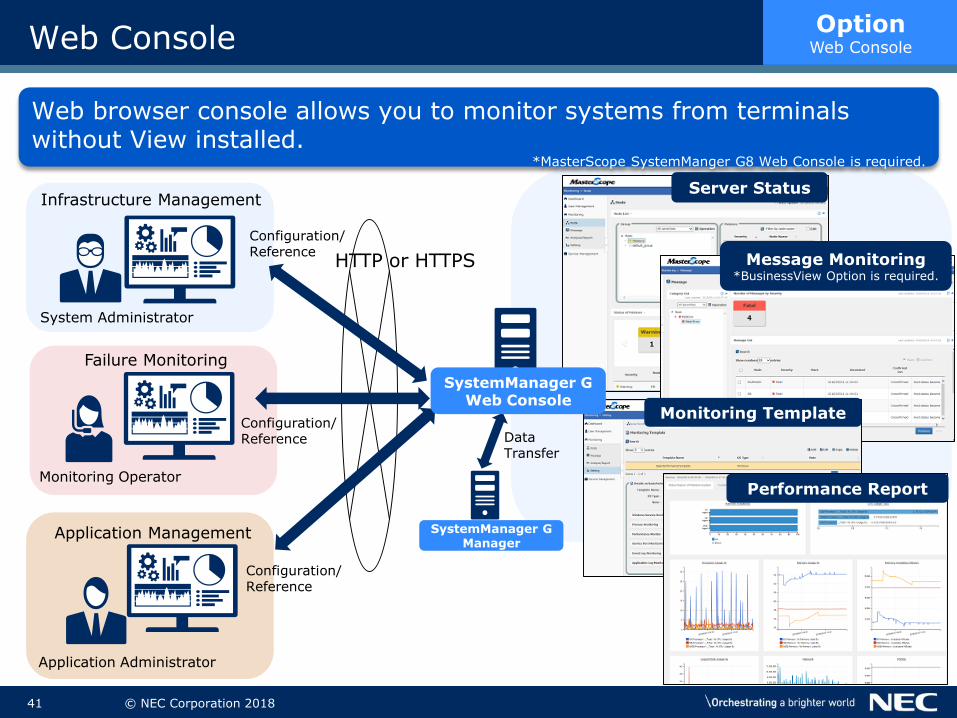
Web Console
Web browser console allows you to monitor systems from terminals without View installed.
*MasterScope SystemManger G8 Web Console is required.
Server Status
System Administrator
Monitoring Operator
Application Administrator
Infrastructure Management
Failure Monitoring
Application Management
OptionWeb Console
HTTP or HTTPS
Configuration/Reference
SystemManager GManager
DataTransfer
Configuration/Reference
Configuration/Reference
Message Monitoring*BusinessView Option is required.
Monitoring Template
SystemManager GWeb Console
Performance Report
42 © NEC Corporation 2018
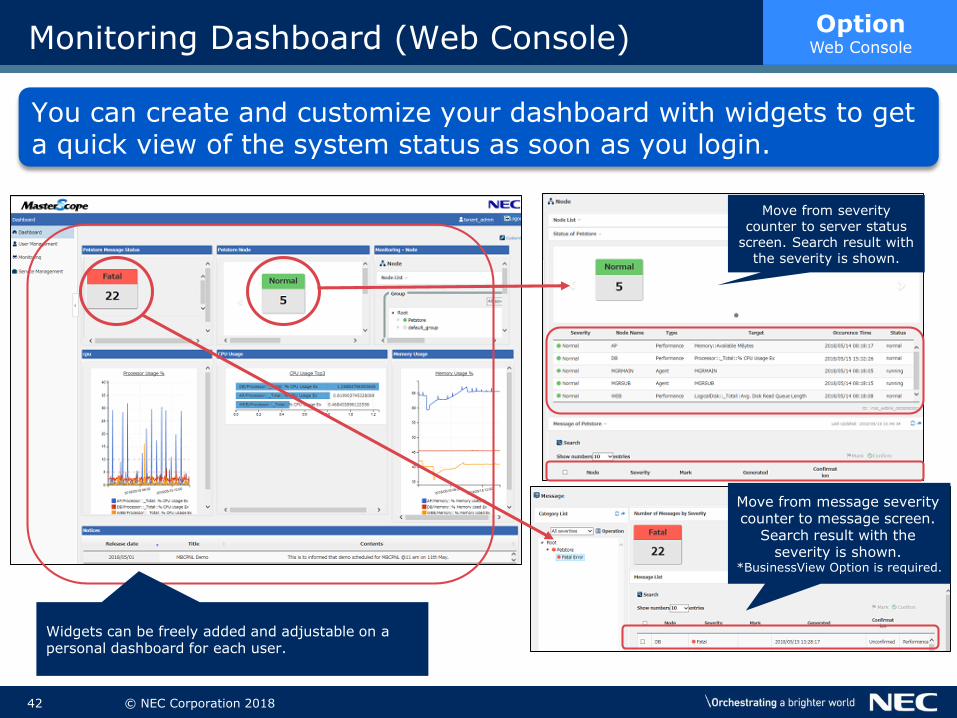
Monitoring Dashboard (Web Console)
You can create and customize your dashboard with widgets to get a quick view of the system status as soon as you login.
OptionWeb Console
Move from message severity counter to message screen.
Search result with the severity is shown.
*BusinessView Option is required.
Move from severity counter to server status
screen. Search result with the severity is shown.
Widgets can be freely added and adjustable on a personal dashboard for each user.

43 © NEC Corporation 2018
Performance Report (Web Console)
Performance reports are displayed using tabs. Host availability, ranking, and capacity management by regression lines are newly added features.
OptionWeb Console
Tabbed Reports
Performance Ranking
PerformanceGraph
Host Availability
Regression line
Future
Time period
Resource will be scarce
Drawing a regression line based on performance data during the specified time period enables you to estimate resource scarcity in the future.
44 © NEC Corporation 2018
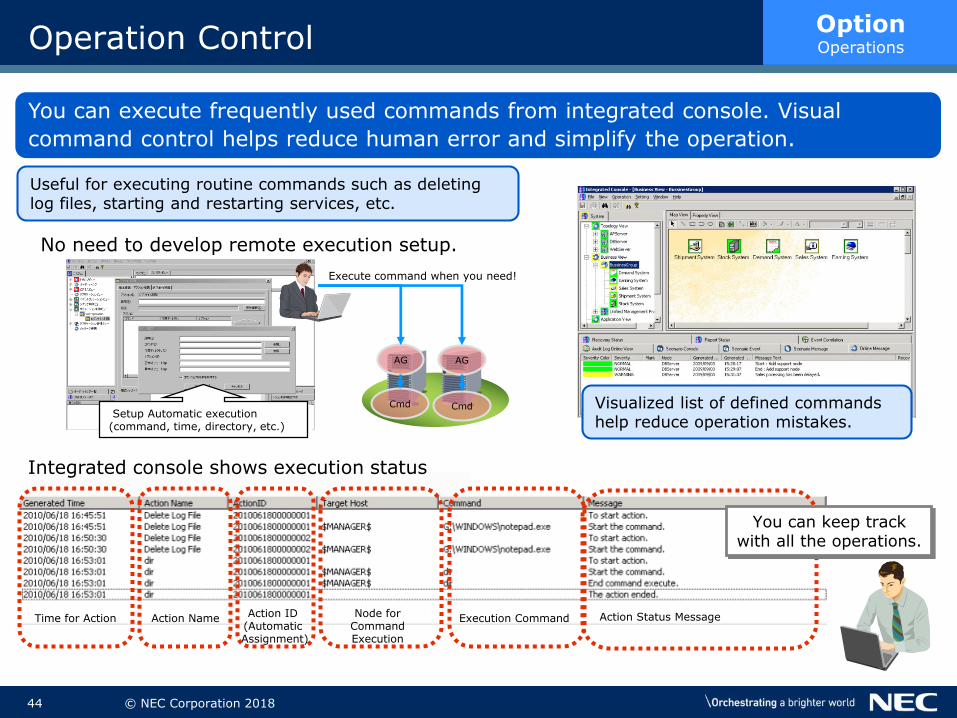
Operation Control
No need to develop remote execution setup.
Useful for executing routine commands such as deleting log files, starting and restarting services, etc.
Integrated console shows execution status
AG AG
Cmd Cmd
Execute command when you need!
Setup Automatic execution (command, time, directory, etc.)
Visualized list of defined commands help reduce operation mistakes.
You can execute frequently used commands from integrated console. Visual
command control helps reduce human error and simplify the operation.
OptionOperations
Time for Action Action Name Action ID(AutomaticAssignment)
Node forCommandExecution
Execution Command Action Status Message
You can keep trackwith all the operations.
45 © NEC Corporation 2018
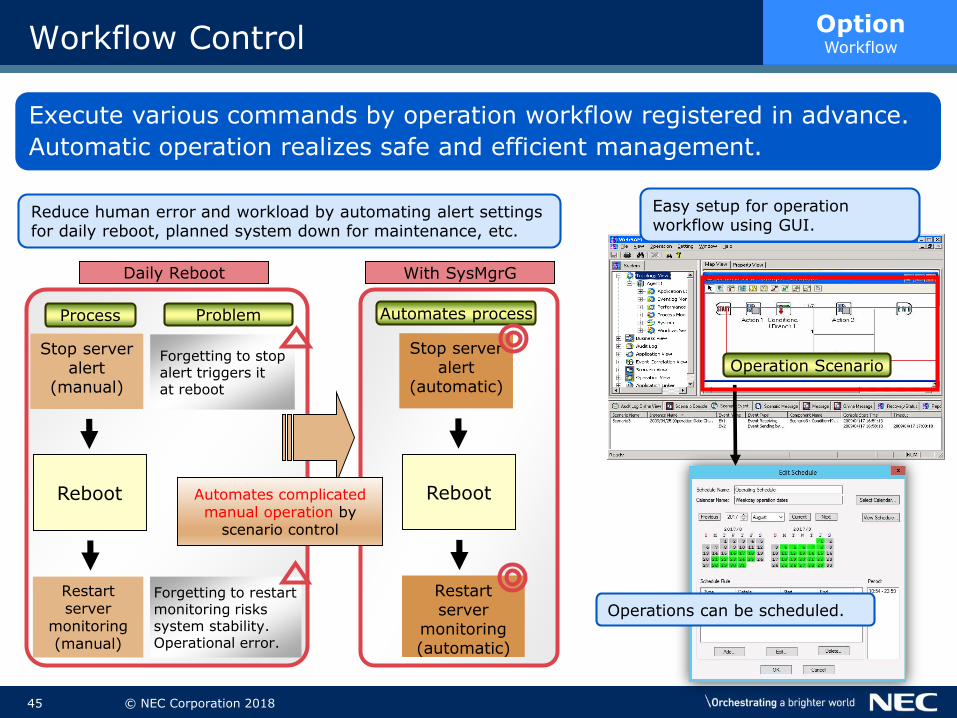
Reboot
Workflow Control
Stop server alert
(manual)
Restart server
monitoring (manual)
Reduce human error and workload by automating alert settings for daily reboot, planned system down for maintenance, etc.
Forgetting to stop alert triggers itat reboot
Process Problem
Forgetting to restart monitoring risks system stability.Operational error.
Reboot
Stop server alert
(automatic)
Restart server
monitoring (automatic)
Automates process
Operations can be scheduled.
Automates complicated manual operation by
scenario control
Easy setup for operation workflow using GUI.
Execute various commands by operation workflow registered in advance.
Automatic operation realizes safe and efficient management.
Operation Scenario
OptionWorkflow
Daily Reboot With SysMgrG

46 © NEC Corporation 2018
Application Linkage
SystemManager G can link another monitoring tool by outputting collected messages to an external file.
OptionApLinker
SysMgrG(RAG)
SysMgrG(AG)
SysMgrG(AG)
SystemManager G can format and output message as text.
User application
SysMgrG(MG)
~~~, ~~~, ~~~xxx, xxx, xxx…
Monitoring tool
Monitoring tool processes the text file generated by SystemManager G.
47 © NEC Corporation 2018
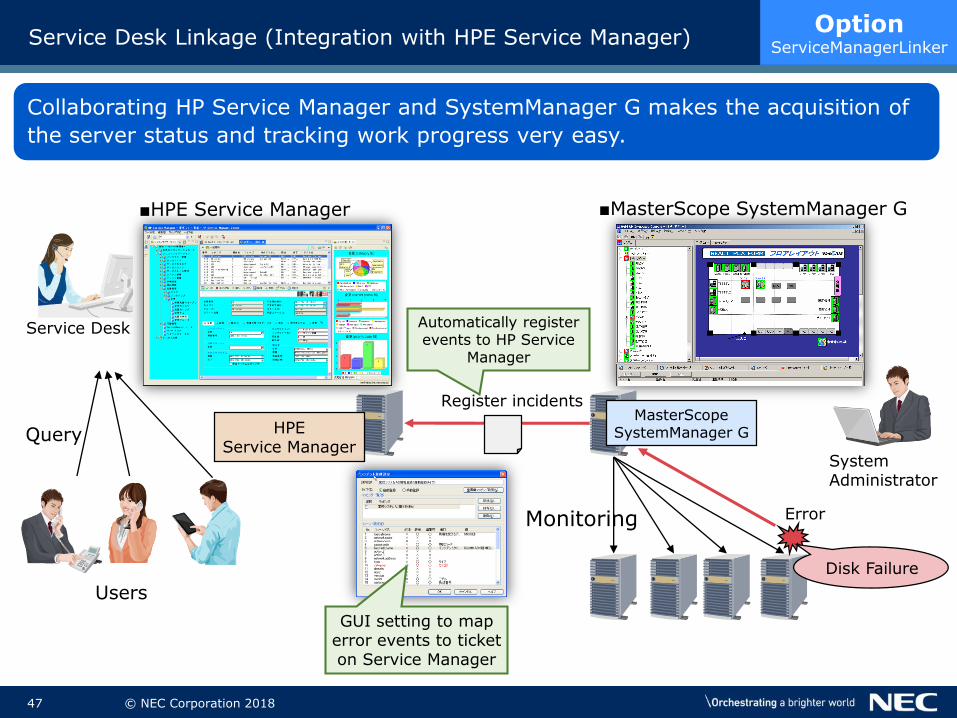
Service Desk Linkage (Integration with HPE Service Manager)
■HPE Service Manager ■MasterScope SystemManager G
Service Desk
Monitoring
Disk Failure
Error
HPEService Manager
MasterScopeSystemManager G
Register incidents
Automatically register events to HP Service
Manager
SystemAdministrator
Users
Query
GUI setting to map error events to ticket on Service Manager
Collaborating HP Service Manager and SystemManager G makes the acquisition of
the server status and tracking work progress very easy.
OptionServiceManagerLinker
48 © NEC Corporation 2018
Thank You
Realize simple and integrated system operation
For more product information, visit >> http://www.nec.com/masterscope/
For more information, please contact your local NEC representative or contact us at [email protected]

Recommended