Market Outlook!
Rodney Jones
OSU NW Area Extension Economist
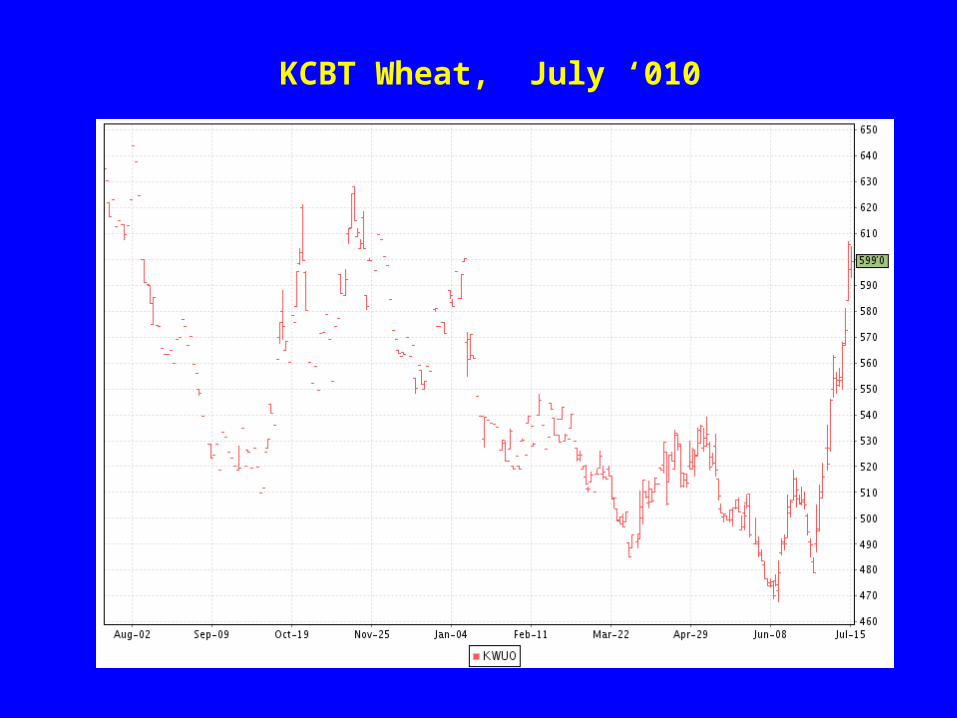
KCBT Wheat, July ‘010
Production ConsumptionEndingStocks
U. S.PriceYear
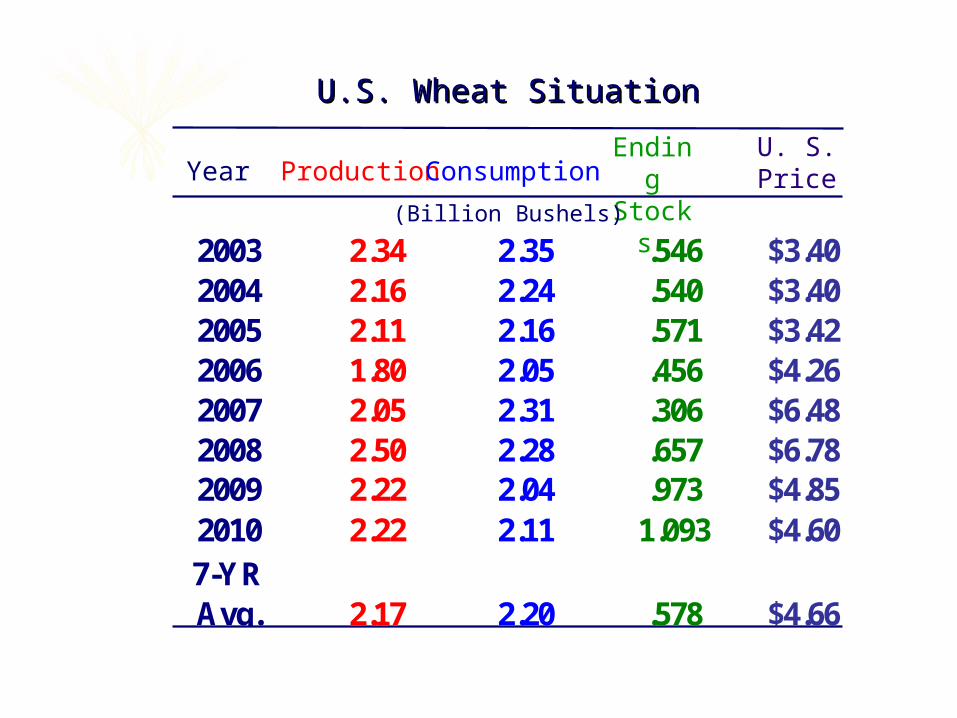
(Billion Bushels)
U.S. Wheat SituationU.S. Wheat Situation
2003 2.34 2.35 .546 $3.402004 2.16 2.24 .540 $3.402005 2.11 2.16 .571 $3.422006 1.80 2.05 .456 $4.262007 2.05 2.31 .306 $6.482008 2.50 2.28 .657 $6.782009 2.22 2.04 .973 $4.852010 2.22 2.11 1.093 $4.607-YR Avg. 2.17 2.20 .578 $4.66
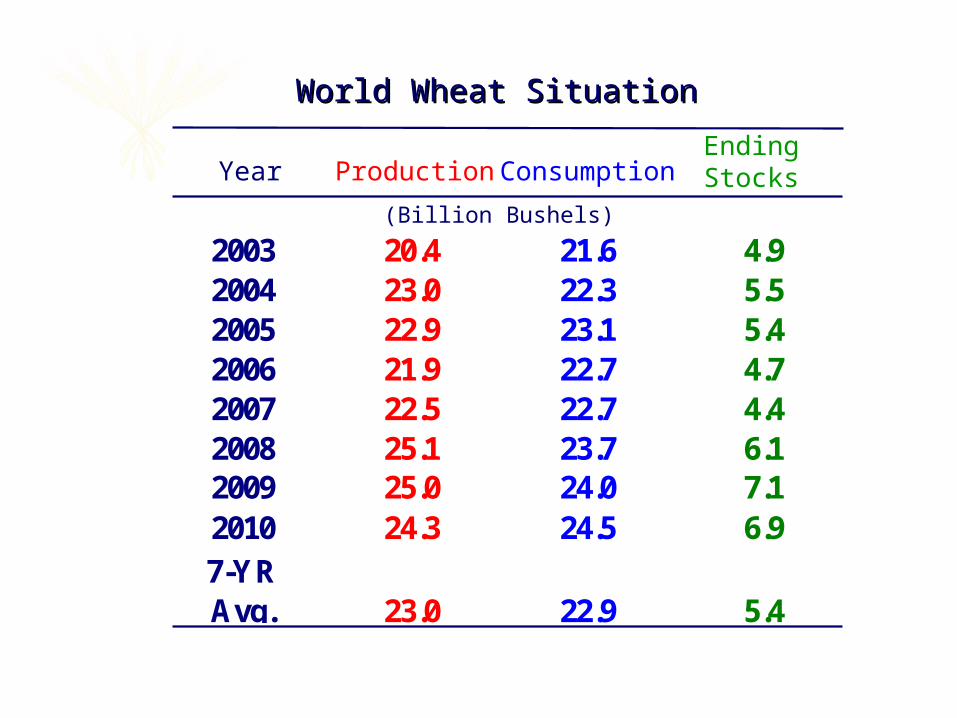
World Wheat SituationWorld Wheat Situation
(Billion Bushels)
Production ConsumptionEndingStocksYear
2003 20.4 21.6 4.92004 23.0 22.3 5.52005 22.9 23.1 5.42006 21.9 22.7 4.72007 22.5 22.7 4.42008 25.1 23.7 6.12009 25.0 24.0 7.12010 24.3 24.5 6.97-YRAvg. 23.0 22.9 5.4
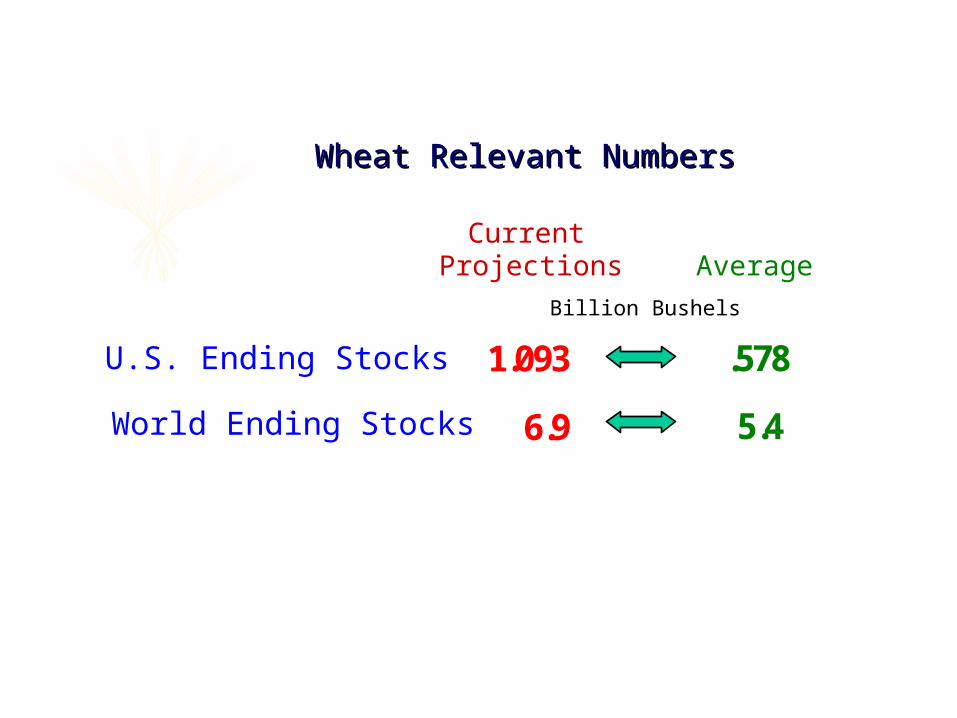
Wheat Relevant NumbersWheat Relevant Numbers
U.S. Ending Stocks
World Ending Stocks
CurrentProjections Average
Billion Bushels
1.093
6.9
.578
5.4
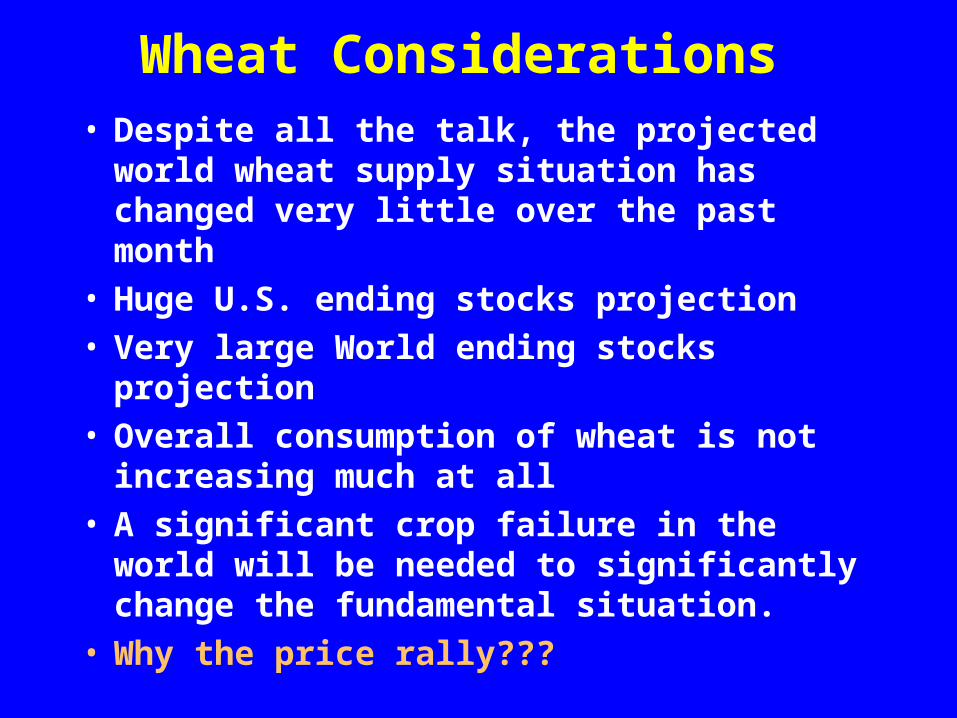
Wheat Considerations• Despite all the talk, the projected world wheat
supply situation has changed very little over the past month
• Huge U.S. ending stocks projection• Very large World ending stocks projection• Overall consumption of wheat is not increasing
much at all• A significant crop failure in the world will be
needed to significantly change the fundamental situation.
• Why the price rally???
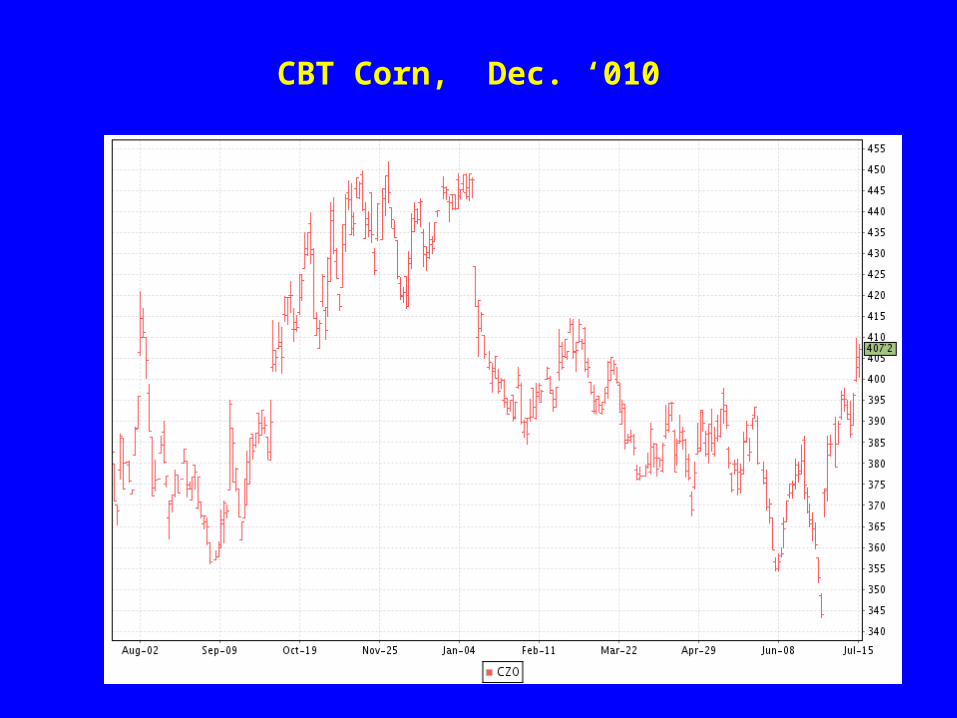
CBT Corn, Dec. ‘010
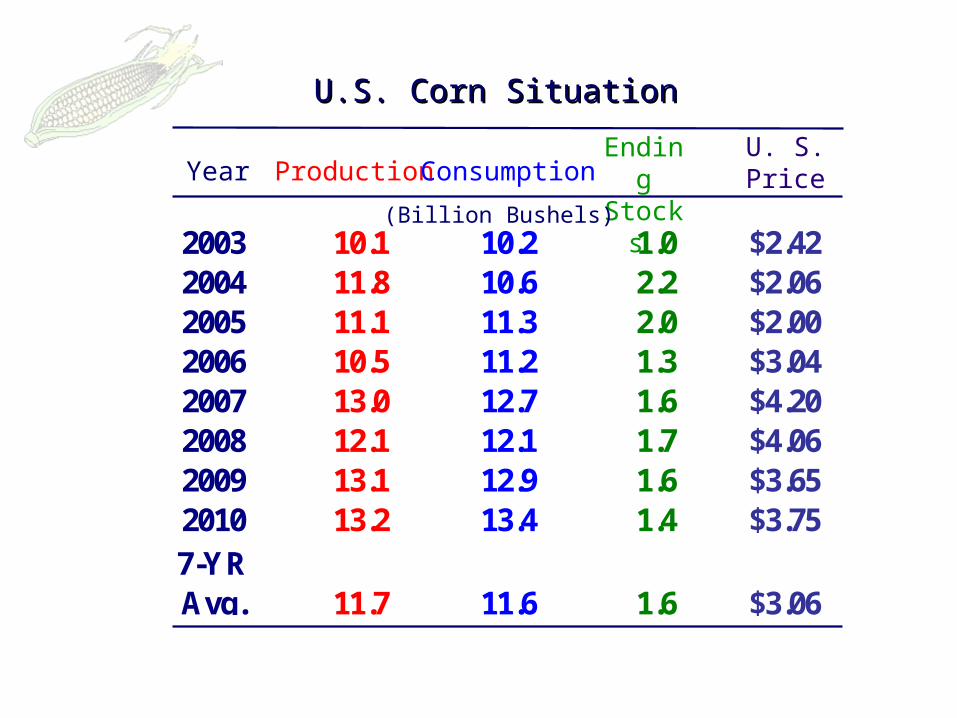
U.S. Corn SituationU.S. Corn Situation
Production ConsumptionEndingStocks
U. S.PriceYear
(Billion Bushels)2003 10.1 10.2 1.0 $2.422004 11.8 10.6 2.2 $2.062005 11.1 11.3 2.0 $2.002006 10.5 11.2 1.3 $3.042007 13.0 12.7 1.6 $4.202008 12.1 12.1 1.7 $4.062009 13.1 12.9 1.6 $3.652010 13.2 13.4 1.4 $3.757-YRAvg. 11.7 11.6 1.6 $3.06

World Corn SituationWorld Corn Situation
(Billion Bushels)
Production ConsumptionEndingStocksYear
2003 24.5 25.4 4.12004 28.0 27.0 5.12005 27.4 27.7 4.82006 28.1 28.7 4.32007 31.1 30.4 5.02008 31.0 30.7 5.52009 31.8 32.0 5.72010 32.8 32.7 5.67-YRAvg. 28.8 28.8 4.9
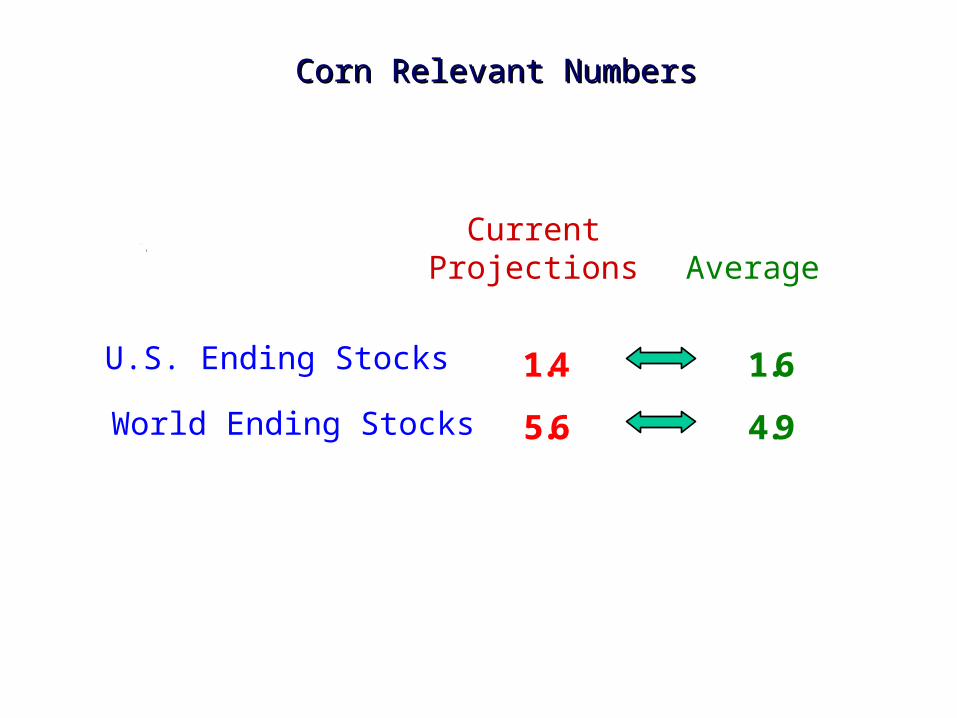
Corn Relevant NumbersCorn Relevant Numbers
CurrentProjections Average
Billion Bushels
U.S. Ending Stocks
World Ending Stocks
1.4 1.6
5.6 4.9
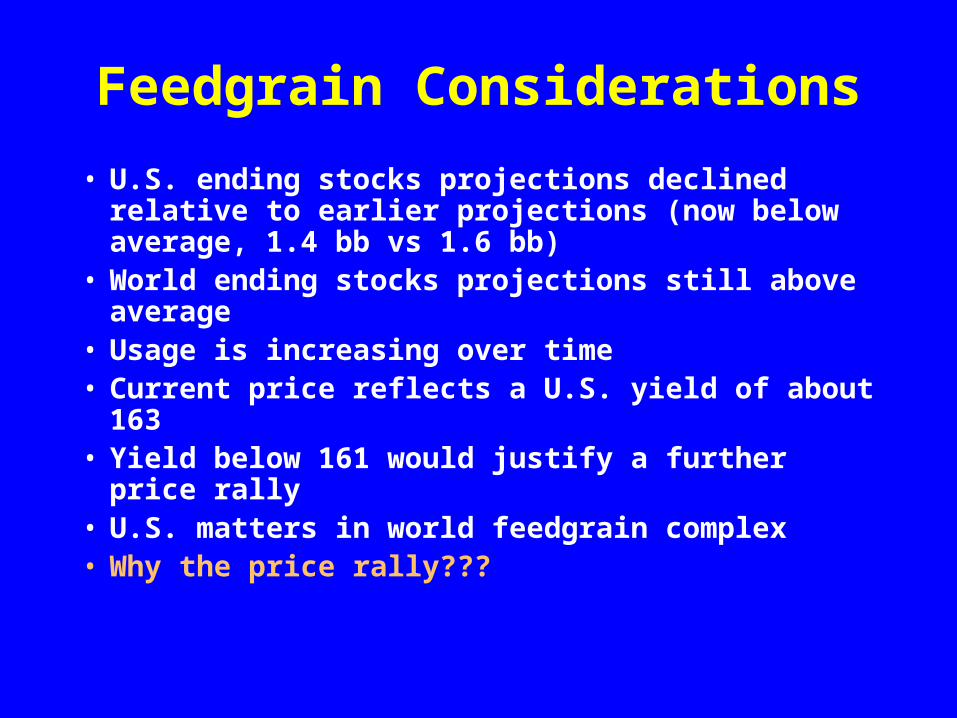
Feedgrain Considerations
• U.S. ending stocks projections declined relative to earlier projections (now below average, 1.4 bb vs 1.6 bb)
• World ending stocks projections still above average
• Usage is increasing over time• Current price reflects a U.S. yield of about 163• Yield below 161 would justify a further price rally• U.S. matters in world feedgrain complex• Why the price rally???
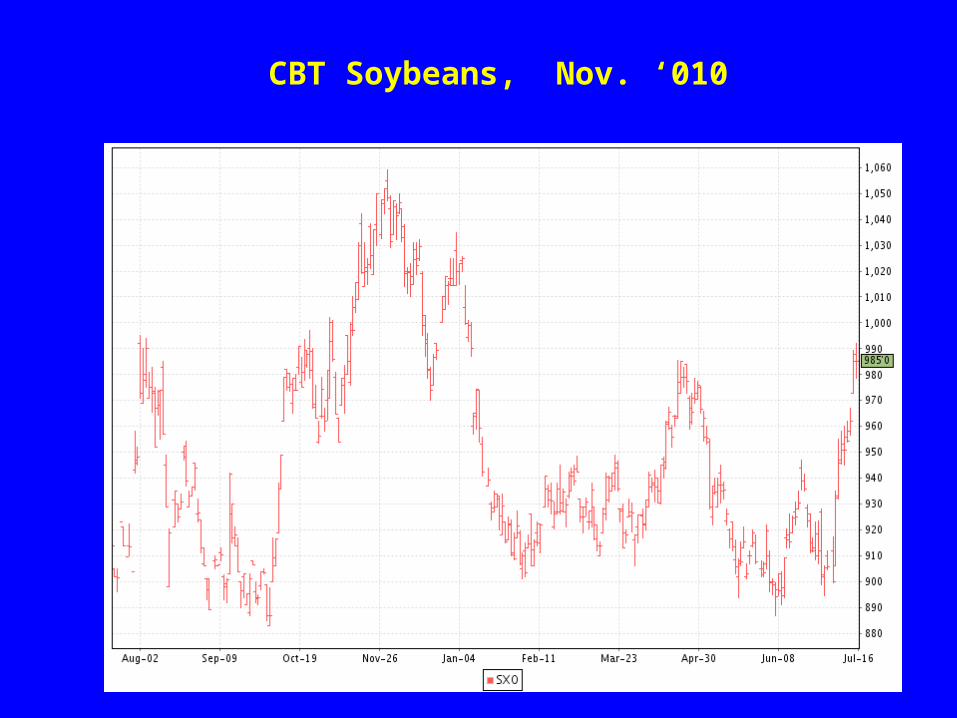
CBT Soybeans, Nov. ‘010
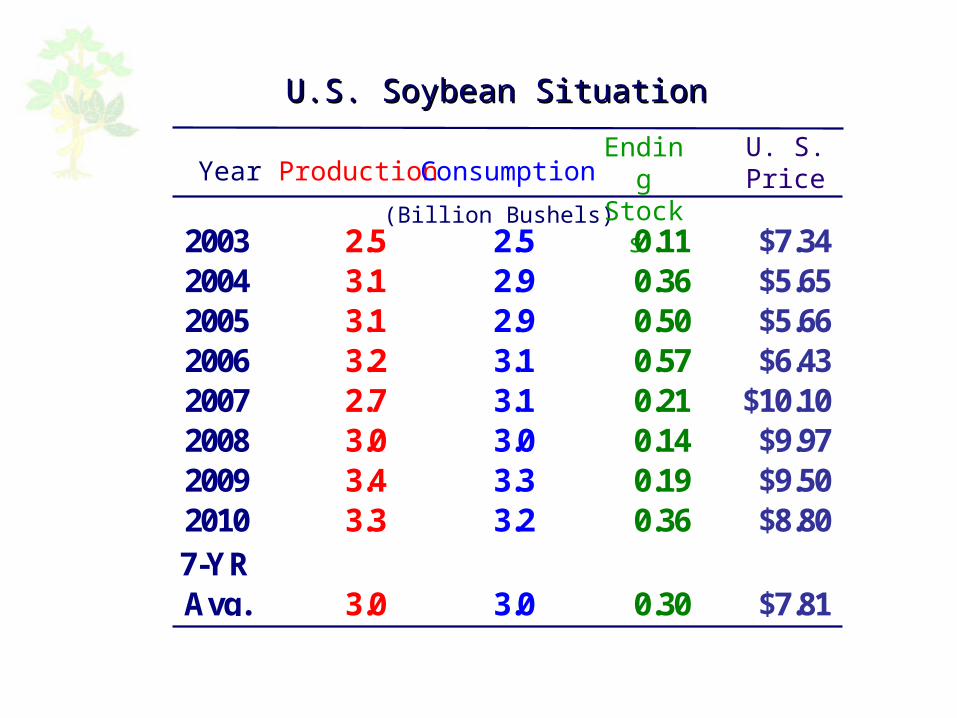
U.S. Soybean SituationU.S. Soybean Situation
(Billion Bushels)
Production ConsumptionEndingStocks
U. S.PriceYear
2003 2.5 2.5 0.11 $7.342004 3.1 2.9 0.36 $5.652005 3.1 2.9 0.50 $5.662006 3.2 3.1 0.57 $6.432007 2.7 3.1 0.21 $10.102008 3.0 3.0 0.14 $9.972009 3.4 3.3 0.19 $9.502010 3.3 3.2 0.36 $8.807-YRAvg. 3.0 3.0 0.30 $7.81
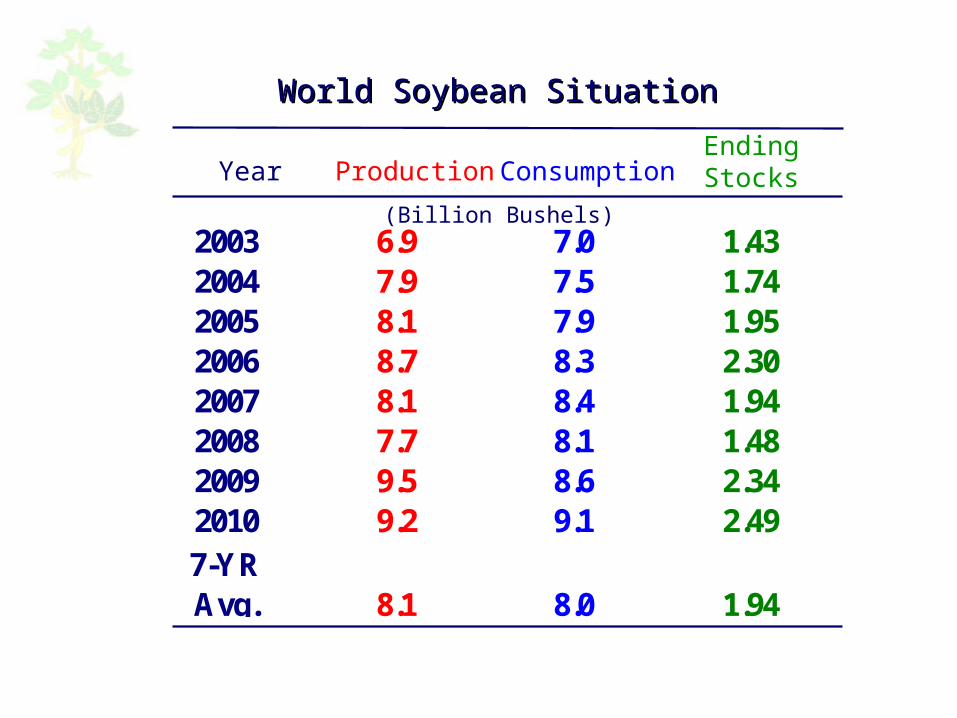
Production ConsumptionEndingStocksYear
World Soybean SituationWorld Soybean Situation
(Billion Bushels)2003 6.9 7.0 1.432004 7.9 7.5 1.742005 8.1 7.9 1.952006 8.7 8.3 2.302007 8.1 8.4 1.942008 7.7 8.1 1.482009 9.5 8.6 2.342010 9.2 9.1 2.497-YRAvg. 8.1 8.0 1.94
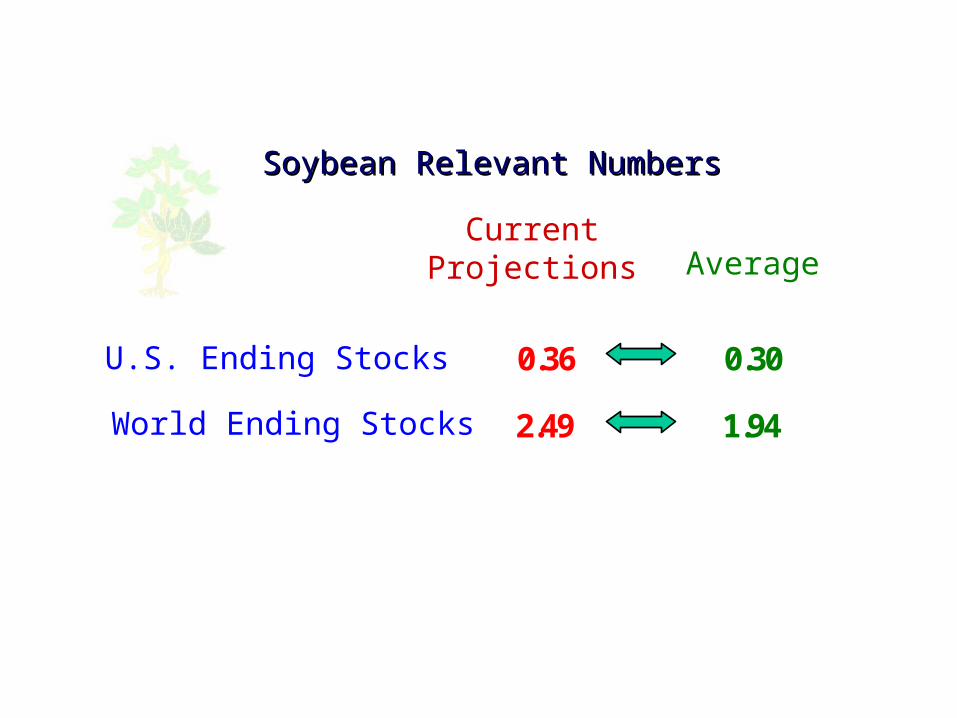
Soybean Relevant NumbersSoybean Relevant Numbers
CurrentProjections Average
Billion Bushels
U.S. Ending Stocks
World Ending Stocks
0.36 0.30
2.49 1.94
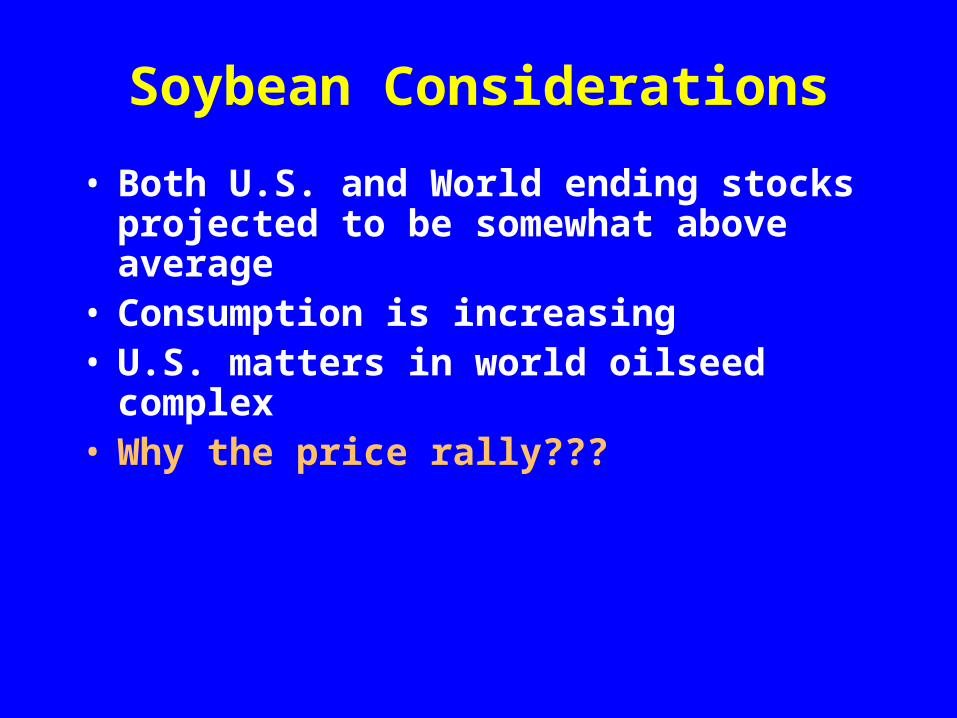
Soybean Considerations
• Both U.S. and World ending stocks projected to be somewhat above average
• Consumption is increasing• U.S. matters in world oilseed complex• Why the price rally???
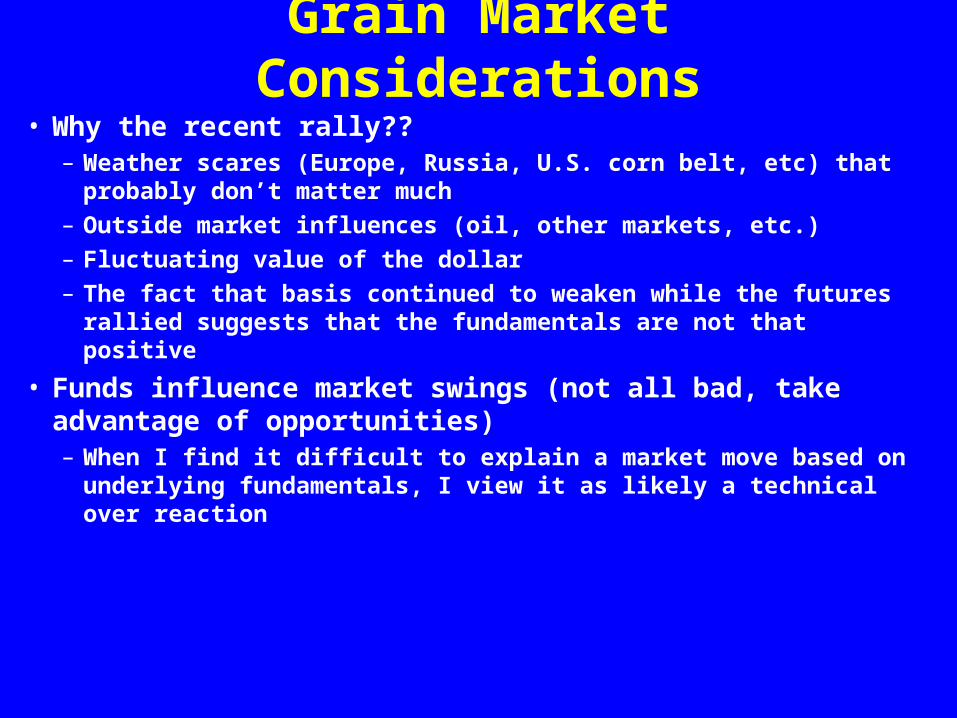
Grain Market Considerations• Why the recent rally??
– Weather scares (Europe, Russia, U.S. corn belt, etc) that probably don’t matter much
– Outside market influences (oil, other markets, etc.)– Fluctuating value of the dollar– The fact that basis continued to weaken while the futures rallied
suggests that the fundamentals are not that positive
• Funds influence market swings (not all bad, take advantage of opportunities)– When I find it difficult to explain a market move based on underlying
fundamentals, I view it as likely a technical over reaction
Grain Market Considerations
• Sell on rallies– If you cant stand the thought that it may go up significantly
more on a weather or economic rally, consider options strategies (sometimes costly)
• If you can “weather the storm” the long term ag commodity outlook is bright (global demand will grow, and at times supplies will be tight, resulting in 2007 style price runups

• Thank You
• Questions or Discussion !!!!
Recommended


![British Columbia Labour Market Outlook 2010 - 2020 · Labour Market OutlookLabour Market Outlook British Columbia Labour Market Outlook: 2010-2020 [2] B.C. Labour Market Outlook,](https://img.dokumen.tips/doc/110x75/5e167e8e481eae63a43f8127/british-columbia-labour-market-outlook-2010-2020-labour-market-outlooklabour-market.jpg)