Embed Size (px)
Citation preview

International Sugar Organization
Quarterly Market Outlook
February 2016
ISO
MECAS(16)02

Copyright © 2016 by International Sugar Organization All rights reserved. This publication may not be reproduced, distributed or transmitted in print or electronically without prior written permission of the publisher except for the use of brief quotations making reference to the International Sugar Organization. For permission requests please contact us using the details below.
International Sugar Organization 1 Canada Square Canary Wharf London E14 5AA Tel: +44 (0)20 7513 1144 Fax: +44 (0)20 7513 1146 Email: [email protected] [email protected]
ISSN 1994-4969 Quarterly Market Outlook
FEBRUARY 2016

QUARTERLY MARKET OUTLOOK FEBRUARY 2016 Sugar Global deficit in 2015/16 estimated higher at 5.0 mln tonnes World output to decrease by 4.3 mln tonnes World consumption to grow by 1.75% or 3.0 mln tonnes Tight trade balance World sugar stocks to reduce but consumption/stocks ratio is still “comfortable” World prices under bearish pressure from non-sugar factors despite a constructive fundamental picture Special Focus – How are food and beverage companies responding to the sugar backlash? Sector steps up efforts to self-regulate amid threat of anti-sugar policies and taxation Trend towards “healthier” products and smaller servings gains momentum Commodity Prices Ample supply, struggling emerging economies and a strong US dollar continue to weigh on prices Oil price plunges below USD30/barrel in mid-January Agricultural prices fall for the seventh consecutive quarter World Bank downgrades price outlook for 80% of the world’s major commodities World Fuel Ethanol Global output to rise only marginally No production gains in US, Brazil and the EU Brazil’s consumption forecast down in 2016… …and US offtake to stagnate Global trade to contract in 2016 Bioplastics and Biochemicals Global bioplastics production capacity to more than triple by 2019 Expansion to be driven by trend towards bio-based packaging Cogeneration Brazil’s biomass power generation grows 9% in 2015 to 22,593 GWh… …but spot electricity prices in key demand centres fall to regulated floor in January India’s cogeneration capacity expands to 4,550 MW Alternative Sweeteners US HFCS offtake to contract further New stevia sweetener gains EU approval PureCircle boasts 18 different stevia products Thaumatin gains EU approval in wide range of applications Molasses Lower production and availability in key Asian exporters Molasses losing competitiveness against grains in livestock feed Key Asian buyers unlikely to import more WTO Update Nairobi Ministerial Meeting clinches a deal on agricultural export subsidies RTAs TPP formally signed after October deal Both EU and US want TTIP deal EU-Canada trade deal still awaits ratification

Contents i-iii Executive Brief 1 World Sugar Market 1 World Balance 2 Supply 2 Production 9 Export Availability 11 Demand 11 Consumption 12 Import Demand 14 Brief(16)01 – Trade Balance for Raw and White Sugar 15 World Market Events and Prices 18 Currency Movements 20 Domestic Markets and Prices 23 Special Focus 23 How are food and beverage companies responding to the sugar backlash? 27 Commodity Prices 29 World Fuel Ethanol 29 Overview 29 Production 32 Consumption 34 Ethanol Trade 35 Prices 39 Bioplastics and Biochemicals 40 Cogeneration 42 Alternative Sweeteners 42 High Fructose Corn Syrup 45 Intensive Sweeteners 46 Molasses 49 WTO Update 50 Regional Trade Agreements 51 World Sugar Balance Estimates The views expressed in this document are those of the ISO Secretariat. They do not necessarily represent the views of the ISO Members.
International Sugar Organization One Canada Square Canary Wharf London E14 5AA General Enquiries: +44 (0) 20 7513 1144 Publications: +44 (0) 20 7715 9436 E-mail: [email protected] Web: www.isosugar.org Contributors: Mr. Sergey Gudoshnikov Senior Economist Mr. Lindsay Jolly Senior Economist Mr. Guilherme Kfouri Senior Economist Editor: Mr. José Orive
Quarterly Market Outlook February 2016

Quarterly Market Outlook Executive Summary
i
EXECUTIVE BRIEF 23 February 2016
World Sugar Market World market prices have shown a downswing since our previous Quarterly Market Outlook in November, despite expectations for the world sugar balance to return to a deficit in 2015/16 after five seasons of surplus. The downward drift of prices can be mainly attributed to generally weak commodity markets and in particular the recent collapse of oil prices to 12-year lows. On February 19th, the spot price for raw sugar (the ISA Daily Price) was as low as 12.65 cents/lb, the lowest since end September 2015. Spot white sugar prices (the ISO White Sugar Price Index) remained more resilient to the pressure of macroeconomic factors and kept rising through the last quarter of 2015 and January 2016. In mid-January, the Index was as high as USD424.15/tonne (19.24 cents/lb), the highest daily price since November 2014. However, in February the index suffered a significant downward correction and on February 19th was as low as USD367.65/tonne (16.68 cents/lb).
In this issue we make our second revision of the world sugar balance for the 2015/16 crop cycle (October/September) which has strengthened our general view of the global supply/demand situation. The ISO has now increased the projected global statistical deficit to 5.018 mln tonnes as against 3.527 mln tonnes forecast in November. World production is put at 166.833 mln tonnes, down 4.347 mln tonnes or 2.54% from 2014/15. Although 2015/16 is expected to be the third consecutive season of shrinking global output, for the first time since 2008/09 the production fall is so pronounced as to exceed 4 mln tonnes. World consumption is projected to grow by 1.75% to 171.180 mln tonnes. The anticipated growth rate is lower than the 10-year average of 2.01%. The deceleration in growth is projected on the back of ongoing macroeconomic concerns including a slowdown in emerging market economies and the collapse of oil prices. Despite a decrease in sugar output, world export availability is expected to rise from 55.430 mln tonnes in the previous crop cycle to 56.749 mln tonnes. We suggest that world exports may increase mostly due to releases of exporters’ stocks while production in exporting countries is likely to remain flat. A higher global deficit is likely to trigger additional import demand. The world total is put at 56.759 mln tonnes. Thus, the trade balance is very tight and might result in an actual deficit if there are unforeseen production shortfalls. A statistical deficit of the projected magnitude is likely to reduce the stocks-to-consumption ratio in 2015/16 by a significant 3.79 percentage points, to 46.87%. It remains, however, well above a seemingly critical level of 40% seen in 2009/10, which coincided with a surge in world market values. A larger than previously expected global deficit indicates a fundamental move towards a reduction in global stocks which are still overhanging the market. However, world market prices have come under bearish pressure from non-sugar factors despite a constructive fundamental picture. Nevertheless, a statistical deficit is clearly supportive for world prices and ceteris paribus the latter can be expected to trend generally higher in the remaining months of 2015/16. A summary of the third assessment of the world sugar balance in 2015/16 is provided in the table below.
World Sugar Balance (mln tonnes, tel quel)
2015/16 2014/15
Change in mln tonnes in %
Production 166.833 171.180 -4.347 -2.54 Consumption 171.851 168.894 2.957 1.75
Surplus/Deficit -5.018 2.286 Import demand 56.759 55.450 1.309 2.36
Export availability 56.749 55.430 1.319 2.38 End Stocks 80.552 85.560 -5.008 -5.85
Stocks/Consumption ratio in % 46.87 50.66
Export and import figures may not match due to rounding and time lags between exports and imports

Quarterly Market Outlook Executive Summary
ii
Currency Movements The US dollar rose 10% in 2015 versus a basket of key currencies as investors braced for higher interest rates in the world’s largest economy. Meanwhile, most currencies of emerging economies saw sharp devaluations due to slow economic growth prospects and plunging commodity prices. Domestic Markets and Prices Most wholesale domestic sugar prices monitored by the ISO saw increases between January 2015 and January 2016, despite an 8% decrease in the ISA price for the same period. In local currencies, wholesale prices in Brazil and Mexico rallied substantially, gaining 64% and 33%, respectively. Indian prices also saw a big jump (16%), followed by smaller increases in China (11%) and Russia (4%). Special Focus – How are food and beverage companies responding to the sugar backlash? As the backlash against sugar continues to gain momentum, the threat of government regulation and taxation are issues that the food and beverage industry clearly must address. In this Special Focus, we look at the achievements and commitments made by seven of the biggest food and beverage companies globally (Coca-Cola, Danone, Kellogg, Mondelez, Nestle, PepsiCo and Unilever) to self-regulate and adapt to new public guidelines on health and emerging consumer demands. The analysis shows the focus remains on reducing sugars in soft drinks (especially in the fizzy category) and snacks. It also shows that diversification – be it into new product categories or smaller portions – are all looming larger within companies’ strategies. Commodity Prices Commodity prices continue to slide in recent months, led by another plunge in crude oil prices to less than USD30/barrel in mid-January. Most markets are still operating under a bearish scenario of abundant supplies, weak demand and a strong USD. Cocoa and sugar were the only commodities to post gains in 2015 of 10% and 5%, respectively. Fuel Ethanol Tumbling crude oil prices have squeezed margins for biofuels makers while throwing question marks over government subsidies to renewable fuels. Even so, output continued to grow steadily through 2015 and is seen to increase marginally in 2016. This is because most of global demand is still supported by legislative programs which guarantee pockets of consumption and price floors for producers even as gasoline retail prices reach new lows. Additionally, there is new appetite for ethanol in China and India which helps to push global production higher this year. World fuel ethanol production is forecast to increase by 0.8% to reach 98.4 bln litres in 2016. Global fuel ethanol consumption is forecast to consolidate at 98.0 bln litres in 2016 while fuel ethanol trade is anticipated to contract. Bioplastics and Biochemicals Global bioplastics production capacity is set to grow from 1.7 mln tonnes in 2014 to around 7.8 mln tonnes in 2019, according to the latest set of forecasts released by industry association European Bioplastics last November. Cogeneration In Brazil, biomass-based power plants delivered 22,593 GWh to the national electricity grid in 2015, up 9% from 2014. Despite higher supply, biomass-based projects amassed only 52 MW in capacity contracted through planned public auctions. This represents the third-lowest performance for the sector since 2004. Spot prices also plunged to their regulated floor in recent months, dealing a blow to the sector. In India, 132 MW of bio-power capacity was added to the grid so far in fiscal 2015/16 (April/March). This brings total commissioned capacity to 4,550 MW. Alternative Sweeteners In the globe’s dominant HFCS market – the US – a further contraction in consumption is anticipated in 2016. Production is also forecast to fall, in part reflecting reduced industry capacity and a lacklustre outlook for exports to Mexico. In the world of stevia sweeteners another steviol glycoside (Rebaudioside M) has been declared safe by EU authorities. PureCircle reported strong revenue growth, noting the company now has 18 different stevia products. Competitor company GLG Lifetch Corp has announced it will utilise new

Quarterly Market Outlook Executive Summary
iii
technology to tackle bitterness in stevia and monkfruit sweeteners. EU authorities have also given approval for the use of thaumatin – a protein sweetener – in a wide range of food and beverage applications. Molasses Prices are anticipated to remain flat for much of 2016 with prospects of lower production and availability in key exporters coinciding with flat to lower demand in key importers. The squeeze on export supplies from Asia due to diversion of molasses to fuel ethanol production should not abate whilst in importing countries molasses will likely continue to lose competitiveness in compound livestock feed rations. WTO Trade ministers clinched a deal to eliminate agricultural export subsidies at the WTO Ministerial Conference in Nairobi. Ministers also agreed a series of other deliverables on agricultural trade and least developed country issues. Regional Trade Agreements Over a year after negotiations were concluded for an EU-Canada trade deal, the prospects and timing for ratification remain unclear. After a trade deal was struck last October, the Trans-Pacific Partnership (TPP) was signed by ministers from 12 nations in New Zealand on February 4th. Whilst the signing ceremony is another step towards the TPP becoming a reality, the trade pact continues to face opposition. The EU Trade Commissioner has stressed that one of the key areas for progress this year is the Transatlantic Trade and Investment Partnership (TTIP).

Quarterly Market Outlook World Sugar Market
International Sugar Organization 1 MECAS(16)02
9
12
15
18
21
24
27
120
130
140
150
160
170
180
USD
cen
ts/lb
mln
tonn
es, t
el q
uel
Fig. A1 World production, consumption and ISA prices
Production Consumption ISA price
WORLD SUGAR MARKET WORLD BALANCE • Projected world deficit in 2015/16
revised upwards to 5.0 mln tonnes • World production to decline by 4.3 mln
tonnes • Global use to grow by 3.0 mln tonnes • Tight trade balance • World sugar stocks to reduce but stocks-
to-consumption ratio still “comfortable”
In this issue of the Quarterly Market Outlook, the ISO presents its second revision of the world market balance for the 2015/16 (October/September) crop cycle. As early as May 2014, the ISO suggested the world sugar market may be in deficit in 2015/16 (October/September), ending 5 years of consecutive surplus. In August, the ISO expected a relatively small global deficit of 2.487 mln tonnes (the differential between world production and consumption). The first revision increased it to 3.527 mln tonnes. The second revision has strengthened our general view of the global supply/demand situation. World production is now expected to be 5.018 mln tonnes lower than world consumption. Although 2015/16 is expected to be the third consecutive season of shrinking global output; for the first time since 2008/09 the production fall is so pronounced as to exceed 4 mln tonnes (see Fig. A1). While in November a decline in global output as against 2014/15 was put at less than 2 mln tonnes, the revised projection indicates a decline
by 4.347 mln tonnes as against 2014/15. This mainly reflects a considerable downgrading of our production projections for the EU (down 898,000 tonnes), Thailand (down 650,000 tonnes), Brazil (down 590,000 tonnes) and India (down 500,000 tonnes) which is compensated only partly by improved sugar output in Russia (up 250,000 tonnes), Ukraine and the US (up 125,000 tonnes, each). Meanwhile, global consumption is expected to continue rising and reach an estimated 171.851 mln tonnes (including a 3.294 mln tonne adjustment for unknown trade). The anticipated growth rate of 1.75% is lower than the 10-year average of 2.01%. The deceleration in growth is projected on the back of ongoing macroeconomic adjustments including a slowdown in emerging market economies and the collapse of oil prices. Despite a decrease in sugar output, world export availability is expected to rise from 55.430 mln tonnes in the previous crop cycle to 56.749 mln tonnes. We suggest that world exports may increase mostly due to releases of exporters’ stocks while production in exporting countries is likely to remain flat. A higher global deficit is likely to trigger additional import demand. The world total is put at 56.759 mln tonnes compared to 55.450 mln tonnes in 2014/15. Thus, the trade balance is very tight and might result in an actual deficit if there are unforeseen production shortfalls. A statistical deficit of the projected magnitude is likely to reduce the stocks-to-consumption ratio in 2015/16 by a significant 3.79 percentage points, to 46.87%. It remains, however, well above a seemingly critical level of 40% seen in 2009/10, which coincided with a surge of world market values (see Fig. A2).

Quarterly Market Outlook World Sugar Market
International Sugar Organization 2 MECAS(16)02
SUPPLY The current October/September cycle is reaching its midpoint. The final results of the 2015/16 season are only known for some beet producers in Europe and North America, while cane sugar production has just reached its peak in the equatorial area. Next season’s cane sugar production in the Southern hemisphere, which starts in two months but is partly incorporated in our October/September balance, is the major uncertainty for the fundamental outlook of the current cycle. The ISO has revised world sugar production further downwards in 2015/16 by 2.538 mln tonnes. Despite this, export availability still remains in line with currently expected import demand.
PRODUCTION • Global output to decrease by 4.3 mln
tonnes • Smaller production in EU, India and
China ... • ... likely not compensated by higher
output in Brazil and Russia
After the second revision of the world sugar balance for 2015/16, world production is forecast at 166.833 mln tonnes, down from both our
previous forecast in November (by 2.538 mln tonnes) and estimated production in 2014/15 (by 4.347 mln tonnes). The latest adjustments have modified our view on the main supply features of 2015/16 - see Table A1. Reductions in output in the EU and India have been revised upwards to 3.972 mln tonnes and 1.700 mln tonnes, respectively (from 3.079 mln tonnes and 1.200 mln tonnes expected in November). China has replaced Ukraine as the country with the third largest production shortfall. On the credit side, growth in Brazil is put at 1.200 mln tonnes as against 1.805 mln tonnes expected in November. Russia has been added to the list of countries with key anticipated gains in production (up 0.725 mln tonnes year on year). In 2015/16, world beet sugar production is expected to decrease by 3.85 mln tonnes (mainly reflecting lower production in Western Europe and Ukraine). World cane sugar output is also projected to decrease but only by 0.5 mln tonnes from the previous season, as expected lower output in China, India and Thailand is likely to be nearly compensated by higher production in Brazil and a number of smaller producing countries. In the current season, the share of cane sugar in global production is expected to improve to 80.6% compared to 78.8% in the previous crop year (see Table A2). Production in exporting countries is expected to remain practically flat compared to the previous season (115.743 mln tonnes and 115.579 mln tonnes, respectively). In contrast to exporting countries, a significant decrease in production is projected for importing countries. Their output is put at 51.090 mln tonnes as against 55.601 mln tonnes in 2014/15.
6
12
18
24
30
35
40
45
50
55
05/0
6
06/0
7
07/0
8
08/0
9
09/1
0
10/1
1
11/1
2
12/1
3
13/1
4
14/1
5
15/1
6
ISA
pric
e (c
ents
/lb)
stoc
ks/c
onsu
mpt
ion
ratio
in %
Fig. A2 Stocks/consumption ratio and ISA prices
stocks/consumption ratio ISA price
Table A1 Main Production Falls and Rises in 2015/16 (October/September) Falls Changes from 2014/15
in mln tonnes, tel quel Rises Changes from 2014/15 in
mln tonnes, tel quel EU -3.972 Brazil +1.200 India -1.200 Russia +0.725 China -0.806
WORLD PRODUCTION IN 2015/ 16 – 166.833 mln tonnes, tel quel WORLD PRODUCTION IN 2014/ 15– 171.180 mln tonnes, tel quel

Quarterly Market Outlook World Sugar Market
International Sugar Organization 3 MECAS(16)02
1,000
1,200
1,400
1,600
1,800
12,000
14,000
16,000
18,000
20,000
1,00
0 ha
1,00
0 to
nnes
, tel
que
l
Fig. A3 EU - Sugar Production and Beet Area
Sugar Production Beet Area
`
WESTERN AND CENTRAL EUROPE After the second revision, sugar production in Western and Central Europe is forecast at 14.387 mln tonnes, down from both the previous forecast issued in November (by 0.883 mln tonnes) and estimated production in 2014/15 (by 3.987 mln tonnes).
The beet campaign is practically completed in the EU-28. The latest but not yet final official data show a considerable reduction in sugar output. According to the French Farm Ministry, beet sugar production in the bloc’s largest sugar producer is expected to reach 4.445 mln tonnes, white value, down 13.1% from a year earlier. This includes the sugar equivalent of beets sown for ethanol production, but the Ministry estimates that there will be less beet used for this purpose in 2015/16. In Germany production is expected to reduce to 2.985 mln tonnes from 4.050 mln tonnes in the previous season. In Poland the 2015/16 campaign was very short, lasting only 90 days. Sugar production will drop by about 700,000 tonnes and will not exceed 1.3 mln tonnes. In the UK, after the record crop of 1.45 mln tonnes last year, the only beet sugar processor AB Sugar contracted a smaller area for cultivation this year. This, together with a return to more typical beet yields, will see
sugar production just short of 1.0 mln tonnes. The ISO currently expects output in the bloc to decrease to 14.387 mln tonnes, down 3.977 mln tonnes or 22% from the previous season (see Fig. A3). The projected total includes about 280,000 tonnes of cane raw sugar produced in French DOM and Azores, but excludes sugar or beet thick juice used for ethanol production. The 2015/16 sugar beet campaign in Switzerland ended just after Christmas. Beet output in 2015/16 amounted to 709,000 tonnes, down 15,000 tonnes from the previous year. EASTERN EUROPE AND THE CIS From the very beginning of the beet campaign in Eastern Europe and the CIS it was apparent that the situation in Russia, the world’s largest beet sugar producer, with expectations of a high crop, differs greatly from poor prospects in the neighbouring countries. After the second revision, sugar production in the region is forecast at 7.687 mln tonnes, up from our November forecast (by 0.375 mln tonnes) and still 0.125 mln tonnes lower than estimated production in 2014/15.
In the current season, the industry in Russia achieved a new record output. As reported by the Russian Union of Sugar Manufacturers (Soyuzrossakhar), total beet sugar output in 2015/16, including desugarisation of molasses, is seen reaching 5.23 mln tonnes (see Fig. A4). This can be compared to the previous record of 5.065 mln tonnes achieved in 2011/12. Furthermore, according to the Ministry of Agriculture, in 2016 farmers aim to increase beet area by another 52,000 ha, to 1.07 mln ha and harvest 37.8 mln tonnes of sugar beet.
Table A2 World Cane and Beet Sugar Production (mln tonnes, tel quel)
1970s* 1980s* 1990s* 2000s 2013/14 2014/15e 2015/16f
a v e r a g e World production 81.9 101.8 118.4 140.2 171.4 171.18 166.83
From beet 32.6 37.9 37.4 32.0 33.8 36.24 32.39 From cane 49.3 63.9 81.0 108.2 137.6 134.94 134.44
Cane sugar as % of world total
60.2
62.8
68.4
77.2
80.3
78.8
80.6
* Raw sugar value

Quarterly Market Outlook World Sugar Market
International Sugar Organization 4 MECAS(16)02
0
0.25
0.5
0.75
1
0
1
2
3
mln
ha
mln
tonn
es, t
el q
uel
Fig. A5 Ukraine - Sugar Production and Beet Area
Sugar Production Beet Area
After a significant overproduction in 2014/15, Ukraine experienced a severe output shortfall. As reported by the State Statistical Service, harvested sugar beet area fell to 236,900 ha in 2015, which is 93,300 ha (or 28.3%) less than the year before. The beet harvest amounted to 10.725 mln tonnes, down from 15.734 mln tonnes in 2014. The average beet yield dropped to 43.37 tonnes/ha from 47.65 tonnes/ha a year earlier. As a result, sugar production decreased to 1.466 mln tonnes, down 29.6% on the year (see Fig. A5).
In the third largest sugar producer in the region, Belarus, due to a summer drought beet yields have reduced by more than 30%, which could not be compensated by a 4% increase in sugar content. The sugar beet harvest reached only 3.3 mln tonnes in 2015 as the average beet yield fell to 33.0 tonnes/ha from 46.3 tonnes/ha a year earlier. The ISO estimates output to reduce to 425,000 tonnes from 545,000 tonnes in the previous season.
NORTH AND CENTRAL AMERICA For the time being, we expect sugar output in North and Central America to improve by 251,000 tonnes or 1.2% in 2015/16 as against the previous season (21.853 mln tonnes and 21.602 mln tonnes, respectively), mainly due to production gains in the US.
In the February World Agricultural Supply and Demand Estimates (WASDE) report, the USDA forecasts US sugar production in 2015/16 at 8.849 mln short tons, raw value, up 2.3% from the previous season. If the forecast eventuates, this is the second biggest harvest in history. Cane sugar production is put at 3.839 mln tons, up from 3.756 mln tons in 2014/15, while beet sugar production is expected to grow by 117,000 tons (see Fig. A6).
The ISO still suggests no significant year-on-year change in sugar output in Mexico in 2015/16 (see Fig. A7). As of February 13th, sugar mills produced 2.410 mln tonnes, still slightly down from 2.523 mln tonnes at the same time last year. The change in the sugar extraction rate to 10.40% from 10.42% a year ago is compensated by a rise in cane yield to 78.92 tonnes/ha from 76.04 tonnes/ha. As a result, industrial yields remain marginally higher than last season (8.21 tonnes/ha and 8.15 tonnes/ha, respectively).
0
2
4
6
2008
/09
2009
/10
2010
/11
2011
/12
2012
/13
2013
/14
2014
/15
2015
/16f
mln
sho
rt to
ns, r
aw v
alue
source: USDA
Fig. A6 US - Sugar Production
Cane Sugar Beet Sugar
0.5
0.75
1
1.25
0
1
2
3
4
5
6
mln
ha
mln
tonn
es, t
el q
uel
Fig. A4 Russia - Sugar Production and Beet Area
Sugar Prodution Beet Area

Quarterly Market Outlook World Sugar Market
International Sugar Organization 5 MECAS(16)02
1.75
2.00
2.25
2.50
2.75
3.00
2007
/08
2008
/09
2009
/10
2010
/11
2011
/12
2012
/13
2013
/14
2014
/15e
2015
/16p
mln
t, te
l que
l
Fig. A8 Sugar Production in Guatemala
Last season (November/May) Guatemala‘s estimated sugar production reached a new record at 2.890 mln tonnes, an improvement from the previous season’s 2.858 mln tonnes (see Fig. A8). A further modest increase is projected for the current season attributed to growing use of high-yield cane varieties developed by the Centre for Sugar Cane Research (CENGICAÑA).
As a result of unseasonal rains following a severe drought last year, sugar production in Cuba is expected to remain flat despite earlier plans of AZCUBA to top the previous harvest. The ISO reduced its projection by 100,000 tonnes, to the level of the previous season (1.9 mln tonnes). SOUTH AMERICA
Our October/September balance cuts through two national campaigns in most of South America. It includes the tail end of the 2015/16 crush (from October to the end of crushing operations in December-January) and the first half of next 2016/17 crush (from April to September 2016). Actual 2015/16 output will therefore largely
depend on the first half of the next season’s harvest, which is still difficult to predict. Consequently, there are many uncertainties imposed by unpredictable weather patterns, developments in the world sugar and crude oil markets, currency movements, etc. At this still early stage of the season, the ISO expects the region to produce 43.537 mln tonnes in 2015/16 (October/September), a 1.880 mln tonne or 4.5% increase from the previous season.
What have been the major developments in Brazil, the world’s leading sugar producer and exporter, since our last issue of the Quarterly Market Outlook in November? Excessive rainfall continued to disrupt the cane harvest across the Centre-South region. The cane crush since the start of the 2015/16 (April/March) harvest until end-January totalled 599.9 mln tonnes, up 5.22% year on year. Mills processed 3.9 mln tonnes of cane in the second half of January and produced 97,000 tonnes of sugar, bringing the harvest total to 30.68 mln tonnes (see Table A3). This season, millers have allocated 40.87% of the sucrose content of cane to sugar production.
In the North-Northeast region, the cane crush since the start of the harvest (September/August) totaled 40.5 mln tonnes by mid-January, a drop of 2% year on year. Sugar output stood at 2.14 mln tonnes, 3% lower year on year. A dry spell in the months preceding the start of the harvest has hampered cane quality and is likely to result in a 5-10% drop in the total crush versus 2014/15 figures.
Given recent developments, the estimated ATR has been reduced to 131.50 kg/tonne of cane as against 132.5 kg/tonne expected in November while the share of cane for sugar has been reduced to 40.9% compared to earlier expected 41.5%. As a result, sugar output in the Centre South is now put at 30.7 mln tonnes, down from 31.28 mln tonnes expected in November and actual production of 31.99 mln tonnes in 2014/15. For the 2016/17 national crop year, which has to be partly incorporated into our October/September balance, the ISO expects a 12.6% increase in
Table A3 Brazil’s Centre-South Cane Harvest Cumulative results to January 31st
2015/16 2014/15 Change
Cane crush (mln tonnes) 599.873 570.111 5.22%
Sugar output (mln tonnes) 30.683 31.974 -4.04%
ATR (kg/tc) 131.35 136.64 -3.87%
0
2.5
5
7.5
mln
tonn
es, t
el q
uel
Fig. A7 Sugar Production in Mexico

Quarterly Market Outlook World Sugar Market
International Sugar Organization 6 MECAS(16)02
0
1
2
3
mln
t, te
l que
l
January/December
Fig. A10 Sugar production in Colombia
sugar output (see Fig. A9). In terms of the October/September season, the ISO forecasts output in 2015/16 at 35.0 mln tonnes, up 1.20 mln tonnes or 3.6% from the previous season. Colombia is one of the few countries producing sugar all year round. In the first nine months of 2015, sugar production remained practically unchanged from the previous season (1.800 mln tonnes and 1.817 mln tonnes, respectively). Assuming normal weather conditions in the coming seven months, production is expected to remain similar to the previous year at about 2.4 mln tonnes - see Fig. A10.
In Argentina, South America’s third largest sugar producer, output is estimated to improve to 2.1-2.2 mln tonnes in 2015 from the previous year’s 2.028 mln tonnes (see fig. A11). This year’s crop, however, may be affected by the recently announced increase in the required blend of ethanol from the current 10% to 12% which is expected to be derived exclusively from sugar cane.
MIDDLE EAST AND NORTH AFRICA No revision has been introduced for the region’s production forecast. The overall level of output in the Middle East and North Africa during 2015/16 is expected to grow by 155,000 tonnes, to 7.135 mln tonnes. Nevertheless, the region remains greatly dependent on imports. This season, domestic production is anticipated to cover less than 38.5% of the internal demand. Turkey, currently the world’s fifth largest beet sugar producer after Russia, France, the US and Germany, produced an estimated 2.245 mln tonnes of white sugar in 2014/15 (September/August), down 143,000 tonnes from the previous season. Thus, output fell short of the production quota. With a return of normal weather, production is expected to rebound to 2.35 mln tonnes in 2015/16.
In Egypt, the second largest producer in the region, the outlook suggests no considerable changes in production in 2015/16.
In Sudan, despite the opening of the new White Nile Sugar Factory in July 2012, no increase in production was seen in 2013/14 and only a marginal 50,000 tonne increase is currently estimated for 2014/15. A similar increase is projected for 2015/16. FAR EAST AND OCEANIA In 2014/15, sugar output in the Far East and Oceania showed an estimated 2.177 mln tonne decrease. After the second revision of the world sugar balance in 2015/16, output is expected to fall further by 1.026 mln tonnes on the back of lower production in China and Thailand. China produced 2.295 mln tonnes of sugar in January, down 11% from 2.575 mln tonnes in the same month of 2015, according to the China Sugar Association (CSA). This brought total sugar output
0
1
2
3
2007
2008
2009
2010
2011
2012
2013
2014
2015
e
2016
p
mln
t, te
l que
l
May/December
Fig. A11 Sugar production in Argentina
20
25
30
35
40
mln
t, te
l que
l
April/March
Fig. A9 Sugar Production in Brazil

Quarterly Market Outlook World Sugar Market
International Sugar Organization 7 MECAS(16)02
in the first four months of 2015/16 (October/September) to 4.211 mln tonnes, down from 4.786 mln tonnes in the same period a year ago. Cane sugar production fell to 3.397 mln tonnes from 4.051 mln tonnes while beet sugar output increased to 813,900 tonnes from 734,400 tonnes a year ago. Taking into account the latest campaign reports, the ISO has revised this season’s output to 9.75 mln tonnes, down 0.25 mln tonnes from our November projection and 0.806 mln tonnes from estimated production in 2014/15 (see Fig. A12).
In Thailand, the region’s largest produces and the world's second biggest sugar exporter, the total cane crush in the 2015/16 (November/October) season reached 64.814 mln tonnes by February 15th, down from 66.528 mln tonnes crushed by the same time last year. Sugar production totalled 6.201 mln tonnes, down from 6.641 mln tonnes on a year-to-year comparison. The sugar extraction rate was down at 9.91% from 10.32% a year ago. The Thai Sugar Millers Corp. expects sugar output to drop to 11.10 mln tonnes, tel quel, in the new season from 11.3 mln tonnes a year ago as drought has reduced yields. Cane output is seen remaining unchanged at 106 mln tonnes. However,
the office of the Cane and Sugar Board forecasts cane production to be limited to 100 mln tonnes, from which about 10 mln tonnes of sugar will be produced. Taking into account the latest campaign reports, the ISO has revised this season’s output to 10.850 mln, down from 11.5 mln tonnes projected in November and 11.3 mln tonnes produced in the previous season (see Fig. A13). In Australia, the Australian Bureau of Agricultural and Resource Economics and Sciences (ABARES) in December reduced its projection for sugar production (July/June) to 4.8 mln tonnes, raw value, (see Fig. A14) compared to 5.0 mln tonnes expected in August. This still represents a 5% or 228,000 tonne increase from the previous season. The increase is driven by a 3% growth in harvested area and better industrial yields. Average cane yield is assumed to fall slightly because of dry seasonal conditions and the spread of yellow canopy syndrome in some cane growing regions.
In Indonesia during the last campaign (May/December), output stabilized at a level of 2.5 mln tonnes. As projected by the Indonesian Sugar Association (AGI), in 2016 production may decline by 8% due to continuing unfavourable weather conditions. In the Philippines, sugar production in 2015/16 (September/August) in the period to January 10th reached 890,873 tonnes, raw value, down from 1.018 mln tonnes produced by the same time last year, Sugar Regulatory Administration (SRA) data show. Dry conditions due to a strong El Niño are seen pushing output below last season's 2.324 mln tonnes, tel quel (see Fig. A15). In Vietnam, according to the Ministry of Agriculture, domestic production is expected to reach 1.5 mln tonnes, a slight increase from 1.42
5
6
7
8
9
10
11
12
2008
/09
2009
/10
2010
/11
2011
/12
2012
/13
2013
/14
2014
/15
2015
/16p
mln
tonn
es, t
el q
uel
Fig. A13 Sugar Production in Thailand
2
3
4
5
6
2006
/07
2007
/08
2008
/09
2009
/10
2010
/11
2011
/12
2012
/13
2013
/14
2014
/15
2015
/16f
mln
tonn
es, r
aw v
alue
source: ABARES
Fig. A14 Sugar Production in Australia (July/June)
0
3
6
9
12
15
mln
tonn
es, t
el q
uel
Fig. A12 Sugar production in China
beet sugar cane sugar

Quarterly Market Outlook World Sugar Market
International Sugar Organization 8 MECAS(16)02
1.5
1.75
2
2.25
2.520
07/0
8
2008
/09
2009
/10
2010
/11
2011
/12
2012
/13
2013
/14
2014
/15e
2015
/16p
mln
tonn
es, t
el q
uel
Fig. A15 Sugar Production in the Philippines (September/August)
mln tonnes of cane sugar manufactured in 2014/15. INDIAN SUBCONTINENT In 2015/16, sugar production in the Indian Subcontinent is expected to decrease to 32.491 mln tonnes, down 1.189 mln tonnes or 3.5% from the previous season. India had produced 17.337 mln tonnes of sugar in the 2015/16 (October/September) season as of February 15th. This is up 0.613 mln tonnes from 16.724 mln tonnes produced by the same time last year, according to the Indian Sugar Mills Association (ISMA). In mid-February there were 472 mills crushing cane versus 516 mills that were operational at the same time in 2015. By mid-February 39 mills had already concluded crushing operations for the season. Last year only 11 mills out of a total 527 had ended crushing by the same date. In January, ISMA cut its 2015/16 sugar output estimate by a further 1.0 mln tonnes, to 26.0 mln tonnes from 27.0 mln tonnes estimated in September and an initial outlook in July of 28.0 mln tonnes. The new forecast is based on satellite images taken on January 9th. If realised, output would contract by about 2.3 mln tonnes from what was produced in the previous season. In November, the ISO downgraded its forecast for 2015/16 to 27 mln tonnes, tel quel, down by 0.745 mln tonnes from the initial forecast issued in August and down by 1.2 mln tonnes from 2014/15. Taking into account the latest projection of the industry, our production forecast has been revised further down to 26.5 mln tonnes – see Fig. A16.
In neighbouring Pakistan, production prospects have improved since our previous projection due to good weather conditions. Output in 2015/16 is therefore now seen rising to 5.325 mln tonnes, which is 125,000 tonnes higher than expected before and produced last season (see Fig. A17).
EQUATORIAL AND SOUTHERN AFRICA The ISO currently forecasts a 611,000-tonne increase in sugar production in Equatorial and Southern Africa in 2015/16 (October/September). This is mainly attributed to a considerable advance in Ethiopia’s large-scale expansion plan as well as a gradual improvement of production in South Africa with the expected return of normal weather in 2016, after two seasons of drought. The region houses a number of sugar producing nations, but only South Africa produces more than 1 mln tonnes a year. In South Africa, as reported by the South African Cane Growers Association in February, drought in
10
13
16
19
22
25
28
31
2007
/08
2008
/09
2009
/10
2010
/11
2011
/12
2012
/13
2013
/14
2014
/15
2015
/16f
mln
tonn
es, t
el q
uel
Fig. A16 Sugar Production in India
2
3
4
5
6
2007
/08
2008
/09
2009
/10
2010
/11
2011
/12
2012
/13
2013
/14
2014
/15e
2015
/16f
Fig. A17 Pakistan: Sugar Production (mln mtrv)

Quarterly Market Outlook World Sugar Market
International Sugar Organization 9 MECAS(16)02
0
5,000
10,000
15,000
20,000
25,000
30,000
Fig. A19 Sugar export availability in 2015/16 by countries of origin (1,000 tonnes, tel quel)
the main cane-producing region of KwaZulu-Natal cut sugar production in 2015 to 1.53 mln tonnes, against 2.11 mln tonnes a year earlier (see Fig. A18). The 12-month total rainfall in 2014/15 (November/October) was nearly 30% short of the long term average. The new crushing campaign will start in March. The rainy season, now under way, is so far better than last year. Assuming some recovery of output in the 2016 crush, the ISO expects October/September output to improve to 1.85 mln tonnes as against the estimated 1.55 mln tonnes in 2014/15.
In Swaziland, the region’s second largest producer, output during the first nine months of the 2015 campaign (April-January) was slightly higher year on year (695,409 tonnes and 688,541 tonne, respectively). However, cane growers are anticipating a 10% decline in yields due to the prevailing drought. Reservoirs had nearly dried up and ground water levels have drastically fallen in several regions, especially in the Lowveld where a large swathe of both small and large scale cane farmers are situated.
In Ethiopia, a large-scale expansion project has been facing delays due to financial constraints, lack of infrastructure and capacity of construction companies. Thus, none of the newly-erected plants had completed the trial phase in 2014/15. However, the new Kessem Factory has recently finished the trial phase and is expected to become fully operational in February 2016. Two more mills are expected to come into operation in the near future. The Omo Kuraz project incorporates five sugar factories and is part of the 10 sugar factories planned to be constructed across the country in the coming five years. If during the coming season three new mills reach only half of planned capacity for the first phase, national annual output may exceed 625,000 tonnes and the country may become a sugar net-exporter.
EXPORT AVAILABILITY
• Global export availability to improve • Large increases in projected exports by
India and Thailand The second revision of export availability for 2015/16 suggests that world exports may increase as against the level achieved in the previous season due to releases of stocks rather than higher production. Indeed, their nominal export availability of net-exporting countries (the differential between production and domestic use) is projected to grow by only 91,000 tonnes, but we expect exporters to release up to 1.7 mln tonnes from stocks. A new total is 56.749 mln tonnes, compared to 54.430 mln tonnes estimated for the previous season.
The main change on the export map in 2015/16 (October/September) compared to the previous season is a still expected large increase of export availability in India (+1.025 mln tonnes) and Thailand (+0.658 mln tonnes). Other changes are below 500,000 tonnes and counterbalance each
0
0.5
1
1.5
2
2.5
3
2009
2010
2011
2012
2013
2014
2015
f
mln
tonn
es, t
el q
uel
Fig. A18 Sugar Production in South Africa
Quarterly Market Outlook World Sugar Market
International Sugar Organization 10 MECAS(16)02
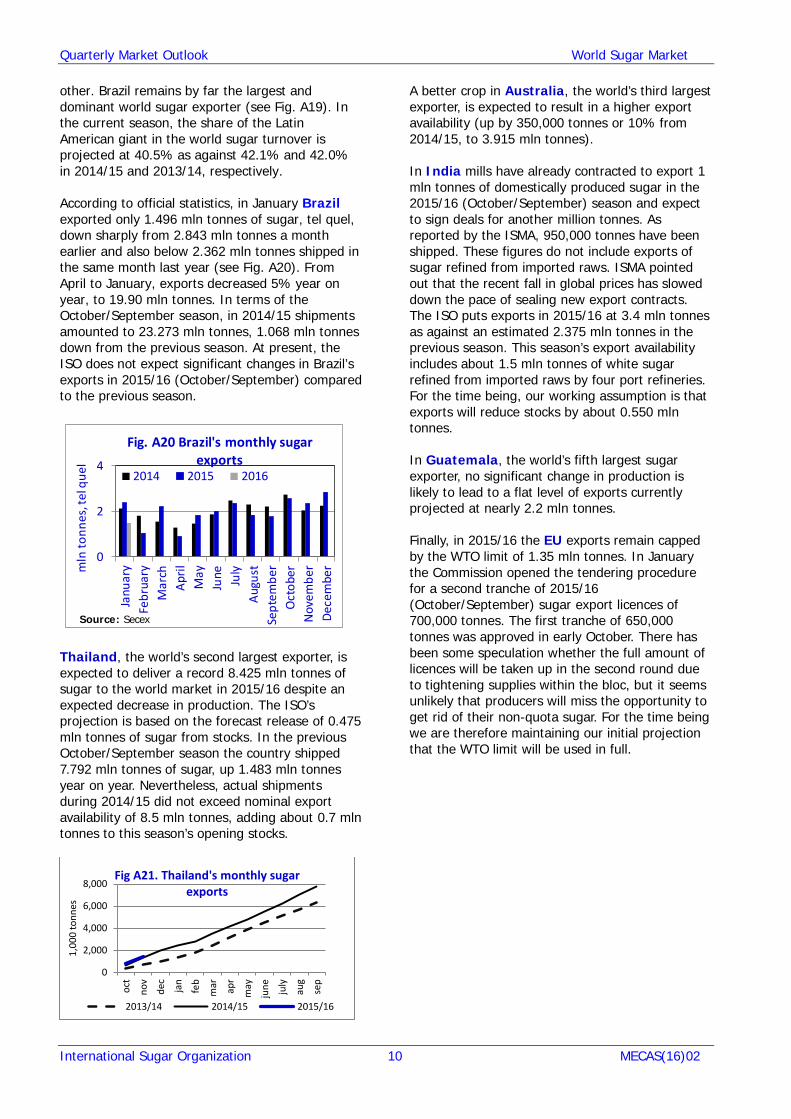
other. Brazil remains by far the largest and dominant world sugar exporter (see Fig. A19). In the current season, the share of the Latin American giant in the world sugar turnover is projected at 40.5% as against 42.1% and 42.0% in 2014/15 and 2013/14, respectively. According to official statistics, in January Brazil exported only 1.496 mln tonnes of sugar, tel quel, down sharply from 2.843 mln tonnes a month earlier and also below 2.362 mln tonnes shipped in the same month last year (see Fig. A20). From April to January, exports decreased 5% year on year, to 19.90 mln tonnes. In terms of the October/September season, in 2014/15 shipments amounted to 23.273 mln tonnes, 1.068 mln tonnes down from the previous season. At present, the ISO does not expect significant changes in Brazil’s exports in 2015/16 (October/September) compared to the previous season.
0
2
4
Janu
ary
Febr
uary
Mar
chAp
rilM
ayJu
ne July
Augu
stSe
ptem
ber
Oct
ober
Nov
embe
rDe
cem
berm
ln to
nnes
, tel
que
l
Fig. A20 Brazil's monthly sugar exports
2014 2015 2016
Source: Secex
Thailand, the world’s second largest exporter, is expected to deliver a record 8.425 mln tonnes of sugar to the world market in 2015/16 despite an expected decrease in production. The ISO’s projection is based on the forecast release of 0.475 mln tonnes of sugar from stocks. In the previous October/September season the country shipped 7.792 mln tonnes of sugar, up 1.483 mln tonnes year on year. Nevertheless, actual shipments during 2014/15 did not exceed nominal export availability of 8.5 mln tonnes, adding about 0.7 mln tonnes to this season’s opening stocks.
A better crop in Australia, the world’s third largest exporter, is expected to result in a higher export availability (up by 350,000 tonnes or 10% from 2014/15, to 3.915 mln tonnes). In India mills have already contracted to export 1 mln tonnes of domestically produced sugar in the 2015/16 (October/September) season and expect to sign deals for another million tonnes. As reported by the ISMA, 950,000 tonnes have been shipped. These figures do not include exports of sugar refined from imported raws. ISMA pointed out that the recent fall in global prices has slowed down the pace of sealing new export contracts. The ISO puts exports in 2015/16 at 3.4 mln tonnes as against an estimated 2.375 mln tonnes in the previous season. This season’s export availability includes about 1.5 mln tonnes of white sugar refined from imported raws by four port refineries. For the time being, our working assumption is that exports will reduce stocks by about 0.550 mln tonnes. In Guatemala, the world’s fifth largest sugar exporter, no significant change in production is likely to lead to a flat level of exports currently projected at nearly 2.2 mln tonnes. Finally, in 2015/16 the EU exports remain capped by the WTO limit of 1.35 mln tonnes. In January the Commission opened the tendering procedure for a second tranche of 2015/16 (October/September) sugar export licences of 700,000 tonnes. The first tranche of 650,000 tonnes was approved in early October. There has been some speculation whether the full amount of licences will be taken up in the second round due to tightening supplies within the bloc, but it seems unlikely that producers will miss the opportunity to get rid of their non-quota sugar. For the time being we are therefore maintaining our initial projection that the WTO limit will be used in full.
0
2,000
4,000
6,000
8,000
oct
nov
dec
jan
feb
mar ap
r
may
june july
aug
sep
1,00
0 to
nnes
Fig A21. Thailand's monthly sugar exports
2013/14 2014/15 2015/16

Quarterly Market Outlook World Sugar Market
International Sugar Organization 11 MECAS(16)02
Table A4 Geographical Distribution of World Sugar Consumption 2015/16 .2014/15 2013/14 2012/13 2011/12 2010/11 Total consumption (in 1,000 tonnes, tel quel) Western and Central Europe 19,047 18,912 18,739 18,678 18,951 18,348
Eastern Europe and CIS 10,349 10,210 10,119 10,280 10,261 10,298 North America 15,775 15,685 15,679 15,510 15,051 14,843
Central America 3,553 3,476 3,389 3,298 3,216 3,152
South America 19,862 19,850 19,851 19,601 19,369 19,440
Middle East and North Africa 18,526 17,964 17,384 17,649 17,041 15,947
Far East and Oceania 37,922 36,969 36,003 34,848 33,593 32,150
Indian Subcontinent 33,348 32,640 31,576 30,031 29,527 27,488
Equatorial and Southern Africa 10,176 9,895 9,324 9,532 8,545 8,245
WORLD 171,851 168,894 165,357 164,384 158,034 153,254
Annual growth rate in% 10-year average
Western and Central Europe 0.71 0.92 0.33 -1.44 3.29 1.04 Eastern Europe and CIS 1.36 0.90 -1.57 0.19 -0.36 -0.79 North America 0.57 0.04 1.09 3.05 1.40 1.10 Central America 2.22 2.57 2.76 2.55 2.03 1.60 South America 0.06 -0.01 1.28 1.20 -0.37 1.58 Middle East and North Africa 3.13 3.34 -1.50 3.57 6.86 2.58
Far East and Oceania 2.58 2.68 3.31 3.74 4.49 3.18 Indian Subcontinent 2.17 3.37 5.14 1.71 7.42 3.28 Equatorial and Southern Africa 2.84 6.12 -2.18 11.55 3.64 3.78 WORLD 1.75 2.14 0.59 4.02 3.12 2.01
DEMAND Economic and population growths are the key drivers of global sugar consumption. Global economic growth remained below trend in the first three quarters of 2015. The moderation of economic growth in China has weakened economic performance in many emerging markets. However, the IMF’s latest World Economic Outlook (WEO) published in January foresees higher global growth in 2016 compared to last year. Thus, according to the IMF, global growth is currently estimated at 3.1% in 2015 and projected at 3.4% in 2016 and 3.6% in 2017. Meanwhile, global population is currently growing on average by 1.18% annually. After the second revision of the world sugar balance in 2015/16, the ISO anticipates global use of sugar to grow by 1.75%, up 2.957 mln tonnes from the previous season. It also shows an increase in global import demand after two seasons of contraction on the back of lower domestic production in importing countries. (source: UN Department of Economic and Social Affairs, Population Division - World Population Prospects, the 2015 Revision).
CONSUMPTION • World consumption to grow by
1.75% in 2015/16 • Slower growth on the back of
ongoing macroeconomic concerns
Global sugar consumption in 2015/16 is put at 171.85 mln tonnes, raw value, up 1.75% from the previous year. The world total includes a 3.293 mln tonne adjustment for unknown trade. Since November, we have revised our consumption projection for only ten countries, mainly based on statistical updates of consumption figures for previous seasons. The anticipated growth rate is lower than the 10-year average of 2.01% (see Table A4). The deceleration in growth is projected on the back of ongoing macroeconomic concerns including a slowdown in emerging market economies and the collapse of oil prices. For example, the ISO expects Brazil’ sugar consumption to decrease by 1% for the second consecutive season, on the back of rising unemployment and a weak macroeconomic performance. For the time being a possible negative impact of recipes’ reformulations declared by some food manufacturing transnationals (see Special Focus) is not factored into the ISO forecast.

Quarterly Market Outlook World Sugar Market
International Sugar Organization 12 MECAS(16)02
Table A5 Importing Countries: Nominal Deficit, Import Demand and Changes in Stocks
(in mln tonnes, tel quel)
2011/12 2012/13 2013/14 2014/15e 2015/16f Production 59.735 54.881 54.913 55.415 51.683 Consumption 94.832 93.069 94.250 96.113 98.200 Nominal Deficit 35.097 38.188 39.337 40.698 46.517
Imports 48.473 50.428 50.448 48.041 49.821 Exports 8.721 8.670 8.090 6.119 6.100 Changes in Stocks +4.655 +3.570 +3.064 +1.224 -2.796
At present, the highest growth rate of consumption in 2015/16 is projected for M iddle East and North Africa (3.13%), Equatorial and Southern Africa (2.84%) and Far East and Oceania (2.58%). These three regions are currently responsible for 61% of world sugar use. The Indian subcontinent and Central America show very similar annual rates of growth (2.17% and 2.22%, respectively), which are also slightly higher than the world average. In these two regions 27% of the world total is consumed. Reflecting an expected slowing in sugar use in Brazil, annual growth rate for South America is projected to be as small as 0.06% this season, and is estimated to be negative (-0.01%) in 2014/15. In the saturated markets of the remaining three regions with per capita consumption higher than the world average, annual growth in sugar use is significantly below the world average. In Eastern Europe and CIS the growth rate is expected to show a slight recovery from -1.57% in 2013/14 to 0.90% in 2014/15 and further to this season’s 1.36%. In Western and Central Europe and NAFTA it is expected to grow by only 0.74% and 0.57%, respectively. IMPORT DEMAND
• World import demand to rise • China’s appetite for imports to stay
buoyant
In the current crop year, consumption in importing countries is expected to grow by 2.087 mln tonnes while production is forecast to decrease by 3.732 mln tonnes, leaving importing countries with a 5.819 mln tonne growth in their combined deficit. However, a significant part of the gap between consumption and production in importing countries is still expected to be covered from stocks. As shown in Table A5, between 2011/12 and 2014/15, importers purchased an implied 12.5 mln tonnes to replenish stocks (at least in statistical terms). The ISO expects that in 2015/16 nearly 2.8 mln tonnes may be released from stocks in importing countries. Moreover, as we have identified from the very beginning of the season, the higher global deficit forecast is likely to trigger additional import demand too. Our third assessment of the world sugar balance in 2015/16 shows global import
demand at 56.759 mln tonnes as against 55.450 mln tonnes in the previous season. For the fifth consecutive season, China is expected to remain the world's largest sugar importer with 4.575 mln tonnes of sugar forecast to enter the country in 2015/16 compared to the last season’s 4.775 mln tonnes. The country imported 290,000 tonnes of sugar in January, down 25.1% from the same month a year ago. This brought total imports in the first four months of the 2015/16 (October/September) season to 1.417 mln tonnes, raw value, compared with 1.478 mln tonnes imported during the same period last season. It has to be noted, that the amount of sugar entering the country may be considerably higher than officially reported imports. According to Thai and Indian exporters, up to 1.5 mln tonnes have been contracted for Myanmar as a destination, from where sugar is likely to be smuggled into China.
For the time being, the EU is projected to regain its position as the world’s second largest importer in 2015/16. The bloc’s imports are put at 3.975 mln tonnes in the current season as against an estimated 3.025 mln tonnes in 2014/15. A 950,000-tonne increase is expected on the back of lower domestic production.
0
1,000
2,000
3,000
4,000
5,000
Oct
ober
Nov
embe
r
Dec
embe
r
Janu
ary
Febr
uary
Mar
ch
Apr
il
May
June
July
Aug
ust
Sep
tem
ber
source: China's customs statistics, as reported by FO Licht
Fig. A22 Sugar Imports by China (in 1,000 mtrv)
2013/14 2014/15 2015/16

Quarterly Market Outlook World Sugar Market
International Sugar Organization 13 MECAS(16)02
Indonesia, the world’s third largest sugar importer, is seen importing 3.950 mln tonnes of sugar in 2015/16, up from 3.740 mln a year earlier. Domestic consumption is on the rise due to economic and population growth, while domestic production is expected to drop somewhat due to continuing unfavourable weather conditions. By contrast, the US is not expected to import more in 2015/16. Higher domestic production reduces annual import demand to 2.650 mln tonnes, assuming a 195,000 tonne reduction in ending stocks. The February WASDE report puts sugar imports in the current marketing year at 3.162 mln short tons, raw value, including 1.540 mln short tons imported from Mexico. In 2014/15, the US imported an estimated 3.553 mln short tons, including 1.532 mln tonnes from Mexico in line with the suspension agreement. For the second consecutive season, Bangladesh is expected to remain the world’s fifth largest sugar importer. Domestic production is stable at the level of about 100,000 tonnes, while consumption is growing by nearly 7% a year and forecast to exceed 2 mln tonnes in 2015/16. The ISO puts this season’s import demand as high as 2.089 mln tonnes of mainly raw sugar.

Quarterly Market Outlook World Sugar Market
International Sugar Organization 14 MECAS(16)02
Brief(16)01 TRADE BALANCE FOR RAW AND WHITE SUGAR
In this Brief we provide our third assessment of the sugar trade balance by raw sugar and white sugar segments in 2015/16. In 2015/16, world total export availability is projected to reach 56.749 mln tonnes. Growth is expected to come from both higher output and releases of stocks in exporting countries. A higher nominal deficit forecast for importing countries will likely result in increased import demand. The ISO projects world total import demand at 56.759 mln tonnes, up 1.309 mln tonnes, or 2.36% from 2014/15. In a nutshell, we are still expecting tightly balanced import demand and export availability in 2015/16. Despite an increase of the projected world statistical deficit from about 3.5 mln tonnes in November to more than 5.0 mln tonnes, it seems possible to cover production shortfalls by stocks accumulated during several seasons of global surplus. It may be noted, however, that the second revision of the world trade balance shows a nominal global trade deficit (the difference between anticipated levels of imports and exports) of 10,000 tonnes. Obviously, in global terms the gap of this magnitude still allows us to qualify the world trade as fairly balanced. Nevertheless, it is also obvious, that the trade balance is very tight and might result in an actual deficit if there are some currently unforeseen production shortfalls. It can be stressed that the white sugar segment looks more vulnerable, as the forecast trade balance is already showing a small deficit (-291,000 tonnes), while the raw sugar segment remains in a small surplus (+281,000 tonnes). Raw sugar export availability is expected to increase by 1.462 mln tonnes from the previous season, to 35.979 mln tonnes (see Fig. A23). The main changes for individual countries include a better availability due to larger crops in Thailand, Brazil and Australia (+983,000 tonnes, +430,000 tonnes, and +350,000 tonnes, respectively) on the one hand. High white sugar premium and falling world prices for raw sugar are expected to reduce raw sugar exports from India (-425,000 tonnes). Smaller exports are also projected for South Africa (-265,000 tonnes). Import demand for raw sugar is also expected to surge by 1.225 mln tonnes to 35.698 mln tonnes. The main year-on-year changes include higher demand by Iran (+770,000 tonnes), and Iraq (+300,000 tonnes). The ISO also expects that the currently high white sugar premium is likely to bring additional import demand for raws by refineries in the MENA region with an overall increase in the region’s imports by nearly 1.3 mln tonnes. On the other hand, we expect a 300,000 tonne drop in raw sugar purchases by the US while Russia’s imports are expected to more than halve to 225,000 tonnes compared to 550,000 in 2014/15. Global white sugar export availability is forecast to reduce only slightly from the estimated 20.913 mln tonnes in 2014/15 to 20.770 mln tonnes. The largest year-on-year changes are a projected increase in availability of white sugar from India (+1.450 mln tonnes), but a likely reduction in deliveries from Brazil (-700,000 tonnes), Thailand (-325,000 tonnes), and South Africa (-242,000 tonnes). Meanwhile, import demand for white sugar is also forecast to remain nearly flat at 21.061 mln tonnes compared to 20.978 mln tonnes estimated for 2014/15. The most significant individual country year-on-year changes include an increase in projected imports by the EU (+670,000 tonnes), while lower white sugar purchases are projected for a number of importers with port refineries, including Nigeria, Iraq and Iran, due to a high white sugar premium.
Individual country estimates for 2013/14-2015/16 are given in the “Trade Balance for Raw and White Sugar” on pages 60 to 62.
05,000
10,00015,00020,00025,00030,00035,00040,000
white sugar exports raw sugar exports
Fig. A23 Raw and White Sugar Exports, 2011/12-2015/16 (in 1,000 tonnes)
2011/12
2012/13
2013/14
2014/15e
2015/16f
Quarterly Market Outlook World Sugar Market
International Sugar Organization 15 MECAS(16)02
WORLD MARKET EVENTS AND PRICES • Short-lived price recovery in November
followed by downward drift • Stronger nominal white sugar premium • Will global fundamentals provide
support to the market in 2015/16?
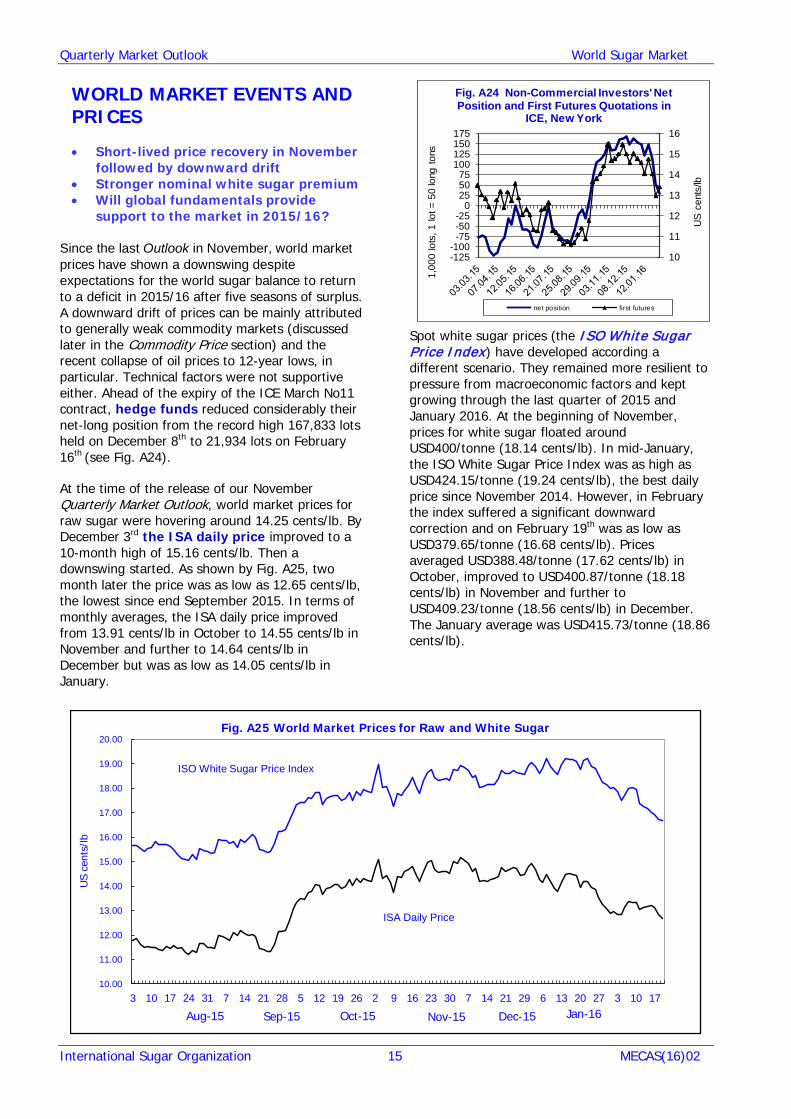
Since the last Outlook in November, world market prices have shown a downswing despite expectations for the world sugar balance to return to a deficit in 2015/16 after five seasons of surplus. A downward drift of prices can be mainly attributed to generally weak commodity markets (discussed later in the Commodity Price section) and the recent collapse of oil prices to 12-year lows, in particular. Technical factors were not supportive either. Ahead of the expiry of the ICE March No11 contract, hedge funds reduced considerably their net-long position from the record high 167,833 lots held on December 8th to 21,934 lots on February 16th (see Fig. A24). At the time of the release of our November Quarterly Market Outlook, world market prices for raw sugar were hovering around 14.25 cents/lb. By December 3rd the ISA daily price improved to a 10-month high of 15.16 cents/lb. Then a downswing started. As shown by Fig. A25, two month later the price was as low as 12.65 cents/lb, the lowest since end September 2015. In terms of monthly averages, the ISA daily price improved from 13.91 cents/lb in October to 14.55 cents/lb in November and further to 14.64 cents/lb in December but was as low as 14.05 cents/lb in January.
Spot white sugar prices (the ISO White Sugar Price Index) have developed according a different scenario. They remained more resilient to pressure from macroeconomic factors and kept growing through the last quarter of 2015 and January 2016. At the beginning of November, prices for white sugar floated around USD400/tonne (18.14 cents/lb). In mid-January, the ISO White Sugar Price Index was as high as USD424.15/tonne (19.24 cents/lb), the best daily price since November 2014. However, in February the index suffered a significant downward correction and on February 19th was as low as USD379.65/tonne (16.68 cents/lb). Prices averaged USD388.48/tonne (17.62 cents/lb) in October, improved to USD400.87/tonne (18.18 cents/lb) in November and further to USD409.23/tonne (18.56 cents/lb) in December. The January average was USD415.73/tonne (18.86 cents/lb).
10.00
11.00
12.00
13.00
14.00
15.00
16.00
17.00
18.00
19.00
20.00
3 10 17 24 31 7 14 21 28 5 12 19 26 2 9 16 23 30 7 14 21 29 6 13 20 27 3 10 17
US
cent
s/lb
Fig. A25 World Market Prices for Raw and White Sugar
ISO White Sugar Price Index
ISA Daily Price
Jan-16 Dec-15 Oct-15 Nov-15 Aug-15 Sep-15
10
11
12
13
14
15
16
-125-100
-75-50-25
0255075
100125150175
US
cen
ts/lb
1,00
0 lo
ts, 1
lot =
50
long
tons
Fig. A24 Non-Commercial Investors' Net Position and First Futures Quotations in
ICE, New York
net position first futures

Quarterly Market Outlook World Sugar Market
International Sugar Organization 16 MECAS(16)02
As illustrated by Fig. A26, the nominal white sugar premium (the differential between the ISO White Sugar Price Index and the ISA daily price) continued its surge during the period under review. In January it rose to USD106.04/tonne as against USD86.42/tonne in December. In the recent past, a premium higher than USD100/tonne has lasted from six to nine months. Sooner or later, a high white sugar premium will have a knock-on effect on the raw sugar market. Refiners will be encouraged to raise the supply of white sugar which boosts demand for raw sugar. For the time being, taking into consideration a projected trade deficit in the white sugar segment discussed in Brief(16)01, a significant reduction in the white sugar premium does not look imminent.
How can our current understanding of fundamentals (an apparent statistical deficit and very tight trade balance, accompanied by a significant decrease in the global stocks/consumption ratio) be interpreted in terms of future market values? A larger than previously expected global deficit indicates a fundamental move towards a reduction in global stocks still overhanging the market. In November, the ISO cautioned that the move could be accelerated if crops in major Asian producers including China, India and Thailand came in below the initial expectations. This looks to be the case, but world market prices have come under growing bearish pressure from non-sugar factors despite a constructive fundamental picture. Nevertheless, a statistical deficit is clearly supportive for world prices and ceteris paribus the latter can be expected to trend generally higher in the remaining months of 2015/16. Table A6 summarizes estimates of world sugar production and consumption in 2015/16 released to date by leading sugar analysts. Sugar spot prices and price differentials are given in Tables A7 and A8.
Table A6 World Sugar Production and Consumption
2015/16 (mln mtrv) Production Consumption Surplus/
deficit Czarnikow (c) 16-Jun 186.03 187.72** -1.69 ABARES (b) 16-Jun 182.60 184.70 -2.10 USDA (c) 16-Jun 173.41 173.41* -3.75 ISO (b)*** 20-Aug 170.91 173.40 -2.49 ABARES (b) 16-Sep 182.00 184.70 -2.70 Czarnikow (c) 29-Sep 183.20 187.30** -4.10 F.O. Licht (b) 27-Oct 181.72 179.12 -5.20 ISO (b)*** 3-Nov 169.37 172.90 -3.53 ABARES (b) 8-Dec 178.00 183.80 -5.80 Czarnikow (c) 17-Dec 178.92 186.11** -8.19 F.O. Licht (b) 5-Feb 176.91 181.66* -6.49 ISO (b)*** 22-Feb 166.83 171.85 -5.02 # October/September (b)=balance; (c)=individual crop years aggregated * excluding unrecorded disappearance ** including 1 mln tonne allowance for unrecorded disappearance
*** tel quel basis
40
50
60
70
80
90
100
110
2013
2014
2015
2016
USD
/ton
ne
Fig. A26 Nominal White Sugar Premuim (monthly averages)

Quarterly Market Outlook World Sugar Market
International Sugar Organization 17 MECAS(16)02
Table A7 DAILY SPOT PRICES AND SELECTED ECONOMIC INDICATORS
ISA DP ISO White Sugar Price Index
White Sugar Differential Indicators
USD cents/lb % UN Index (1) SDR/USD
2011 26.01 31.29 5.28 20 137 0.6330 2012 21.54 26.35 4.81 22 124 0.6525 2013 17.69 22.14 4.45 25 131 0.6582 2014 17.00 20.18 3.18 19 131 0.6573 2015 13.43 16.93 3.50 26
2013 Nov 17.68 21.38 3.70 21 0.6534 Dec 16.55 20.39 3.84 23 0.6500
2014 Jan 15.63 19.25 3.62 23 0.6526 Feb 16.61 20.63 4.02 24 0.6495 Mar 17.90 21.40 3.50 20 0.6402 Apr 17.61 21.24 3.63 21 0.6459 May 18.27 21.68 3.41 19 0.6464 June 18.17 21.60 3.43 19 0.6489 July 18.26 20.78 2.52 14 0.6488 Aug 17.22 19.85 2.63 15 0.6552 Sep 16.02 19.12 3.10 19 0.6671 Oct 16.75 19.44 2.69 16 0.6728 Nov 16.19 19.08 2.89 18 0.6817
Dec 15.33 18.05 2.72 18 0.6864 2015 Jan 15.34 18.04 2.70 18 0.7093
Feb 14.59 17.43 2.84 19 0.7080 Mar 13.16 16.55 3.39 26 0.7220 Apr 13.08 16.66 3.58 27 0.7226 May 13.43 16.57 3.14 23 0.7120 June 12.46 15.97 3.51 28 0.7119 July 12.77 16.27 3.50 27 0.7163 Aug 11.50 15.47
3.97 35 0.7131
Sep 11.86 15.82 3.96 33 0.7111 Oct 13.91 17.62 3.71 27 0.7112 Nov 14.55 18.18 3.63 25 0.7234 Dec 14.64 18.56 3.92 27 0.7214
2016 Jan 14.05 18.86 4.81 34 0.7237
(1) USD unit values of manufactured goods exports, 2000=100
Table A8 FREE MARKET HIGHEST AND LOWEST DAILY SPOT PRICES IN 2012-2016
(USD cents/lb) ISA Daily Price ISO White Sugar Price Index 2012 2013 2014 2015 2016 2012 2013 2014 2015 2016
Jan 23.56 18.89 15.63 15.34 14.05 28.15 22.92 19.25 18.04 18.86 Feb 24.12 18.28 16.61 14.59 28.80 22.64 20.63 17.43 Mar 24.10 18.46 17.90 13.16 28.95 23.50 21.40 16.55 Apr 22.75 17.80 17.61 13.08 27.36 22.72 21.24 16.66 May 20.81 17.62 18.27 13.34 25.18 21.87 21.68 16.57 June 20.47 17.09 18.17 12.64 25.90 21.91 21.60 15.97 July 22.88 16.84 18.26 12.77 28.17 21.66 20.78 16.27 Aug 20.88 17.03 17.22 11.50 25.80 21.98 19.85 15.47 Sep 19.99 17.40 16.02 11.86 25.43 22.01 19.12 15.82 Oct 20.31 18.66 16.75 13.91 25.30 22.68 19.44 17.62 Nov 19.34 17.68 16.19 14.55 23.67 21.38 19.08 18.18 Dec 19.31 16.55 15.33 14.64 23.52 20.39 18.05 18.56
Annual averages 21.54 17.69 17.00 13.43 26.35 22.14 20.18 16.93 Daily quotations
Highest 25.53 19.78 18.90 16.15 29.92 24.08 22.45 19.05
Lowest 18.68 16.05 14.90 11.19 22.82 19.83 17.64 15.06

Quarterly Market Outlook World Sugar Market
International Sugar Organization 18 MECAS(16)02
CURRENCY MOVEMENTS • US dollar rises 10% in 2015 as
Federal Reserve hikes interest rates • Most currencies still under pressure
from loose monetary policies, tumbling commodity prices and weak global economic growth
The US dollar (USD) closed 2015 with substantial gains versus a basket of key currencies as investors braced for higher interest rates in the world’s largest economy. The US nominal broad dollar index as published by the Federal Reserve rose 10% through 2015 to a 12-year high of over 122 in December (see Fig. A27). The index continued to rise in January, moving upwards of 125. Most of the 10% increase seen last year took place ahead of the US central bank’s decision to raise benchmark interest rates for the first time since 2004 at its December meeting. In contrast, a growing number of central banks, including the European Central Bank and the Bank of Japan, have implemented negative interest rates on deposits to try and stimulate spending. In most developing countries, a sharp drop in commodity prices – chiefly crude oil – and large capital outflows due to concerns over global economic growth have put sustained pressure on currencies. These include the Argentinean Peso (ARS), which depreciated 34.6% in 2015, the Brazilian Real (BRL, -33.59%), the South African Rand (ZAR, -26.15%), the Turkish Lira (TRY, -21.4%) and the Russian Ruble (RUB, -16.73%).
Exporters The BRL was the worst performing currency of 2015 among key sugar exporters, shedding more than 30% of its value against the USD (see Table A9) as the country continues to struggle with a severe economic recession and surging inflation. Investment bank SocGen said in January that the BRL/USD could soon be heading to 4.25 if Brazil’s
economy fails to improve. The BRL/USD hit a record low of 4.14 in September 2015, the lowest level since the currency was introduced in 1994. In a recent presentation, US agricultural giant Bunge noted that the weaker BRL has lowered the estimated ex-factory sugar production cost in Brazil from 18.00 cents/lb in the last season to around 12 cents/lb in the current season. In a separate presentation, consultancy LMC International pegged Brazil’s current full cost of production (including fobbing expenses) between 10 and 12 cents/lb. All estimates were based on a BRL/USD exchange rate of 4. A weaker BRL has also given a significant boost to the profitability of the Brazilian sugar industry, with the ISA price jumping 41% in BRL terms from January 2015 to January 2016 (see Fig. A28). Across other exporting countries, the ISA price rose 13% in Mexican Pesos (MXN), 5% in Australian dollars (AUD), 1% in Thai Bahts (THB), but fell 1% in Indian Rupees (INR) and 8% in Guatemalan Quetzales (GTQ).
Table A9: USD in currency units of major exporters
Brazil Thailand Australia Mexico Guatemala Jan-15 2.63 32.75 1.24 14.69 7.63 Feb-15 2.80 32.57 1.28 14.92 7.65 Mar-15 3.12 32.65 1.29 15.23 7.63 Apr-15 3.06 32.52 1.29 15.22 7.68 May-15 3.05 33.56 1.27 15.26 7.70 Jun-15 3.12 33.73 1.29 15.48 7.66 Jul-15 3.21 34.34 1.35 15.96 7.65 Aug-15 3.50 35.43 1.37 16.54 7.65 Sep-15 3.89 36.02 1.42 16.85 7.69 Oct-15 3.89 35.73 1.39 16.57 7.69 Nov-15 3.78 35.79 1.40 16.64 7.65 Dec-15 3.87 36.01 1.38 17.07 7.61 Jan-16 4.05 36.15 1.42 18.06 7.65
BRL
GTQ
AUD
THB
INR
MXN
USD
-20% 0% 20% 40% 60%
Fig. A28: ISA price variation in currencies of selected exporting countries
(Jan-15 to Jan-16)
80
90
100
110
120
130
2003
2004
2005
2006
2007
2008
2009
2010
2011
2012
2013
2014
2015
2016
Source: Federal Reserve
Fig. A27: US Nominal Broad Dollar Index(January 1997=100)

Quarterly Market Outlook World Sugar Market
International Sugar Organization 19 MECAS(16)02
Importers While the ISA price fell 8% in USD terms between January 2015 and January 2016, most sugar importing countries saw the benefits of this drop eroded by local weaker currencies (see Table A10). In South Korea, Indonesia and Iran, ISA sugar prices rose 1% when expressed in local currencies (See Fig. A29). Countries in the Euro zone saw a 3% decrease, while China experienced a 5% drop.
Import costs & Export revenues
Table A11: ISA price in net-exporters' currencies*
(c/lb) USD BRL INR THB AUD GTQ MXN
Jan-15 15.34 40.40 953.16 502.35 18.98 117.11 225.31
Feb-15 14.59 40.92 904.99 475.19 18.73 111.56 217.74
Mar-15 13.16 41.05 821.84 429.61 17.02 100.38 200.40
Apr-15 13.08 40.00 820.81 425.31 16.90 100.49 199.06
May-15 13.34 40.71 851.23 447.70 16.88 102.71 203.63
Jun-15 12.46 38.82 795.70 420.30 16.13 95.39 192.92
Jul-15 12.77 41.05 812.76 438.50 17.22 97.68 203.86
Aug-15 11.50 40.28 748.33 407.42 15.77 87.96 190.20
Sep-15 11.83 46.03 783.03 426.17 16.76 90.98 199.35
Oct-15 13.91 54.05 905.20 496.97 19.31 106.93 230.50
Nov-15 14.55 55.07 961.03 520.67 20.36 111.35 242.17
Dec-15 14.64 56.64 974.96 527.15 20.20 111.48 249.86
Jan-16 14.05 56.84 945.47 507.96 20.02 107.51 253.80
Jan-15/ Jan-16 change
-8% 41% -1% 1% 5% -8% 13%
Table A12: ISA price in net-importers' currencies*
(c/lb) USD EUR CNY IDR KRW IRR MYR
Jan-15 15.34 13.23 95.41 193,022 16,704 419,881 55.04
Feb-15 14.59 12.86 91.21 186,021 16,025 402,683 52.44
Mar-15 13.16 12.15 82.13 171,959 14,641 367,680 48.44
Apr-15 13.08 12.14 81.12 169,360 14,240 369,588 47.55
May-15 13.34 11.96 82.76 175,261 14,558 381,011 48.07
Jun-15 12.46 11.11 77.32 165,883 13,858 362,663 46.59
Jul-15 12.77 11.62 79.29 170,838 14,611 376,825 48.55
Aug-15 11.50 10.33 72.90 158,490 13,560 342,681 46.69
Sep-15 11.83 10.54 75.34 170,402 14,012 354,375 50.99
Oct-15 13.91 12.39 88.34 192,130 15,964 416,660 59.43
Nov-15 14.55 13.54 92.67 198,833 16,772 436,124 62.83
Dec-15 14.64 13.46 94.48 202,831 17,162 440,848 62.67
Jan-16 14.05 12.94 92.36 195,110 16,868 423,927 61.04
Jan-15/ Jan-16 change
-8% -2% -3% 1% 1% 1% 11%
Table A10: USD in currency units of major importers
China S. Korea Indonesia* Iran EU-19 Jan-15 6.22 1,089 12,583 27,372 0.86 Feb-15 6.25 1,098 12,750 27,600 0.88 Mar-15 6.24 1,113 13,069 27,939 0.92 Apr-15 6.20 1,089 12,948 28,256 0.93 May-15 6.20 1,093 13,138 28,562 0.90 Jun-15 6.21 1,112 13,313 29,106 0.89 Jul-15 6.21 1,144 13,378 29,509 0.91 Aug-15 6.34 1,179 13,782 29,798 0.90 Sep-15 6.37 1,184 14,404 29,957 0.89 Oct-15 6.35 1,148 13,812 29,954 0.88 Nov-15 6.37 1,153 13,665 29,974 0.93 Dec-15 6.45 1,172 13,855 30,113 0.92 Jan-16 6.57 1,201 13,887 30,173 0.93
IDR
IRR
KRW
EUR
CNY
USD
-10% -5% 0% 5%
Fig A29: ISA price variation in currencies of selected importing countries
(Jan-15 to Jan-16)

Quarterly Market Outlook World Sugar Market
International Sugar Organization 20 MECAS(16)02
DOMESTIC MARKETS AND PRICES • Domestic sugar prices rally in Brazil and
Mexico • India and China also experience marked
increases Most domestic sugar prices monitored by the ISO rose between January 2015 and January 2016, despite an 8% decrease in the ISA price for the same period (see Fig. A30). In local currency units (LCU), wholesale prices in Brazil and Mexico rallied substantially, up by 64% and 33%, respectively (see Fig. A31). India also saw a big jump (16%), followed by smaller increases in China (11%) and Russia (4%). Prices remained largely stable in the EU, while falling by 11% in the US. In USD terms, swings were more moderate. Prices rose in Brazil (7%), China (5%), India (8%) and Mexico (8%); and declined in the EU (-5%), Russia (-13%) and the US (-11%). In January 2016, wholesale domestic prices were the highest in China (USD816.26/tonne) and the lowest in Brazil (USD413.22/tonne) when monthly averages are compared. In China, prices remained firmly above the USD800/tonne mark for the fifth straight month. The high premium carried by China’s domestic sugar price over London white sugar futures continued to make the country an attractive destination. After freight and taxes are accounted for, margins of more than USD200/tonne for cargoes attracting a 15% in-quota import tariff can be achieved. According to
trade estimates, between 0.5 mln and 1 mln tonnes of white sugar could be smuggled into the country through its borders with Myanmar and Vietnam. In a separate statement, the Indian Sugar Mills Association recognized that most of its exports of white sugar to Myanmar were likely to end up in China. In LCU, China’s domestic sugar prices averaged CNY5,378.90/tonne in January, slightly lower than the CNY5,482.74/tonne recorded in December. December’s price was the highest on average since January 2013, according
Brazil
China
EU
IndiaISA price
Mexico Russia
US
USD 200
USD 300
USD 400
USD 500
USD 600
USD 700
USD 800
USD 900
USD 1,000
Jan-
2015
Feb-
2015
Mar
-201
5
Apr-2
015
May
-201
5
Jun-
2015
Jul-2
015
Aug-
2015
Sep-
2015
Oct
-201
5
Nov
-201
5
Dec-
2015
Jan-
2016
(ton
ne)
Fig. A30: USD-denominated sugar prices in key domestic markets
7%
5%
-5%
8%
8%
-13%
64%
11%
0%
16%
-8%
33%
4%
-11%
-30%
-20%
-10% 0% 10%
20%
30%
40%
50%
60%
70%
Brazil
China
EU
India
ISA price
Mexico
Russia
US
Fig. A31 : Domestic price changes in USD and LCU
(Jan 2015-Jan 2016)
Local currencyunits (LCU)
US Dollar (USD)
*EU: Jan15-Nov 15

Quarterly Market Outlook World Sugar Market
International Sugar Organization 21 MECAS(16)02
to data compiled by the ISO. China’s domestic prices began to rise at the start of 2014/15 as the government reduced the minimum price paid for cane, causing a sizeable drop in planting intentions. Combined with adverse weather, production so far in 2015/16 has lagged 12% that of last season’s. US refined beet sugar prices stood at USD705.48/tonne in January, just behind China. Prices in the US have been stable since November after a gradual downward trend seen through most of 2015. In fact, in January 2015, US prices were the highest among all those monitored by the ISO. In February, the USDA revised down its outlook for domestic sugar supplies following lower imports and poorer output. Imports for the season 2015/16 were projected at nearly 2.8 mln tonnes. The stronger pace of imports for direct consumption (rather than refining) reflect a pick-up in deliveries from Mexico and the continuing weakness in US beet sugar deliveries to consumers. These are down nearly 10% year on year. US sugar imports are expected by the USDA at 3.162 mln tonnes for 2015/16, down from 2014/15’s 3.553 mln tonnes, but still accounting for attractive refining margins as gauged by the gap between domestic (ICE No16) and world (ICE No11) raw sugar prices (See Fig. A32).
Put together, the USDA projections result in a decrease in 2015/16’s ending stocks-to-use ratio to 12.8%, down from 14.4% in both 2014/15 and 2013/14. In neigboring Mexico, domestic sugar prices for the estandar quality sustained a gradual fall between September and January in LCU terms and October and January in USD terms. However,
prices remained markedly higher when compared to the previous periods one year ago. In January, estandar sugar averaged MXN11,217.71/tonne, up by nearly a third from the MXN8,455.49/tonne the same month of 2015. When expressed in USD, prices stood at USD622.29/tonne in January, up from USD574.77/tonne one year before. For the current 2015/16 season, the government set the sugar reference price at MXN8,130.65/tonne, up from MXN7,099.83/tonne. The reference price is used to calculate cane payments to growers. Last year, the Mexican government announced that domestic sugar consumption increased to 4.408 mln tonnes in 2014/15 from 4.098 mln tonnes a year earlier despite the introduction of tax on soft drinks. Russia’s January domestic sugar price was the fourth highest within the countries monitored by the ISO. It stood at an average of USD589.52/tonne, the lowest since February 2009. However, in local currency terms, prices surged to RUB46,130.18/tonne, surpassing a previous all-time high of RUB44,545.77/tonne set in January 2015. Better prices sent Rusagro’s revenue in the sugar business up by 46% in 2015 to RUB32.9 bln. Total sugar sales also went up from 752,275 tonnes in 2014 to 783,809 tonnes in 2015. In the EU, sugar prices rose slightly in November (last month for which data is available) to EUR423/tonne according to the European Commission (see Table A13). This is EUR6/tonne above the previous month but still EUR26/tonne below November 2014. The reported EU white sugar price bottomed out at EUR414/tonne in June 2015, the weakest level since records began in 2006. In January, Associated British Foods (ABF) said the end of the downturn to EU prices would have no material impact on its operations because it is supplying customers with deals done at lower levels. Nonetheless, ABF said there is increasing evidence that sugar prices will be governed by stability ahead of EU quota removals in 2017. Meanwhile, rival Südzucker said in January it expects operating losses of EUR60 mln to EUR80 mln in its sugar segment.
Table A13: Prices in the EU EUR/tonne USD/tonne
Nov-2014 449 560 Dec-2014 435 536 Jan-2015 423 490 Feb-2015 414 470 Mar-2015 419 454 Apr-2015 417 449 May-2015 419 467 Jun-2015 414 464 Jul-2015 415 456
10
15
20
25
30
35
40
45
Jul-1
1
Dec
-11
May
-12
Oct
-12
Mar
-13
Aug
-13
Jan-
14
Jun-
14
Nov
-14
Apr
-15
Sep-
15
Feb-
16
USD
cen
ts/l
b
Fig. A32: ICE No16 & ICE No11 contracts
ICE No16
ICE No11

Quarterly Market Outlook World Sugar Market
International Sugar Organization 22 MECAS(16)02
Aug-2015 419 467 Sep-2015 425 477 Oct-2015 417 468 Nov-2015 423 455
Source: European Commission
In India, domestic sugar prices averaged INR31,970/tonne in January, a level not seen since April 2014. Prices escalated 20% since November on a combination of downward revisions to the 2015/16 harvest and measures announced by the government to draw down stocks. While rising domestic prices have been helping mills clear arrears with farmers, export deals have been running below the government’s 4-mln tonne target. This is because mills are reluctant to sell sugar to the world market at a discount to the domestic market. In USD terms, Indian wholesale white sugar prices averaged USD475.43/tonne in January, the highest level since mid-to-late 2014. This compares with a January average of USD415.73/tonne for the White Sugar Price Index. Fig. A33 shows that the gap between NCDEX and London No5 front-month white sugar futures has widened significantly in previous months, discouraging mills from exporting.
USD 300
USD 320
USD 340
USD 360
USD 380
USD 400
USD 420
USD 440
USD 460
USD 480
USD 500
Apr-
15
May
-15
Jun-
15
Jul-
15
Aug-
15
Sep-
15
Oct
-15
Nov
-15
Dec
-15
Jan-
16
Feb-
16
(ton
ne)
Fig. A33: NCDEX and London No5 front-month futures
London No5 NCDEX
Earlier this year, ISMA said the average sugar production costs in India (including the cost of finance) was between INR33,000/tonne (21.74 USD cents/lb) and INR35,000/tonne (23.06 USD cents/lb). Lastly, Brazil’s average crystal sugar price surged to a record level of BRL1,674.90/tonne in January. When inflation is factored in, prices had not been this high since November 2011. A rally began in
October 2015 due to a delayed Centre-South cane crush and the continuing weakness in the BRL/USD exchange rate, which boosted the incentive for exports. In USD terms, prices averaged USD413.22/tonne in January, the lowest among domestic markets monitored by the ISO. Despite a sharp price rebound, Brazilian mills will end the 2015/16 season with a projected debt of BRL95 bln, 18% higher than in 2014/15, according to Itau BBA. This is because many milling groups hold USD-denominated debt, which soared with a weaker BRL. The sector’s debt now exceeds its revenue, estimated by Unica at BRL85 bln for 2015/16. Additionally, a record high number of mills had to file for bankruptcy protection in 2015, according to Valor Economico. A total of 13 companies sought court protection from creditors versus a six-year average of 11. Combined, they hold bank debts close to BRL8 bln. Since 2008, 79 mills have filed for bankruptcy protection. The 2015 list includes Shree Renuka, Abengoa, Tonon Bioenergy and Unialco. *Sources for price data: Brazil: Cepea/Esalq (Crystal Sugar 99.7° pol, colour 130-180 ICUMSA Units); China: Zhengzhou Commodity Exchange (ZCE) white sugar front-month futures; EU: white sugar reference price as reported by the European Commission; India: National Commodity & Derivatives Exchange Limited (NCDEX) M200 sugar front-month futures; Mexico: estandar sugar prices as reported by the Sistema Nacional de Información e Integración de Mercados (SNIIM); Russia: ISCO white sugar price index; US: refined beet sugar price as reported by the USDA.
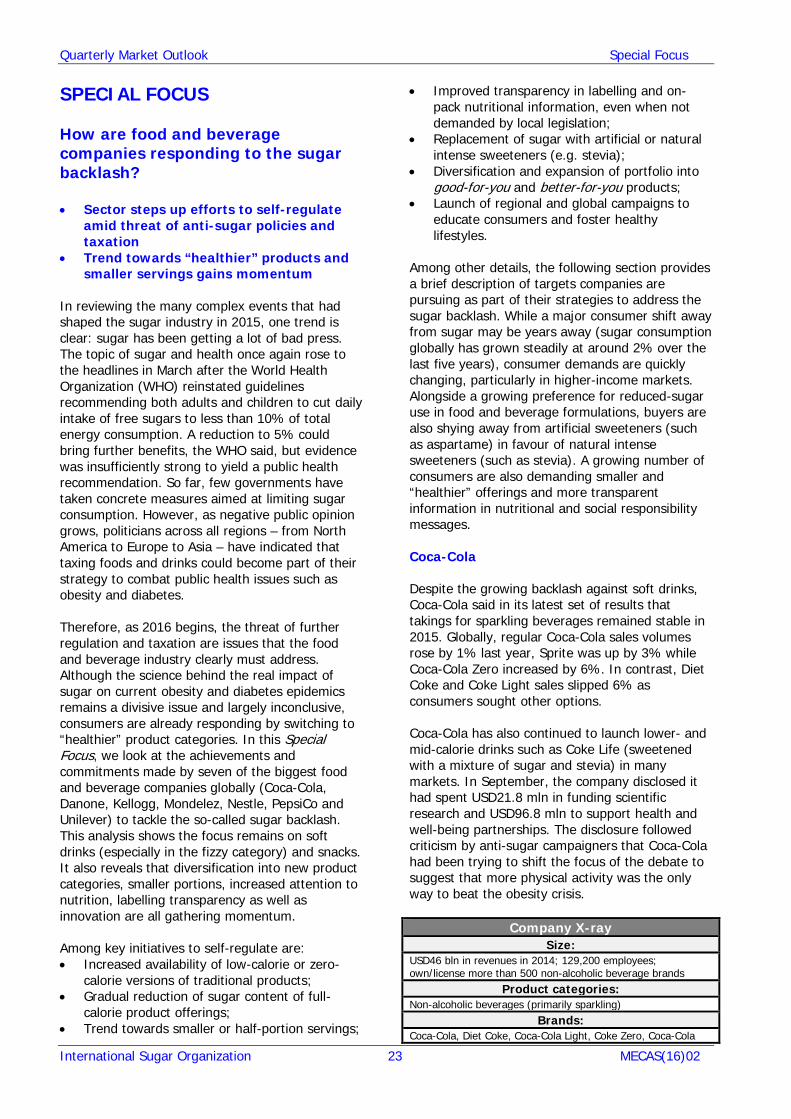
Quarterly Market Outlook Special Focus
International Sugar Organization 23 MECAS(16)02
SPECIAL FOCUS How are food and beverage companies responding to the sugar backlash? • Sector steps up efforts to self-regulate
amid threat of anti-sugar policies and taxation
• Trend towards “healthier” products and smaller servings gains momentum
In reviewing the many complex events that had shaped the sugar industry in 2015, one trend is clear: sugar has been getting a lot of bad press. The topic of sugar and health once again rose to the headlines in March after the World Health Organization (WHO) reinstated guidelines recommending both adults and children to cut daily intake of free sugars to less than 10% of total energy consumption. A reduction to 5% could bring further benefits, the WHO said, but evidence was insufficiently strong to yield a public health recommendation. So far, few governments have taken concrete measures aimed at limiting sugar consumption. However, as negative public opinion grows, politicians across all regions – from North America to Europe to Asia – have indicated that taxing foods and drinks could become part of their strategy to combat public health issues such as obesity and diabetes. Therefore, as 2016 begins, the threat of further regulation and taxation are issues that the food and beverage industry clearly must address. Although the science behind the real impact of sugar on current obesity and diabetes epidemics remains a divisive issue and largely inconclusive, consumers are already responding by switching to “healthier” product categories. In this Special Focus, we look at the achievements and commitments made by seven of the biggest food and beverage companies globally (Coca-Cola, Danone, Kellogg, Mondelez, Nestle, PepsiCo and Unilever) to tackle the so-called sugar backlash. This analysis shows the focus remains on soft drinks (especially in the fizzy category) and snacks. It also reveals that diversification into new product categories, smaller portions, increased attention to nutrition, labelling transparency as well as innovation are all gathering momentum. Among key initiatives to self-regulate are: • Increased availability of low-calorie or zero-
calorie versions of traditional products; • Gradual reduction of sugar content of full-
calorie product offerings; • Trend towards smaller or half-portion servings;
• Improved transparency in labelling and on-pack nutritional information, even when not demanded by local legislation;
• Replacement of sugar with artificial or natural intense sweeteners (e.g. stevia);
• Diversification and expansion of portfolio into good-for-you and better-for-you products;
• Launch of regional and global campaigns to educate consumers and foster healthy lifestyles.
Among other details, the following section provides a brief description of targets companies are pursuing as part of their strategies to address the sugar backlash. While a major consumer shift away from sugar may be years away (sugar consumption globally has grown steadily at around 2% over the last five years), consumer demands are quickly changing, particularly in higher-income markets. Alongside a growing preference for reduced-sugar use in food and beverage formulations, buyers are also shying away from artificial sweeteners (such as aspartame) in favour of natural intense sweeteners (such as stevia). A growing number of consumers are also demanding smaller and “healthier” offerings and more transparent information in nutritional and social responsibility messages. Coca-Cola Despite the growing backlash against soft drinks, Coca-Cola said in its latest set of results that takings for sparkling beverages remained stable in 2015. Globally, regular Coca-Cola sales volumes rose by 1% last year, Sprite was up by 3% while Coca-Cola Zero increased by 6%. In contrast, Diet Coke and Coke Light sales slipped 6% as consumers sought other options. Coca-Cola has also continued to launch lower- and mid-calorie drinks such as Coke Life (sweetened with a mixture of sugar and stevia) in many markets. In September, the company disclosed it had spent USD21.8 mln in funding scientific research and USD96.8 mln to support health and well-being partnerships. The disclosure followed criticism by anti-sugar campaigners that Coca-Cola had been trying to shift the focus of the debate to suggest that more physical activity was the only way to beat the obesity crisis.
Company X-ray Size:
USD46 bln in revenues in 2014; 129,200 employees; own/license more than 500 non-alcoholic beverage brands
Product categories: Non-alcoholic beverages (primarily sparkling)
Brands: Coca-Cola, Diet Coke, Coca-Cola Light, Coke Zero, Coca-Cola

Quarterly Market Outlook Special Focus
International Sugar Organization 24 MECAS(16)02
Life; Fanta; Sprite, Nestea, Minute Maid, Schweppes, Bonaqua Achievements:
• Introduction of 400 new beverage options in 2014; of which more than 100 are reduced, low- or no-calorie
• Expansion in 2014 portfolio of beverages available in small packages in 81 countries
• Introduction of Coca Cola Life (sweetened with a mixture of sugar and stevia) in more markets
• Launch in 2014 of transparency website about research, initiatives and programs supported by the company
Targets: • Timeline: 2020
o Offer low- or no-calorie beverage options in every market
o Provide transparent nutrition information featuring calories on all packages
o Support physical activity programs o Market responsibly, including no advertising directly
to children under 12 anywhere in the world Danone Danone has reduced sugar in a handful of products over recent years. In 2014, it committed to slash the sugar content of its best-selling children’s product (Danimals) by 25% by 2016. The company also pledged to reduce the total sugar content of 70% of its products to 23g or less per 170g servings and invest USD3 mln in nutrition education and research related to healthy eating habits.
Company X-ray Size:
USD21 bln in revenues in 2014; 101,558 employees Product categories:
Fresh dairy products; early life nutrition; waters; medical nutrition
Brands: Activia; Danonino; Oikos; Actimel; Danette
Achievements: • 75% of offerings for infants and young children contain no
added sugar • Decrease in added sugar in the Growing Up Milks segment
from 12,600 tonnes in 2008 to 8,600 tonnes in 2014 • In Europe, this equates to a reduction of 6.5 mln
teaspoons of sugar • In the UK, reduction of 15% of added sugars in Actimel,
allowing the product to be advertised to children • 95 % of Danone’s Aquadrinks have less than 8g of
sugar/100 ml and 87% are already at or below 5g /100 ml • 99% of sales have nutritional on-pack information • 30% of products were improved in 2014 to meet higher
nutritional standards, including reduced sugar Targets:
Danone aims “to give consumers products which not only taste good, but whose superior nutritional profiles do them good.” Danone’s Food, Nutritional & Health Charter: • Offer solutions tailored to nutritional needs &
recommendations, tastes, and incomes • Develop products with relevant, scientifically proven health
benefits • Inform consumers clearly and factually and advertise
responsibly • Promote healthy diets and lifestyles • Address major health and nutrition-related societal
challenges Kellogg Even though breakfast cereals have been singled out by anti-sugar campaigners as a key contributor to sugary diets, a UK National Dietary Survey showed that cereals in fact contribute just 7% of extrinsic dietary sugars. Despite that, Kellogg said it had already reduced sugar content in top-selling US kids’ cereals by 20 to 30% in recent years. In the UK and across Europe, Kellogg has since 2010 reduced sugar content in product offerings by 30% in Bran Flakes; 10% in Special K flakes and 16% in Coco Pops Rocks. The company said more reductions are planned for 2016. In its own research, Kellogg concluded that reducing sugar content in cereals or snack bars has a minimum impact on calorie content as carbohydrates coming from starch remain a key contributor1. It said that, for example, 30g Frosties (11g sugar) contains the same calories (113kcal/bowl) as a bowl of Corn Flakes (2.4g sugar).
Company X-ray Size:
USD14.6 bln in net sales in 2014; 33,000 employees Product categories:
Ready-to-eat cereal and convenience food such as warm breakfast, bars, crackers, beverages and fruit flavoured snacks
Brands: Kellogg’s Corn Flakes, Frosties, Froot Loops, Mueslix, Rice Krispies, Nutri-Grains
Achievements: • Percentage of cereals with or less than 10g of sugar per
30g servings increased from 77% in 2007 to 84% in 2014 • 70% of products launched since 2007 fall under the low to
medium sugar category • In 2015, 168 tonnes of sugar were removed from UK diets
through reformulation of adult cereals Targets:
• Timeline: 2016 o Pledge to cut 723 tonnes of sugar across all its
cereals in 2016 o Improve front-of-pack labelling with objective, fact-
and science-based information in a visible format • Timeline: 2020
o Increase percentage of cereals with or less than 10g of sugar per 30g servings to 90%
o Increase nutrition education and active lifestyle communications by 50%
Mondelez Mondelez is targeting goals set by the WHO to reduce salt and saturated fat consumption, while managing caloric and sugar intake. In March 2014, Mondelez launched its Mindful Snacking initiative
1 https://www.kelloggsnutrition.com/en_UK/knowledge/ featured/reducing_sugar.html
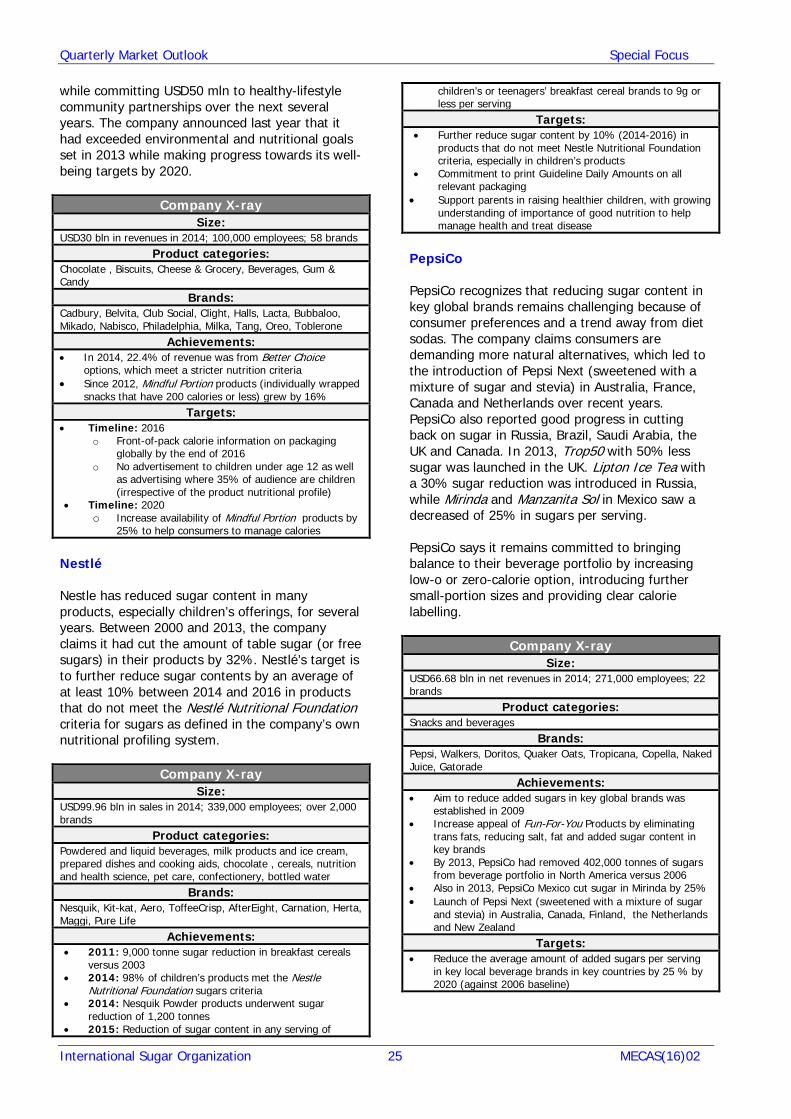
Quarterly Market Outlook Special Focus
International Sugar Organization 25 MECAS(16)02
while committing USD50 mln to healthy-lifestyle community partnerships over the next several years. The company announced last year that it had exceeded environmental and nutritional goals set in 2013 while making progress towards its well-being targets by 2020.
Company X-ray Size:
USD30 bln in revenues in 2014; 100,000 employees; 58 brands Product categories:
Chocolate , Biscuits, Cheese & Grocery, Beverages, Gum & Candy
Brands: Cadbury, Belvita, Club Social, Clight, Halls, Lacta, Bubbaloo, Mikado, Nabisco, Philadelphia, Milka, Tang, Oreo, Toblerone
Achievements: • In 2014, 22.4% of revenue was from Better Choice
options, which meet a stricter nutrition criteria • Since 2012, Mindful Portion products (individually wrapped
snacks that have 200 calories or less) grew by 16% Targets:
• Timeline: 2016 o Front-of-pack calorie information on packaging
globally by the end of 2016 o No advertisement to children under age 12 as well
as advertising where 35% of audience are children (irrespective of the product nutritional profile)
• Timeline: 2020 o Increase availability of Mindful Portion products by
25% to help consumers to manage calories Nestlé Nestle has reduced sugar content in many products, especially children’s offerings, for several years. Between 2000 and 2013, the company claims it had cut the amount of table sugar (or free sugars) in their products by 32%. Nestlé’s target is to further reduce sugar contents by an average of at least 10% between 2014 and 2016 in products that do not meet the Nestlé Nutritional Foundation criteria for sugars as defined in the company’s own nutritional profiling system.
Company X-ray Size:
USD99.96 bln in sales in 2014; 339,000 employees; over 2,000 brands
Product categories: Powdered and liquid beverages, milk products and ice cream, prepared dishes and cooking aids, chocolate , cereals, nutrition and health science, pet care, confectionery, bottled water
Brands: Nesquik, Kit-kat, Aero, ToffeeCrisp, AfterEight, Carnation, Herta, Maggi, Pure Life
Achievements: • 2011: 9,000 tonne sugar reduction in breakfast cereals
versus 2003 • 2014: 98% of children’s products met the Nestle
Nutritional Foundation sugars criteria • 2014: Nesquik Powder products underwent sugar
reduction of 1,200 tonnes • 2015: Reduction of sugar content in any serving of
children’s or teenagers’ breakfast cereal brands to 9g or less per serving
Targets: • Further reduce sugar content by 10% (2014-2016) in
products that do not meet Nestle Nutritional Foundation criteria, especially in children’s products
• Commitment to print Guideline Daily Amounts on all relevant packaging
• Support parents in raising healthier children, with growing understanding of importance of good nutrition to help manage health and treat disease
PepsiCo PepsiCo recognizes that reducing sugar content in key global brands remains challenging because of consumer preferences and a trend away from diet sodas. The company claims consumers are demanding more natural alternatives, which led to the introduction of Pepsi Next (sweetened with a mixture of sugar and stevia) in Australia, France, Canada and Netherlands over recent years. PepsiCo also reported good progress in cutting back on sugar in Russia, Brazil, Saudi Arabia, the UK and Canada. In 2013, Trop50 with 50% less sugar was launched in the UK. Lipton Ice Tea with a 30% sugar reduction was introduced in Russia, while Mirinda and Manzanita Sol in Mexico saw a decreased of 25% in sugars per serving. PepsiCo says it remains committed to bringing balance to their beverage portfolio by increasing low-o or zero-calorie option, introducing further small-portion sizes and providing clear calorie labelling.
Company X-ray Size:
USD66.68 bln in net revenues in 2014; 271,000 employees; 22 brands
Product categories: Snacks and beverages
Brands: Pepsi, Walkers, Doritos, Quaker Oats, Tropicana, Copella, Naked Juice, Gatorade
Achievements: • Aim to reduce added sugars in key global brands was
established in 2009 • Increase appeal of Fun-For-You Products by eliminating
trans fats, reducing salt, fat and added sugar content in key brands
• By 2013, PepsiCo had removed 402,000 tonnes of sugars from beverage portfolio in North America versus 2006
• Also in 2013, PepsiCo Mexico cut sugar in Mirinda by 25% • Launch of Pepsi Next (sweetened with a mixture of sugar
and stevia) in Australia, Canada, Finland, the Netherlands and New Zealand
Targets: • Reduce the average amount of added sugars per serving
in key local beverage brands in key countries by 25 % by 2020 (against 2006 baseline)

Quarterly Market Outlook Special Focus
International Sugar Organization 26 MECAS(16)02
Unilever Unilever believes energy intake from sugars should be limited in line with recommendations made by organisations such as the WHO and the American Heart Association. The company has focused its efforts on beverages and ice cream as areas with the biggest potential for sugar reduction. Among its initiatives, Unilever has pledged to reduce sugar levels in ready-to-drink tea by 25% by 2020 while doubling the proportion of products that meet their highest nutritional standards.
Company X-ray Size:
USD48.4 bln in revenues in 2014; of which 25% were from food and 19% from refreshments, 172,000 employees, over 400 brands
Product categories: Food, refreshments (ice cream), soaps, shampoos, care products
Brands: Knorr, Hellmann’s, Lipton, Magnum, Carte Dor, Ben & Jerry’s, Cornetto, Wall’s, Solero, Pot Noodle
Achievements: • Introduction in 2014 of Lipton Ice Tea Black (30% less
sugar, sweetened with stevia) • Reduction in calories in children’s ice cream brands to
110g or less per serving by 2014 • By 2015, limit 80% of packaged ice cream products to 250
kilocalories or less per portion • Reduction of sugar in many Brisk Fountain drinks • Commitment to clear, simple nutrition labelling • Restrict the marketing of food and drinks to children under
12 years old, which do not meet nutritional criteria • Do not use any materials that undermine promotion of
healthy, balanced diets and lifestyles Targets:
• Timeline: 2020 o Double the proportion of portfolio that meets
highest nutritional standards o Reduce by 25% the sugar content of ready-to-drink
teas o Increased use of non-nutritive sweeteners (e.g.
stevia) Conclusion A lot has been achieved so far by food and beverages companies globally to address public health concerns and the growing backlash against sugar. In fact, most are heavily committed to delivering on ambitious targets in the years to come, reinforcing the argument of those who believe that self-regulation can be an effective way of addressing issues of public concern. But as the sugar backlash continues to gain priority to policy makers, it will be up to the food and beverage sector to prove they have the right tools and expertise to accommodate the concerns of both consumers and regulators.

Quarterly Market Outlook Commodity Prices
International Sugar Organization 27 MECAS(16)02
COMMODITY PRICES
• Commodity prices continue to slide away from 2011 peaks
• Oil prices plunge below USD30/barrel in mid-January
• As a whole, energy prices tumbled 45% in 2015
Commodity prices extended their downward trend in recent months (see Fig. C1), led by another plunge in crude oil to less than USD30/barrel in mid-January. Most markets continued to operate under abundant supplies, weak demand and a strong USD. Cocoa and sugar were the only commodities to post gains in 2015 of 10% and 5%, respectively. Other agricultural products such as coffee and wheat saw declines of nearly 30% and 20% over the year, according to the S&P GS Commodity Index. Energy prices as a whole (including natural gas and coal) saw a 45% decrease last year. In addition to falling crude oil prices, energy markets also suffered from a mild winter in the northern hemisphere and the continuous introduction of policies to curb coal consumption in power generation.
In agriculture, El Nino-related concerns did little to boost prices on a global level. In fact, the World Bank noted in its latest Commodity Markets Outlook that agricultural prices have recorded their seventh quarter of declines in the last three months of 2015 to levels 30% below their 2011 peaks. In aggregate, non-energy commodities are now 40% below their 2011 highs. Biofuels The World Bank pointed to weak growth in biofuels production as a contributing factor to softness in agricultural prices. After several years of strong growth, demand for ethanol and biodiesel is expected to be significantly slower in the foreseeable future. At a global level, low crude oil prices could deliver a short-term boost
to transport fuel sales and a consequent increase in biofuels consumption in countries which have adopted mandated blending targets. However, the World Bank sees biofuels markets at risk of regulatory reforms as policy makers reconsider their benefits to the environment and their net contribution to energy independence. Weather In its latest forecast, the US National Weather Service’s Climate Prediction Center (CPC) predicted that the El Nino phenomenon recorded in 2015 will weaken in the coming months and give way to La Nina, although considerable uncertainty remains. Opposite to El Nino, La Nina is characterized by unusually cold ocean temperatures in the equatorial Pacific Ocean. In 2015, the El Nino weather pattern led to dryness in the Philippines and Indonesia and brought unseasonable rains to parts of South America, hurting the progress of the cane harvest in Brazil. El Nino is likely to keep affecting temperatures and precipitation levels across the US in upcoming months, according to CPC. Food prices The FAO Food Price Index stood at 150.4 points in January, down 16% year on year to the lowest level since April 2009. Food prices have fallen for four straight years and remain under pressure from ample agricultural supply, the FAO said. Price projections The World Bank expects most commodity prices to continue to fall in 2016. With the exception of crude oil, a modest rebound is expected only by 2017. Persistently high inventories and weak growth prospects in emerging economies are likely to weigh on both energy and non-energy markets. Specifically, agricultural prices are projected to drop by 1.4% in 2016 compared to an October forecast of 1.3%. This outlook reflects adequate supplies despite the intensification of El Nino in 2015.
Table C1: Nominal price indices (2010 = 100)
Actual Forecast
2013 2014 2015 2016
Energy 127 118 65 49
Non-Energy 102 97 82 79
Metals 91 85 67 60
Agriculture 106 103 89 88
Food 116 107 91 89
Beverages 128 102 94 93
Raw materials 116 92 83 83
Fertilizers 114 100 95 92
Source: World Bank
20406080
100120140160
Jan-
09Ju
l-09
Jan-
10Ju
l-10
Jan-
11Ju
l-11
Jan-
12Ju
l-12
Jan-
13Ju
l-13
Jan-
14Ju
l-14
Jan-
15Ju
l-15
Jan-
16
Source: World Bank
Fig. C1: World Bank Commodity Price Indices(2010=100)
Energy Non-energy Agriculture

Quarterly Market Outlook Commodity Prices
International Sugar Organization 28 MECAS(16)02
Table C2 – Selected Commodity Prices – February 2012 to January 2016 (Source: IMF) Sugar Cocoa Wheat Soybeans Coffee Maize Oranges Crude oil Cotton Barley
Feb-12 24.12 2,356.24 244.96 461.56 225.49 279.46 778.64 119.70 100.75 213.46
Mar-12 24.10 2,359.25 243.49 496.29 201.85 280.66 802.57 124.93 99.50 222.68
Apr-12 22.75 2,266.78 228.56 529.42 193.35 274.21 822.89 120.59 100.10 237.27
May-12 20.81 2,113.09 231.14 520.93 186.35 268.79 755.83 110.52 88.53 236.98
Jun-12 20.47 2,265.84 241.91 522.33 169.79 267.23 952.76 95.59 82.18 234.70
Jul-12 22.88 2,349.82 309.73 609.45 190.77 332.95 1,015.16 103.14 83.97 242.53
Aug-12 20.88 2,512.26 315.38 622.91 175.97 332.17 970.39 113.34 84.40 258.64
Sep-12 19.99 2,620.28 316.57 615.18 179.60 320.72 1,000.89 113.38 84.15 254.68
Oct-12 20.31 2,463.54 318.38 565.53 172.37 321.63 980.85 111.97 81.95 250.04
Nov-12 19.34 2,478.16 319.40 533.03 160.64 321.54 846.84 109.71 80.87 249.06
Dec-12 19.31 2,431.82 302.85 534.79 154.22 308.72 758.09 109.64 83.37 248.22
Jan-13 18.89 2,275.44 288.07 526.05 158.27 303.29 750.03 112.93 85.51 236.96
Feb-13 18.28 2,197.70 279.02 536.38 153.00 302.50 819.58 116.46 89.71 240.51
Mar-13 18.46 2,153.36 263.21 536.08 153.01 309.49 908.10 109.24 94.45 240.78
Apr-13 17.80 2,294.72 264.04 517.79 152.96 280.27 980.49 102.88 92.54 232.42
May-13 17.62 2,345.73 277.06 542.20 151.43 295.29 1,057.01 103.03 92.62 231.43
Jun-13 17.09 2,283.58 266.80 560.16 138.86 297.06 1,157.65 103.11 93.08 230.59
Jul-13 16.84 2,308.53 257.36 548.35 138.44 278.93 1,121.23 107.72 92.62 222.12
Aug-13 17.03 2,483.61 258.79 498.05 135.63 234.89 1,190.81 110.96 92.71 194.74
Sep-13 17.40 2,616.05 259.74 503.24 132.78 207.41 1,119.72 111.62 90.09 174.82
Oct-13 18.68 2,730.70 271.99 472.83 128.83 201.73 997.26 109.48 89.35 159.28
Nov-13 18.04 2,755.17 259.10 476.66 122.75 199.14 766.00 108.08 84.65 156.34
Dec-13 16.55 2,824.54 243.84 488.67 126.74 197.50 739.98 110.63 87.49 156.35
Jan-14 15.63 2,819.43 228.21 476.10 135.03 198.72 753.15 107.57 90.96 162.55
Feb-14 16.61 2,992.76 242.76 496.80 176.28 209.32 770.93 108.81 94.05 163.33
Mar-14 17.90 3,041.67 275.57 522.00 216.06 222.33 808.11 107.41 96.95 162.15
Apr-14 17.61 3,050.61 273.47 547.19 226.99 222.36 846.89 107.88 94.20 163.40
May-14 18.27 3,030.00 287.85 546.03 215.24 216.92 834.98 109.68 92.71 173.89
Jun-14 18.17 3,174.31 261.59 528.00 198.91 202.56 834.56 111.87 90.90 163.33
Jul-14 18.26 3,196.04 238.53 463.23 198.59 182.23 783.04 106.98 83.84 141.68
Aug-14 17.22 3,270.27 229.10 432.99 214.50 176.43 768.17 101.92 74.00 129.63
Sep-14 16.02 3,221.27 211.16 368.85 212.01 163.06 771.03 97.34 73.38 127.20
Oct-14 16.75 3,100.83 212.78 354.44 227.06 163.31 732.15 87.27 70.34 117.56
Nov-14 16.15 2,909.09 215.95 379.34 212.93 178.67 717.87 78.44 67.53 121.55
Dec-14 15.33 2,946.95 232.97 378.78 200.59 178.67 769.23 62.16 68.30 126.79
Jan-15 15.34 2,915.60 210.61 367.49 190.90 174.71 758.02 48.42 67.35 133.05
Feb-15 14.59 2,961.94 201.71 364.74 179.94 173.70 704.17 57.93 69.84 129.84
Mar-15 13.16 2,878.03 202.68 359.60 160.02 174.23 633.29 55.79 69.35 133.84
Apr-15 13.08 2,868.27 195.90 356.93 164.95 172.05 612.13 59.39 71.70 131.05
May-15 13.34 3,096.00 193.15 351.95 158.17 166.30 608.64 64.56 72.86 128.80
Jun-15 12.46 3,239.88 199.82 354.82 159.77 166.72 629.90 62.35 72.35 124.45
Jul-15 12.77 3,325.96 199.20 372.35 153.29 179.60 640.11 55.87 72.35 134.65
Aug-15 11.50 3,154.02 173.47 347.02 158.78 162.74 684.28 46.99 71.82 126.37
Sep-15 11.83 3,278.45 163.83 323.55 147.65 166.01 631.91 47.23 68.74 122.72
Oct-15 13.91 3,197.34 165.39 327.42 153.88 171.39 660.69 48.12 69.03 123.55
Nov-15 14.55 3,360.84 157.74 319.08 148.94 166.03 768.49 44.42 69.22 124.47
Dec-15 14.64 3,345.66 163.79 323.32 149.52 163.95 768.70 37.72 70.39 121.59
Jan-16 14.05 2,952.42 164.56 323.20 146.32 161.03 689.41 30.80 68.75 117.95
ISA Daily Raw
Sugar Price,
cents/lb
ICCO, CIF US
Europe. Ports
USD/tonne
Wheat Hard Red Winter, FOB Gulf of
Mexico, USD/tonne
US soybeans, Chicago,
No2 yellow and par,
USD/tonne
Coffee Mild Arabicas, ICO, US
cents/pound
Maize US No 2
Yellow, FOB Gulf of Mexico USD/tonne
Oranges, French import price,
USD/tonne
Crude oil, petroleum,
Dated Brent, FOB
UK, USD/barrel
Cotton, CIF UK,
US cents/lb
Barley Canadian spot price USD/tonne

Quarterly Market Outlook Fuel Ethanol
International Sugar Organization 29 MECAS(16)02
WORLD FUEL ETHANOL OVERVIEW Tumbling crude oil prices have squeezed margins for biofuels makers while throwing question marks over government subsidies to renewable fuels. Even so, output has continued to grow steadily through 2015 and is seen to increase marginally in 2016. This is because most of global demand is still supported by legislative programs which guarantee pockets of consumption and price floors for producers even as gasoline retail prices reach new lows. Additionally, there is new appetite for ethanol in China and India which helps to push global production higher in 2016. World fuel ethanol production is forecast to increase by only 0.8% to reach 98.4 bln litres in 2016 (see Fig. D1 and Table D2). Relatively flat production is forecast in the globe’s three dominant producers – the US, Brazil and the EU. Anticipated higher output in several smaller scale producers such as Argentina, China, India, Philippines and Thailand underpin the small gain in global output (see Fig. D2).
0
20
40
60
80
100
120
bln
litre
s
D1: World Fuel Ethanol Production
US Brazil Others
0.0
1.0
2.0
3.0
4.0
5.0
6.0
EU
Chin
a
Cana
da
Thai
land
Arge
ntin
a
Indi
a
Colo
mbi
a
Phili
ppin
es
Aust
ralia
Para
guay
Bln
litre
s
Fig. D2 Fuel Ethanol Production outside of Brazil and the US
2013 2014 2015 2016f
Global fuel ethanol consumption is forecast to consolidate at 98.0 bln litres in 2016 (see table D3). Offtake is anticipated to be flat in the US, Brazil and the EU. Despite the ongoing low oil price environment, gains in consumption are expected in several smaller consumers including Argentina, Colombia, India, Japan, Philippines and Thailand. Should crude oil and petroleum prices remain weak throughout the year there is a possibility of gasoline consumption rising and consequent higher demand for fuel ethanol than presently anticipated in countries with mandated blending targets. Global fuel ethanol trade is forecast to contract in 2016 (exports falling to 4.0 bln litres). The US will continue to dominate world fuel ethanol exports with ample domestic supplies and competitive prices. PRODUCTION
• No growth forecast in US, Brazil and the EU
• Gains centred in Argentina, China, India, Philippines and Thailand
Pivotal Producers US Production of fuel ethanol in 2016 is anticipated to stagnate at the 2015 level of 56 bln litres (see Fig. D3). Support from the Renewable Fuels Standard

Quarterly Market Outlook Fuel Ethanol
International Sugar Organization 30 MECAS(16)02
(RFS) is firmer because the Environmental Protection Agency’s (EPA) final RFS rule for 2016 mandates inclusion of 54.9 bln litres of conventional ethanol into gasoline, 1.7 bln litres more than in 2015. Whilst discretionary blending, together with a rise in gasoline consumption, meant offtake (and output) exceeded the RFS mandate in 2015, for 2016 the incentives for discretionary blending have eased (ethanol is not competitive against gasoline). Furthermore, sales of higher ethanol blends – E15 and E85 remain limited by logistical and other issues. Ultimately, should physical blending of ethanol be insufficient, the RFS mandate can be met by destocking of surplus Renewable Identification Number (RIN) credits accumulated in the past and also by biodiesel/hydrotreated vegetable oil (HVO).
The 2016 production outlook is also being shaped by the likelihood of ongoing soft crude oil prices. Production margins remain squeezed (see Fig. D4). Projections of continued ample corn supplies suggest ongoing relatively low corn prices in the coming year but even so the fortunes of the ethanol industry in the face of falling crude oil and gasoline prices remains a key question. Analysis by the University of Illinois2 shows estimates of ethanol production profits (pre-tax) net of all variable and fixed costs in 2015 averaged USD0.02/litre (USD0.07/gallon). This is much smaller than in 2014 when the combination of relatively high ethanol prices and relatively low corn prices drove profits to a record USD0.14/litre (USD0.54/gallon). There was also a distinct pattern in 2015 of higher average profits in the first half of the year, at USD0.03/litre (USD0.10/gallon)versus the second half at USD0.01/litre (USD0.03/gallon).
2 http://farmdocdaily.illinois.edu/2016/01/the-profitability-of-ethanol-production-in-2015.html
The year also ended on a sour note, with losses during the last four weeks. The downturn in profits can be directly traced to weakness in both ethanol and DDGS prices. It would seem that the record profits of 2013-2014 were a temporary blip due to a unique set of circumstances rather than a new norm driven by surging ethanol exports. Recently US agribusiness Archer Daniels Midland Co. (ADM) reported poor ethanol margins and cautioned that tough market conditions could persist in the year ahead. The company's Corn Processing segment reported a sharp decline in operating profit, mainly due to the Bioproducts division which includes its ethanol business. Operating profit from Bioproducts fell to USD24 mln from USD227 mln in the fourth quarter of 2015, the lowest for three years. Steep declines in crude oil prices drove ethanol prices lower. This, combined with continued high industry production levels, progressively reduced industry margins through the quarter, ADM reported. In response, the company would consider options, including a sale of some ethanol plants, all of which are dry mills. The three dry-mill ethanol plants possibly going on sale (Cedar Rapids/Iowa, Peoria/Illinois and Columbus/Nebraska), which are some of the largest in the country, represent just under half of ADM's 6.8 bln litre/year US ethanol capacity. Divesting from the mills would leave the company with five wet mills, which experts say are more flexible in terms of changing products. Brazil The 2015/16 (April/March) cane crop has drawn to a close in the Centre-South. Whilst El Niño related rains negatively impact the final result, the country still produced a record amount of ethanol this year. Output in 2015/16 rose from 28.4 to 29.7 bln litres, a rise of 4.6% (see Fig. D5). Millers allocated
47
48
49
50
51
52
53
54
55
56
57
2010
2011
2012
2013
2014
2015
2016
f
bln
litre
s
Fig. D3 Annual US Ethanol Production
0.20.30.40.50.60.70.80.9
Jan-
10Se
p-10
May
-11
Jan-
12Se
p-12
May
-13
Jan-
14Se
p-14
May
-15
USD/
litre
Fig. D4 US Corn Cost Per Litre of Ethanol
Corn Cost Ethanol Price

Quarterly Market Outlook Fuel Ethanol
International Sugar Organization 31 MECAS(16)02
a higher share of cane to ethanol production on the back of much stronger domestic ethanol offtake. Mills used 59% of total cane crushed to produce ethanol, up from 56% in 2014/15 and the highest alloction since 2008/09. For the upcoming 2016/17 crop, assuming normal weather the cane crush may rise, especially as mills have stand-over cane from the last campaign. The ISO expects that most of the extra cane will be directed to sugar output (the devaluation of the BRL against the USD, together with stronger world sugar prices have boosted relative returns). Ethanol output is forecast to rise only marginally to 30 bln litres (up 1.2%) of which 11.9 bln litres would be anhydrous and the balance hydrous. In terms of fuel ethanol only, on a calendar year basis, Brazil’s production in 2016 is forecast to contract slightly from 27.4 bln litres in 2015 to 27.3 bln litres. EU Production is anticipated to consolidate in 2016, after having contracted in 2015 by an estimated 500 mln litres to reach only 5.1 bln litres. Analysts note that over 700 mln litres of annual capacity have been taken off the market in the last three years. The fuel ethanol sector has been affected by reduced gasoline consumption and adjusted blending mandates. Another factor has been the boosted blending of biofuels which are counted twice towards the Renewable Energy Directive (RED) mandate. This together with poor margins (from relatively low ethanol prices) worked to take capacity offline.
A major EU fuel ethanol producer Abengoa SA, the Spanish renewable energy developer, seemingly on
the verge of insolvency, is seeking to sell its biofuel business as part of a debt restructuring plan to avoid bankruptcy. Looking forwards, after 18 months of falling or stagnating values, fuel ethanol prices have risen over recent months (reflecting contracting domestic production and lower imports). Sugar producer Suedzucker, for instance, said in January it expects a sharp rise in full-year earning partly due to a firm rise in ethanol prices. But the higher prices may be an incentive to re-start idled capacity. At the same time during 2016 some delayed capacity additions are also slated to come on stream in Germany and Hungary. Other Countries India Sugar mills have contracted to supply 1.040 bln litres of fuel ethanol so far in 2015/16 (October/September), according to ISMA. This would be up 33% on the 780 mln litres that were contracted last season. The oil majors had originally floated an expression of interest (EoI) seeking 2.66 bln litres of ethanol from sugar mills to achieve the 10% vol. mandatory blending target this year. With 1.04 bln litres, oil majors will be able to achieve less than 4% ethanol in gasoline. To achieve the blending target sugar mills have urged state governments to ease current restrictions. These include lack of permission to produce fuel ethanol or delaying excise permissions or creating impediments on inter-state movements by imposing taxes and duties on biofuel. On a calendar year basis, India’s fuel ethanol production is forecast to rise from 650 mln litres to 850 mln litres in 2016. Philippines Although production will likely be ramped up in 2016, the country will remain dependent on imports. Production in 2016 is forecast to rise from 165 mln litres to 280 mln litres, but this compares to expected domestic offtake of over 500 mln litres. The SRA reportedly said three fuel ethanol plants will come online in the course of 2016. For the first quarter, two new cane molasses-based units are forecast to operate: Absolute Distillery and Emperador Distillery in Batangas. Cavite Biofuels should follow by the end of the year. This will increase capacity by 100 mln litres/year, bringing domestic fuel ethanol production capacity to 322 mln litres (at 11 plants). Domestic production could then meet around 80% of the nationwide demand under the current E10 mandate.
0
5
10
15
20
25
30
35
2008
/09
2009
/10
2010
/11
2011
/12
2012
/13
2013
/14
2014
/15
2015
/16
2016
/17f
bln
litre
s
Fig. D5 Brazil - Ethanol Production
Anhydrous Hydrous Total

Quarterly Market Outlook Fuel Ethanol
International Sugar Organization 32 MECAS(16)02
Thailand Fuel ethanol production is forecast to rise from 1.18 bln litres to 1.3 bln litres in 2016 (a rise of 10%), directly driven by anticipated rises in consumption. During January-November of 2015, 1.073 bln litres were produced, a record level, compared with 968.5 mln litres one year earlier (January/December 2014: 1.058 bln litres). Fuel ethanol output from molasses was up 9% on the year at 696 mln litres, while in the cassava-based segment, a growth of 16% (314 mln litres) was achieved. This means the cassava share in fuel ethanol production rose from 28% to 29%. CONSUMPTION
• Original US RFS fuel ethanol blending mandate lowered for 2016
• Higher ethanol prices could undermine offtake in Brazil
• High fuel ethanol premium to constrain demand in the EU
• Increased consumption in Thailand and India
Pivotal Consumers US Fuel ethanol consumption is forecast to consolidate at around 53 bln litres in 2016 (table D3), with little prospect of higher gasoline offtake and use of higher ethanol blends (E15 and E85) still likely to be constrained. Incentives for discretionary blending have waned with gasoline prices falling faster than ethanol prices (see Fig. D6). Consumption will therefore approximate the E10 blend wall (set by the physical limits of blending 10% ethanol with gasoline). The RFS mandate will need to be met by destocking surplus RINs accrued from previous years and also by RIN generation from biodiesel and possibly Brazilian cane ethanol which qualifies as an advanced biofuel. The US EPA announced final volume requirements under the RFS program on November 30th last year for the years 2014, 2015 and 2016, and final volume requirements for biomass-based diesel for 2014 to 2017. The RFS statutes require the EPA to establish biofuel volume requirements in four categories for each year from 2008 through 2022: cellulosic biofuel, biomass-based diesel (BBD), total advanced biofuel (which includes BBD), and conventional biofuel. The difference between the total advanced mandate and the total of the cellulosic and biodiesel mandate is referred to as the undifferentiated advanced mandate and can be satisfied by a combination of qualified advanced
biofuels. Conventional biofuel is generally assumed to be corn-based ethanol but this is actually not explicitly required by the RFS legislation. Instead, corn-based ethanol has been the cheapest alternative for this category that also meets the environmental requirements of the RFS. Typically analysts refer to conventional biofuel as conventional ethanol. In addition, the conventional portion of the mandate can also be satisfied with discretionary blending of advanced biofuels, so the conventional mandate is often referred to as an implied mandate. The RFS rule finalised higher volumes of renewable fuel than the levels EPA earlier proposed in June 2015. The rule finalised 2014 and 2015 standards at levels that reflect the actual amount of domestic biofuel used in those years, and standards for 2016 (and 2017 for biodiesel) that represent significant growth over historical levels. The increases in the ethanol mandates in the final rulemaking were consistent with the stated intention of the EPA to a "push" mandates above the E10 blend wall. The total RFS requires growth from 2014 to 2016 of more than 6.8 bln litres of biofuel, which is 11% higher than 2014 actual volumes. For conventional biofuels (mostly corn ethanol) the EPA rule requires refiners to blend 54.88 bln litres in 2016. This is higher than the earlier proposed volume of 53.0 bln litres but still lower than 56.8 bln litres under the original legislation. Note that the statutory ceiling on the implied conventional mandate is 56.8 bln litres for the remaining life of the RFS.
-100
-50
0
50
100
150
200
250
300
350
400
2013
-01-
02
2013
-04-
01
2013
-06-
25
2013
-09-
19
2013
-12-
13
2014
-03-
13
2014
-06-
09
2014
-09-
04
2014
-11-
28
2015
-02-
26
2015
-05-
21
2015
-08-
17
2015
-11-
10
2016
-02-
08
US
cent
s/ga
llon
Fig. D6 US Fuel Ethanol /Gasoline Spread
Blending Spread
Ethanol CBOT Futures
Gasoline RBOB Futures

Quarterly Market Outlook Fuel Ethanol
International Sugar Organization 33 MECAS(16)02
Table D1: Final Renewable Fuel Volumes 2014 2015 2016 2017
Cellulosic biofuel (bln litres) 0.12 0.47 0.87 n/a
Biomass-based diesel (bln litres) 6.17 6.55 7.19 7.57
Total Advanced biofuel (bln litres) 10.11 10.90 13.66 n/a
Implied Conventional biofuel (bln litres) 51.51 53.18 54.88 n/a
Renewable fuel (bln litres) 61.62 64.08 68.54 n/a
Note: Units for all volumes are ethanol-equivalent, except for biomass-based diesel volumes, which are expressed as physical gallons. Fuel ethanol RIN values collapsed (Fig. D7) after release of the preliminary RFS rule last June which saw mandated levels declared at much lower levels than expected. Values generally traded in a sideways fashion thereafter, suggesting market participants did not expect the existing stock of RINS to be depleted in the near future. RINs prices represent the marginal cost of complying with RFS mandates. However, RIN values rose sharply in November last year in response to the announcement of the final RFS rule by the EPA, suggesting market participants expect higher demand for RINs for RFS compliance in coming months. Current holders of RINS can choose to pass on gains in RIN values to consumers (by lowering the price of ethanol) which could help boost volumes beyond the blend wall. Meanwhile, the fuel ethanol industry has filed a lawsuit against the RFS for 2014, 2015 and 2016. The action undertaken by seven biofuel and agriculture groups kicked off a widely expected legal battle over whether the EPA was able to set requirements for volumes of biofuels use below the original levels set in 2007. The petitioners are Americans for Clean Energy, American Coalition for Ethanol, Biotechnology Innovation Organization, Growth Energy, National Corn Growers Association, National Sorghum Producers and the Renewable Fuels Association. Court challenges were widely expected after the EPA in late November 2015 finalised biofuels requirements that disappointed both biofuels and oil groups. Controversy over the RFS has mounted, with petroleum groups saying standards set in the 2007 law are not achievable, while biofuels groups have said regulators are caving in to "Big Oil" and have misused their authority to lower volumes. Petroleum groups have said the 2007 requirements are not achievable without an infrastructure overhaul. Meanwhile, American Fuel & Petrochemical Manufacturers (AFPM) said it decided to intervene in the lawsuit by ethanol industry groups against the EPA. AFPM said it filed a motion to intervene to support EPA's
interpretation and use of its legal waiver authority to reduce the mandated amounts of renewable fuels to be blended into the nation's fuel supply. EPA's decision to lower volume requirements was the only justifiable option given market realities, and the failure to do so would have been “arbitrary and capricious”, AFPM stated. Brazil Fuel ethanol consumption is forecast to ease from the record level in 2015 of 28.75 bln litres to reach 27.63 bln litres. In March 2015 the government increased the blend rate of anhydrous ethanol in gasoline from 25% to 27%. Moreover, higher gasoline taxes made hydrous ethanol much more competitive, triggering substantial additional demand by the flex fuel vehicle fleet – see Fig. D8. Later in the year (end-September) the government also increased the ex-refinery gasoline price by 6% as well as provided additional fiscal measures supportive to ethanol. Hydrous ethanol offtake was 17.820 bln litres, a sharp increase from 13 bln litres in 2014. At the same time anhydrous ethanol consumption eased from 11.1 bln litres to 10.9 bln litres. Demand for hydrous ethanol has suffered since November with far higher ethanol prices, but the changes in fuel taxation and the higher mandate introduced in 2015 remain supportive. Even so, a loss of competitiveness against gasohol and an overall contraction in fuel sales across all categories due to the economic crisis will likely undermine offtake to some extent. Sales of hydrous ethanol in January in the Centre-South fell year on year, according to Unica, marking a shift in the growth trend seen during the preceding months. Volumes dropped to 1.261 bln litres in January, down 3%. At the same time the market for gasolina C fell by 13.9% to 3.32 bln
0
20
40
60
80
100
120
140
160
2013
-01-
01
2013
-03-
27
2013
-06-
24
2013
-09-
20
2013
-12-
18
2014
-03-
27
2014
-06-
24
2014
-09-
29
2015
-01-
12
2015
-04-
20
2015
-07-
20
2015
-11-
04
2016
-02-
10
US
cent
s/cr
edit
Fig. D7 Price of Current Year Ethanol RINS

Quarterly Market Outlook Fuel Ethanol
International Sugar Organization 34 MECAS(16)02
litres and total consumption of all fuels by the light vehicle fleet (otto cycle) contracted by 11.9%.
Looking forwards, further fiscal measures could be announced in 2016 that would result in higher gasoline prices at the pump. For instance, the federal government could increase the CIDE excise tax on gasoline again. Conversely, if oil prices remain depressed and the BRL/USD exchange rate strengthens, the government could decide in favour of a reduction in gasoline refinery prices which would hurt ethanol’s competitiveness. EU Fuel ethanol consumption in 2016 is forecast to consolidate at around 5.2 bln litres. Lower gasoline use and the adjustment of blending mandates has seen offtake fall since a peak of 5.7 bln litres in 2012. Another factor easing ethanol inclusion has been the boosted blending of biofuels which are counted twice towards the Renewable Energy Directive (RED) mandate. Presently, high bioethanol premiums over gasoline have raised blending costs, boosting further the incentive to use double counting biofuels instead. While use of ethanol could come from wider use of E10 in more member states, again, given the high premium for ethanol, wider use of E10 seems remote. Other Countries Argentina The government has lifted the mandatory ethanol blend to 12% vol. from 10%. All of the additional mandate will be allocated to cane ethanol producers. This means that the market will now be evenly split between sugarcane-based and corn-based ethanol. The boosted ethanol blend will
likely lift consumption to 1 bln litres. Currently there are five corn distilleries in operation in the country compared with nine units using sugarcane juice and molasses. Australia Fuel ethanol consumption is forecast to rise modestly to 240 mln litres in 2016. Offtake remains centred in the state of New South Wales (NSW) where the government has implemented an E6 mandate. The state parliament of Queensland on December 1st last year passed laws legislating that E10 fuel will have to make up at least 30% of gasoline available for sale in the state from January 2017. Parliament also agreed to increase the fuel ethanol target to 4% from July 2018. Two of the three fuel ethanol producers in Australia are based in Queensland - one a grains-based facility at Dalby on the Darling Downs, the other a molasses-based facility at Sarina in north Queensland. Thailand Consumption is forecast to rise modestly from 1.3 bln litres in 2015 to reach a fresh record of 1.35 bln litres in 2016. Further gains are probable because the government in early October last year approved higher subsidies for E85 and E20 (see previous edition of the Quarterly Market Outlook for details). Moreover, the investment incentives for E85 vehicles have been raised. ETHANOL TRADE
• World trade to shrink • US to remain dominate exporter
US Even though the US is anticipated to remain the most competitive ethanol supplier to the world market, a mixed outlook suggests that the it may export less in 2016 than in the current year: with volumes forecast down from 3.2 bln litres to 3.0 bln litres. Growth opportunities exist in Asia, whereas exports to Brazil may shrink given the strength of the USD. Opportunistic markets, where imports are driven by incentives for discretionary blending, might contract because the price advantage of ethanol compared to gasoline has diminished. Exports in 2015 are likely to end down for the year. Exports (all types but excluding blends) in November were down from 272.7 mln litres to 225.7 mln litres. This brought the year to date volume to 2.887 bln litres, down from 2.908 bln litres, due to USD strength. Of this 877.9 mln litres went to Canada. Other key destinations were Brazil (416.3 mln litres) the Philippines (237.5 mln litres),
0.5
0.7
0.9
1.1
1.3
1.5
1.7
1.9
Janu
ary
Febr
uary
Mar
chAp
ril
May
June July
Augu
stSe
ptem
ber
Oct
ober
Nov
embe
rD
ecem
ber
Bln
Lit
res
Fig. D8 Hydrous ethanol sales
2013 2014 2015

Quarterly Market Outlook Fuel Ethanol
International Sugar Organization 35 MECAS(16)02
South Korea (223.9 mln litres), China (227.0 mln litres) and India (177.6 mln litres). Imports of fuel ethanol are forecast to ease slightly in 2016 to around 200 mln litres. Imports of Brazilian cane ethanol as an advanced biofuel will continue but remain limited by competitive domestic biodiesel supplies. For 2015 imports will end higher. Ethanol imports (all types) in November 2015 rebounded from 80.3 mln litres to 134.0 mln litres. Supportive for imports were temporarily elevated prices on the US market in the second half of October, the stronger USD and a rally in RIN values for the advanced biofuel mandate which started in mid-September. Between January and November, 949.4 mln litres were imported, up from 837.3 mln one year earlier. Of this, 86% was from Brazil. Brazil Brazil is not expected to improve its export performance in 2016 because of relatively resilient domestic demand and limited availability with millers expected to show a stronger preference for sugar production. Shipments of fuel ethanol could fall from an estimated level of 950 mln litres in 2015 to 700 mln litres in 2016. Ethanol exports (all types) for calendar year 2015 reached 1.86 bln litres up nearly 33% from 1.40 bln litres one year earlier. A depreciated BRL raised the attractiveness of Brazilian supplies in international markets, with exports particularly strong in July, October and December – see Fig. D9. Higher prices on the domestic market are thought to have cut the competitiveness of Brazilian ethanol on the world market. For 2016 Brazil is thought likely to export no more than 1.1 bln litres.
During 2015, Brazil’s imports of ethanol (all types) rose to 510 mln litres, up from 450 mln litres in the previous year. Nearly all of this was corn ethanol
from the US. Import were higher despite the fact that Brazil's government increased the tariff on imported ethanol to 11.75% from an effective nil on July 22nd, 2015. Imports of fuel ethanol in 2016 are forecast to reach 500 mln litres, little changed from the estimated 2015 volume. EU EU fuel ethanol imports are expected to remain low again in 2016 at 50 mln litres only. EU imports from the US will continue to be restricted by anti-dumping duties. As a result of this duty, imports from origins with preferential access to the EU market in 2013 and 2014 were boosted to varying degrees from Guatemala, Peru, Pakistan and Bolivia. Between January and October 2015, total ethanol imports (all types) reached, 433.2 mln litres, down from 507.9 mln litres one year earlier. The 2014 total had been 590.0 mln litres. Over the same period ethanol exports reached 172.7 mln litres, down from 214.8 mln litres one year earlier. The main destination was Switzerland, followed by Saudi Arabia and Brazil. Exports are supported by restricted domestic demand and the weakened EUR against the USD. China China sharply boosted ethanol imports (all types) in 2015, as buyers sought to take advantage of significantly lower prices in Brazil and the US. Import demand was also supported by low output in China. Imports reached a record volume of over 180 mln litres in December as traders tried to squeeze in as much product as possible ahead of a potential tariff increase in the first quarter of 2016. Imports during October-December 2015 reached 275 mln litres, so there are expectations for imports to recede in January. Analysts note that what started as a buying spree for industrial ethanol earlier in 2015 later increasingly focused on fuel ethanol. Overall it can be estimated that of the total imports of 690 mln litres about 350-400 mln litres will have ended up in the fuel market. PRICES
• Ethanol-gasoline price spread turns negative in the US
• Sharp price uptick in Brazil US After moving sideways for much of the year (see Fig. D10), US ethanol prices were pushed down by the marked retreat in gasoline prices late last year,
Janu
ary
Febr
uary
Mar
ch
April
May
June July
Augu
st
Sept
embe
r
Oct
ober
Nov
embe
r
Dec
embe
r0
200
400
600
mln
litre
s
Fig. D9 Brazil's monthly ethanol exports
2013 20142015
Source:Secex

Quarterly Market Outlook Fuel Ethanol
International Sugar Organization 36 MECAS(16)02
and have remained lower in a relatively soft corn price environment. The decline in crude oil prices that began in the summer of 2014 has taken crude oil prices as low as USD30/ barrel. Wholesale gasoline prices have largely followed crude oil prices down and presently are near USD1/gallon, a level not seen in over a decade. This has raised questions about the competitiveness of ethanol in gasoline blends and the role of ethanol as a relatively cheap source of octane. Analysts in the past have argued that ethanol prices were not likely to move above gasoline prices for any length of time and that market adjustments to maintain the competitive position of ethanol would be rapid. Higher ethanol production and lower ethanol prices had been effective in the past at maintaining ethanol's place in gasoline blends and this was expected to continue in the future. However, ethanol prices have remained well above gasoline prices for several months. In short, a combination of circumstances has effectively turned upside down the historical relationship between ethanol and gasoline prices for the foreseeable future. With ethanol demand stuck near the E10 blend wall, due to the "safety net" feature of the RFS conventional ethanol mandate, ethanol prices cannot fall below the “shutdown” price of ethanol plants because this would result in less production than is needed to fulfill the mandate. Unless crude oil and gasoline prices rebound this appears to be the "new norm" going forward. Furthermore, the ethanol/gasoline price ratio could increase even more if gasoline prices stay low and corn prices increase, which, for example, could occur under poor
summer growing conditions in the US. Brazil With falling stocks, prices have increased sharply to curb consumption levels. Whilst prices moved sideways after a relatively modest inter-harvest peak late in 2014 and early 2015, the magnitude of the rise since October has been exceptional. Prices for anhydrous ethanol have moved from BRL 1.39/litre back in September to reach BRL 2.03/litre in January this year – the highest since April 2011. Similarly prices for hydrous ethanol moved from BRL1.26/litre in September to reach BRL1.82/litre in January – a new record (in nominal terms). Ethanol prices have edged higher still in the first two weeks of February.
Crucially, ethanol stocks in the Centre-South fell by a record 1.1 bln litres in the first half of January as mills tried to maximise cash flow. The extent of the draw-down is such that overall stock levels fell below those of the previous two campaigns when consumption was very much lower. Should the rate of stock depletion not diminish substantially the country may have to start the new crop with very low inventories. There are two factors that could help prevent this. Higher prices could reduce demand further and an early start of the season could help replenish stocks. Total stocks in the Centre-South as of January 16th were 5.6 bln litres against 7.5 bln litres last year and 6.1 bln on the same day in 2014. Given high demand for hydrous ethanol over the last twelve months, its share of overall stocks is at a record low of 46%, about ten percentage points less than in a normal season. Argentina The Energy Secretariat issued new reference prices for fuel ethanol for November 2015-January 2016. The new prices included an upward revision for both cane- and grains-based fuel grades by 5% on
1.0
1.2
1.4
1.6
1.8
2.0
BRL/
litre
Fig. D11: Sao Paulo ex-mill ethanol prices
Anhydrous Hydrous
3.00
3.50
4.00
4.50
5.00
5.50
6.00
6.50
7.00
7.50
0.30
0.40
0.50
0.60
0.70
0.80
0.90
Corn
Pric
e U
SD/b
ushe
Gas
olin
e/et
hano
l Pric
e U
SD/li
tre
Fig. D10 US Monthly Prices for Ethanol, Gasoline and Corn
Ethanol Gasoline Corn

Quarterly Market Outlook Fuel Ethanol
International Sugar Organization 37 MECAS(16)02
the month to ARS10.32 and ARS8.02/litre, respectively. This the maximum monthly increase allowed under the national legislation. The local corn-based fuel ethanol sector is suffering from the devaluation of the ARS and the removal of the export quota system for the grain which came after the new government took over power. EU The Commission has opened a formal antitrust investigation to look into suspicions that three fuel ethanol producers have colluded to manipulate benchmark prices used by the industry. The Commission said it was assessing the actions of Spanish producer Abengoa, Belgium's Alcogroup
and Lantmännen of Sweden after unannounced inspections over the past three years. It had concerns that the companies may have colluded to manipulate ethanol benchmarks published by price reporting agency Platts, such as by agreeing to submit or support bids to hike the benchmark and so drive up prices. In April, EU antitrust regulators raided several ethanol companies and at the same time stepped up a two-year investigation into biofuel price benchmarks. The Commission is also reportedly looking into whether producers or traders of ethanol fixed prices or shared markets and customers, with a series of unannounced inspections carried out in March.
Table D2: World Fuel Ethanol Production (mln litres) Country 2011 2012 2013 2014 2015 2016f Argentina 165 236 473 642 830 1000 Australia 290 280 275 270 230 240 Brazil 19,132 19,986 23,369 24,469 27,380 27,290 Canada 1,345 1,695 1,730 1,745 1,800 1,760 China 2,255 2,509 2,635 2,767 2,850 3,000 Colombia 337 370 388 407 455 600 EU 4,100 4,400 5,000 5,600 5,100 5,250 India 269 200 80 369 650 850 Paraguay 130 165 180 200 200 215 Peru 123 235 240 245 210 195 Philippines 4 32 72 110 165 280 Thailand 510 656 949 1,058 1,180 1,300 US 52,805 50,350 50,398 54,286 56,000 56,000 Others 451 540 721 940 630 570 Total 81,917 81,654 86,509 93,108 97,680 98,550 Source: ISO Ethanol Yearbook 2015: ISO forecasts

Quarterly Market Outlook Fuel Ethanol
International Sugar Organization 38 MECAS(16)02
Table D3: World Fuel Ethanol Consumption (mln litres) Country 2011 2012 2013 2014 2015 2016f Argentina 166 221 476 653 804 1000 Australia 288 265 245 230 230 240 Brazil 19,290 17,790 21,456 24,085 28,750 27,630 Canada 2,023 2,585 2,943 3,106 3,000 3,000 China 2,255 2,509 2,635 2,767 3,150 3,300 Colombia 351 368 394 431 500 600 EU 5,435 5,718 5,430 5,333 5,170 5,200 India 365 305 382 350 675 850 Japan 315 305 340 485 550 600 Paraguay 150 165 180 200 170 170 Peru 58 128 138 130 155 160 Philippines 197 307 363 442 475 500 Thailand 450 509 948 1,185 1,302 1,350 US 48,684 49,405 50,280 50,900 52,550 53,000 Others 340 485 548 229 545 540 Total 80,368 81,047 86,758 90,526 98,026 98,140 Source: ISO Ethanol Yearbook 2015; ISO forecasts
Table D4 : World Fuel Ethanol Trade (mln litres) Country 2011 2012 2013 2014 2015 2016f Imports US 533 1,853 1,159 274 250 200 Brazil 1,150 546 132 452 510 500 Canada 926 1,005 1,067 1,360 1,400 1,400 EU 1,300 750 400 50 50 50 Philippines 216 248 297 339 350 250 Other 1,152 1,623 1,800 1,730 1,800 1,800 Total 5,277 6,025 4,855 4,205 4,360 4,200 Exports Brazil 992 2,742 2,044 836 950 700 EU 50 45 10 110 95 90 US 4,075 2,807 2,353 3,207 3,200 3,000 Other 350 400 300 150 200 250 Total 5,467 5,994 4,707 4,303 4,545 4,040 Source: ISO Ethanol Yearbook 2015; ISO forecasts

Quarterly Market Outlook Bioproducts
International Sugar Organization 39 MECAS(16)02
BIOPLASTICS AND BIOCHEMICALS
• Global bioplastics production capacity to
grow to 7.8 mln tonnes by 2019 • Expansion to be driven by trend towards
bio-based packaging Global bioplastics production capacity is set to grow from 1.7 mln tonnes in 2014 to around 7.8 mln tonnes in 2019 (see Fig. D12), according to the latest set of forecasts released by industry association European Bioplastics last November. The association expects the bulk of growth to be driven by bio-based versions of PE and PET. Packaging remains the biggest field of application for bio-plastics worldwide, accounting for nearly 70% of the market. Growing consumer demand for products with a reduced environmental impact will likely push this share to 80% by 2019, according to European Bioplastics. Production capacity for bio-based plastics which are also bio-degradable is projected to rise from 0.7 mln tonnes in 2014 to over 1.2 mln tonnes in 2019. Plastics in this category – such as PLA, PHA and starch blends – are gaining market share in line with the ramp-up of new capacities in the US and Asia. On the demand side, European Bioplastics found that uptake of bio-based plastics is increasing in many sectors, including textiles, automotive applications and consumer goods, however no figures were provided. Asia will expand its role as a key production hub in 2019, housing over 80% of bio-plastics production capacity, leaving Europe with less than 5%.
Overall plastics production is likely to reach 1.12 bln tonnes by 2050 from just over 310 mln tonnes currently, according to a report presented during the World Economic Forum in Davos, Switzerland, in January. The report also noted that only 14% of plastic packing is collected for recycling, despite the launch of the universal recycling symbol over 40 years ago. An estimated 40% of global packaging material is sent to landfills, while 32% is leaked into the environment and 14% is used in power recovery plants. For 2016, research and advisory firm Lux Research expects technology developers to continue to improve bioplastics’ mechanical, thermal and barrier properties to meet specific end-user requirements. Concerns related to these properties have been a roadblock for the wider adoption of bio-plastics over recent years. Manufacturers like Japan’s Toray are now working with bio-resins that can withstand temperatures of up to 200 degrees Celsius and with a bio-based content greater than 50%. JAPAN Beverage maker Suntory and chemical producer Anellotech have announced intentions to advance the development and commercialization of 100% bio-based plastics for use in bottles. Suntory’s brands include Orangina, Schweppes, Ribena, Lucozade as well as major alcohol labels such as Yamazaki, Jim Beam, and Château Lagrange. US Bio-tech firm Amyris said in January it had signed a multi-million dollar farnesene supply agreement for the global nutraceuticals and vitamins market, without disclosing the name of the buyer. First volumes were delivered in the last quarter of 2015 for conversion into final products. At the end of last year, Amyris said it had achieved record-low costs of USD1.75/litre for farnesene, a chemical building block produced from fermented sugars. In a press release, Amyris said the global market value for low-cost and high-performance materials produced from sugarcane could soon exceed USD20 bln.
0
1,000
2,000
3,000
4,000
5,000
6,000
7,000
8,000
2013
2014
2015
2016
2017
2018
2019
in 1
,00
0 t
on
ne
s
Fig. D12: Global Bio-Plastics Production Capacity
Bio-degradable Bio-Based/Not bio-degradable
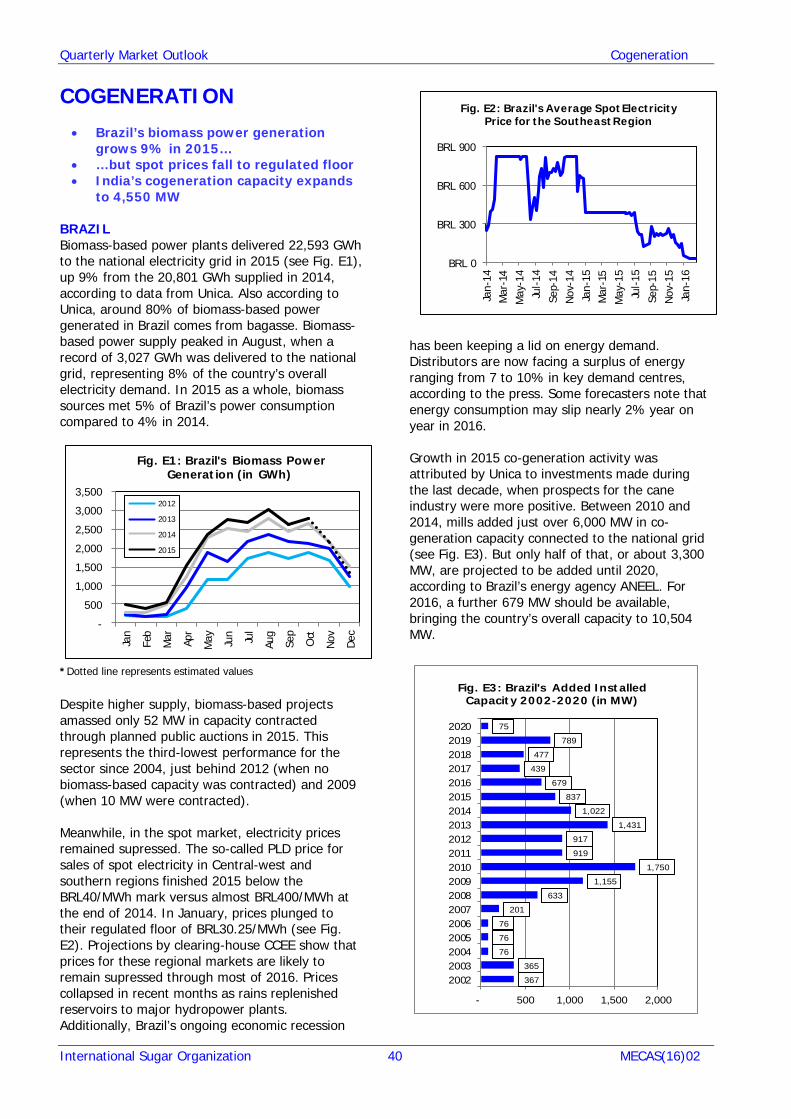
Quarterly Market Outlook Cogeneration
International Sugar Organization 40 MECAS(16)02
COGENERATION • Brazil’s biomass power generation
grows 9% in 2015… • …but spot prices fall to regulated floor • India’s cogeneration capacity expands
to 4,550 MW BRAZIL Biomass-based power plants delivered 22,593 GWh to the national electricity grid in 2015 (see Fig. E1), up 9% from the 20,801 GWh supplied in 2014, according to data from Unica. Also according to Unica, around 80% of biomass-based power generated in Brazil comes from bagasse. Biomass-based power supply peaked in August, when a record of 3,027 GWh was delivered to the national grid, representing 8% of the country’s overall electricity demand. In 2015 as a whole, biomass sources met 5% of Brazil’s power consumption compared to 4% in 2014.
*Dotted line represents estimated values Despite higher supply, biomass-based projects amassed only 52 MW in capacity contracted through planned public auctions in 2015. This represents the third-lowest performance for the sector since 2004, just behind 2012 (when no biomass-based capacity was contracted) and 2009 (when 10 MW were contracted). Meanwhile, in the spot market, electricity prices remained supressed. The so-called PLD price for sales of spot electricity in Central-west and southern regions finished 2015 below the BRL40/MWh mark versus almost BRL400/MWh at the end of 2014. In January, prices plunged to their regulated floor of BRL30.25/MWh (see Fig. E2). Projections by clearing-house CCEE show that prices for these regional markets are likely to remain supressed through most of 2016. Prices collapsed in recent months as rains replenished reservoirs to major hydropower plants. Additionally, Brazil’s ongoing economic recession
has been keeping a lid on energy demand. Distributors are now facing a surplus of energy ranging from 7 to 10% in key demand centres, according to the press. Some forecasters note that energy consumption may slip nearly 2% year on year in 2016. Growth in 2015 co-generation activity was attributed by Unica to investments made during the last decade, when prospects for the cane industry were more positive. Between 2010 and 2014, mills added just over 6,000 MW in co-generation capacity connected to the national grid (see Fig. E3). But only half of that, or about 3,300 MW, are projected to be added until 2020, according to Brazil’s energy agency ANEEL. For 2016, a further 679 MW should be available, bringing the country’s overall capacity to 10,504 MW.
-
500
1,000
1,500
2,000
2,500
3,000
3,500
Jan
Feb
Mar Apr
May Jun Jul
Aug
Sep
Oct
Nov Dec
Fig. E1: Brazil's Biomass Power Generation (in GWh)
2012
2013
2014
2015
BRL 0
BRL 300
BRL 600
BRL 900
Jan-
14M
ar-1
4M
ay-1
4Ju
l-14
Sep-
14N
ov-1
4Ja
n-15
Mar
-15
May
-15
Jul-
15Se
p-15
Nov
-15
Jan-
16
Fig. E2: Brazil's Average Spot Electricity Price for the Southeast Region
367
365
76
76
76
201
633
1,155
1,750
919
917
1,431
1,022
837
679
439
477
789
75
- 500 1,000 1,500 2,000
2002200320042005200620072008200920102011201220132014201520162017201820192020
Fig. E3: Brazil's Added Installed Capacity 2002-2020 (in MW)

Quarterly Market Outlook Cogeneration
International Sugar Organization 41 MECAS(16)02
The slower pace of investments in recent years also means biomass-based electricity is projected to contribute 6% of Brazil’s capacity expansion in 2016, down from a peak of 32% in 2009 and an estimated 15% in 2015. Unica sees the share of biomass in overall added capacity falling to 1% by 2020. ETHIOPIA Wolqayt Sugar factory is expected to start supplying energy to the grid in April. Ethiopian Electric Power (EEP) announced that the installation of power distribution and transmission lines is 70% complete. The government-led project has an estimated cost of ETB37 mln (or USD1.74 mln). INDIA In India, 132 MW of bio-power capacity was added to the grid so far in fiscal 2015/16 (April/March), according to the ministry of new and renewable energy. This has brought total commissioned capacity to 4,550.55 MW (see Fig. E4). The central government has set a target of adding 400 MW capacity from bio-power sources in 2015/16, which include biomass & gasification and bagasse co-generation.
PHILIPPINES Global Business Power and sugar producer Roxas Holdings are planning the construction of a 40 MW bagasse-based plant in Negros at an estimated cost of USD100 mln. If the project goes ahead, the co-generation facility would sell excess power to the national grid under the country’s feed-in-tariff regime.
PAKISTAN Nine companies and sugar mills in Pakistan have been issued letters of intent (LOI) to generate 271 MW of biomass-based electricity across different areas of the country, according to the Alternate Energy Development Board (AEDB). The National Electric Power Regulatory Authority (Nepra) had announced an upfront tariff of PKR10.7291/KWh (equivalent to USD0.10/KWh) for bagasse-based co-generation projects. UGANDA Mayuge Sugar Industries Limited is set to start construction of a 23-MW co-generation plant in the second quarter of the year, according to the press. Construction is expected to take two years to complete. The company will sell power to the Uganda Electricity Transmission Company at a fixed price of USD0.095/KWh.
-
500
1,000
1,500
2,000
2,500
3,000
3,500
4,000
4,500
5,000
2007
/08
2008
/09
2009
/10
2010
/11
2011
/12
2012
/13
2013
/14
2014
/15
2015
/16*
Fig. E4: India's Bio-power Installed Capacity (in MW)

Quarterly Market Outlook Alternative Sweeteners
International Sugar Organization 42 MECAS(16)02
ALTERNATIVE SWEETENERS HIGH FRUCTOSE CORN SYRUP
• US producers face lacklustre domestic demand and stagnant imports by Mexico
US Consumption HFCS offtake is forecast to contract again in 2016, falling from an estimated 7.2 mln short tons (dry weight) in 2015 to 7.1 mln short tons – see Fig. F1. HFCS use has consistently trended lower over the past decade, with consumption in 2015 around 22% lower than in 2002 when it peaked at 9.2 mln short tons. The USDA has identified several factors as contributing to falling HFCS use including relatively higher costs for corn in the wet milling process; the lack of price competitiveness of HFCS compared with refined sugar and other caloric sweeteners; and changing preferences of customers and food manufacturers. Shrinking consumption of carbonated soft drinks (CSD) – the largest market for HFCS-55 - is the key change in consumer preferences driving HFCS offtake lower. As noted in the previous issue of the Quarterly Market Outlook, HFCS producers were reportedly able to pass on higher prices to major users in the beverage and food sectors. Negotiations over annual contracts for calendar year 2016 reportedly saw a price rise of around 15%. With these pricing gains HFCS producers will likely enjoy improved margins as corn prices are anticipated to remain low during the 2015/16 marketing year. The higher prices for HFCS are in part due to a loss of production capacity following the closure of Cargill’s facility in Memphis. Furthermore, in July 2015 Ingredion sold its facility in Ontario to Jungbunzlauer (a food ingredients company) which intends to cease HFCS production and instead focus on corn glucose for further processing in higher value products such as citric acid. As can be seen in Fig. F2, with higher prices agreed in 2016, HFCS has further lost competitiveness with sugar, particularly since domestic refined beet sugar prices have continued to weaken during the course of 2015. Production and Exports HFCS production is anticipated to fall from 8.5 mln short tonnes (dry weight) to 8.4 mln short tons. Production has also been declining over the past
decade but not to the same extent as domestic offtake. This is because exports of HFCS, especially to Mexico, have shielded HFCS producers from the full impact of a shrinking domestic market. However, exports to Mexico have fallen off in recent years as the country has produced more sugar, impacting HFCS use. The USDA forecasts that consumption of HFCS in Mexico during 2015/16 will rise slightly from the 2014/15 level of 1.45 mln tonnes to 1.50 mln tonnes. Low corn prices but relatively high sugar prices in Mexico are supporting firm HFCS offtake, despite the continued imposition of the government’s tax on sugary drinks. Whilst there is consensus that the tax reduced per capita softdrink demand (estimates ranging between 2%-12%) in the first year, there is evidence that lower consumption is transitory and growth in offtake will likely resume this year.
0.4
0.6
0.8
1.0
1.2
1.4
1.6
5
10
15
20
25
30
35
40
45
50
5520
12
2013
2014
2015
2016
Rat
io
Cen
ts/lb
Fig. F2 Monthly US HFCS and Sugar Prices
Refined Beet Wholesale
Wholesale list price HFCS-55
Ratio
42.4 41.7
40.3 40.0 39.5 39.3
35
40
45
50
55
4
5
6
7
8
9
10
11
12
2011
2012
2013
2014
2015
s
2016
f
Per
cent
mln
sho
rt to
ns
Fig. F1 US HFCS and Sugar: Deliveries for Domestic Food and Beverage Use
HFCS Sugar
HFCS share

Quarterly Market Outlook Alternative Sweeteners
International Sugar Organization 43 MECAS(16)02
Feedstock costs Net corn sweetener costs (determined by the price of corn minus revenue from co-product) fell during the last quarter of 2015. Lower corn prices coincided with a modest firming in co-product credits – see Fig. F3. On a full year basis, net corn sweetener costs averaged 4.84 US cents/lb in 2015, slightly lower than the 2014 level of 4.89 US cents/lb. Costs remained far below those seen during 2011, 2012 and much of 2013 (ranging between 10.5-13.6 US cents/lb). Looking forwards, feedstock costs are anticipated to remain low during 2016. The USDA estimates adequate supplies from the 2016 harvest (second largest on record). The USDA also projects no increase in corn use by ethanol producers and lower exports. The net result is a rise in ending stocks (see Fig. F4), which are forecast at their highest level for a decade. The season-average farm price for corn is anticipated by the USDA to remain relatively low, ranging between USD3.30-3.85/bushel, as against the 2014/15 average level of USD3.70/bushel. EU EU isoglucose production remains capped at 720,000 tonnes (white sugar equivalent) until the quota system expires in September 2017. Also because of the current quota system, isoglucose is priced based on its sweetness equivalence with sugar. The profitability of isoglucose producers is therefore dictated by the relative prices of sugar and grains (corn and wheat are the key feedstocks). The decline in EU sugar prices since 2014 squeezed the differential between grains and sugar prices, narrowing margins for HFCS producers. A recovery in sugar prices which began in the last quarter of 2015 might continue (depending on how the European Commission manage the tight quota sugar balance), which would improve the fortunes of isoglucose producers. China In China, the starch sector is estimated to produce each year about 1.8 mln tonnes of HFCS (in addition to considerable production of glucose and malt sugar). The HFCS sector suffered in 2013 and 2014 due to very high corn prices and consequent low capacity utilisation. Last year however, several key developments have boosted production prospects. First, sugar prices have improved on the back of a poor 2014/15 crop and a prospective even smaller sugar production in 2015/16. Second, China’s government early in the year increased the
tax rebate for exports of corn and corn-based products by the starch sector. Third, the government late in the year decreased corn prices in order to encourage use of domestic corn rather than imported corn. With relatively high sugar prices but soft corn prices production and use of HFCS may increase in 2016.
0.50
2.50
4.50
6.50
8.50
10.50
12.50
14.50
16.50
2012 2013 2014 2015
Fig. F3 Net Cost Corn Sweetener
Corn USD/bushel
Net Corn Sweetener Cost US cents/lb
Total byproduct credit USD/bushel
Source: USDA
0
200
400
600
800
1,000
1,200
1,400
1,600
1,800
2,000
0
2,000
4,000
6,000
8,000
10,000
12,000
14,000
16,000
2011
/12
2012
/13
2013
/14
2014
/15
2015
/16
stoc
ks -
mln
bus
hels
mln
bus
hels
Fig. F4 US Corn Balance
production total use ending stocks
Source: USDA

Quarterly Market Outlook Alternative Sweeteners
International Sugar Organization 44 MECAS(16)02
Table F1: United States: Corn - Food and industrial uses (mln bushels) Marketing year
HFCS
Glucose & dextrose
Starch
Fuel
Alcohol
Beverage
& MFG
Cereals &
other products
Total
2007/08 490.3 235.6 261.8 3,049.2 135.4 192.4 4,386.5 2008/09 489.1 245.1 234.1 3,708.9 134.0 192.1 5,025.2 2009/10 512.1 257.3 250.4 4,591.2 134.0 193.7 5,961.0 2010/11 521.1 272.4 258.4 5,018.8 135.0 197.0 6,425.5 2011/12 513.4 296.6 254.0 5,000.0 136.5 203.2 6,428.4 2012/13 491.5 292.0 249.4 4,641.1 140.0 198.4 6,037.9 2013/14 477.7 308.3 218.8 5,123.7 141.6 200.5 6,493.5 2014/15 478.5 299.8 215.5 5,208.5 142.2 201.2 6,568.2 2015/16 470.0 300.0 230.0 5,225.0 144.0 203.1 6,590.0
Source: USDA, Feed Outlook tables, FDS—16b, 11 February 2016.

Quarterly Market Outlook Alternative Sweeteners
International Sugar Organization 45 MECAS(16)02
INTENSIVE SWEETENERS
• European Food Safety Authority approves Reb M
• PureCircle moving beyond Reb A • GLG Lifetech tackles bitterness in
stevia and monk fruit sweeteners • Coca Cola GB tweaks sugar/stevia
blend • Thaumatin gains new approval in the
EU Stevia Rebaudioside M is safe and can be added to the list of EU-approved steviol glycosides (E960), the European Food Safety Authority (EFSA) concluded. Rebaudioside M, also known as rebaudioside X, is a minor steviol glycoside constituent of the Stevia rebaudiana Bertoni (S.rebaudiana) plant. PureCircle reported revenue growth of 26% from fiscal year 2014 (USD101mln) to 2015 (USD127mln). Approximately 50% of the company’s sales are in North America, with 20% in Latin America, 20% in Asia-Pacific and 10% in Europe. The company has started to produce products for “big name” companies, such as PepsiCo, Dr Pepper-Snapple and Coca-Cola. PureCircle recently launched its Zeta Family line for low- or no-calorie products and has other new innovations launching in the near future. The company has moved beyond Rebaudioside A, or Reb A, and now has 18 different stevia products in its portfolio. PureCircle has discovered more than 40 glycosides in the stevia leaf. The company’s research and development team is in the process of creating and testing each to try to get the closest possible match to sugar. Meanwhile, competitor company GLG Lifetech Corp has announced it intends to utilize MycoTech’s mushroom-fuelled bitter blocking technology to tackle bitterness in stevia and monk fruit sweeteners. MycoTech’s organic certified ‘ClearTaste’ powder, which can be described on the ingredients list as ’natural flavour(ing)’ or ‘natural flavour enhancer’, is derived from mushroom mycelium, and has been shown to block the bitter and stringent notes in stevia (and other ingredients). On the demand side, Coca-Cola Great Britain has created a new recipe for stevia-sweetened Coca-Cola Life (the mid-calorie brand sweetened with a blend of sugar and stevia leaf extract), in order to further reduce the sugar content of the drink. The new version will contain 45% less sugar and calories than the regular full calorie flagship drink.
The original Coca-Cola Life, which was launched in Great Britain in September 2014, contained a third less sugar and calories than the regular version. Coca-Cola Life was initially launched in Argentina and Chile in 2013. It is now available in the UK, US and Australia, alongside a number of other markets. Thaumatin In November, the EFSA gave approval for use of the natural protein sweetener and flavour modifier thaumatin in a wide range of applications including food flavourings, salt substitutes, soups, sauces and snacks, energy-reduced breakfast cereals, jams and jellies, food supplements and alcoholic beverages. The EFSA has also given its stamp of approval to an increase in the maximum use level from 0.5 mg/litre to 5 mg/litre in flavoured drinks. The application to extend thaumatin’s use into these categories was lodged by French ingredients firm Naturex, which manufacturers the natural fruit extract under the Talin brand. The company notes that thaumatin is a natural sweetener that is capable of masking the bitterness of stevia but also can improve the taste of many other sweeteners. Prior to the EFSA opinion, thaumatin was already approved in the EU in chewing gum, energy reduced or no-sugar-added confectionery and edible ices, table top sweeteners, dairy and non-dairy desserts and syrup and chewable food supplements, at various maximum usage levels. Its use was also permitted in flavoured drinks at a maximum usage level of 0.5 mg/litre, which Naturex said was too restrictive in some formulations.

Quarterly Market Outlook Molasses
International Sugar Organization 46 MECAS(16)02
MOLASSES
• Prices to remain firm • Exports from key Asian origins remain
down • Flat to lower demand in key
importers Outlook and Prices Prices are anticipated to remain flat for much of 2016 with prospects of lower production and availability in key exporters coinciding with flat to lower demand in key importers. The squeeze on export supplies from Asia due to diversion of molasses to fuel ethanol production should not abate whilst in importing countries molasses will likely continue to lose competitiveness in compound livestock feed rations. Over recent months soft grain prices and consequent reduced inclusion rates in compound feeds have pressured molasses values, at least in USD terms. Reflecting a weakening currency, values on the EU market for beet molasses have remained firm in EUR terms (Fig G1).
FOB prices in Pakistan and India moved sideways during 2015, ranging between USD110/tonne to USD130/tonne (see Fig. G2). FOB Thailand prices started the year at a higher level of USD150/tonne but from mid-year were commensurate with FOB prices from India and Pakistan.
Production and Exports Availability of cane molasses to the global market from Asia will prove once again a key driver of production and exports during 2016. Last year higher production of molasses seen in major Asian exporters was largely absorbed by rising demand for fuel ethanol in the region. Indications are for molasses output to fall in 2016 in all major exporters.
In India molasses output could fall from the massive 2014/15 level of 12.2 mln tonnes to around 11.5 mln tonnes. Molasses exports in 2015 are estimated to have reached 350,000 tonnes, up from 156,000 tonnes in 2014 (see Fig. G3). This year, India could have less molasses available for export, not only due to lower output but more importantly because the government has announced several measures to make fuel ethanol production more attractive to mills. Exports are therefore forecast at no more than 200,000 tonnes in 2016. In contrast to India, molasses output in Pakistan is predicted to rise to around 2.5 mln tonnes in the 2015/16 season, up from 2.4 mln tonnes last season. Even so the small upturn in production will not impact molasses exports which are anticipated to remain very low at around 100,000 tonnes. Ethanol production from molasses still remains more remunerative for sugar millers than directly exporting molasses.
80.00
100.00
120.00
140.00
160.00
180.00
200.00
220.00
240.00
260.00
Jan-
11
Jun-
11
Nov
-11
Apr-
12
Sep-
12
Feb-
13
Jul-1
3
Dec
-13
May
-14
Oct
-14
Mar
-15
Aug-
15
Fig. G1 EU beet molasses prices
EUR/tonne
USD/tonne
Source: LEI
60
80
100
120
140
160
Jan-
11
Jan-
12
Jan-
13
Jan-
14
Jan-
15
Jan-
16
USD/
tonn
e
Fig. G2 Molasses Prices FOB Asia
Pakistan FOB India FOB
Thailand FOB

Quarterly Market Outlook Molasses
International Sugar Organization 47 MECAS(16)02
Production in Thailand from the recently commenced 2015/16 harvest may also be lower than last year. Even though molasses yields are high there is now an expectation for less cane tonnage to be crushed due to drought conditions. A decline in domestic molasses production to 4.3 mln tonnes is possible. Furthermore, domestic use of molasses by the fuel ethanol industry is anticipated to keep growing, limiting exports in 2016. Shipments in 2015 fell from 412,000 tonnes to 348,000 tonnes. With likely lower production coupled with continued growth in offtake for ethanol production, molasses exports are forecast to fall further in 2016, possibly to as low as 250,000 tonnes.
Molasses production in Indonesia is expected to remain around 1.4 mln tonnes in 2015/16. Export shipments in 2015 are estimated at 0.6 mln tonnes ensuring the country remained the single largest exporter in Asia. Most of the country’s exports remain within the region with the most important market by far being South Korea, taking more than half of the annual tonnage. Indonesia’s molasses exports are thought likely to recede somewhat in 2016 in light of stagnant output and suggestions of lacklustre offtake by key Asian importing countries. Demand and Imports Demand for molasses in key importers weakened during 2015, a direct consequence of weaker grains prices but relatively firm molasses prices. Demand became restricted to only the less sensitive users which cannot switch easily to other
feedstocks or those users who value molasses for its flavour, binding qualities and other characteristics. In the EU continuing soft grain prices combined with exceptionally high supplies of locally produced beet molasses have together weakened import demand considerably. Not only is molasses less competitive in livestock feeds, as well the European Feed Manufacturers Federation estimates EU production down 0.7% in 2015 following a modest decline in 2014. Between January and October 2015, molasses imports fell from 1.57 mln tonnes to 1.27 mln tonnes, a decline of almost 20%. Net imports are slated to reach around 1.45 mln tonnes in 2016, down from 1.81 mln tonnes in 2015 (see Fig. G4). Looking ahead to 2016, assuming that demand in the EU has already bottomed (because use has dropped to a level where users cannot easily switch to other raw materials) - then imports are likely to rise. This directly reflects lower local production from the 2015/16 campaign. Beet molasses output is forecast down 880,000 tonnes (22%), so net imports could return to as high as 1.8 mln tonnes. In the US continuing ample supplies of corn, soya, wheat and DDGS means that the molasses maintains an uncompetitive position in the market for livestock feed ingredients. Corn supplies will remain very high in 2016 and prices for the feed grain are expected to remain very competitive. In consequence, molasses sales to the animal feed sector will be again constrained. Molasses net imports in 2015 fell modestly from 0.844mln tonnes to 0.838 mln tonnes. Looking to 2016 higher local molasses production (2.25 mln tonnes from the 2015/16 season as against 2.1 mln tonnes in the previous campaign) suggests a reduced need for imports, which could see total shipments at no more than 0.9 mln tonnes (0.75 mln tonnes net).
0
0.2
0.4
0.6
0.8
1
1.2
Paki
stan
Indi
a
Thai
land
Indo
nesi
a
Mln
tonn
es
Fig. G3 Asia's Cane Molasses Exports
2012 2013
2014 2015e
2016f

Quarterly Market Outlook Molasses
International Sugar Organization 48 MECAS(16)02
Asia also houses several key importers including Japan, South Korea, and Taiwan. In total, these countries imported around 1.1 mln tonnes in 2015, down from 1.2 mln tonnes from 2014 – see Fig. G5. The trade estimate as much as 100,000 tonnes of molasses demand in the fermentation sector was substituted by raw sugar in Asia, compounding any losses due to a reduced competitiveness of molasses in livestock feeds. South Korea remains by far the dominant importer. Molasses is mostly consumed by the country's large livestock feed industry with smaller volumes used for fermentation products. Imports in 2015 are estimated to have reached 0.75 mln tonnes, down 10% on the 2014 level. In the second largest deficit country – Taiwan - the fermentation sector accounts for the bulk of molasses use. Imports in 2015 are estimated at 0.22 mln tonnes, as against 0.24 mln tonnes the previous year. Finally in Japan, imports were much the same level as in 2014 at 0.12 mln tonnes. At this point in time there is little to suggest a substantial recovery in import volumes during 2016.
0
0.5
1
1.5
2
2.5
EU US
Mln
tonn
es
Fig. G4 Molasses Net Imports
2012 2013 2014
2015e 2016f
0.00
0.40
0.80
1.20
Japan South Korea Taiwan
Mln
ton
nes
Fig G5 Asia's Molasses Imports
2013 2014
2015 2016

Quarterly Market Outlook WTO Update
International Sugar Organization 49 MECAS(16)02
WTO UPDATE
• Nairobi Ministerial clinches deal on agricultural export subsidies
• Profound differences remain in other key negotiating areas
Trade ministers clinched a deal to eliminate agricultural export subsidies at the WTO Ministerial Conference in Nairobi. The Ministerial also agreed a series of other deliverables on agricultural trade and least developed country issues. The outcome drew a mixed preliminary welcome from trade officials and observers. The agreement disciplining agricultural export competition, for example, was lauded as “historic” by trade officials - an achievement that eluded the trade system for 60 years since the GATT imposed similar curbs on export subsidies for industrial goods. Unsurprisingly deep divisions on the subject among members persisted up to the final hours of the ministerial, requiring round-the-clock negotiations. On agricultural matters, despite fundamental differences, members managed to bridge their divides– and achieved a result that is likely to have significant ramifications for agricultural trade and for least developed countries’ participation in global trade flows, according to commentators. The four key new ministerial decisions on agriculture covered a special safeguard mechanism for developing countries; a decision on export subsidies and other “export competition” elements; a decision on cotton; and public stockholding for food security purposes. The decisions, which are legally binding, represent the “most significant outcome on agriculture” seen in the WTO’s 20-year history, according to the WTO Director General. Despite the significant outcome for agriculture, the text of the ministerial declaration shows that members were unable to overcome profound differences in other key areas, with the document explicitly stating that WTO members remain at odds over the reaffirmation of the Doha Round and subsequent ministerial declarations and decisions. The declaration has shed little light on what lies ahead for the negotiating function of the global trade body, which has long struggled to move out of the shadow cast by the continued lack of resolution in the Doha Round trade talks. In short, observers note that the Nairobi ministerial ultimately yielded some substantive decisions for negotiators to applaud. However, the road ahead for the WTO may still be a rocky one.

Quarterly Market Outlook Regional Trade Agreement
International Sugar Organization 50 MECAS(16)02
REGIONAL TRADE AGREEMENTS
• EU-Canada FTA yet to be ratified • TPP signed, starting 2-year
ratification window • EU and US press for TTIP conclusion
EU-Canada Over a year after negotiations were concluded for an EU-Canada trade deal, the prospects and timing for ratification remain unclear, despite hopes expressed by officials on both sides in recent weeks that the agreement will receive lawmakers’ approval in 2016. Negotiations for the deal were concluded in September 2014, following over six years of difficult talks. However, some of the pact’s provisions, particularly those relating to investor protections and investor-state dispute settlement (ISDS), have proven particularly controversial in the time being, sparking questions over whether a ratification vote will indeed be successful. Trans-Pacific Partnership The Trans-Pacific Partnership (TPP) was signed by ministers from its 12 nations in New Zealand on February 4th. Whilst the signing ceremony is another step towards the TPP becoming a reality, the trade pact continues to face opposition. The 12 nations now have two years to ratify or reject the pact. The deal - which will cut tariffs, improve access to markets and set common ground on labour and environmental standards and intellectual property protections - was finally reached in October las year after five years of negotiation. The TPP involves the US, Japan, Malaysia, Vietnam, Singapore, Brunei, Australia, New Zealand, Canada, Mexico, Chile and Peru. The deal triggered protests in New Zealand and has also drawn international criticism. Questions have also been raised over the ratification process as it coincides with the build-up to this year's US presidential election. The Special Focus in the previous edition of the Quarterly Market Outlook considered the impact of the Trans-Pacific Partnership agreement for sugar trade. TTIP(EU-US) The EU Trade Commissioner has stressed that one of the key areas for progress this year is the Transatlantic Trade and Investment Partnership (TTIP). Washington and Brussels have held eleven negotiating rounds to date since the talks first began in 2013. Following the latest round in
October 2015, US and EU officials confirmed their interest in finishing the negotiations before US President Barack Obama leaves office.

Quarterly Market Outlook World Sugar Balances
International Sugar Organization 51 MECAS(16)02
WORLD SUGAR BALANCE 2015/16
(thousand tonnes, tel quel - October/ September Year)
Begin. Production Consumption Change Ending Imports Exports Total net stock stock stock imports exports WESTERN EUROPE EU + 8358 14082 * 18496 * -1769 6589 3995 1350 2645 - Austria 445 322 - - Belgium-Luxemburg 735 608 - - Bulgaria 0 294 - - Croatia 145 159 - - Cyprus 0 29 - - Czech Republic 490 496 - - Estonia 0 83 - - Denmark 310 271 - - Finland 65 207 - - France 4000 2395 - - Germany 2985 3105 - - Greece 50 328 - - Hungary 102 349 - - I reland 0 182 - - I taly 405 1730 - - Latvia 0 65 - - Lithuania 100 85 - - Malta 0 25 - - Netherlands 820 721 - - Poland 1325 1675 - - Portugal 0 308 - - Romania 165 625 - - Slovakia 180 238 - - Slovenia 0 112 - - Spain 550 1331 - - Sweden 225 413 - - UK 985 2340 - - French Territories 12 0 19 0 12 19 0 19 - Gibraltar 1 0 1 0 1 1 0 1 - Iceland 5 0 10 0 5 10 0 10 - Norway 0 0 121 1 1 122 0 122 - Switzerland 145 305 * 400 0 145 100 5 95 - Total 8521 14387 19047 -1768 6753 4247 0 1355 2892 0 EASTERN EUROPE and CIS Albania 41 4 88 0 41 84 0 84 - Armenia 15 0 105 0 15 105 0 105 - Azerbaijan 261 25 180 0 261 257 102 155 - Belarus 346 425 397 0 346 277 305 - 28 Bosnia 25 0 145 0 25 145 0 145 - Georgia 197 0 140 0 197 174 34 140 - Kazakhstan 171 3 495 0 171 502 10 492 - Kyrgyzstan 112 20 117 0 112 97 0 97 - Macedonia 41 10 81 0 41 71 0 71 - Moldova 111 90 87 0 111 7 10 - 3 Russia 1238 5150 * 5550 0 1238 410 10 400 - Serbia & Montenegro 119 500 316 0 119 44 228 - 184 Tajikistan 14 0 127 0 14 127 0 127 - Turkmenistan 21 10 111 0 21 101 0 101 - Ukraine 2056 1450 * 1840 -515 1541 0 125 - 125 Uzbekistan 239 0 570 0 239 570 0 570 - Total 5007 7687 10349 -515 4492 2971 824 2487 340 NORTH AND CENTRAL AMERICA Canada 1425 83 1225 0 1425 1172 30 1142 - USA 4132 7500 * 10240 * -195 3937 2650 105 2545 - Mexico 2304 5985 4310 0 2304 10 1685 - 1675 Bahamas 0 0 12 0 0 12 0 12 - Barbados 22 30 14 0 22 14 30 - 16 Belize 23 115 16 0 23 10 109 - 99 Bermuda 3 0 1 0 3 1 0 1 - Costa Rica 178 440 246 0 178 0 194 - 194 Cuba 241 1900 * 595 0 241 0 1305 - 1305 Dominican Republic 586 510 387 0 586 60 183 - 123 El Salvador 545 790 330 0 545 0 460 - 460 Guatemala 1224 2950 753 0 1224 0 2197 - 2197 Haiti 113 0 181 0 113 181 0 181 - Honduras 262 525 365 0 262 0 160 - 160 Jamaica 258 155 123 0 258 63 95 - 32 Netherlands Antilles 1 0 12 0 1 17 5 12 - Nicaragua 164 700 274 0 164 0 426 - 426 Panama 113 170 137 0 113 0 33 - 33 St Christopher 0 0 2 0 0 2 0 2 -

Quarterly Market Outlook World Sugar Balances
International Sugar Organization 52 MECAS(16)02
WORLD SUGAR BALANCE (cont.) 2015/16
(thousand tonnes, tel quel - October/ September Year)
Begin. Production Consumption Change Ending Imports Exports Total net stock stock stock imports exports Trinidad & Tobago 15 0 66 0 15 66 0 66 - Other Carrebeans 21 0 39 0 21 44 5 39 - Total 11630 21853 19328 -195 11435 4302 7022 4000 6720 SOUTH AMERICA 18318 Argentina 1841 2100 1715 0 1841 0 385 - 385 Bolivia 368 415 * 387 0 368 22 50 - 28 Brazil 586 35000 * 11875 * 125 711 0 23000 - 23000 Chile 725 260 800 0 725 540 0 540 - Colombia 293 2385 * 1705 * 0 293 50 730 - 680 Ecuador 248 610 565 0 248 5 50 - 45 Guyana 314 205 27 0 314 10 188 - 178 Paraguay 35 160 133 0 35 12 39 - 27 Peru 489 1195 1220 0 489 135 110 25 - Suriname 14 7 21 0 14 14 0 14 - Uruguay 28 25 144 0 28 129 10 119 - Venezuela 75 505 1270 0 75 765 0 765 - Total 5016 42867 19862 125 5141 1682 24562 1463 24343 MIDDLE EAST and NORTHERN AFRICA Algeria 952 0 1395 * 0 952 1795 400 1395 - Djibouti 205 0 18 0 205 78 60 18 - Egypt, Arab Republic 1477 1920 3390 0 1477 1595 125 1470 - Eretria 20 0 49 0 20 49 0 49 - Iran 348 1400 2780 95 443 1475 0 1475 - Iraq 465 0 815 0 465 815 0 815 - Israel 306 0 493 0 306 493 0 493 - Jordan 78 0 300 0 78 300 0 300 - Kuwait 84 0 104 0 84 104 0 104 - Lebanon 324 0 179 0 324 179 0 179 - Libyan Arab Jamahiriya 52 0 190 0 52 190 0 190 - Mauritania 15 0 163 0 15 194 31 163 - Morocco 1192 480 1301 0 1192 821 0 821 - Persian Gulf 55 0 177 0 55 177 0 177 - Saudi Arabia 813 0 1202 0 813 1477 275 1202 - Somalia 164 25 224 0 164 199 0 199 - Sudan 879 800 1480 0 879 953 273 680 - Syrian Arab Republic 279 160 625 0 279 465 0 465 - Tunisia 83 0 436 0 83 436 0 436 - Turkey 1241 2350 2390 0 1241 55 15 40 - United Arab Emirates 755 0 232 0 755 1974 1742 232 - Yemen 425 0 583 0 425 583 0 583 - Total 10212 7135 18526 95 10307 14407 2921 11486 0 FAR EAST and OCEANIA Australia 1929 4800 1005 0 1929 120 3915 - 3795 Brunei 9 0 13 0 9 13 0 13 - Cambodia 41 55 268 0 41 362 149 213 - China 9786 9750 * 15640 -1380 8406 4575 65 4510 - China (Taiwan) 161 60 620 0 161 565 5 560 - Fiji 78 205 36 0 78 3 172 - 169 Hong Kong 128 0 162 0 128 177 15 162 - Indonesia 1068 2475 * 6520 -95 973 3950 0 3950 - Japan 606 685 2205 0 606 1525 5 1520 - Korea, DPR 126 0 88 0 126 88 0 88 - Korea, Republic of 982 0 1585 * 0 982 1935 350 1585 - Laos, DPR 69 54 80 0 69 76 50 26 - Macao 6 0 6 0 6 6 0 6 - Malaysia 1284 13 1720 -60 1224 1747 100 1647 - Mongolia 32 0 28 0 32 28 0 28 - Myanmar 78 268 385 0 78 137 20 117 - New Zealand 73 0 221 0 73 241 20 221 - Papua New Guinea 13 33 50 0 13 17 0 17 - Philippines 721 2250 * 2395 -100 621 130 85 45 - Singapore 55 0 280 0 55 355 75 280 - Thailand 4960 10850 * 2875 * -475 4485 0 8450 - 8450 Vietnam SR 199 1500 * 1710 * 0 199 290 80 210 - Samoa 10 0 2 0 10 2 0 2 -

Quarterly Market Outlook World Sugar Balances
International Sugar Organization 53 MECAS(16)02
WORLD SUGAR BALANCE (cont.) 2015/16
(thousand tonnes, tel quel - October/ September Year)
Begin. Production Consumption Change Ending Imports Exports Total net stock stock stock imports exports Other Oceania 26 0 28 0 26 28 0 28 - Total 22440 32998 37922 -2110 20330 16370 13556 15228 12414 INDIAN SUBCONTINENT Afghanistan 147 0 260 0 147 260 0 260 - Bangladesh 732 101 2090 0 732 2089 100 1989 - India 13465 26500 * 25150 * -550 12915 1500 3400 - 1900 Maldives 27 0 7 0 27 7 0 7 - Nepal 1 140 161 10 11 41 10 31 - Pakistan 1870 5325 * 5000 -100 1770 10 435 - 425 Sri Lanka 192 50 680 0 192 630 0 630 - Total 16434 32116 33348 -640 15794 4537 3945 2917 2325 EQUATORIAL and SOUTHERN AFRICA Angola 40 40 335 0 40 295 0 295 - Benin 96 10 82 0 96 82 10 72 - Botswana 47 0 68 0 47 68 0 68 - Burkina Faso 29 45 95 0 29 55 5 50 - Burundi 5 24 33 0 5 9 0 9 - Cameroon UR 51 150 * 220 * 0 51 75 5 70 - Cape Verde 10 0 18 0 10 18 0 18 - Central African Republic 7 5 21 0 7 16 0 16 - Chad 27 35 120 0 27 85 0 85 - Comoros 1 0 10 0 1 10 0 10 - Congo, Dem. Rep. 25 70 245 0 25 175 0 175 - Congo 191 80 95 0 191 16 1 15 - Cote d'Ivoire 336 170 294 0 336 134 10 124 - Ethiopia 134 625 473 0 134 25 177 - 152 Gabon 7 26 34 0 7 8 0 8 - Gambia 48 0 78 0 48 78 0 78 - Ghana 102 0 270 0 102 315 45 270 - Guinea 89 25 168 0 89 143 0 143 - Guinea Bissau 8 0 21 0 8 21 0 21 - Kenya 82 625 896 0 82 271 0 271 - Liberia 10 0 19 0 10 19 0 19 - Madagascar 47 105 160 0 47 100 45 55 - Malawi 120 315 237 0 120 0 78 - 78 Mali 13 35 151 0 13 116 0 116 - Mauritius 286 405 37 0 286 35 403 - 368 Mozambique 228 450 181 0 228 0 269 - 269 Namibia 13 0 80 0 13 120 40 80 - Niger 11 10 111 0 11 101 0 101 - Nigeria 398 60 1575 * 0 398 1515 0 1515 - Rwanda 25 10 70 0 25 60 0 60 - Senegal 56 110 261 0 56 151 0 151 - Sierra Leone 16 0 32 0 16 32 0 32 - South Africa 1643 1850 * 2029 0 1643 329 150 179 - Swaziland 627 750 57 0 627 0 693 - 693 Tanzania, United Rep. 711 340 500 0 711 165 5 160 - Togo 23 0 97 0 23 117 20 97 - Uganda 265 480 335 0 265 65 210 - 145 Zambia 153 440 182 0 153 0 258 - 258
Zimbabwe 128 500 465 0 128 105 140 - 35
Other Africa 192 0 21 0 192 21 0 21 - Total 6300 7790 10176 0 6300 4950 2564 4384 1998 World Total 85560 166833 171851 & -5008 80552 56759 & 56749 48150 48140 & Including adjustment for unknown net trade of 3.293 mln t * Production and consumption estimates that have changed since the last issue of the Quarterly Market Outlook
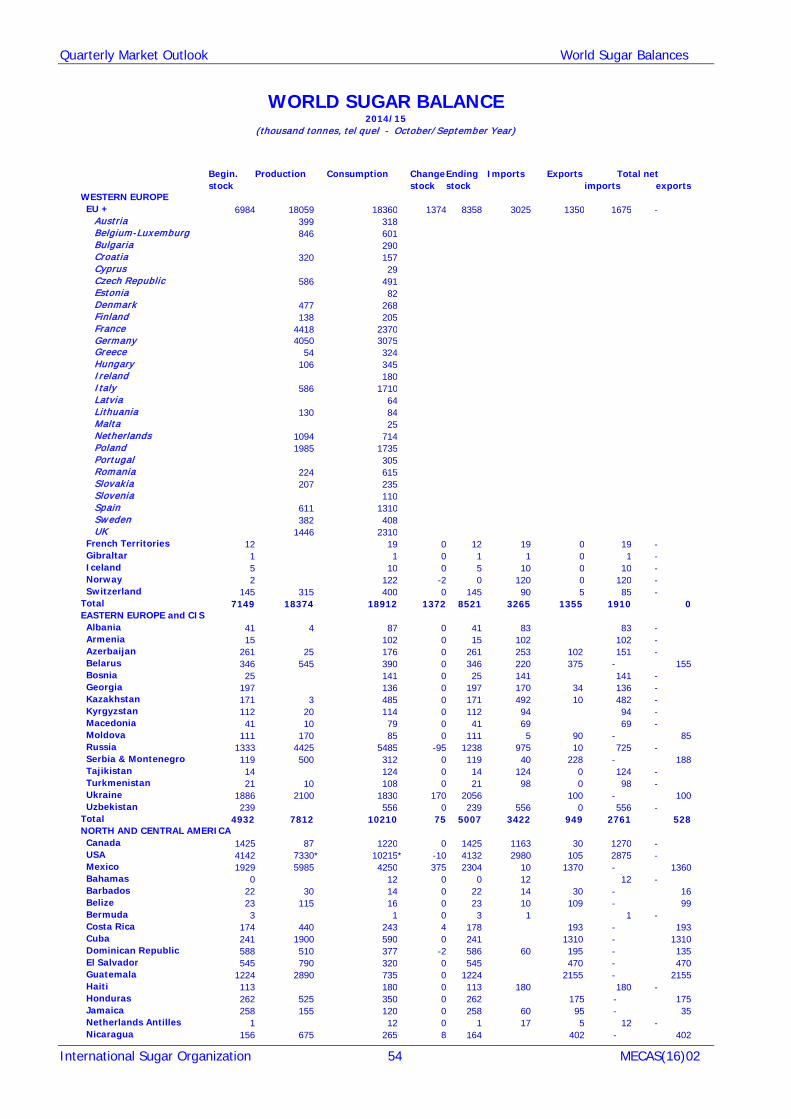
Quarterly Market Outlook World Sugar Balances
International Sugar Organization 54 MECAS(16)02
WORLD SUGAR BALANCE
2014/15 (thousand tonnes, tel quel - October/ September Year)
Begin. Production Consumption Change Ending Imports Exports Total net stock stock stock imports exports WESTERN EUROPE EU + 6984 18059 18360 1374 8358 3025 1350 1675 - Austria 399 318 Belgium-Luxemburg 846 601 Bulgaria 290 Croatia 320 157 Cyprus 29 Czech Republic 586 491 Estonia 82 Denmark 477 268 Finland 138 205 France 4418 2370 Germany 4050 3075 Greece 54 324 Hungary 106 345 I reland 180 I taly 586 1710 Latvia 64 Lithuania 130 84 Malta 25 Netherlands 1094 714 Poland 1985 1735 Portugal 305 Romania 224 615 Slovakia 207 235 Slovenia 110 Spain 611 1310 Sweden 382 408 UK 1446 2310 French Territories 12 19 0 12 19 0 19 - Gibraltar 1 1 0 1 1 0 1 - Iceland 5 10 0 5 10 0 10 - Norway 2 122 -2 0 120 0 120 - Switzerland 145 315 400 0 145 90 5 85 - Total 7149 18374 18912 1372 8521 3265 1355 1910 0 EASTERN EUROPE and CIS Albania 41 4 87 0 41 83 83 - Armenia 15 102 0 15 102 102 - Azerbaijan 261 25 176 0 261 253 102 151 - Belarus 346 545 390 0 346 220 375 - 155 Bosnia 25 141 0 25 141 141 - Georgia 197 136 0 197 170 34 136 - Kazakhstan 171 3 485 0 171 492 10 482 - Kyrgyzstan 112 20 114 0 112 94 94 - Macedonia 41 10 79 0 41 69 69 - Moldova 111 170 85 0 111 5 90 - 85 Russia 1333 4425 5485 -95 1238 975 10 725 - Serbia & Montenegro 119 500 312 0 119 40 228 - 188 Tajikistan 14 124 0 14 124 0 124 - Turkmenistan 21 10 108 0 21 98 0 98 - Ukraine 1886 2100 1830 170 2056 100 - 100 Uzbekistan 239 556 0 239 556 0 556 - Total 4932 7812 10210 75 5007 3422 949 2761 528 NORTH AND CENTRAL AMERICA Canada 1425 87 1220 0 1425 1163 30 1270 - USA 4142 7330 * 10215 * -10 4132 2980 105 2875 - Mexico 1929 5985 4250 375 2304 10 1370 - 1360 Bahamas 0 12 0 0 12 12 - Barbados 22 30 14 0 22 14 30 - 16 Belize 23 115 16 0 23 10 109 - 99 Bermuda 3 1 0 3 1 1 - Costa Rica 174 440 243 4 178 193 - 193 Cuba 241 1900 590 0 241 1310 - 1310 Dominican Republic 588 510 377 -2 586 60 195 - 135 El Salvador 545 790 320 0 545 470 - 470 Guatemala 1224 2890 735 0 1224 2155 - 2155 Haiti 113 180 0 113 180 180 - Honduras 262 525 350 0 262 175 - 175 Jamaica 258 155 120 0 258 60 95 - 35 Netherlands Antilles 1 12 0 1 17 5 12 - Nicaragua 156 675 265 8 164 402 - 402

Quarterly Market Outlook World Sugar Balances
International Sugar Organization 55 MECAS(16)02
WORLD SUGAR BALANCE (cont.) 2014/15
(thousand tonnes, tel quel - October/ September Year)
Begin. Production Consumption Change Ending Imports Exports Total net stock stock stock imports exports Panama 113 170 134 0 113 36 - 36 St Christopher 0 2 0 0 2 2 - Trinidad & Tobago 13 66 2 15 68 68 - Other Carrebeans 21 39 0 21 44 5 39 - Total 11253 21602 19161 377 11630 4621 6685 4459 6386 SOUTH AMERICA Argentina 1841 2025 1696 0 1841 329 - 329 Bolivia 368 430 * 375 0 368 10 65 - 55 Brazil 2059 33800 * 12000 * -1473 586 23273 - 23273 Chile 721 260 782 4 725 526 526 - Colombia 303 2382 * 1681 * -10 293 62 773 - 711 Ecuador 248 610 557 0 248 5 58 - 53 Guyana 314 205 27 0 314 10 188 - 178 Paraguay 35 160 131 0 35 10 39 - 29 Peru 494 1195 1195 -5 489 115 120 - 5 Suriname 11 7 21 3 14 17 17 - Uruguay 28 25 140 0 28 125 10 115 - Venezuela 75 505 1245 0 75 740 740 - Total 6497 41604 19850 -1481 5016 1620 24855 1398 24633 MIDDLE EAST and NORTHERN AFRICA Algeria 952 1370 0 952 1770 400 1370 - Djibouti 205 18 0 205 78 60 18 - Egypt, Arab Republic 1477 1920 3265 0 1477 1470 125 1345 - Eretria 20 49 0 20 49 49 - Iran 748 1400 2705 -400 348 905 905 - Iraq 465 795 0 465 795 795 - Israel 306 486 0 306 486 486 - Jordan 78 294 0 78 294 294 - Kuwait 84 101 0 84 101 101 - Lebanon 324 173 0 324 173 173 - Libyan Arab Jamahiriya 52 190 0 52 190 190 - Mauritania 15 159 0 15 190 31 159 - Morocco 1192 480 1260 0 1192 780 780 - Persian Gulf 55 172 0 55 172 172 - Saudi Arabia 813 1155 0 813 1430 275 1155 - Somalia 164 25 219 0 164 194 194 - Sudan 879 750 1382 0 879 905 273 632 - Syrian Arab Republic 279 160 625 0 279 465 465 - Tunisia 83 425 0 83 425 425 - Turkey 1241 2245 2330 0 1241 100 15 85 - United Arab Emirates 915 220 -160 755 1902 1842 60 - Yemen 425 571 0 425 571 571 - Total 10772 6980 17964 -560 10212 13445 3021 10424 0 FAR EAST and OCEANIA Australia 1929 4450 1005 0 1929 120 3565 - 3445 Brunei 9 13 0 9 13 0 13 - Cambodia 41 55 256 0 41 350 149 201 - China 9820 10556 15300 -34 9786 4775 65 4710 - China (Taiwan) 161 60 619 0 161 564 5 559 - Fiji 78 205 36 0 78 3 172 - 169 Hong Kong 128 162 0 128 177 15 162 - Indonesia 1068 2525 6265 0 1068 3740 3740 - Japan 606 685 2200 0 606 1520 5 1515 - Korea, DPR 126 88 0 126 88 88 - Korea, Republic of 982 1550 * 0 982 1900 350 1550 - Laos, DPR 69 54 74 0 69 70 50 20 - Macao 6 6 0 6 6 6 - Malaysia 1234 13 1660 50 1284 1797 100 1697 - Mongolia 32 28 0 32 28 28 - Myanmar 78 268 360 0 78 112 20 92 - New Zealand 73 220 0 73 240 20 220 - Papua New Guinea 10 33 48 3 13 18 18 - Philippines 721 2320 2275 0 721 45 - 45 Singapore 55 278 0 55 353 75 278 -

Quarterly Market Outlook World Sugar Balances
International Sugar Organization 56 MECAS(16)02
WORLD SUGAR BALANCE (cont.) 2014/15
(thousand tonnes, tel quel - October/ September Year)
Begin. Production Consumption Change Ending Imports Exports Total net stock stock stock imports exports Thailand 4249 11300 2797 * 711 4960 7792 - 7792 Vietnam SR 199 1425 1700 0 199 385 110 - - Western Samoa 10 2 0 10 2 2 - Other Oceania 26 27 0 26 27 27 - Total 21710 33949 36969 730 22440 16288 12538 14926 11451 INDIAN SUBCONTINENT Afghanistan 147 251 0 147 251 251 - Bangladesh 708 101 1960 24 732 1983 100 1883 - India 11140 28200 24750 2325 13465 1250 2375 - 1125 Maldives 26 7 1 27 8 8 - Nepal 5 129 157 -4 1 34 10 24 - Pakistan 2120 5200 4850 -250 1870 10 610 - 600 Sri Lanka 192 50 665 0 192 615 615 - Total 14338 33680 32640 2096 16434 4151 3095 2781 1725 EQUATORIAL and SOUTHERN AFRICA Angola 40 20 322 0 40 302 302 - Benin 96 10 80 0 96 80 10 70 - Botswana 47 0 67 0 47 67 67 - Burkina Faso 29 45 92 0 29 52 5 47 - Burundi 5 24 32 0 5 8 8 - Cameroon UR 91 110 200 * -40 51 55 5 50 - Cape Verde 10 17 0 10 17 17 - Central African Republic 4 5 20 3 7 18 18 - Chad 27 35 115 0 27 80 80 - Comoros 1 10 0 1 10 10 - Congo, Dem. Rep. 25 70 235 0 25 165 165 - Congo 191 80 93 0 191 14 1 13 - Cote d'Ivoire 336 170 284 0 336 124 10 114 - Ethiopia 112 425 458 22 134 110 55 55 - Gabon 7 26 32 0 7 6 6 - Gambia 48 76 0 48 76 76 - Ghana 2 262 100 102 407 45 362 - Guinea 89 25 162 0 89 137 137 - Guinea Bissau 8 20 0 8 20 20 - Kenya 82 625 875 0 82 250 250 - Liberia 9 18 1 10 19 19 - Madagascar 47 105 155 0 47 95 45 50 - Malawi 120 315 231 0 120 84 - 84 Mali 13 35 145 0 13 110 110 - Mauritius 286 405 35 0 286 35 405 - 370 Mozambique 228 435 178 0 228 257 - 257 Namibia 13 79 0 13 119 40 - Niger 11 10 107 0 11 97 97 - Nigeria 398 40 1550 * 0 398 1510 1510 - Rwanda 27 10 65 -2 25 53 53 - Senegal 56 110 250 0 56 140 140 - Sierra Leone 16 31 0 16 31 31 - South Africa 2050 1550 * 1975 -407 1643 675 657 18 - Swaziland 627 734 55 0 627 679 - 679 Tanzania, United Rep. 711 340 495 0 711 160 5 155 - Togo 23 92 0 23 112 20 92 - Uganda 265 480 326 0 265 65 219 - 154 Zambia 153 440 175 0 153 265 - 265
Zimbabwe 108 500 460 20 128 105 125 - 20 Other Africa 192 0 21 0 192 21 21 - Total 6603 7179 9895 -303 6300 5345 2932 4163 1829 WORLD TOTAL 83254 171180 168894 & 2306 85560 55450 & 55430 46115 46552 & Including adjustment for unknown net trade of 3.293 mln t * Production and consumption estimates that have changed since the last issue of the Quarterly Market Outlook

Quarterly Market Outlook World Sugar Balances
International Sugar Organization 57 MECAS(16)02
WORLD SUGAR BALANCE (cont.) 2013/14
(thousand tonnes, tel quel - October/ September Year) Begin. Production Consumption Change Ending Imports Exports Total net stock stock stock imports exports WESTERN EUROPE EU + 7298 15651 18200 -314 6984 3,669 1434 2235 - Austria 484 316 Belgium-Luxemburg 783 597 Bulgaria 288 Croatia 193 155 Cyprus 29 Czech Republic 539 488 Estonia 81 Denmark 462 266 Finland 117 203 France 3815 2350 Germany 3121 3050 Greece 160 322 Hungary 116 342 I reland 178 I taly 508 1697 Latvia 0 63 Lithuania 172 83 Malta 0 25 Netherlands 947 708 Poland 1713 1716 Portugal 0 304
Romania
257
603
262 607 Slovakia 219 230 Slovenia 0 109 Spain 449 1297 Sweden 378 405 UK 1213 2291 French Territories 16 19 -4 12 15 15 - Gibraltar 1 1 0 1 1 1 - Iceland 6 10 -1 5 9 9 - Norway 3 124 -1 2 123 123 - Switzerland 101 266 385 44 145 169 6 163 - Total 7425 15917 18739 -276 7149 3986 1440 2546 0 EASTERN EUROPE and CIS Albania 40 4 86 1 41 83 83 - Armenia 23 5 101 -8 15 89 1 88 - Azerbaijan 260 32 174 1 261 285 142 143 - Belarus 396 536 382 -50 346 230 434 - 204 Bosnia 25 140 0 25 140 140 - Georgia 182 134 15 197 476 327 149 - Kazakhstan 231 5 478 -60 171 420 7 413 - Kyrgyzstan 129 17 113 -17 112 79 79 - Macedonia 47 23 79 -6 41 50 50 - Moldova 103 157 81 8 111 1 69 - 68 Russia 906 4772 5415 427 1333 1073 3 725 - Serbia & Montenegro 101 503 310 18 119 175 - 175 Tajikistan 15 123 -1 14 122 122 - Turkmenistan 29 9 105 -8 21 88 88 - Ukraine 2161 1582 1850 -275 1886 1 8 - 7 Uzbekistan 261 0 548 -22 239 526 526 - Total 4909 7645 10119 23 4932 3663 1166 2606 454 NORTH AND CENTRAL AMERICA Canada 1403 94 1201 22 1425 1150 21 1270 - USA 4473 7169 10379 -331 4142 3134 255 2879 - Mexico 2556 6021 4099 -627 1929 9 2558 - 2549 Bahamas 1 12 -1 0 11 11 - Barbados 26 17 14 -4 22 8 15 - 7 Belize 25 118 16 -2 23 104 - 104 Bermuda 3 1 0 3 1 1 - Costa Rica 105 466 239 69 174 158 - 158 Cuba 202 1600 579 39 241 982 - 982 Dominican Republic 619 540 367 -31 588 204 - 204 El Salvador 519 752 315 26 545 411 - 411 Guatemala 892 2858 717 332 1224 1809 - 1809 Haiti 141 180 -28 113 152 152 - Honduras 304 519 335 -42 262 226 - 226

Quarterly Market Outlook World Sugar Balances
International Sugar Organization 58 MECAS(16)02
WORLD SUGAR BALANCE (cont.) 2013/14
(thousand tonnes, tel quel - October/ September Year)
Begin. Production Consumption Change Ending Imports Exports Total net stock stock stock imports exports Jamaica 245 148 106 13 258 59 88 - 29 Netherlands Antilles 6 12 -5 1 7 7 - Nicaragua 164 687 257 -8 156 438 - 438 Panama 129 170 132 -16 113 54 - 54 St Christopher 0 2 0 0 2 2 - Trinidad & Tobago 28 66 -15 13 51 51 - Other Caribbeans 42 39 -21 21 27 9 18 - Total 11883 21159 19068 -630 11253 4611 7332 4391 6971 SOUTH AMERICA Argentina 1885 1749 1644 -44 1841 149 - 149 Bolivia 345 459 364 23 368 4 76 - 72 Brazil 712 37811 12124 * 1347 2059 1 24341 - 24340 Chile 757 256 766 -36 721 474 474 - Colombia 314 2404 1698 -11 303 135 852 - 717 Ecuador 266 520 550 -18 248 24 12 12 - Guyana 313 206 27 1 314 8 186 - 178 Paraguay 9 208 129 26 35 53 - 53 Peru 422 1197 1172 72 494 164 117 47 - Suriname 16 21 -5 11 16 16 -
Uruguay 30 22
137
-2 28 113
113 - Venezuela 19 519 1219 56 75 756 756 - Total 5088 45351 19851 1409 6497 1695 25786 1418 25509 MIDDLE EAST and NORTHERN AFRICA Algeria 873 1343 79 952 1889 467 1422 - Djibouti 195 18 10 205 184 156 28 - Egypt, Arab Republic 1382 1924 3146 95 1477 1463 146 1317 - Eretria 23 46 -3 20 43 43 - Iran 487 1303 2640 261 748 1629 31 1598 - Iraq 549 775 -84 465 691 691 - Israel 278 479 28 306 507 507 - Jordan 73 291 5 78 297 1 296 - Kuwait 82 99 2 84 101 101 - Lebanon 286 1 167 38 324 256 52 204 - Libyan Arab Jamahiriya 50 190 2 52 192 192 - Mauritania 2 156 13 15 275 106 169 - Morocco 1180 480 1224 12 1192 763 7 756 - Persian Gulf 26 168 29 55 197 197 - Saudi Arabia 756 1111 57 813 1398 230 1168 - Somalia 144 23 215 20 164 381 169 212 - Sudan 954 683 1262 -75 879 848 344 504 - Syrian Arab Republic 235 131 625 44 279 538 538 - Tunisia 112 389 -29 83 360 360 - Turkey 1129 2388 2265 112 1241 6 17 - 11 United Arab Emirates 432 215 483 915 2710 2012 698 - Yemen 357 560 68 425 703 75 628 - Total 9605 6933 17384 1167 10772 15431 3813 11629 11 FAR EAST and OCEANIA Australia 2103 4012 956 -174 1929 142 3372 - 3230 Brunei 9 13 0 9 13 13 - Cambodia 77 55 244 -36 41 559 406 153 - China 7718 12791 14926 2102 9820 4284 47 4237 - China (Taiwan) 152 56 619 9 161 573 1 572 - Fiji 77 240 29 1 78 2 212 - 210 Hong Kong 130 162 -2 128 176 16 160 - Indonesia 1091 2528 6010 -23 1068 3459 3459 - Japan 765 681 2185 -159 606 1346 1 1345 - Korea, DPR 121 88 5 126 93 93 - Korea, Republic of 963 1538 19 982 1872 315 1557 - Laos, DPR 22 86 69 47 69 40 10 30 - Macao 6 6 0 6 6 6 - Malaysia 1113 9 1600 121 1234 1990 278 1712 - Mongolia 33 28 -1 32 27 27 - Myanmar 56 280 338 22 78 148 68 80 - New Zealand 67 220 6 73 253 27 226 - Papua New Guinea 13 34 46 -3 10 12 3 9 - Philippines 621 2480 2172 100 721 208 - 208 Singapore 51 275 4 55 350 71 279 -

Quarterly Market Outlook World Sugar Balances
International Sugar Organization 59 MECAS(16)02
WORLD SUGAR BALANCE (cont.) 2013/14
(thousand tonnes, tel quel - October/ September Year)
Begin. Production Consumption Change Ending Imports Exports Total net stock stock stock imports exports Thailand 2034 11284 2760 2215 4249 6309 - 6309 Vietnam SR 372 1590 1690 -173 199 169 242 - 73 Western Samoa 10 2 0 10 2 2 - Other Oceania 8 27 18 26 48 3 45 - Total 17612 36126 36003 4098 21710 15564 11589 14005 10030 INDIAN SUBCONTINENT Afghanistan 86 239 61 147 446 146 300 - Bangladesh 542 110 1830 166 708 1955 69 1886 - India 11911 24396 23988 -771 11140 1401 2580 - 1179 Maldives 27 7 -1 26 6 6 - Nepal 1 141 154 4 5 17 17 - Pakistan 1581 5960 4704 539 2120 9 726 - 717 Sri Lanka 153 53 654 39 192 640 640 - Total 14301 30660 31576 37 14338 4474 3521 2849 1896 EQUATORIAL and SOUTHERN AFRICA Angola 44 310 -4 40 419 113 306 - Benin 88 10 78 8 96 116 40 76 - Botswana 48 67 -1 47 66 66 - Burkina Faso 28 31 88 1 29 58 58 - Burundi 0 28 32 5 5 9 9 - Cameroon UR 74 119 150 17 91 53 5 48 - Cape Verde 13 17 -3 10 14 14 - Central African Republic 6 10 20 -2 4 8 8 - Chad 23 34 109 4 27 79 79 - Comoros 3 10 -2 1 8 8 - Congo, Dem 53 64 227 -28 25 135 135 - Congo 192 68 89 -1 191 23 3 20 - Cote d'Ivoire 278 182 275 58 336 160 9 151 - Ethiopia 105 387 442 7 112 62 62 - Gabon 5 23 30 2 7 9 9 - Gambia 26 76 22 48 133 35 98 - Ghana 102 255 -100 2 329 174 155 - Guinea 64 23 156 25 89 158 158 - Guinea Bissau 13 19 -5 8 14 14 - Kenya 101 637 856 -19 82 200 200 - Liberia 10 18 -1 9 17 17 - Madagascar 26 76 114 21 47 116 57 59 - Malawi 155 298 226 -35 120 107 - 107 Mali 13 39 139 0 13 100 100 - Mauritius 319 395 30 -33 286 37 435 - 398 Mozambique 163 407 176 65 228 91 257 - 166 Namibia 11 78 2 13 89 9 - Niger 14 10 103 -3 11 90 90 - Nigeria 375 11 1382 23 398 1400 6 1394 - Rwanda 25 9 55 2 27 48 48 - Senegal 49 108 239 7 56 138 138 - Sierra Leone 10 10 30 6 16 26 26 - South Africa 1644 2464 1923 406 2050 663 798 - 135 Swaziland 605 626 53 22 627 551 - 551 Tanzania, United Rep. 754 278 409 -43 711 88 88 - Togo 31 87 -8 23 105 26 79 - Uganda 240 420 366 25 265 92 121 - 29 Zambia 173 377 169 -20 153 228 - 228 Zimbabwe 322 451 399 -214 108 68 334 - 266 Other Africa 198 22 -6 192 19 3 16 - Total 6403 7595 9324 200 6603 5240 3311 3729 1880
WORLD TOTAL 77226 171386 165357 & 6028 83254 57957 & 57958 46466 46751
& Including adjustment for unknown net trade of 3.293 mln t * Production and consumption estimates that have changed since the last issue of the Quarterly Market Outlook

Quarterly Market Outlook World Sugar Balances
International Sugar Organization 60 MECAS(16)02
RAW AND WHITE TRADE BALANCE (thousand tonnes, tel quel - October/ September Year)
White Sugar Imports Raw Sugar Imports White Sugar Exports Raw Sugar Exports
2015
/16
2014
/15
2013
/14
2015
/16
2014
/15
2013
/14
2014
/15
2014
/15
2013
/14
2015
/16
2014
/15
2013
/14
WESTERN EUROPE EU + 1295 625 979 2700 2400 2690 1345 1345 1430 5 5 4 Austria 0 0 0 0 0 0 0 0 0 0 0 0 Belgium-Luxemburg 0 0 0 0 0 0 0 0 0 0 0 0 Bulgaria 0 0 0 0 0 0 0 0 0 0 0 0 Croatia 0 0 0 0 0 0 0 0 0 0 0 0 Cyprus 0 0 0 0 0 0 0 0 0 0 0 0 Czech Republic 0 0 0 0 0 0 0 0 0 0 0 0 Estonia 0 0 0 0 0 0 0 0 0 0 0 0 Denmark 0 0 0 0 0 0 0 0 0 0 0 0 Finland 0 0 0 0 0 0 0 0 0 0 0 0 France 0 0 0 0 0 0 0 0 0 0 0 0 Germany 0 0 0 0 0 0 0 0 0 0 0 0 Greece 0 0 0 0 0 0 0 0 0 0 0 0 Hungary 0 0 0 0 0 0 0 0 0 0 0 0 I reland 0 0 0 0 0 0 0 0 0 0 0 0 I taly 0 0 0 0 0 0 0 0 0 0 0 0 Latvia 0 0 0 0 0 0 0 0 0 0 0 0 Lithuania 0 0 0 0 0 0 0 0 0 0 0 0 Malta 0 0 0 0 0 0 0 0 0 0 0 0 Netherlands 0 0 0 0 0 0 0 0 0 0 0 0 Poland 0 0 0 0 0 0 0 0 0 0 0 0 Portugal 0 0 0 0 0 0 0 0 0 0 0 0 Romania 0 0 0 0 0 0 0 0 0 0 0 0 Slovakia 0 0 0 0 0 0 0 0 0 0 0 0 Slovenia 0 0 0 0 0 0 0 0 0 0 0 0 Spain 0 0 0 0 0 0 0 0 0 0 0 0 Sweden 0 0 0 0 0 0 0 0 0 0 0 0 UK 0 0 0 0 0 0 0 0 0 0 0 0 French Territories 19 19 15 0 0 0 0 0 0 0 0 0 Gibraltar 1 1 1 0 0 0 0 0 0 0 0 0 Iceland 10 10 9 0 0 0 0 0 0 0 0 0 Norway 121 119 122 1 1 1 0 0 0 0 0 0 Switzerland 94 84 161 6 6 8 5 4 6 0 1 0 Total 1540 858 1287 2707 2407 2699 1350 1349 1436 5 6 4 EASTERN EUROPE and CIS Albania 84 83 83 0 0 0 0 0 0 0 0 0 Armenia 25 22 5 80 80 84 0 0 1 0 0 0 Azerbaijan 7 3 7 250 250 278 102 102 142 0 0 0 Belarus 50 0 0 227 220 230 305 375 434 0 0 0 Bosnia 145 141 140 0 0 0 0 0 0 0 0 0 Georgia 44 40 39 130 130 437 9 9 251 25 25 76 Kazakhstan 102 92 100 400 400 320 10 10 7 0 0 0 Kyrgyzstan 97 94 79 0 0 0 0 0 0 0 0 0 Macedonia 71 69 50 0 0 0 0 0 0 0 0 0 Moldova 7 5 1 0 0 0 10 90 69 0 0 0 Russia 185 425 383 225 550 690 10 10 3 0 0 0 Serbia & Montenegro 44 40 0 0 0 0 228 228 175 0 0 0 Tajikistan 127 124 122 0 0 0 0 0 0 0 0 0 Turkmenistan 101 98 88 0 0 0 0 0 0 0 0 0 Ukraine 0 0 1 0 0 0 125 100 8 0 0 0 Uzbekistan 50 56 23 520 500 503 0 0 0 0 0 0 Total 1139 1292 1121 1832 2130 2542 799 924 1090 25 25 76 NORTH AND CENTRAL AMERICA Canada 22 13 31 1150 1150 1119 30 30 21 0 0 0 USA 1250 1280 1378 1400 1700 1756 105 105 250 0 0 5 Mexico 10 10 8 0 0 1 560 470 949 1125 900 1609 Bahamas 12 12 11 0 0 0 0 0 0 0 0 0 Barbados 14 14 7 0 0 1 0 0 0 30 30 15 Belize 10 10 0 0 0 0 0 0 0 109 109 104 Bermuda 1 1 1 0 0 0 0 0 0 0 0 0 Costa Rica 0 0 0 0 0 0 15 15 17 179 178 141 Cuba 0 0 0 0 0 0 5 25 27 1300 1285 955 Dominican Republic 60 60 0 0 0 0 0 0 0 183 195 204 El Salvador 0 0 0 0 0 0 20 20 29 440 450 382 Guatemala 0 0 0 0 0 0 847 755 933 1350 1400 876

Quarterly Market Outlook World Sugar Balances
International Sugar Organization 61 MECAS(16)02
RAW AND WHITE TRADE BALANCE (cont.) (thousand tonnes, tel quel - October/ September Year)
White Sugar Imports Raw Sugar Imports White Sugar Exports Raw Sugar Exports
2015
/16
2014
/15
2013
/14
2015
/16
2014
/15
2013
/14
2014
/15
2014
/15
2013
/14
2015
/16
2014
/15
2013
/14
Haiti 76 75 60 105 105 92 0 0 0 0 0 0 Honduras 0 0 0 0 0 0 15 35 70 145 140 156 Jamaica 33 30 59 30 30 0 0 0 0 95 95 88 Netherlands Antilles 17 17 7 0 0 0 0 0 0 5 5 0 Nicaragua 0 0 0 0 0 0 76 87 119 350 315 319 Panama 0 0 0 0 0 0 0 0 1 33 36 53 St Christopher 2 2 2 0 0 0 0 0 0 0 0 0 Trinidad & Tobago 61 62 46 5 6 5 0 0 0 0 0 0 Other Central America 19 19 13 25 25 14 5 5 9 0 0 0 Total 1587 1605 1623 2715 3016 2988 1678 1547 2425 5344 5138 4907 SOUTH AMERICA Argentina 0 0 0 0 0 0 220 219 58 165 110 91 Bolivia 22 10 4 0 0 0 25 40 53 25 25 23 Brazil 0 0 1 0 0 0 4250 4953 4836 18750 18320 19505 Chile 380 366 317 160 160 157 0 0 0 0 0 0 Colombia 50 62 135 0 0 0 585 608 687 145 165 165 Ecuador 5 5 24 0 0 0 0 0 0 50 58 12 Guyana 10 10 8 0 0 0 0 0 0 188 188 186 Paraguay 12 10 0 0 0 0 24 24 36 15 15 17 Peru 125 105 161 10 10 3 50 60 50 60 60 67 Suriname 14 17 16 0 0 0 0 0 0 0 0 0 Uruguay 74 70 69 55 55 44 10 10 0 0 0 0 Venezuela 40 15 15 725 725 741 0 0 0 0 0 0 Total 732 670 750 950 950 945 5164 5914 5720 19398 18941 20066 MIDDLE EAST and NORTHERN AFRICA Algeria 120 120 197 1675 1650 1692 400 400 467 0 0 0 Djibouti 78 78 183 0 0 1 60 60 156 0 0 0 Egypt, Arab Republic 345 270 170 1250 1200 1293 125 125 146 0 0 0 Eritrea 49 49 43 0 0 0 0 0 0 0 0 0 Iran 0 200 0 1475 705 1629 0 0 31 0 0 0 Iraq 165 445 679 650 350 12 0 0 0 0 0 0 Israel 253 251 292 240 235 215 0 0 0 0 0 0 Jordan 300 294 297 0 0 0 0 0 1 0 0 0 Kuwait 104 101 100 0 0 1 0 0 0 0 0 0 Lebanon 144 138 162 35 35 94 0 0 52 0 0 0 Libya 190 190 162 0 0 30 0 0 0 0 0 0 Mauritania 170 166 275 24 24 0 31 31 106 0 0 0 Morocco 0 0 0 821 780 763 0 0 7 0 0 0 Persian Gulf 152 147 96 25 25 101 0 0 0 0 0 0 Saudi Arabia 552 530 697 925 900 701 275 275 230 0 0 0 Somalia 174 169 299 25 25 82 0 0 169 0 0 0 Sudan 803 780 848 150 125 0 173 173 221 100 100 123 Syrian Arab Republic 465 465 492 0 0 46 0 0 0 0 0 0 Tunisia 266 275 191 170 150 169 0 0 0 0 0 0 Turkey 55 100 6 0 0 0 15 15 17 0 0 0 United Arab Emirates 449 377 1215 1525 1525 1495 1242 1342 1431 500 500 581 Yemen 483 496 493 100 75 210 0 0 75 0 0 0 Total 5317 5641 6897 9090 7804 8534 2321 2421 3109 600 600 704 FAR EAST and OCEANIA Australia 85 85 52 35 35 90 165 165 137 3750 3400 3235 Brunei 13 13 13 0 0 0 0 0 0 0 0 0 Cambodia 362 350 547 0 0 12 114 114 375 35 35 31 China 625 625 605 3950 4150 3679 61 61 43 4 4 4 China (Taiwan) 125 164 137 440 400 436 4 4 1 1 1 0 Fiji 3 3 2 0 0 0 0 0 0 172 172 212 Hong Kong 177 166 165 0 11 11 14 14 14 1 1 2 Indonesia 675 715 105 3275 3025 3354 0 0 0 0 0 0 Japan 5 5 6 1520 1515 1340 5 5 1 0 0 0 Korea, DPR 88 88 87 0 0 6 0 0 0 0 0 0 Korea, Republic of 185 125 125 1750 1775 1747 350 350 315 0 0 0 Laos, DPR 75 69 38 1 1 2 0 0 10 50 50 0 Macao 6 6 5 0 0 1 0 0 0 0 0 0 Malaysia 47 97 175 1700 1700 1815 100 100 278 0 0 0 Mongolia 28 28 27 0 0 0 0 0 0 0 0 0 Myanmar 137 112 148 0 0 0 14 14 62 6 6 6 New Zealand 31 30 34 210 210 219 20 20 27 0 0 0

Quarterly Market Outlook World Sugar Balances
International Sugar Organization 62 MECAS(16)02
RAW AND WHITE TRADE BALANCE (cont.)
(thousand tonnes, tel quel - October/ September Year) White Sugar Imports Raw Sugar Imports White Sugar Exports Raw Sugar Exports
2015
/16
2014
/15
2013
/14
2015
/16
2014
/15
2013
/14
2014
/15
2014
/15
2013
/14
2015
/16
2014
/15
2013
/14
Papua New Guinea 17 18 12 0 0 0 0 0 3 0 0 0 Philippines 130 0 0 0 0 0 0 0 0 85 45 208 Singapore 355 350 346 0 3 4 74 74 70 1 1 1 Thailand 0 0 0 0 0 0 3700 4025 2796 4750 3767 3513 Vietnam SR 290 385 169 0 0 0 80 110 242 0 0 0 Western Samoa 2 2 2 0 0 0 0 0 0 0 0 0 Other Oceania 18 17 35 10 10 13 0 0 3 0 0 0 Total 3479 3453 2835 12891 12835 12729 4701 5056 4377 8855 7482 7212 INDIAN SUBCONTINENT 0 0 0 0 0 0 0 0 0 0 0 0 Afghanistan 259 250 444 1 1 2 0 0 146 0 0 0 Bangladesh 189 83 86 1900 1900 1869 100 100 69 0 0 0 India 0 0 0 1500 1250 1401 3250 1800 1524 150 575 1056 Maldives 7 8 6 0 0 0 0 0 0 0 0 0 Nepal 41 34 9 0 0 8 10 10 0 0 0 0 Pakistan 10 10 9 0 0 0 435 610 691 0 0 35 Sri Lanka 590 580 591 40 35 49 0 0 0 0 0 0 Total 1097 966 1147 3440 3185 3327 3795 2520 2430 150 575 1091 EQUATORIAL and SOUTHERN AFRICA Angola 295 302 419 0 0 0 0 0 113 0 0 0 Benin 82 80 116 0 0 0 10 10 28 0 0 12 Botswana 48 47 61 20 20 5 0 0 0 0 0 0 Burkina Faso 55 52 58 0 0 0 5 5 0 0 0 0 Burundi 4 3 3 5 5 6 0 0 0 0 0 0 Cameroon UR 70 50 53 5 5 0 5 5 5 0 0 0 Cape Verde 18 17 14 0 0 0 0 0 0 0 0 0 Central African Republic 12 14 4 4 4 4 0 0 0 0 0 0 Chad 85 80 79 0 0 0 0 0 0 0 0 0 Comoros 10 10 8 0 0 0 0 0 0 0 0 0 Congo, Dem 90 80 63 85 85 72 0 0 0 0 0 0 Congo 16 14 23 0 0 0 1 1 1 0 0 2 Cote d'Ivoire 134 94 160 0 30 0 10 10 9 0 0 0 Ethiopia 25 110 56 0 0 6 0 0 0 177 55 0 Gabon 5 3 3 3 3 6 0 0 0 0 0 0 Gambia 78 76 133 0 0 0 0 0 35 0 0 0 Ghana 315 407 329 0 0 0 45 45 174 0 0 0 Guinea 143 137 150 0 0 8 0 0 0 0 0 0 Guinea Bissau 21 20 14 0 0 0 0 0 0 0 0 0 Kenya 271 250 200 0 0 0 0 0 0 0 0 0 Liberia 19 19 17 0 0 0 0 0 0 0 0 0 Madagascar 98 93 114 2 2 2 0 0 1 45 45 56 Malawi 0 0 0 0 0 0 3 4 1 75 80 106 Mali 116 110 90 0 0 10 0 0 0 0 0 0 Mauritius 5 5 11 30 30 26 403 405 435 0 0 0 Mozambique 0 0 77 0 0 14 4 2 1 265 255 256 Namibia 120 94 74 0 25 15 40 40 9 0 0 0 Niger 101 97 90 0 0 0 0 0 0 0 0 0 Nigeria 115 160 2 1400 1350 1398 0 0 6 0 0 0 Rwanda 55 48 38 5 5 10 0 0 0 0 0 0 Senegal 151 140 138 0 0 0 0 0 0 0 0 0 Sierra Leone 32 31 26 0 0 0 0 0 0 0 0 0 South Africa 129 350 326 200 325 337 25 267 341 125 390 457 Swaziland 0 0 0 0 0 0 118 79 33 575 600 518 Tanzania, United Rep. 165 160 87 0 0 1 5 5 0 0 0 0 Togo 117 112 105 0 0 0 20 20 26 0 0 0 Uganda 65 65 92 0 0 0 210 219 121 0 0 0 Zambia 0 0 0 0 0 0 58 65 67 200 200 161 Zimbabwe 90 90 54 15 15 14 0 0 1 140 125 333 Other Africa 21 6 4 0 15 15 0 0 3 0 0 0 Total 3031 3426 3291 1919 1919 1949 962 1182 1410 1602 1750 1901 WORLD TOTAL 21061 20977.5 22017 35698 34472.5 35940 20770 20913 21997 35979 34517 35961

International Sugar OrganizationPUBLICATIONS PRICES FOR 2015
Annual Subscription rate for the Quarterly Market Outlook* is £350 inclusive.Subscription runs from January to December
Seminar Proceedings:2015: Moving Towards a Sweeter Future? Online £3702014: Sugar and Ethanol: Fresh Options Online £1502013: Commercial Success for Sugar Crops - Investment, Innovation and Efficiency Online £150
Workshop Proceedings:2015: What issues will the Sugar Sector need to focus on to
keep ahead of the game Online £2752014: Positioning for the New Market Frontiers Online £702013: Developing Countries - Options for Growth in Sugarcane Online £70
ISO Studies: National Sugar Standards: a Benchmark Survey (MECAS(15)09)* £305Non-Tariff Policy (NTMs/NTBs) in a Global Sugar Trade Context (MECAS(15)08)* £305Domestc Sugar Prices - a Survey (MECAS(15)06)* £305Government Fuel Ethanol Policy (MECAS(14)18)* £305Outlook for Co-generation in Cane Sugar Industries (MECAS(14)17)* £305Australia’s Sugar Industry Outlook (MECAS(14)16)* £305Government Sugar Trade Policy - Tariffs and Tariff Rates Quatas in a World Sugar Market Context (MECAS(14)07)* £305China: Future Sugar Prospects (MECAS(14)06)* £305The EU Sugar Market Post 2017 (MECAS(14)05)* £305Productivity and Innovation in the World Sugar Industry (MECAS(13)18)* £305Indonesia: Future Sugar Prospects (MECAS(13)17)* £305 Prospects for Sugar Refineries in Destination Markets (MECAS(13)16)* £305 Climate Change and Sugar Crops (MECAS(13)07)* £305 Internatiuonal Survey on Prices for Sugar Cane/Beet and Com-peting Crops (MECAS(13)06)* £305Future Role of Sub-Saharan Africa in World Sugar and Sugar Crop Renewable Energy (MECAS(13)05)* £305World Fuel Ethanol Outlook to 2020 (MECAS(12)19)* £280
Sugar Perspectives of the MENA (Middle East & North Africa) Regions (MECAS(12)18)* £280FDI and M&A in the World Sugar Industy (MECAS(12)17)* £280Developments and Drivers of the Sugar Market in CIS Customs Union Countries (MECAS(12)06)* £280Outlook of Sugar and Ethanol Production in Brazil (MECAS(12)05)* £280Alternative Sweeteners in a Higher Sugar Price Enviroment (MECAS(12)04)* £280International Survey on Yields and Prices for Sugar Crops (MECAS(11)19* £250Input Costs in Sugarcane and Sugarbeet Farming (MECAS(11)18)* £250Thailand’s Sugar and Fuel Ethanol Outlook (MECAS(11)17* £250South American (excluding Brazil) Sugar and Ethanol Prospects (MECAS(11)07)* £250Govenment Sugar Trade Related Policy in a New Market Environment: a Survey (MECAS(11)06)* £250Niche Sugar Markets (MECAS(11)05)* £250Ethanol Price & Drivers - a World Survey (MECAS(10)19)* £205Indudtrial and Direct Consumption of Sugar - an International Survey (MECAS(10)18*) £205World Sugar Demand: Outlook to 2020 (MECAS(10)17* £205Central American/Caribbean Sugar & Ethanol Prospects (MECAS(10)07)* £205
Regular Publications:Sugar Year Book 2015* £245Hardback, 400 pages, 150 Country Tables with full details of production, consumption, trade and stocks (7-8 yrs series)
Ethanol Year Book 2015* £200Hardback , over 30 pages of explanatory text plus over 120 pages of tables with details of fuel ethanol production, consumption, trade and stocks for key and emerging countries as well as related biomarkets (7-10 yrs series)
Monthly Statistical Bulletin* £250Providing updates on world sugar situation
Monthly Market Report & Press Summary* £225Report on sugar and ethanol markets for the previous month
World Sugar Balance* £250Current forecast and historical data (7 years series) on production, consumption, import and export
*ALSO AVAILABLE AS A SOFTCOPYInternational Sugar Organization
1 Canada Square, Canary Wharf, London E14 5AATel: +44 20 7513 1144 Fax: +44 20 7513 1146 Email: [email protected] Web: www.isosugar.org