Law Debenture
Annual Results 2015
1 March 2016
AGM 12 April 2016

Presented by
1
Caroline Banszky
Managing Director
James Henderson
Investment Manager
Laura Foll
Investment Manager
Law Debenture

• In September 2015 long term gearing was increased from £40 million to £115 million, following
issue of £75 million fixed rate 30 year notes at 3.77% per annum.
• Short term borrowings of £30 million repaid. Ongoing effective interest rate 4.589%, currently all
receiving tax relief against IFS business trading profits.
• IFS business fair valued at 31 December 2015. Historic financial and performance data restated
with assistance of AIC and Morningstar.
Introduction
2
• Board has concluded it will provide a better understanding of NAV/share price for individual
shareholders.
• Accounts not amended to incorporate fair value, however, methodology and value disclosed in
notes to the accounts. Based on EBITDA multiple of 8.4 (2014:8.9)
• Fair value does not take into account full value to shareholders, as guidelines and methodology
require standalone basis. Value of tax relief from investment trust is excluded. The tax charge in
2015 was reduced by £1,169,000.
IFS Fair value
3
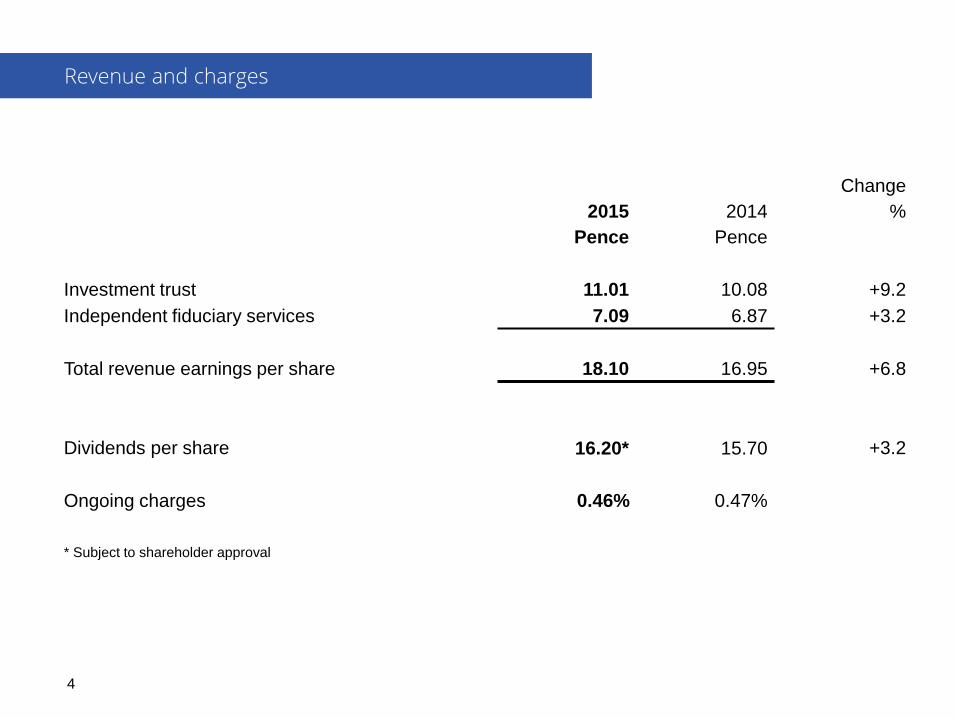
Change
2015
Pence
2014
Pence
%
Investment trust 11.01 10.08 +9.2
Independent fiduciary services 7.09 6.87 +3.2
Total revenue earnings per share 18.10 16.95 +6.8
Dividends per share 16.20* 15.70 +3.2
Ongoing charges 0.46% 0.47%
* Subject to shareholder approval
Revenue and charges
4
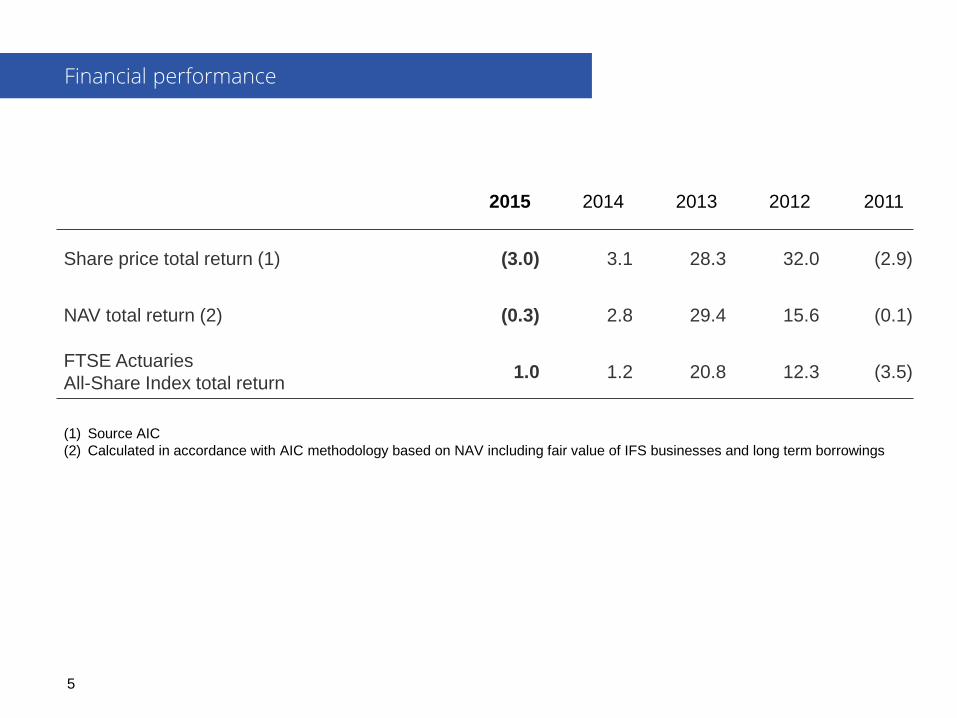
2015 2014 2013 2012 2011
Share price total return (1) (3.0) 3.1 28.3 32.0 (2.9)
NAV total return (2) (0.3) 2.8 29.4 15.6 (0.1)
FTSE Actuaries
All-Share Index total return 1.0 1.2 20.8 12.3 (3.5)
(1) Source AIC
(2) Calculated in accordance with AIC methodology based on NAV including fair value of IFS businesses and long term borrowings
Financial performance
5

Pence
NAV at 31 December 2014 at fair value after final dividend 531.35
Capital return
‒ Portfolio (17.47)
‒ IFS businesses (4.46)
‒ Long term borrowings 1.33
Revenue return 18.10
Dividends (16.20)
Foreign exchange, pension and movement in shares 0.89
NAV at 31 December 2015 513.54
Investment Trust 436.89
Independent fiduciary services 76.65
513.54
Retained revenue reserves 22.60
Net asset value and retained revenue reserves
6
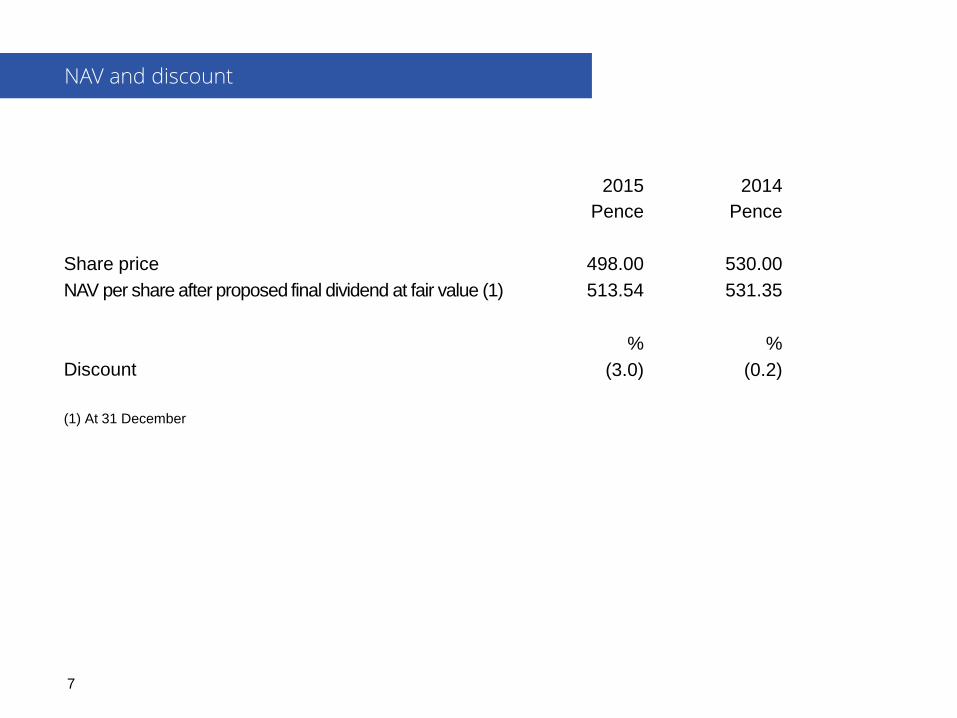
2015
Pence
2014
Pence
Share price 498.00 530.00
NAV per share after proposed final dividend at fair value (1) 513.54 531.35
% %
Discount (3.0) (0.2)
(1) At 31 December
NAV and discount
7
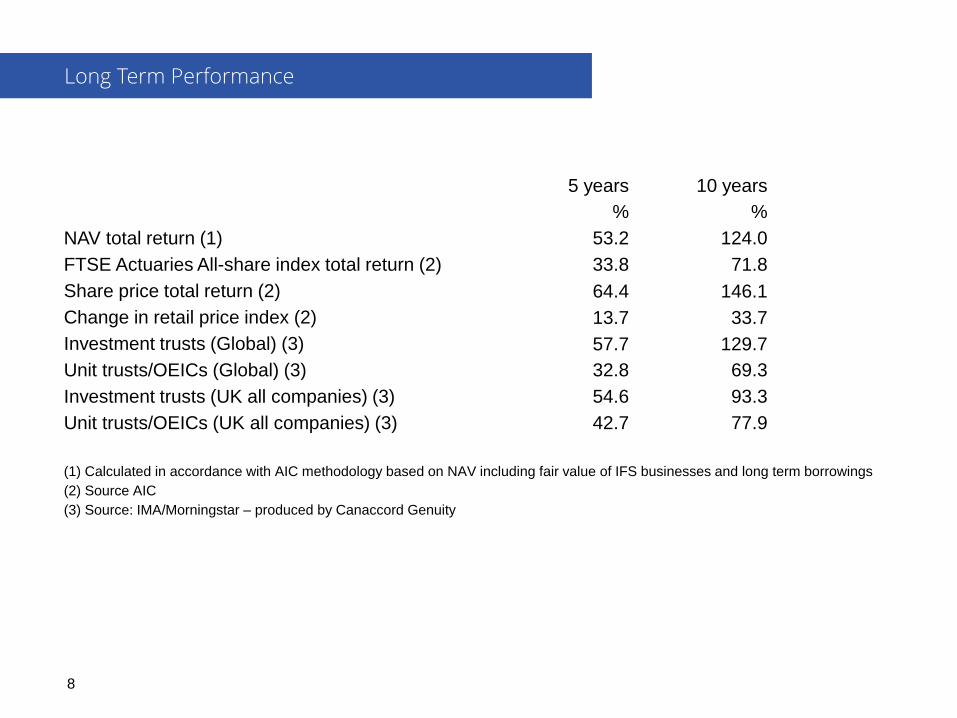
5 years 10 years
% %
NAV total return (1) 53.2 124.0
FTSE Actuaries All-share index total return (2) 33.8 71.8
Share price total return (2) 64.4 146.1
Change in retail price index (2) 13.7 33.7
Investment trusts (Global) (3) 57.7 129.7
Unit trusts/OEICs (Global) (3) 32.8 69.3
Investment trusts (UK all companies) (3) 54.6 93.3
Unit trusts/OEICs (UK all companies) (3) 42.7 77.9
(1) Calculated in accordance with AIC methodology based on NAV including fair value of IFS businesses and long term borrowings
(2) Source AIC
(3) Source: IMA/Morningstar – produced by Canaccord Genuity
Long Term Performance
8
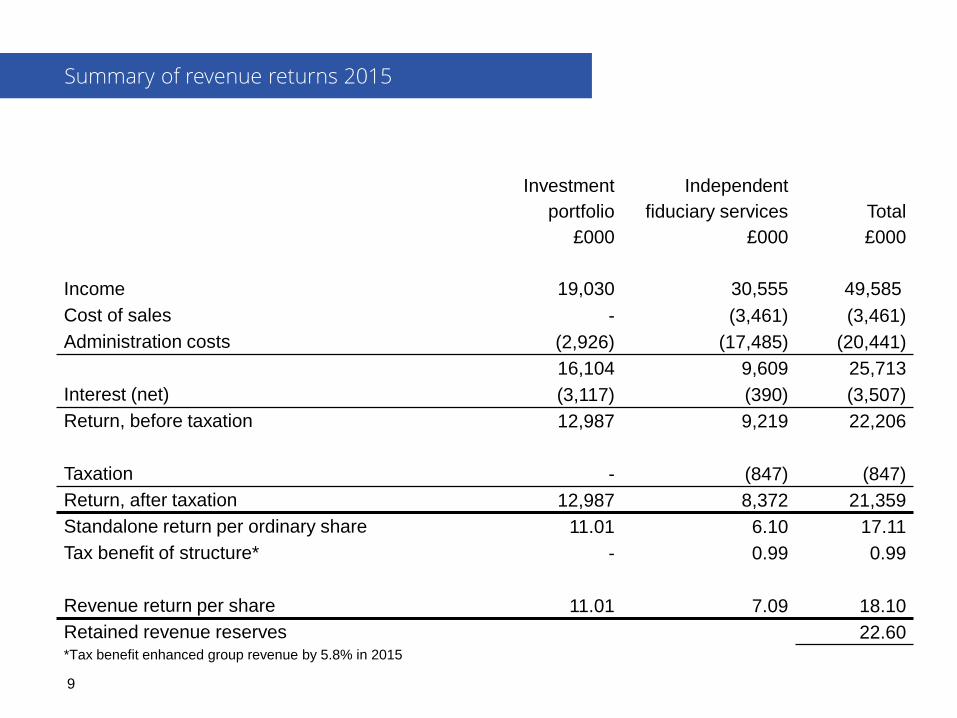
Investment
portfolio
£000
Independent
fiduciary services
£000
Total
£000
Income 19,030 30,555 49,585
Cost of sales - (3,461) (3,461)
Administration costs (2,926) (17,485) (20,441)
16,104 9,609 25,713
Interest (net) (3,117) (390) (3,507)
Return, before taxation 12,987 9,219 22,206
Taxation - (847) (847)
Return, after taxation 12,987 8,372 21,359
Standalone return per ordinary share 11.01 6.10 17.11
Tax benefit of structure* - 0.99 0.99
Revenue return per share 11.01 7.09 18.10
Retained revenue reserves 22.60 *Tax benefit enhanced group revenue by 5.8% in 2015
Summary of revenue returns 2015
9

2015
£000
2014
£000
Change
%
Revenue
UK dividends 16,456 14,685 12.1
Overseas dividends 2,549 2,128 19.8
Interest from securities - 103
Other 25 60
19,030 16,976
Expenses (2,926) (2,606) 12.3
16,104 14,370
Interest
Debenture interest (3,199) (2,450)
Inter-company interest 82 (48)
12,987 11,872
Tax - -
Total 12,987 11,872 9.4
Return per ordinary share 11.01p 10.08p 9.2
Investment trust
10

• To grow the business safely. Management look for opportunities to stretch the brand, but are risk
averse.
• To help the investment trust grow earnings so that dividends to shareholders can increase.
• To maintain the tax efficiency of the group to enhance the returns to shareholders.
IFS Objectives
11
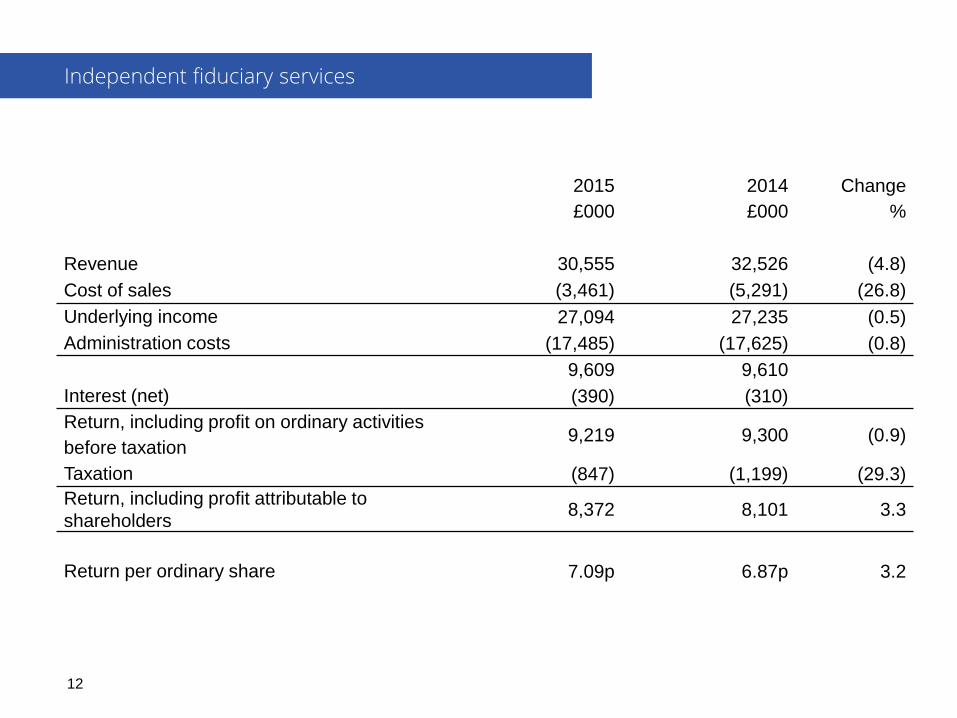
2015
£000
2014
£000
Change
%
Revenue 30,555 32,526 (4.8)
Cost of sales (3,461) (5,291) (26.8)
Underlying income 27,094 27,235 (0.5)
Administration costs (17,485) (17,625) (0.8)
9,609 9,610
Interest (net) (390) (310)
Return, including profit on ordinary activities
before taxation 9,219 9,300 (0.9)
Taxation (847) (1,199) (29.3)
Return, including profit attributable to
shareholders 8,372 8,101 3.3
Return per ordinary share 7.09p 6.87p 3.2
Independent fiduciary services
12
• Underlying income flat relative to 2014.
• Costs remain stable and controlled.
• Overall profit before tax down 0.9% from 2014.
• Effective tax rate of 9.2%, benefitting from relief of investment trust costs and reduction in UK tax
rate.
• Revenue per share up 3.2% to 7.09p, which represents 39% of group revenue.
Independent fiduciary services summary
13

• Our income is generated by acceptance fees on new business, annual trustee fees and fees for
post-issuance work which may arise from restructurings, ratings down grades and other actions
required by the trust deed.
• New business in UK Corporate trust had a good 2015 including: new issuances for National Grid,
Vodafone and trustee for project finance for International Finance Corporation.
• Also involved in acting as security trustee on a number of aircraft financing structures for
Emirates, Iberia and Qatar Airways.
• Our recognised independence as an impartial third party continues to enable us to secure many
escrow agent appointments.
• Our role in the US, as separate trustee, continues to develop, however bankruptcy/successor
trustee market remains at historic low levels.
Corporate trust: UK, US, HK and Channel Islands
14
• Our pension trusteeship service had another good year in a market environment that continues to
change.
• An increased focus on defined contribution schemes and the continued refinement of the needs
of final salary schemes provided an increasing demand for our services, especially as chair of
trustees.
• The performance of our sole trusteeship services, where we act as the sole trustee of final salary
schemes and deliver one-stop governance cost effectively, continues to show progress.
• Our governance and board effectiveness business is still in demand in what has become a highly
competitive market.
Pensions trusts and Governance services: UK
15

• Our long established and highly regarded service of process business had another solid year.
• The corporate services business (provision of corporate directors, company secretary, accounting
and administration of special purpose vehicles) saw some gains, despite sluggish securitisation
markets.
• New appointments were secured for clients including Virgin Money and Blackrock.
• We continued to win new customers with company secretarial, M&A and corporate governance
appointments.
Corporate Services: including agent for service of process UK, US, HK and Channel Islands.
16

• Our external whistleblowing service had another successful year with a considerable number of
new appointments.
• As pressure increases from regulators, both in the UK and around the world, more and more
organisations are looking to enhance their compliance programmes. This has been particularly
evident in the financial sector, with the FCA looking to promote a culture where individuals feel
able to raise concerns and challenge poor practice and behaviour and for well known brands
concerned with non compliance with their environmental and social responsibilities harming their
reputations.
• Notable appointments during 2015 included Clydesdale Bank, SSE, Paddy Power, UBM & Aer
Lingus.
Safecall
17
• We expect that 2016 will be another flat year. Wider uncertainties surrounding commodities and
the emerging markets are not good news for some of our businesses. Nor is the threat of a Brexit.
• We will continue to keep under review the range of services that we offer and remain open to any
prospect that might allow us safely to grow the IFS businesses.
• We remain committed to cost control and maintaining our professional standards.
Conclusion
18
• Aim to achieve a better return than the FTSE All Share.
• Value/contrarian approach based on fundamental analysis.
• Genuine diversity of holdings driven by sector and geography.
• Aiming to achieve good dividend growth over the long term.
• Gearing 12% at year end (2014: 5%).
Investment portfolio
19
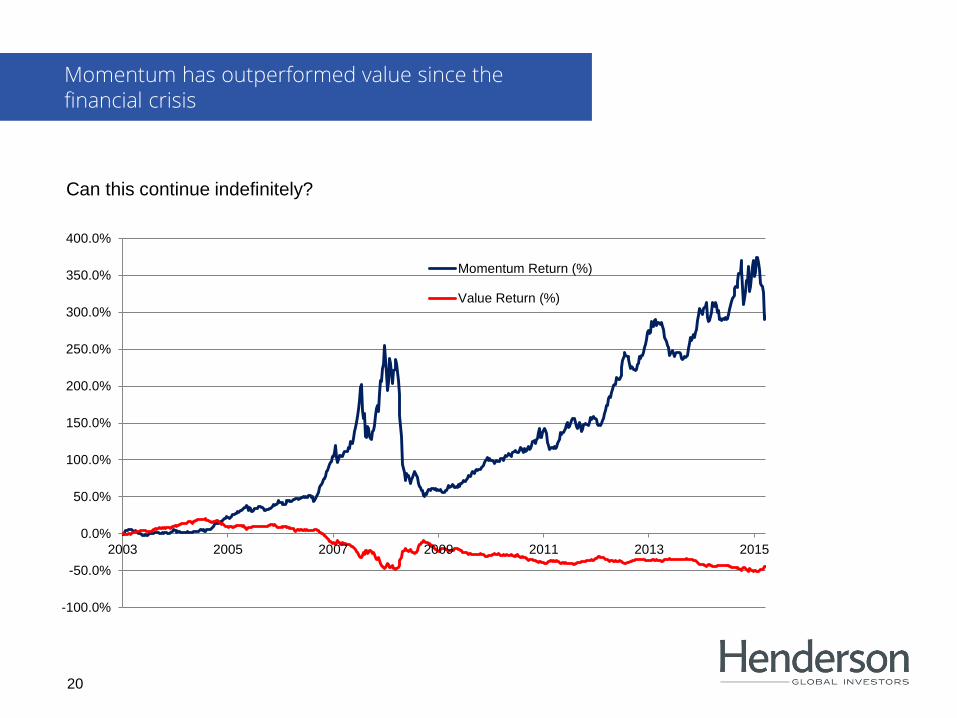
Can this continue indefinitely?
Momentum has outperformed value since the financial crisis
20
-100.0%
-50.0%
0.0%
50.0%
100.0%
150.0%
200.0%
250.0%
300.0%
350.0%
400.0%
2003 2005 2007 2009 2011 2013 2015
Momentum Return (%)
Value Return (%)

Industrials (31% UK portfolio)
• Pockets of weakness (e.g. commodities)
as well as pockets of strength (e.g.
infrastructure, civil aerospace)
• Margins are resilient and cash generation
remains strong
• Balance sheets often net cash
Which sectors look interesting currently?
21
0
2
4
6
8
10
12
14
16
18
2007 2008 2009 2010 2011 2012 2013 2014 2015
Avera
ge %
opera
tin
g m
arg
in o
f U
K in
dustr
ials
secto
r
Industrial margins proving quite resilient
Source: Numis as at 8 March 2016
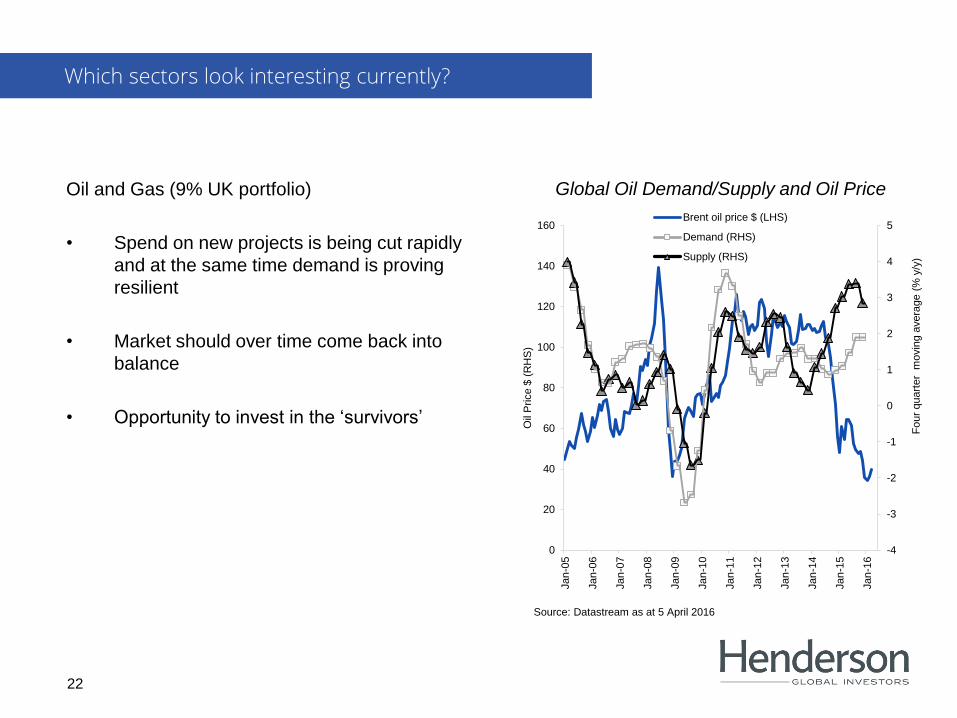
Oil and Gas (9% UK portfolio)
• Spend on new projects is being cut rapidly
and at the same time demand is proving
resilient
• Market should over time come back into
balance
• Opportunity to invest in the ‘survivors’
Which sectors look interesting currently?
22
Global Oil Demand/Supply and Oil Price
-4
-3
-2
-1
0
1
2
3
4
5
Jan
-05
Jan
-06
Jan
-07
Jan
-08
Jan
-09
Jan
-10
Jan
-11
Jan
-12
Jan
-13
Jan
-14
Jan
-15
Jan
-16
0
20
40
60
80
100
120
140
160
Fo
ur
quart
er
movin
g a
vera
ge (
% y
/y)
Oil
Price $
(R
HS
)
Brent oil price $ (LHS)
Demand (RHS)
Supply (RHS)
Source: Datastream as at 5 April 2016

• £45mn invested in the equity portfolio. Why is this attractive over the long term?
– Portfolio yield is above the cost of gearing
– Dividends from the portfolio have good scope for growth over the long term
– There are value opportunities within global equities – look for areas that are out of favour or
under-researched
Why the additional gearing?
23

Adding to positions at attractive valuations
New positions in:
• Ibstock
• Anglo American
• Standard Chartered
• Johnson & Johnson
• Apple
Added to positions in:
• Royal Dutch Shell
• Rolls-Royce
• Weir Group
• International Personal Finance
• Elementis
Investing the proceeds of the debenture
24
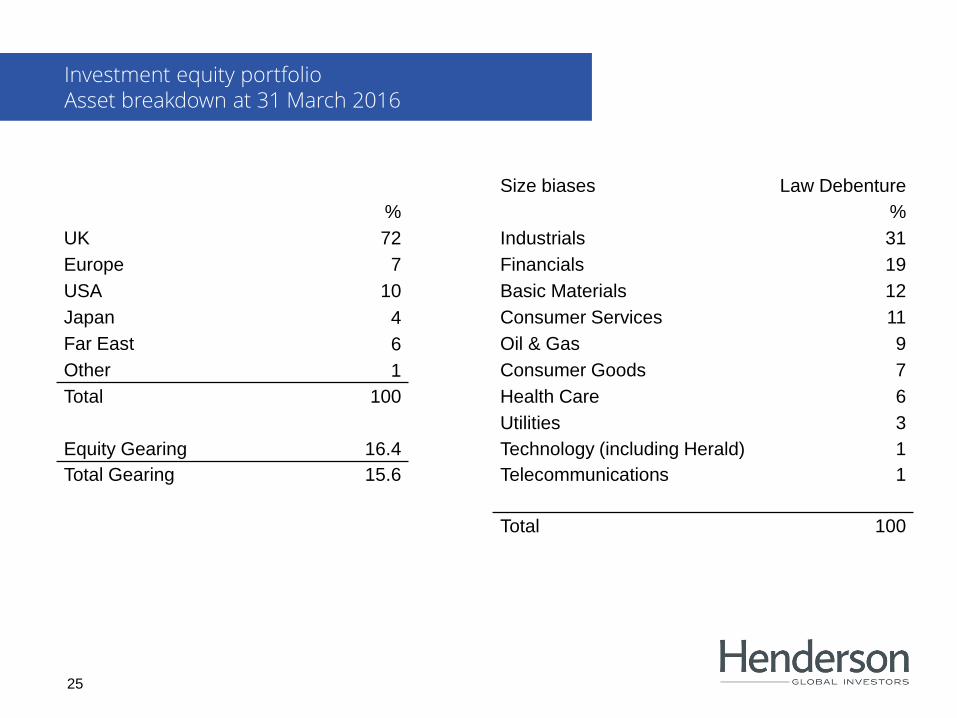
Size biases Law Debenture
% %
UK 72 Industrials 31
Europe 7 Financials 19
USA 10 Basic Materials 12
Japan 4 Consumer Services 11
Far East 6 Oil & Gas 9
Other 1 Consumer Goods 7
Total 100 Health Care 6
Utilities 3
Equity Gearing 16.4 Technology (including Herald) 1
Total Gearing 15.6 Telecommunications 1
Total 100
Investment equity portfolio Asset breakdown at 31 March 2016
25
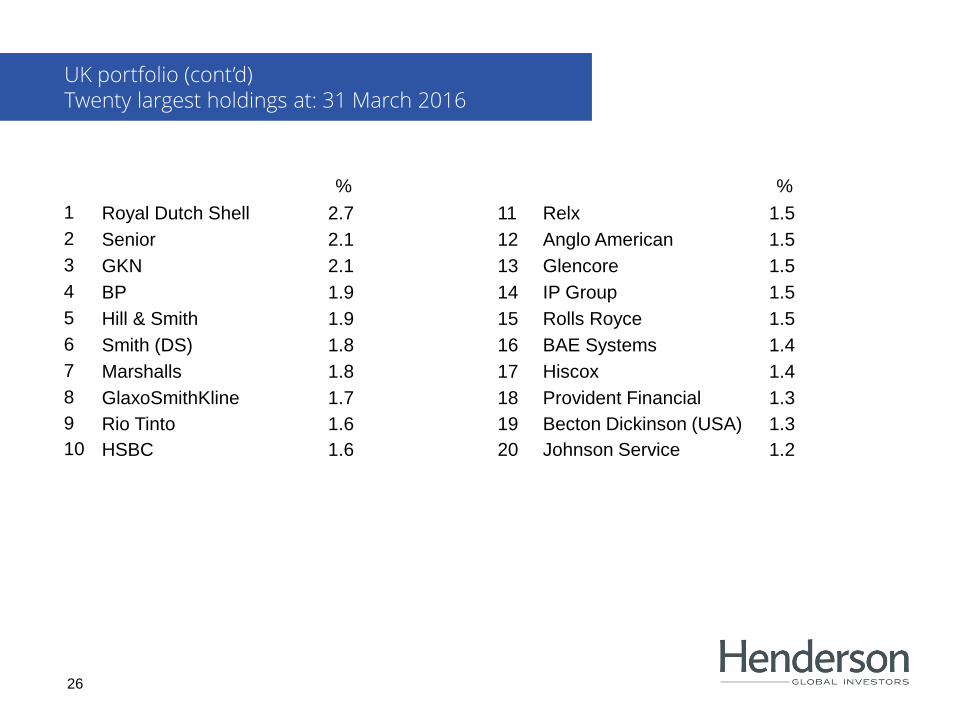
% %
1 Royal Dutch Shell 2.7 11 Relx 1.5
2 Senior 2.1 12 Anglo American 1.5
3 GKN 2.1 13 Glencore 1.5
4 BP 1.9 14 IP Group 1.5
5 Hill & Smith 1.9 15 Rolls Royce 1.5
6 Smith (DS) 1.8 16 BAE Systems 1.4
7 Marshalls 1.8 17 Hiscox 1.4
8 GlaxoSmithKline 1.7 18 Provident Financial 1.3
9 Rio Tinto 1.6 19 Becton Dickinson (USA) 1.3
10 HSBC 1.6 20 Johnson Service 1.2
UK portfolio (cont’d) Twenty largest holdings at: 31 March 2016
26
This document is solely for the use of professionals and is not for general public distribution.
This document is solely for the use of professionals, defined as Eligible Counterparties or Professional Clients, and is not for general public
distribution.
Past performance is not a guide to future performance. The value of an investment and the income from it can fall as well as rise and you may
not get back the amount originally invested. Tax assumptions and reliefs depend upon an investor’s particular circumstances and may change
if those circumstances or the law change.
If you invest through a third party provider you are advised to consult them directly as charges, performance and terms and conditions may
differ materially.
Nothing in this document is intended to or should be construed as advice. This document is not a recommendation to sell or purchase any
investment. It does not form part of any contract for the sale or purchase of any investment.
Any investment application will be made solely on the basis of the information contained in the Prospectus (including all relevant covering
documents), which will contain investment restrictions. This document is intended as a summary only and potential investors must read the
Prospectus before investing.
Issued in the UK by Henderson Global Investors. Henderson Global Investors is the name under which Henderson Global Investors Limited
(reg. no. 906355), Henderson Fund Management plc (reg. no. 2607112), Henderson Investment Funds Limited (reg. no. 2678531), Henderson
Investment Management Limited (reg. no. 1795354), Henderson Alternative Investment Advisor Limited (reg. no. 962757), Henderson Equity
Partners Limited (reg. no. 2606646) (each incorporated and registered in England and Wales with registered office at 201 Bishopsgate, London
EC2M 3AE and authorised and regulated by the Financial Services Authority) provide investment products and services.
Telephone calls may be recorded and monitored.
Important information Henderson Global Investors
201 Bishopsgate, London EC2M 3AE
Tel: 020 7818 1818, Fax: 020 7818 1819
27

End
Recommended