Investor Day 2021Sustaining Profitable GrowthSeptember 17, 2021

2
Sustaining Profitable Growth
Topic Speaker
8:30am Welcome and Logistics – Ron Kurtz
8:35am Sustaining Profitable Growth – Joe Zubretsky
9:30am Compelling Financial Profile – Mark Keim
10:00am – 10:45am Executive Q&A– Joe Zubretsky
– Mark Keim

3
Cautionary Statement
Safe Harbor Statement under the Private Securities Litigation Reform Act of 1995:
This presentation and the accompanying oral remarks include forward-looking statements regarding, without limitation, the Company’s 2021
guidance, its 2022 premium revenue and revenue growth strategy, its long-term financial targets and margin outlook, the COVID pandemic, COVID
risk sharing corridors, future RFPs and re-procurements, mergers and acquisitions, Medicaid redeterminations, and the Company’s general
business plans. The Company intends such forward-looking statements to be covered by the safe harbor provisions for forward looking statements
contained in the Private Securities Litigation Reform Act of 1995. Readers and listeners are cautioned not to place undue reliance on any forward-
looking statements as forward-looking statements are not guarantees of future performance, and the Company’s actual results may differ materially
due to numerous known and unknown risks and uncertainties. Those risks and uncertainties are discussed under Item 1A in the section entitled
“Risk Factors” in the Company’s Annual Report on Form 10-K for the year ended December 31, 2020, and also in the Company’s quarterly reports,
current reports, and other reports and filings with the Securities and Exchange Commission, or SEC. These reports can be accessed under the
investor relations tab of the Company’s website or on the SEC’s website at www.sec.gov. All forward looking statements in this presentation
represent management’s judgment as of September 17, 2021, and, except as otherwise required by law, the Company disclaims any obligation to
update any forward-looking statements to conform the statement to actual results or changes in its expectations..

4
Sustaining Profitable GrowthJoe Zubretsky
President and Chief Executive Officer

5
Sustaining Profitable Growth
Long-Term Financial Targets The Profitable Growth Playbook
Attractive Government Managed
Care MarketValue Creation Dynamics
Winning Leadership ModelOur Value Creating Franchise

6
Long-Term Financial Targets

7
Total Growth
Long-Term Premium Revenue Growth
Strong organic growth opportunities off of 2022 outlook, complemented by disciplined acquisition strategy
Organic Acquisitions Total
8% - 10%
~5% 13% - 15%
Organic Growth
Weighted Total
Medicare
Marketplace
8% - 10%
5% - 8%
11% - 13%
8% - 10%Medicaid
8
Medical Care Ratio Adj. G&A Ratio Pre-Tax Margin
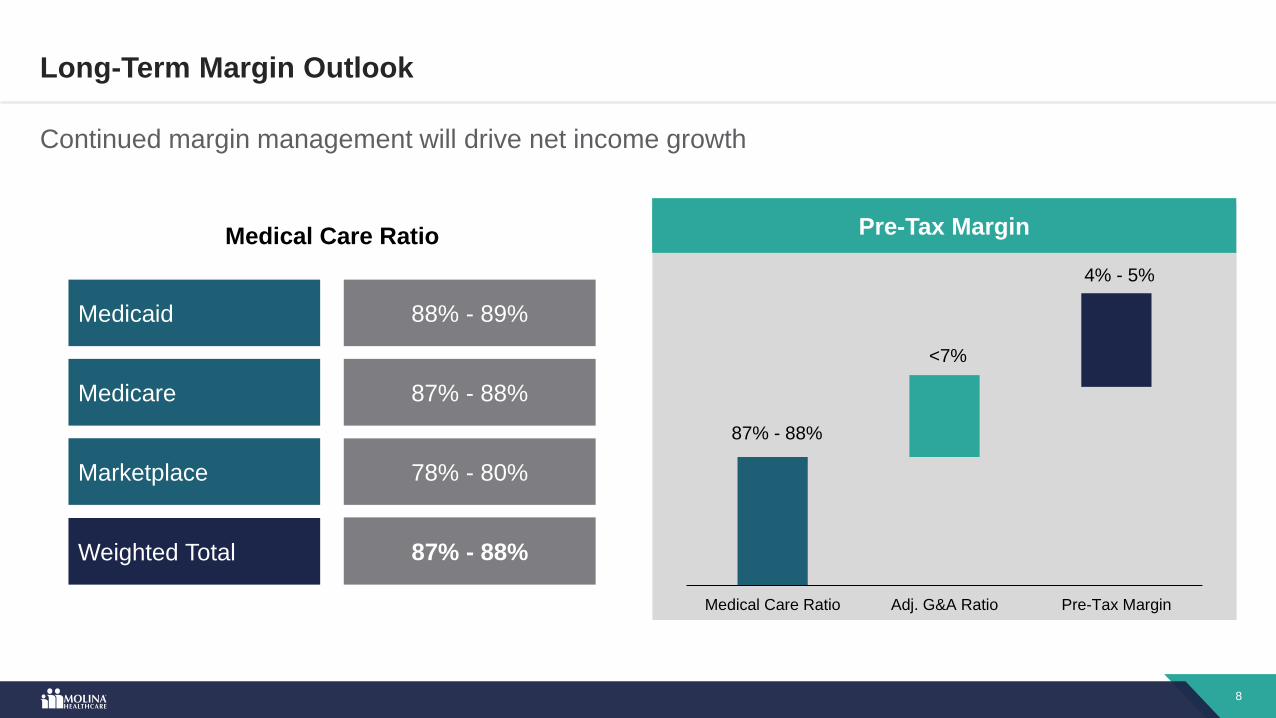
Long-Term Margin Outlook
Continued margin management will drive net income growth
87% - 88%
<7%
4% - 5%
Medical Care Ratio
Weighted Total
Medicare
Marketplace
87% - 88%
78% - 80%
87% - 88%
88% - 89%Medicaid
Pre-Tax Margin
9
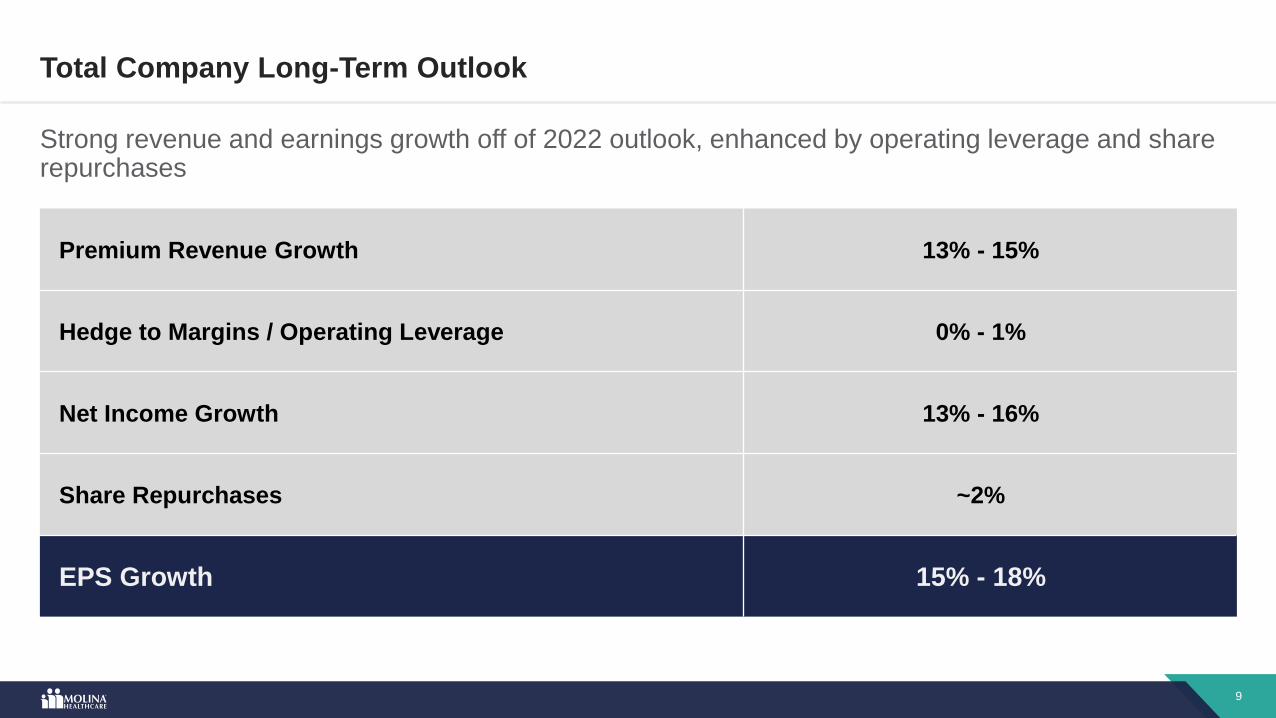
Total Company Long-Term Outlook
Strong revenue and earnings growth off of 2022 outlook, enhanced by operating leverage and share repurchases
Premium Revenue Growth 13% - 15%
Hedge to Margins / Operating Leverage 0% - 1%
Net Income Growth 13% - 16%
Share Repurchases ~2%
EPS Growth 15% - 18%

10
Investment Thesis
Strong growth, sustained margins and disciplined capital management form the core of shareholder return
Legacy and new market opportunities
Double digit revenue growth
Attractive margins and operating leverage
Capital efficiency and cashflow generation
High return capital deployment
Proven management team

11
Our Value Creating Franchise

12
Franchise
Leading pure-play, government-sponsored managed care company with breadth and scale
155Ranking
>$27BTotal Revenue
2021E
4.7MMembers
2Q21
18States
2021
3Products
Medicaid,
Medicare
and Marketplace
13
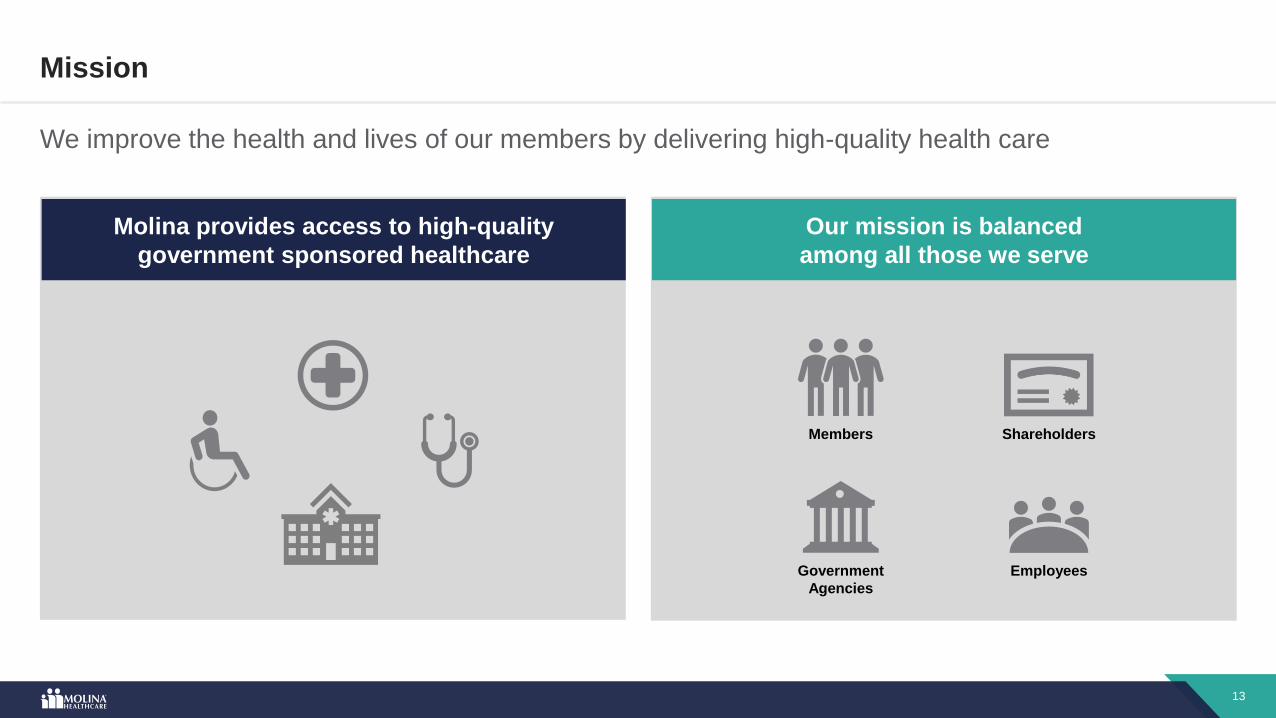
Mission
We improve the health and lives of our members by delivering high-quality health care
Members
Government
Agencies
Employees
Shareholders
Our mission is balanced
among all those we serve
Molina provides access to high-quality
government sponsored healthcare

14
Transformation
Our transformation has driven strong growth in revenue, EPS and shareholder return
Total
Revenue
Adj. EPS
Margin Sustainability
2019
$16.8B
$11.57
(11%)
(1%)
Stock
Price
Margin Recovery
2017 2018
$19.9B
($8.72)
$18.9B
$11.74
(5%)
nm
$77
Growth
2021 Guidance
>$27.0B
>$13.25
>60%
>15%
~$260
~240%
15
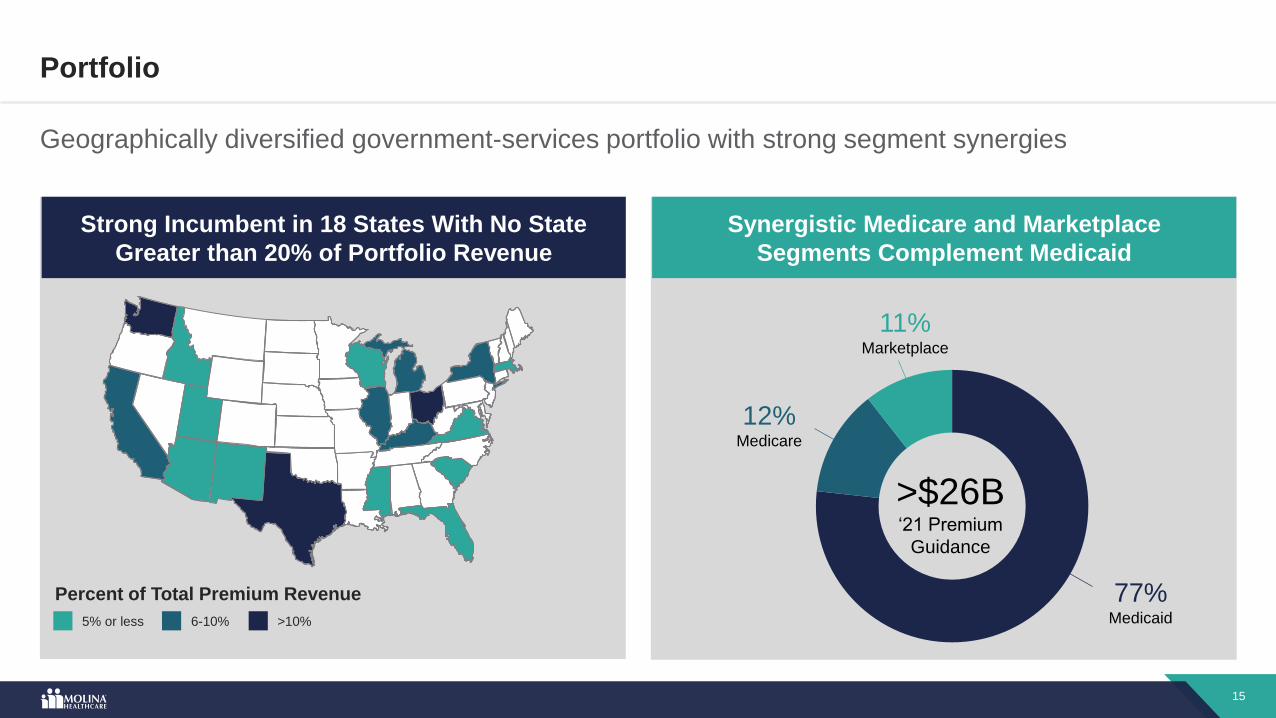
Portfolio
Geographically diversified government-services portfolio with strong segment synergies
6-10% >10%5% or less
Percent of Total Premium Revenue
>$26B ‘21 Premium
Guidance
12%Medicare
11%Marketplace
77%Medicaid
Synergistic Medicare and Marketplace
Segments Complement Medicaid
Strong Incumbent in 18 States With No State
Greater than 20% of Portfolio Revenue

16
Portfolio Synergies
Synergistic product segments provide member continuity and leverage common capabilities
Fed
era
l P
overt
y L
evel
400 -
250 -
138 -
100 -
150 -
MA-PD
DualsMedicaid
Marketplace(low subsidy)
Marketplace
Target(max subsidies)
MA-PD Target (low-income)
<65 >65
Continuity for
“age ins”
Mobility as
income
levels
change
Age

17
Market Share Upside Opportunity
National franchise with significant local market opportunity in all segments
Average State
Market Share
National
Market Share
~20% - 30%
~9% ~6%
~20% - 40%
~9%
~15% - 50%
Medicaid
#4 Nationally
~6%
Medicare Duals
#6 Nationally
~3%
Marketplace
#6 Nationally
~5%
Sources: Health Management Associates, State-reported data, CMS and Decision Resources Group
Molina
Top Competitors

18
Attractive Government
Managed Care Market

19
The Government Managed Care Market
Our addressable markets exceed $1T in spend with high growth
$461B
64M
Members Members Spend
$470B
29M
SpendMembers
16M
$105B
Sources: CMS Medicaid Actuarial Report, NHE, KFF, HHS and Urban Institute
Spend
8%
’22 – ’25
CAGR
13%
’22 – ’25
CAGR
5%
’22 – ’25
CAGR
MarketplaceManaged MedicareManaged Medicaid
2022
2022

20
Political / Regulatory Environment
Political and regulatory environment provides favorable conditions for all segments
Medicaid Medicare Marketplace
Executive OrdersRevoked Medicaid work
requirements
PHE continues telehealth
flexibility increasing access
Agencies halt sale of limited
duration/non-ACA compliant
plans
LegislationARP provides FMAP incentives
for remaining states to expand
Medicaid
Sequestration extends through
2021, boosting premiums
ACA premium subsidies
increase for 2021 and 2022
RegulationRating rules tighten actuarial
soundness requirements for
quality withholds
CMS direct contracting
opportunities
NBPP helps Medicaid enrollees
transition easily to Marketplace
after the PHE ends
21
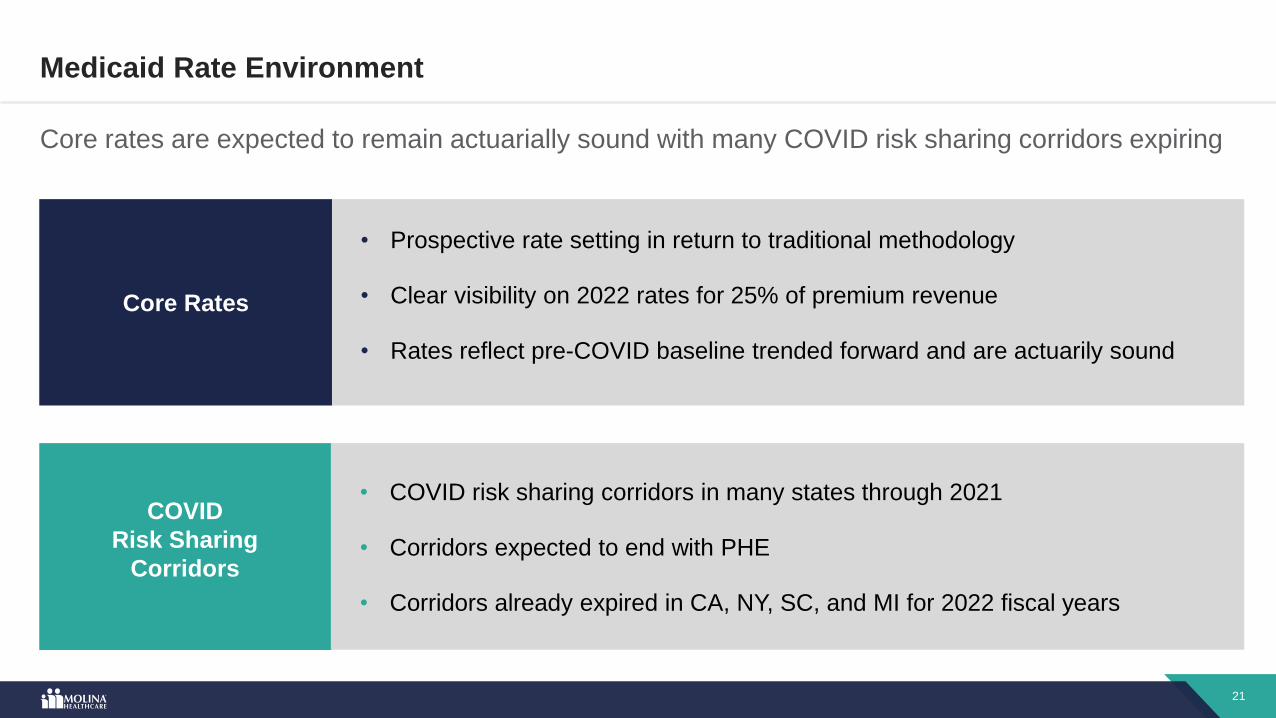
Medicaid Rate Environment
Core rates are expected to remain actuarially sound with many COVID risk sharing corridors expiring
• COVID risk sharing corridors in many states through 2021
• Corridors expected to end with PHE
• Corridors already expired in CA, NY, SC, and MI for 2022 fiscal years
• Prospective rate setting in return to traditional methodology
• Clear visibility on 2022 rates for 25% of premium revenue
• Rates reflect pre-COVID baseline trended forward and are actuarily sound
Core Rates
COVID
Risk Sharing
Corridors

22
r rrrr
Medicaid Enrollment During and After the COVID-19 Pandemic, July 16, 2021| Manatt Health Strategies, LLCMedicaid Enrollment During and After the COVID-19 Pandemic, July 16, 2021| Manatt Health Strategies, LLC
0
5
20M
65
80M
60M
55
85
75
-4%
45
-1
8%
0%
5
-3
1
35
9
3
25
4%
7
40M
15
2005 20151990 1995 2000 2010 2020
22
Recession
Economic Recovery Trends
Unemployment
Real GDP
Growth
Medicaid enrollment increases with economic downturns, continually growing without returning to previous levels
Total Medicaid
Enrollment
Sources: CMS, BLS, MACPAC and KFF
Recession Recession Recession
23
The Profitable Growth PlaybookMedicaid / Medicare / Marketplace / M&A / Margin Profile

24
Medicaid

25
Strategic InitiativesOrganic Premium Revenue Opportunity
Medicaid Long-Term Organic Growth
Long-term organic growth rate of 8%-10% driven by current footprint and strategic initiatives
1 Increase market share
2 Grow with potential expansion states
3 Pursue carve-in opportunities
4 Win new RFP states
4% - 6% 8% - 10%
~4%

26
Increase Market Share
Retain existing contracts and focus on fundamental operating tactics to drive significant market share opportunity
Service Area Market Shares
11-15%6-10%5% or less >15%
– Engage membership redeterminations proactively
– Engage providers to drive membership
– Increase auto assignment through improved
quality scores
– Drive voluntary enrollment through community
presence and awareness
1%
Increase in Service Area
Market Share
~$1.6B
2025 Revenue Opportunity
Actions

27
Expansion Opportunity
Grow with Potential Expansion States
Opportunity in five incumbent states represents ~3 million additional Medicaid managed care lives
Potential Medicaid Expansion states
Source: KFF, state filings and Company estimates
Medicaid Foot-Print
~7%
Weighted State Avg
Market Share
~$1B
2025 Revenue
Opportunity
$12B
Expansion Revenue
Opportunity

28
~$7B in Carve-in Opportunities
Pursue Carve-in Opportunities
Numerous pending LTSS and BH carve-in opportunities as states leverage managed care efficiency
Actions
– Pursue announced carve-in programs
– Advocate for additional carve-in programs
– Leverage Molina’s leading capabilities and $4B
LTSS platform
LTSS
BH~15%
Service Area
Market Share
~$1B
2025 Revenue Opportunity
California
Utah
Kentucky
Michigan
Sources: CMS and Company estimates
California
South Carolina

29
New State RFP Pipeline
New state procurement opportunities total ~$95 billion in annual premium revenue by 2025
2025 Premium Revenue
Opportunity
Arizona Louisiana Rhode IslandMinnesota
~$15B2022
North Carolina PennsylvaniaMaineFloridaArizona
~$30B2025
GeorgiaDelaware IowaIndiana TennesseeMissouri Oklahoma
~$25B2023
New MexicoNebraskaKansas New Hampshire W. VirginiaGeorgia
~$25B2024Indiana

30
Key Criteria
2025 total RFP opportunity ~$95B
Pursue subset of opportunities ~40%
Projected competitive win rate ~50%
Projected market share ~20%
2025 Molina revenue opportunity ~$4B
Prioritizing Opportunities
Significant RFP opportunities drive incremental long-term revenue growth
1 Size and duration of contract
2 Strength of incumbents
3 Number of awardees
4 Access to high-quality low-cost network
5 Rational rate environment
Sizing the Opportunity

31
– Award covers beneficiaries through TANF,
CHIP and Medicaid expansion programs
– Four-year contract term with potential two-
year extension
– Future opportunities in LTSS and ABD
– Strong ground game and innovative
differentiation drove success
Nevada RFP Win
Recently announced Nevada RFP award demonstrates continued success in new states
0
~20%
Estimated State
Market Share
>$400M
Projected 2022 Revenue
~630,000
Members Statewide
2022 Premium Revenue Expectation
On August 17th, Molina
announced award of new
state Medicaid contract in
Nevada

32
Medicare

33
Organic Premium Revenue Opportunity Strategic Initiatives
Medicare Long-Term Growth
Long-term organic growth rate of 11%-13% driven by current footprint and strategic initiatives
2 Penetrate Medicaid service areas
3 Introduce low-income MA-PD product
1Increase D-SNP market share in
current Medicare service areas
4% - 6% 11% - 13%
~7%
34
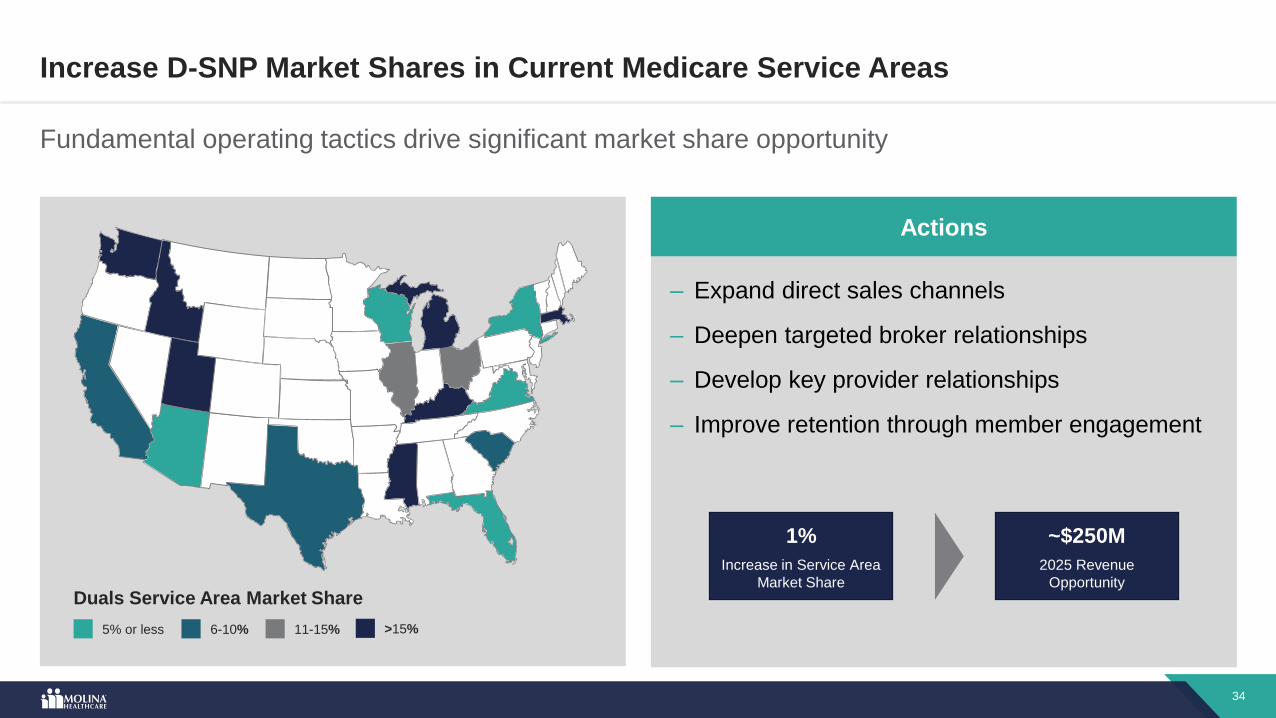
Increase D-SNP Market Shares in Current Medicare Service Areas
Fundamental operating tactics drive significant market share opportunity
– Expand direct sales channels
– Deepen targeted broker relationships
– Develop key provider relationships
– Improve retention through member engagement
Duals Service Area Market Share
11-15%6-10%5% or less >15%
Actions
~$250M
2025 Revenue
Opportunity
1%
Increase in Service Area
Market Share

35
Penetrate Medicaid Service Areas
D-SNP penetration of remaining Medicaid footprint provides significant opportunity
~3%
New County Target
Market Share
~$200M
2025 Revenue
Opportunity
56 new
counties filed
for 2022
~500 Counties
Without D-SNP
States with under-penetrated Medicaid service areas
Medicaid Footprint
Penetration of Medicaid Footprint

36
National Managed Medicare Market Actions
Introduce Low-Income MA-PD Products
Low-income MA-PD products double Molina’s market opportunity in Medicare
Sources: CMS and Company estimates
~20%
~55%
Duals
MA-PD
~25%Low-
Income
MA-PD ~$470B
2022
Premium
Revenue
~$215B
Target
Market
~$700M
2025 Revenue
Opportunity
~2%
Service Area Share of
Medicaid Footprint
– Introduce low-income MAPD in current
Medicaid footprint
– Target Marketplace and Medicaid age-ins
– Leverage existing direct sales and broker
networks

37
Marketplace

38
Strong 2021 Market Growth
Increased subsidies through ARP drove strong growth in 2021 with future growth rate expected to moderate
57%
55%
11.4M 11.4M
~15M
2019 2020 2022
59%
Source: CMS, Urban Institute and HHS
15-17M
2021
Bronze
Silver
Market Dynamics
– More members are now eligible for zero-dollar
silver plans
– Subsidy eligible population expanded through
elimination of 400% FPL “cliff”
– Special enrollment period extended window for
additional sign-ups
– Continuation of higher subsidies beyond 2022
currently under legislative review

39
Strategic InitiativesOrganic Premium Revenue Opportunity
Marketplace Long-Term Growth
As a smaller complement to Molina’s core Medicaid franchise, Marketplace margin discipline will be prioritized over volume
0% - 3% 5% - 8%
~5%
3 Penetrate Medicaid service areas
2 Prioritize margin discipline
1 Focus on highly subsidized population

40
Penetrate Medicaid Service Areas
Marketplace penetration of remaining Medicaid footprint provides significant revenue opportunity, balanced with margin discipline
States with under-penetrated Medicaid service areas
Medicaid Footprint
Penetration of Medicaid Footprint
14%
Average Service Area
Market Share
~$1.5B
2025 Revenue
Opportunity
59 new
counties filed
for 2022
>750 Counties
Without Marketplace

41
M&A
42
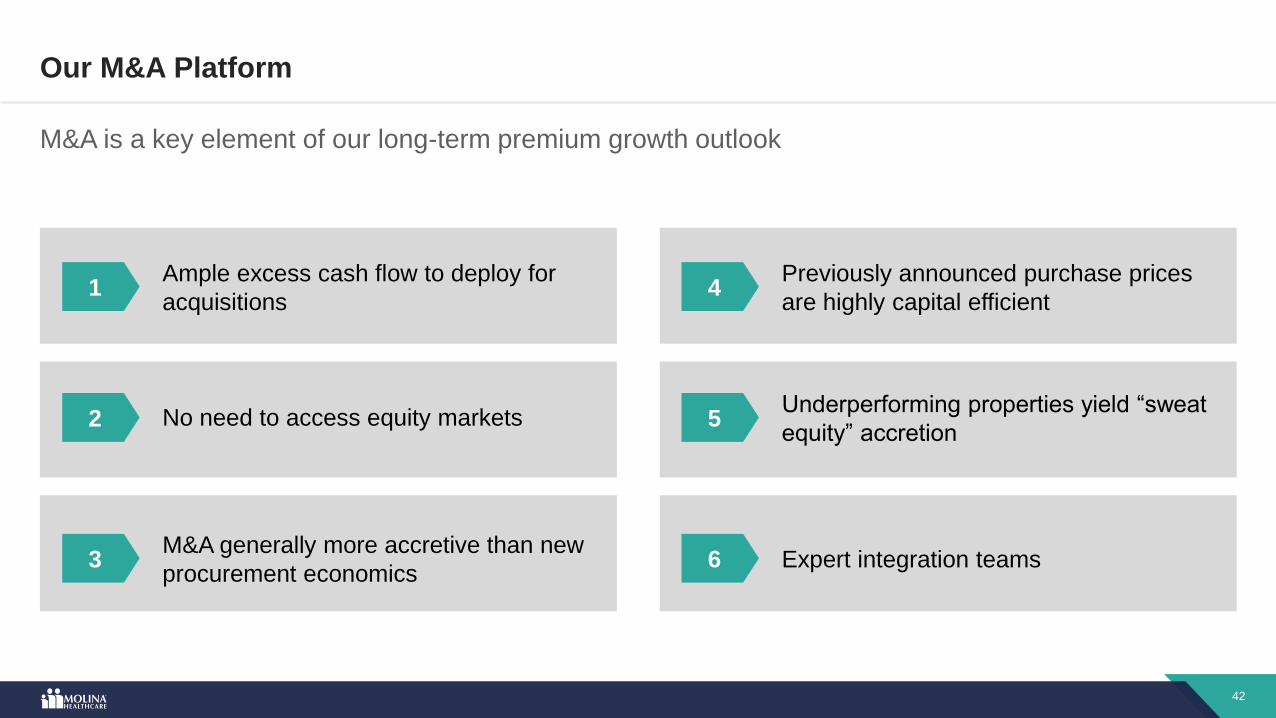
Our M&A Platform
M&A is a key element of our long-term premium growth outlook
3M&A generally more accretive than new
procurement economics
4Previously announced purchase prices
are highly capital efficient1
Ample excess cash flow to deploy for
acquisitions
2 No need to access equity markets
6 Expert integration teams
5Underperforming properties yield “sweat
equity” accretion

43
Acquisition History
Five transactions totaling ~$8 billion of run-rate revenue sequenced for manageable integration
An
no
un
ced
Clo
sed
YourCare
Health Plan
Magellan
Complete Care
2019 2020 2021
Passport
Health Plan
Affinity
Health PlanCigna
Texas Medicaid
YourCare
Health Plan
Passport
Health Plan
Magellan
Complete Care
Affinity
Health Plan
Cigna
Texas Medicaid
2022

44
Margin Profile

45
Adjusted G&A Ratio
Margin Management Performance
Strong MCR and G&A management programs continue to drive attractive margins
Medical Care Ratio
91.4 %
88.4 % 88.1 %
90.6 %~89%
~87%
~80%
~88%
Medicaid Medicare Marketplace Total Company
2017 2021 Ex Net Effect of COVID
8.0 %
~7.0%
2017 2021

46
Operating Focus
– Implemented state-of-the-art medical economics
platform
– Centralized utilization management
– Enhanced high acuity care management
– Created Centers of Excellence for Behavioral, Rx
and LTSS
– Focused on core technology, automation and
quality
Medical Cost Management
Numerous capabilities to drive medical cost efficiencies, with focus on high acuity populations
Risk
Adjustment
Care
Management
AnalyticsNetwork
Pharmacy Utilization
Management
QualityPayment
Integrity

47
Optimal Operating Platform
Fully integrated blend of proprietary and best-of-breed partners provides winning combination
Internal
– Care management
– Provider contracting
– Quality
– Community engagement
– Pricing and rating
Hybrid
– Utilization management
– Transaction services
– Risk adjustment
Outsourced
– Pharmacy
– IT infrastructure
Differentiated Capabilities Commodity

48
Winning Leadership Model

49
Proven Operating Model
While fairly traditional, our operating model and management process are executed with rigor and discipline
Organizational
Design
Management
Process
Operating
Model
How We Operate
– Flat organizational structure
– Empowered local decision making
– Simplified matrix
– Appropriate delegated authority
– Manage by the numbers

50
Executive Team
Proven industry-leading team with over 20 decades of experience. Operating Council acts as a virtual COO
Operating Council
Chief of
Staff
Ron Kurtz
President
& CEO
Joe Zubretsky
Marketplace &
CMO
Jason Dees
External
Affairs
Carolyn Ingram
General
Counsel
Jeff Barlow
CFO
Mark Keim
Health
Plans
Marc Russo
Health Plan
Services
Jim Woys
Human
Resources
Larry Anderson

51
Value Creation Dynamics
52
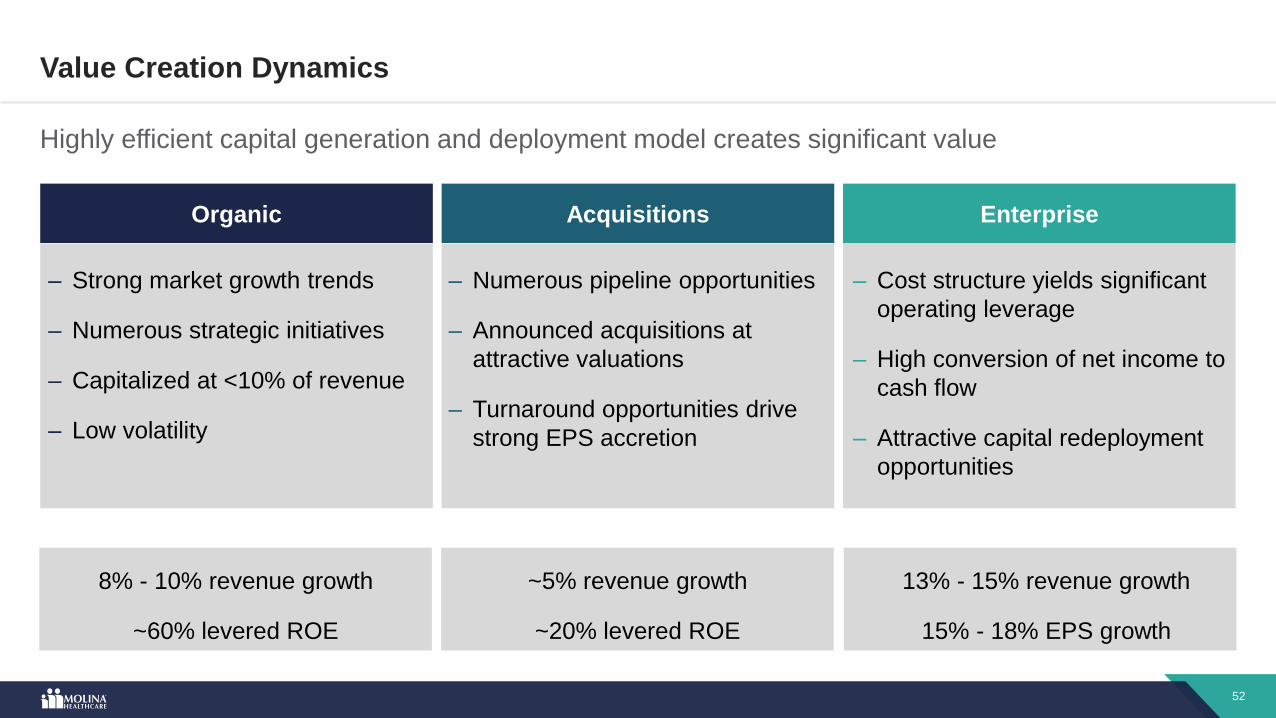
Organic Acquisitions Enterprise
Value Creation Dynamics
Highly efficient capital generation and deployment model creates significant value
– Strong market growth trends
– Numerous strategic initiatives
– Capitalized at <10% of revenue
– Low volatility
– Numerous pipeline opportunities
– Announced acquisitions at
attractive valuations
– Turnaround opportunities drive
strong EPS accretion
– Cost structure yields significant
operating leverage
– High conversion of net income to
cash flow
– Attractive capital redeployment
opportunities
8% - 10% revenue growth
~60% levered ROE
~5% revenue growth
~20% levered ROE
13% - 15% revenue growth
15% - 18% EPS growth
53
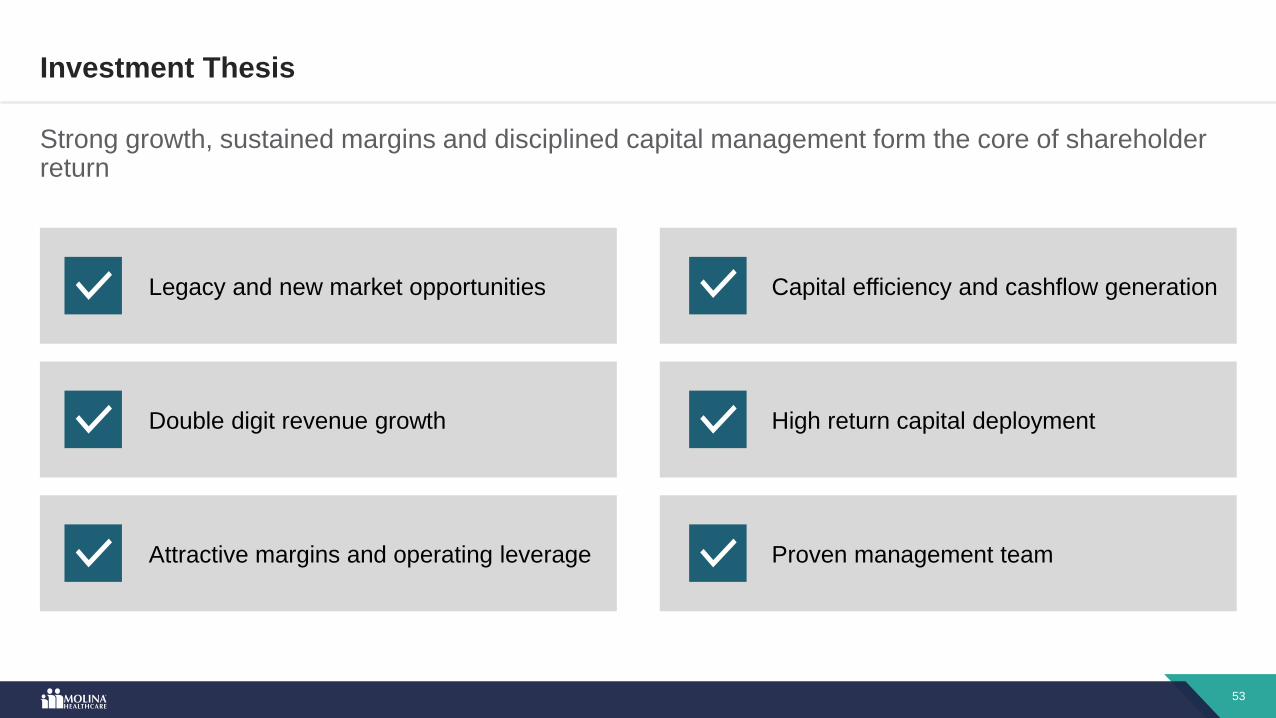
Investment Thesis
Strong growth, sustained margins and disciplined capital management form the core of shareholder return
Legacy and new market opportunities
Double digit revenue growth
Attractive margins and operating leverage
Capital efficiency and cashflow generation
High return capital deployment
Proven management team

54
Compelling Financial ProfileMark Keim
Chief Financial Officer
55
Compelling Financial Profile
Strong Capital Foundation G&A Expense Management
Attractive Acquisition Metrics 2022 and Long-term Outlooks
2021 GuidanceCapital Deployment Discipline
56
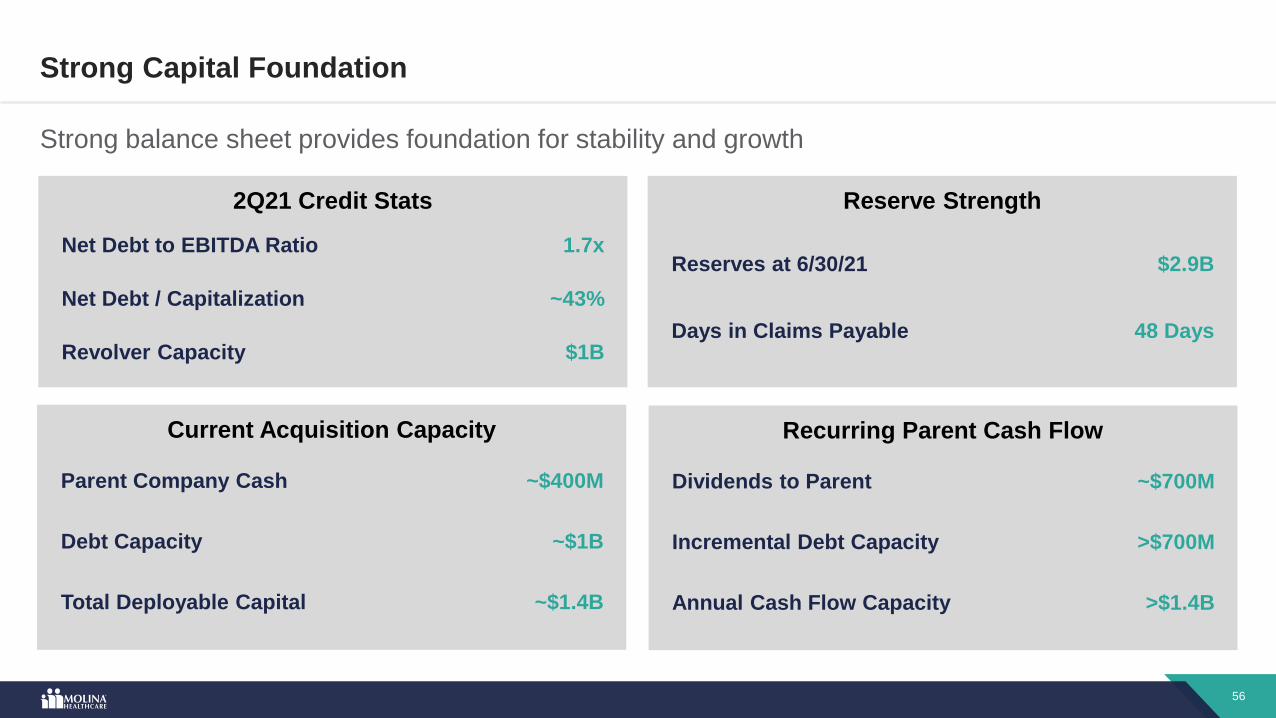
Strong Capital Foundation
Strong balance sheet provides foundation for stability and growth
2Q21 Credit Stats Reserve Strength
Current Acquisition Capacity
Parent Company Cash ~$400M
Debt Capacity ~$1B
Total Deployable Capital ~$1.4B
Reserves at 6/30/21 $2.9B
Days in Claims Payable 48 Days
Net Debt to EBITDA Ratio 1.7x
Net Debt / Capitalization ~43%
Revolver Capacity $1B
Recurring Parent Cash Flow
Dividends to Parent ~$700M
Incremental Debt Capacity >$700M
Annual Cash Flow Capacity >$1.4B

57
Capital Deployment Discipline
Capital deployed to highest return opportunities
Accretive
Acquisitions
– Robust pipeline
– Disciplined approach
– Strategic fit, operational synergies and EPS accretion
– Organic growth is the highest priority
– Most efficient use of capital to grow
– All lines of business are high growthRe-invest in
Business
Return to
Shareholders
– Convertible debt retired
– Share repurchases
EPS Accretion
58
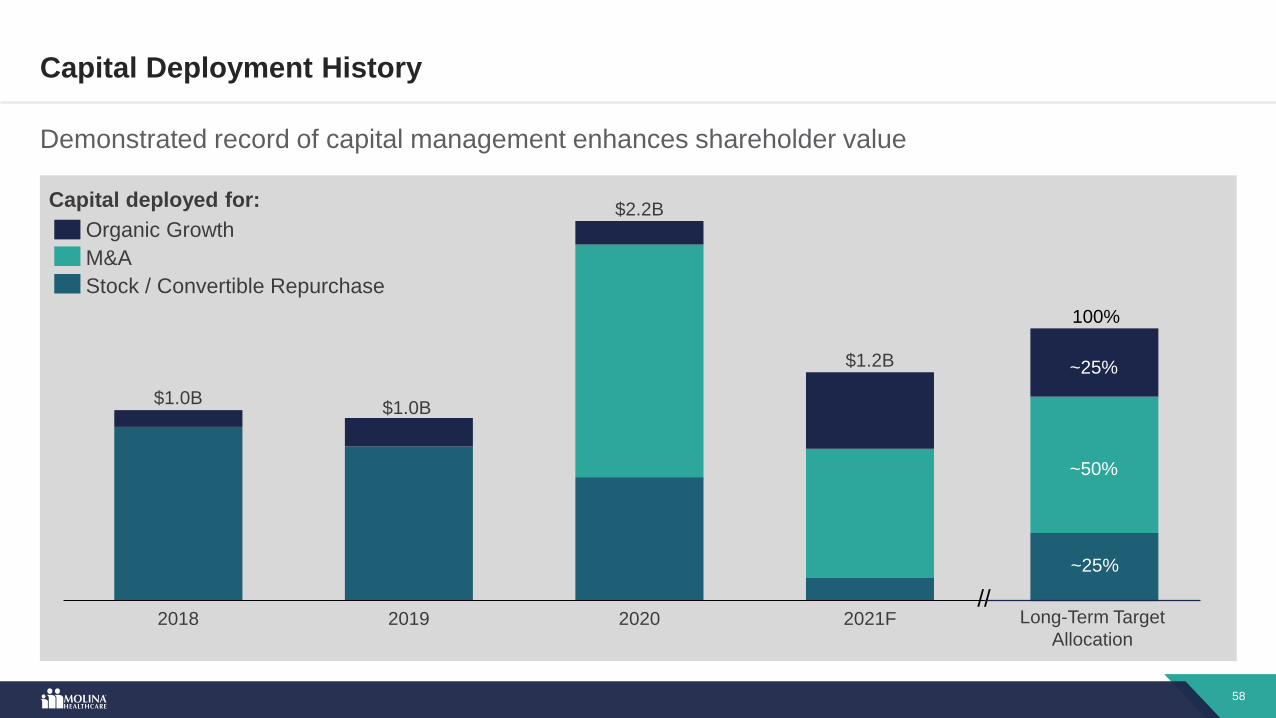
Capital Deployment History
Demonstrated record of capital management enhances shareholder value
$1.0B$1.0B
2018 2019
$2.2B
2020 2021F
$1.2B
Stock / Convertible Repurchase
M&A
Organic Growth
Long-Term Target
Allocation
//
100%
~25%
~50%
~25%
Capital deployed for:

59
Attractive Acquisition Metrics
Announced acquisitions at attractive valuations drive strong EPS accretion
Target
Acquired
Revenue
($ M)
Purchase Price
Run Rate EPS ImpactAnnounced Price
($ M)
% of Revenue
(Including Capital)
YourCare Health Plan $300 $40 21% $0.20
Magellan Complete Care $2,900 $820 28% $1.75
Passport Health Plan $2,000 $66 11% $0.35
Affinity Health Plan $1,600 $380 28% $0.60
Cigna’s Texas Medicaid $1,000 $60 15% $0.50
Total $7,800 $1,366 22% >$3.00
60
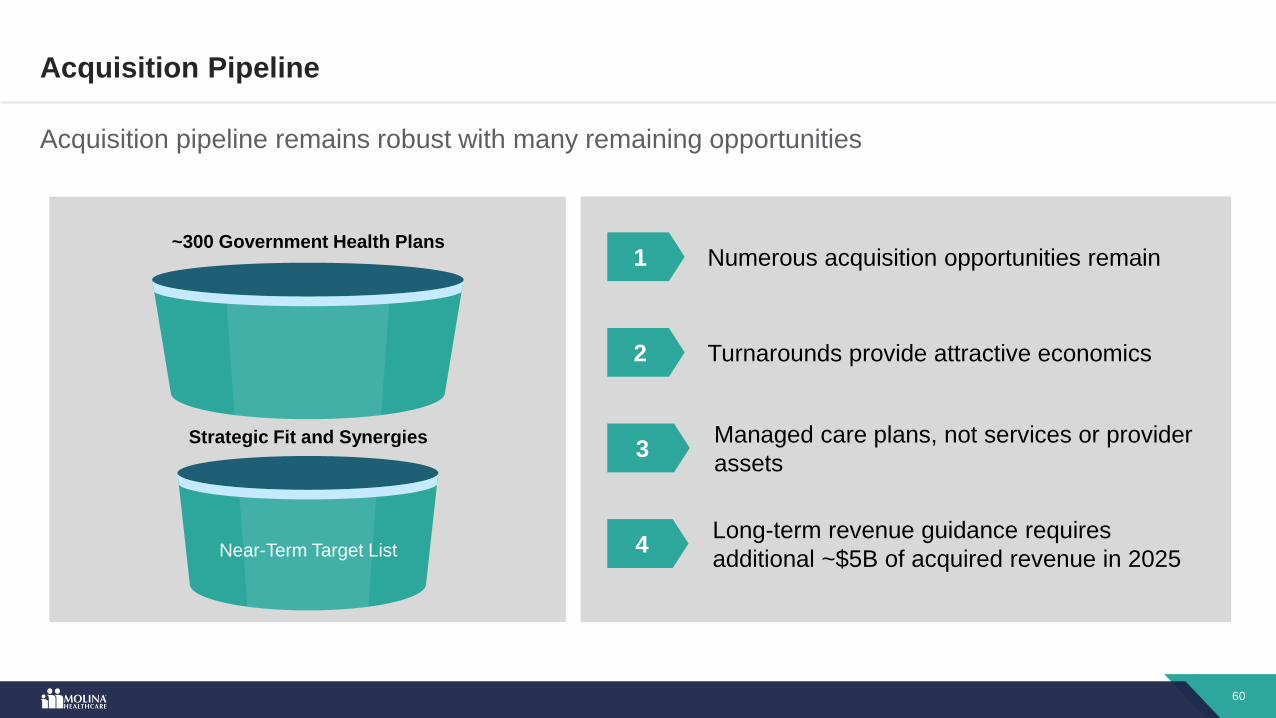
Acquisition Pipeline
Acquisition pipeline remains robust with many remaining opportunities
Strategic Fit and Synergies
Large franchise opportunities
Bolt on plans
Turnaround opportunities
~300 Government Health Plans
Near-Term Target List
1 Numerous acquisition opportunities remain
4Long-term revenue guidance requires
additional ~$5B of acquired revenue in 2025
3Managed care plans, not services or provider
assets
2 Turnarounds provide attractive economics
61
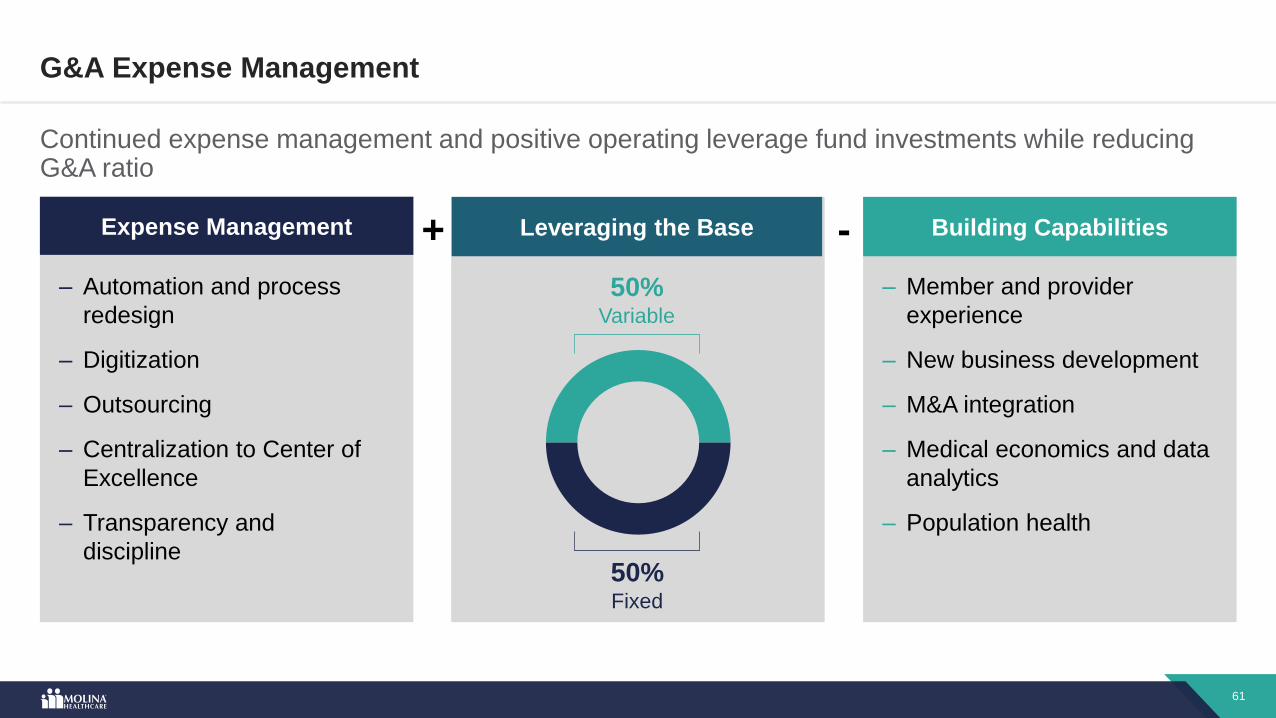
Expense Management Leveraging the Base Building Capabilities
G&A Expense Management
Continued expense management and positive operating leverage fund investments while reducing G&A ratio
– Automation and process
redesign
– Digitization
– Outsourcing
– Centralization to Center of
Excellence
– Transparency and
discipline
– Member and provider
experience
– New business development
– M&A integration
– Medical economics and data
analytics
– Population health
50%Variable
50%Fixed
+ -

62
Embedded Earnings Power
Full-Year 2021 Guidance
Reiterating adjusted EPS of no less than $13.25 on higher revenue and underlying earnings power offset by higher expected net effect of COVID
Total Revenue >$27 B
Premium Revenue >$26 B
Adjusted EPS no less than $13.25
Full Year 2021E
Net Effect of COVID ~$3.00
Medicare Risk Scores $1.00
Acquisitions at Portfolio Margin $2.00
Total ~$6.00
Guidance

63
Initial 2022 Premium Revenue Outlook
2022 premium revenue growth outlook of 12% before Marketplace enrollment changes and additional strategic initiatives / acquisitions
2021 Premium
Revenue
Current
Footprint
CI and Affinity
Acquisitions
2022 Premium
Revenue
>$26B
$2.3B
$1.0B ~$29B
Nevada
RFP Win
Redetermination
($0.5B)$0.4B
Organic Growth

64
Medicaid Redetermination
Several factors are expected to drive a soft landing and 2022 revenue impact of ~$0.5B and another ~$0.8B in 2023
Timing Duration Eligibility
CMS suggests PHE “likely” extended
through 2021 year-end. Several states
have already set their own timeline
With practical limitations of
redetermining 80M members, CMS has
now extended to maximum of one year
Precedent and COVID outlook suggest
retention of many members gained
through lapse in redetermination
750,000
Members gained organically since
beginning of pandemic
375,000
Estimated 50% of members retained
FY 2021 FY 2022
FY Member Months
Implied Revenue
~6.7M
~$2.4B
~8.2M
~$2.9B
FY 2023
~4.5M
~$1.6B
One year

65
Long-Term Premium Revenue Growth
Balanced growth driven by significant organic growth opportunities and disciplined acquisition strategy
~14% CAGR After Impact of Redetermination
2022 2025
~$29B
~$42B
Strategic
Initiatives
Acquisitions
~$4B
~$5B
4% - 6%
CAGR
~5%
CAGR
~4%
CAGR
~$5B
Current
Footprint
~($0.8B)
2023
Redetermination
66
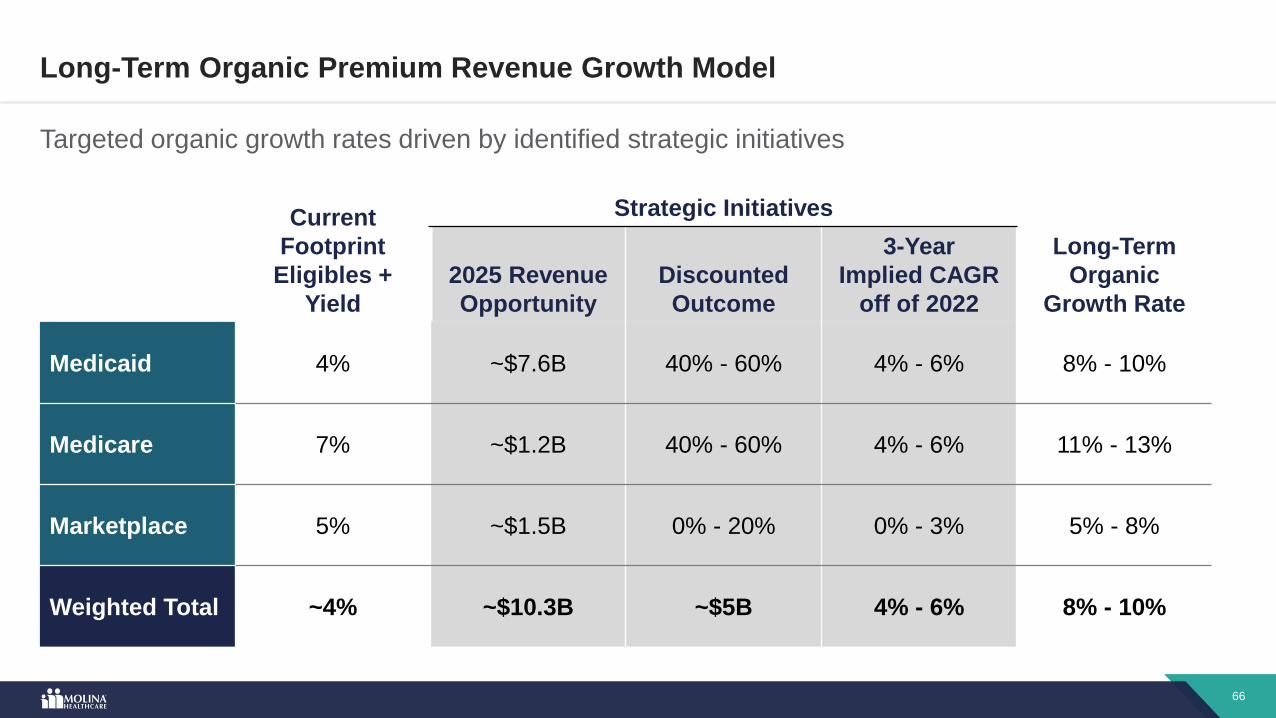
Current
Footprint
Eligibles +
Yield
Strategic Initiatives
Long-Term
Organic
Growth Rate
2025 Revenue
Opportunity
Discounted
Outcome
3-Year
Implied CAGR
off of 2022
Medicaid 4% ~$7.6B 40% - 60% 4% - 6% 8% - 10%
Medicare 7% ~$1.2B 40% - 60% 4% - 6% 11% - 13%
Marketplace 5% ~$1.5B 0% - 20% 0% - 3% 5% - 8%
Weighted Total ~4% ~$10.3B ~$5B 4% - 6% 8% - 10%
Long-Term Organic Premium Revenue Growth Model
Targeted organic growth rates driven by identified strategic initiatives

67
Total Company Long-Term Outlook
Strong revenue and earnings growth off of 2022 outlook, enhanced by operating leverage and share repurchases
Premium Revenue Growth 13% - 15%
Hedge to Margins / Operating Leverage 0% - 1%
Net Income Growth 13% - 16%
Share Repurchases ~2%
EPS Growth 15% - 18%

68
Executive Q&A
69
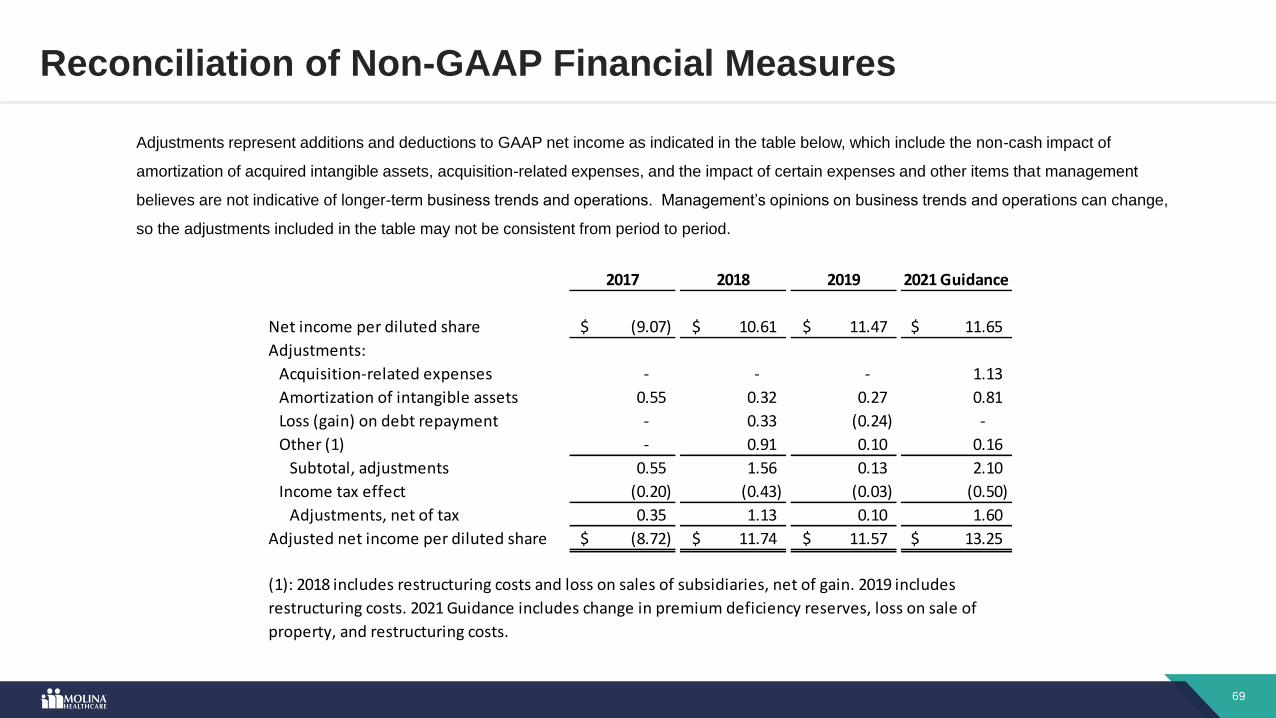
Reconciliation of Non-GAAP Financial Measures
Adjustments represent additions and deductions to GAAP net income as indicated in the table below, which include the non-cash impact of
amortization of acquired intangible assets, acquisition-related expenses, and the impact of certain expenses and other items that management
believes are not indicative of longer-term business trends and operations. Management’s opinions on business trends and operations can change,
so the adjustments included in the table may not be consistent from period to period.
2017 2018 2019 2021 Guidance
Net income per diluted share (9.07)$ 10.61$ 11.47$ 11.65$
Adjustments:
Acquisition-related expenses - - - 1.13
Amortization of intangible assets 0.55 0.32 0.27 0.81
Loss (gain) on debt repayment - 0.33 (0.24) -
Other (1) - 0.91 0.10 0.16
Subtotal, adjustments 0.55 1.56 0.13 2.10
Income tax effect (0.20) (0.43) (0.03) (0.50)
Adjustments, net of tax 0.35 1.13 0.10 1.60
Adjusted net income per diluted share (8.72)$ 11.74$ 11.57$ 13.25$
(1): 2018 includes restructuring costs and loss on sales of subsidiaries, net of gain. 2019 includes
restructuring costs. 2021 Guidance includes change in premium deficiency reserves, loss on sale of
property, and restructuring costs.
Recommended