3334 VOLUME 17J O U R N A L O F C L I M A T E
q 2004 American Meteorological Society
Interannual Variability of Summertime Convective Cloudiness and Precipitation in theCentral Andes Derived from ISCCP-B3 Data
MATHIAS VUILLE AND FRANK KEIMIG
Climate System Research Center, Department of Geosciences, University of Massachusetts, Amherst, Amherst, Massachusetts
(Manuscript received 15 September 2003, in final form 22 March 2004)
ABSTRACT
The interannual variability of austral summer [December–January–February–March (DJFM)] convective ac-tivity and precipitation in the central Andes (158–308S) is investigated between 1983 and 1999 based on in siturain gauge measurements, International Satellite Cloud Climatology Project (ISCCP) reduced radiance satellitedata (the B3 dataset), and National Centers for Environmental Prediction–National Center for AtmosphericResearch (NCEP–NCAR) reanalysis data.
Twice-daily ISCCP-B3 calibrated infrared data, corrected for limb-darkening effects and representing equiv-alent blackbody temperatures Tb emitted by clouds are used to derive seasonal composites of fractional coldcloud coverage F*. Comparison of in situ rain gauge measurements with F* show a good correlation when atemperature threshold Tb 5 240 K is used to derive F*. A rotated empirical orthogonal function (REOF) appliedto the seasonal estimates of F* yielded three spatially separated modes of convective activity in the south,northwest, and northeast of the central Andes.
Results indicate that precipitation variability in the central Andes shows less spatial coherence than previouslythought, with many years showing an antiphasing of wet/dry conditions between the northern and southern partof the study area. Regression analyses confirm the crucial role of both intensity and location of upper-aircirculation anomalies with easterly wind anomalies favoring wet conditions, and westerly winds producing dryconditions. Two different forcing mechanisms are identified as main causes of upper-air zonal wind anomaliesin the northern and southern part of the central Andes, respectively. Easterly wind anomalies during wet summersin the northern part are in geostrophic balance with reduced meridional baroclinicity due to low-latitude (mid-latitude) cooling (warming), consistent with earlier studies. Farther to the south, easterly wind anomalies duringwet summers are the result of an upper-air anticyclonic anomaly centered over southeastern South America,leading to a relaxation of the upper-air westerly winds and episodic easterly transport of humid air toward thesubtropical Andes. This pattern is similar to one of the leading modes of intraseasonal variability, related toextratropical Rossby wave dispersion and modulation of the position of the Bolivian high.
Correlation analysis of F* with near-surface specific humidity reveals that humidity variations in the lowlandsto the east are not relevant on interannual time scales for the more humid northern part of the Altiplano. In thesouthern Altiplano, however, there is a significant correlation between convective activity and precipitation athigh elevation and the low-level humidity content to the southeast of the Andes.
1. Introduction
The central Andes, located between 108 and 308S,separate the humid environments of the Amazon andChaco basins to the east from the arid Atacama Desertinfluenced by the southeast Pacific anticyclone to thewest. The high Andes and the inter-Andean plateau (Al-tiplano, located at ;3800 m) receive precipitation al-most exclusively during austral summer (December–March), associated with the seasonal expansion of theupper-air easterlies and related near-surface moisture in-flux from continental lowlands to the east. Precipitationfrom the west is rare because Pacific moisture is trappedvertically by large-scale subsidence and a stable low-
Corresponding author address: Dr. Mathias Vuille, Climate SystemResearch Center, Dept. of Geosciences, University of Massachusetts,Amherst, 611 North Pleasant Street, Amherst, MA 01003.E-mail: [email protected]
level inversion at ;900 hPa, and laterally by the coastalescarpment.
This easterly moisture source was first suggested byKessler (1974, 1981) and later confirmed by Fuenzalidaand Rutllant (1987) based on an analysis of the atmo-spheric circulation. Subsequent studies employing on-site observations (Aceituno and Montecinos 1997; Har-dy et al. 1998), transit-time and trajectory analyses(Vuille et al. 1998), radiosonde data (Aceituno and Mon-tecinos 1993; Vuille 1999), and mesoscale (Garreaud1999) and stable isotope modeling (Vuille et al. 2003)further corroborated these initial results.
Consistent with this easterly moisture source, annualprecipitation amounts decrease significantly from eastto west (Fig. 1a). On average 600–1000 mm of precip-itation fall annually along the eastern cordillera, whilethe annual mean along the western rim of the Andesonly amounts to 50–400 mm. Along the Pacific coast,

1 SEPTEMBER 2004 3335V U I L L E A N D K E I M I G
FIG. 1. (a) Long-term annual mean precipitation amount (mm) and (b) percent precipitation in DJFM of the annual total in the centralAndes. To the east of the Andes only rain gauge data .1500 m are shown. Shading indicates elevation zones above 1000 m (dark gray),2500 m (medium gray), and 4000 m (light gray). Record lengths of individual stations vary.
values are even below 50 mm yr21. Besides the east–west gradient, there is also a significant decrease in pre-cipitation from north to south, in particular along thewestern slopes of the central Andes, consistent with atropical moisture source (Fig. 1a). Along the easternslope this decrease is less obvious and precipitationamounts even increase slightly around 248S. Presumablya second more southeasterly moisture source contributesto precipitation in this area.
Figure 1b shows the fraction of annual precipitation(in %), which falls during the main rainy season De-cember–January–February–March (DJFM). Except forthe coastal stations and the extreme southwest (south of268S), which receives the majority of its precipitationduring austral winter (Vuille and Ammann 1997), theentire central Andes receive more than 50% of theirannual precipitation during these four summer months.Over the interior and western parts of the Altiplano,summer precipitation even accounts for 80%–90% ofthe annual total. Along the eastern slopes of the Andesthe number is somewhat lower (50%–80%) because therainy season starts earlier (in October or November) andlasts until April.
Precipitation variability on all time scales from in-traseasonal to glacial–interglacial appears to be predom-inantly controlled by the the upper-air circulation (Gar-reaud et al. 2003). In general upper-air easterly zonalflow tends to increase precipitation in the central Andes,because the upper-air easterlies, through turbulent en-trainment and downward mixing of easterly momentum,will enhance near surface moisture influx from the east
(Garreaud 1999). Seasonal, intraseasonal, and interan-nual variability in convective rainfall seems to be con-trolled by this near-surface water vapor influx from thecontinental lowlands to the east of the central Andes.Observational studies indicate that without this moistair influx the mixing ratio in the central Andes remainstoo low for deep moist convection. Conversely a west-erly upper-air zonal flow will lead to enhanced near-surface westerly winds. Since these air masses originateover the Pacific above the inversion layer and the coastaldesert of northern Chile, the mixing ratio will remainbelow the necessary threshold for deep convection. Thepositioning and intensity of the Bolivian high plays acrucial role in controlling this upper-air circulation overthe central Andes, with a more southerly (northerly)position favoring enhanced easterly (westerly) flow andhence increased (reduced) precipitation (Aceituno andMontecinos 1993; Vuille 1999; Lenters and Cook 1999).
Precipitation variability in the central Andes is par-ticularly pronounced on interannual time scales, andthere is general agreement that a significant fraction ofthis variability can be attributed to ENSO, with below(above) average precipitation during El Nino (La Nina)events (Thompson et al. 1984; Aceituno 1988; Lentersand Cook 1999; Vuille 1999; Vuille et al. 2000a; Arnaudet al. 2001; Garreaud and Aceituno 2001; Wagnon etal. 2001; Bradley et al. 2003; Francou et al. 2003). Wetsummers on the Altiplano are associated with a LaNina–related cooling of the tropical Pacific and the trop-ical troposphere and resulting weakened westerly flowaloft the central Andes in response to reduced meridi-
3336 VOLUME 17J O U R N A L O F C L I M A T E
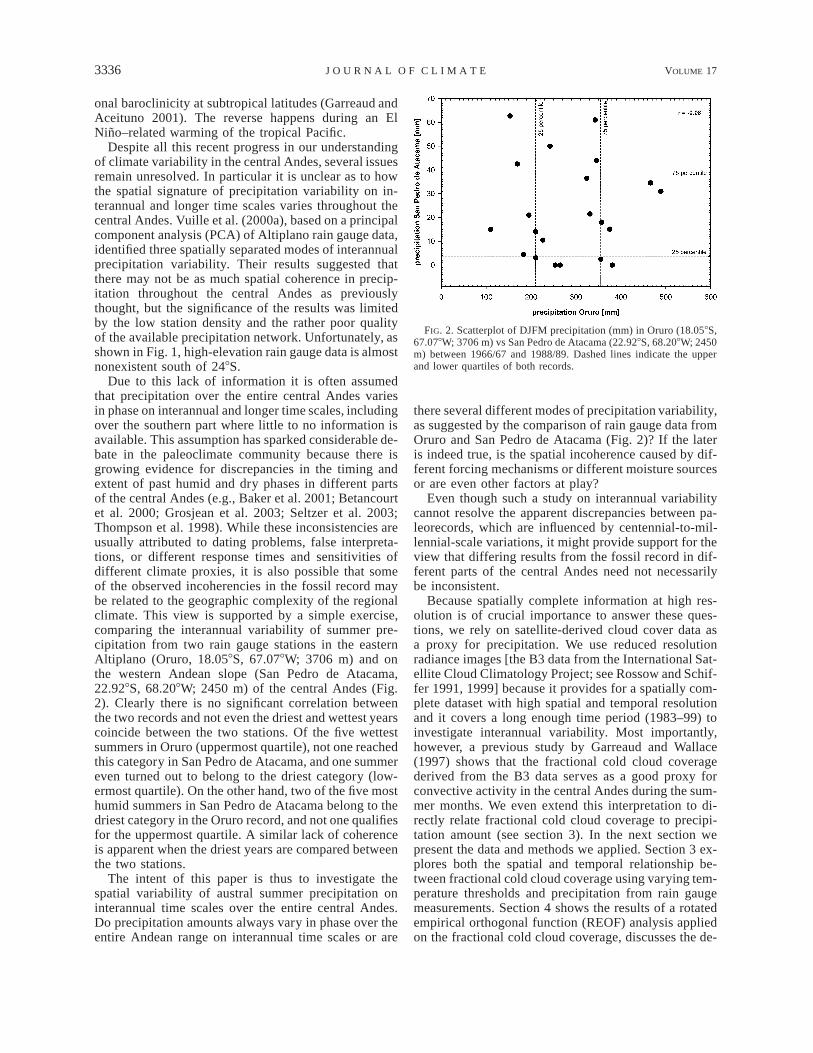
FIG. 2. Scatterplot of DJFM precipitation (mm) in Oruro (18.058S,67.078W; 3706 m) vs San Pedro de Atacama (22.928S, 68.208W; 2450m) between 1966/67 and 1988/89. Dashed lines indicate the upperand lower quartiles of both records.
onal baroclinicity at subtropical latitudes (Garreaud andAceituno 2001). The reverse happens during an ElNino–related warming of the tropical Pacific.
Despite all this recent progress in our understandingof climate variability in the central Andes, several issuesremain unresolved. In particular it is unclear as to howthe spatial signature of precipitation variability on in-terannual and longer time scales varies throughout thecentral Andes. Vuille et al. (2000a), based on a principalcomponent analysis (PCA) of Altiplano rain gauge data,identified three spatially separated modes of interannualprecipitation variability. Their results suggested thatthere may not be as much spatial coherence in precip-itation throughout the central Andes as previouslythought, but the significance of the results was limitedby the low station density and the rather poor qualityof the available precipitation network. Unfortunately, asshown in Fig. 1, high-elevation rain gauge data is almostnonexistent south of 248S.
Due to this lack of information it is often assumedthat precipitation over the entire central Andes variesin phase on interannual and longer time scales, includingover the southern part where little to no information isavailable. This assumption has sparked considerable de-bate in the paleoclimate community because there isgrowing evidence for discrepancies in the timing andextent of past humid and dry phases in different partsof the central Andes (e.g., Baker et al. 2001; Betancourtet al. 2000; Grosjean et al. 2003; Seltzer et al. 2003;Thompson et al. 1998). While these inconsistencies areusually attributed to dating problems, false interpreta-tions, or different response times and sensitivities ofdifferent climate proxies, it is also possible that someof the observed incoherencies in the fossil record maybe related to the geographic complexity of the regionalclimate. This view is supported by a simple exercise,comparing the interannual variability of summer pre-cipitation from two rain gauge stations in the easternAltiplano (Oruro, 18.058S, 67.078W; 3706 m) and onthe western Andean slope (San Pedro de Atacama,22.928S, 68.208W; 2450 m) of the central Andes (Fig.2). Clearly there is no significant correlation betweenthe two records and not even the driest and wettest yearscoincide between the two stations. Of the five wettestsummers in Oruro (uppermost quartile), not one reachedthis category in San Pedro de Atacama, and one summereven turned out to belong to the driest category (low-ermost quartile). On the other hand, two of the five mosthumid summers in San Pedro de Atacama belong to thedriest category in the Oruro record, and not one qualifiesfor the uppermost quartile. A similar lack of coherenceis apparent when the driest years are compared betweenthe two stations.
The intent of this paper is thus to investigate thespatial variability of austral summer precipitation oninterannual time scales over the entire central Andes.Do precipitation amounts always vary in phase over theentire Andean range on interannual time scales or are
there several different modes of precipitation variability,as suggested by the comparison of rain gauge data fromOruro and San Pedro de Atacama (Fig. 2)? If the lateris indeed true, is the spatial incoherence caused by dif-ferent forcing mechanisms or different moisture sourcesor are even other factors at play?
Even though such a study on interannual variabilitycannot resolve the apparent discrepancies between pa-leorecords, which are influenced by centennial-to-mil-lennial-scale variations, it might provide support for theview that differing results from the fossil record in dif-ferent parts of the central Andes need not necessarilybe inconsistent.
Because spatially complete information at high res-olution is of crucial importance to answer these ques-tions, we rely on satellite-derived cloud cover data asa proxy for precipitation. We use reduced resolutionradiance images [the B3 data from the International Sat-ellite Cloud Climatology Project; see Rossow and Schif-fer 1991, 1999] because it provides for a spatially com-plete dataset with high spatial and temporal resolutionand it covers a long enough time period (1983–99) toinvestigate interannual variability. Most importantly,however, a previous study by Garreaud and Wallace(1997) shows that the fractional cold cloud coveragederived from the B3 data serves as a good proxy forconvective activity in the central Andes during the sum-mer months. We even extend this interpretation to di-rectly relate fractional cold cloud coverage to precipi-tation amount (see section 3). In the next section wepresent the data and methods we applied. Section 3 ex-plores both the spatial and temporal relationship be-tween fractional cold cloud coverage using varying tem-perature thresholds and precipitation from rain gaugemeasurements. Section 4 shows the results of a rotatedempirical orthogonal function (REOF) analysis appliedon the fractional cold cloud coverage, discusses the de-

1 SEPTEMBER 2004 3337V U I L L E A N D K E I M I G
TABLE 1. Satellite data used in this study.
Time period Satellite Subsatellite lon
Dec 1983–Mar 1984Dec 1984–Mar 1987Dec 1987–Mar 1992Dec 1992–Mar 1995Dec 1995Jan 1996–Mar 1999
GOES-5GOES-6GOES-7Meteosat-3GOES-7GOES-8
758W978–1098W748–1118W698–758W1358W748–758W
rived modes of convective activity and precipitation,and links these main modes with the large-scale at-mospheric circulation. Section 5 ends with a summaryand some concluding remarks.
2. Data and methods
Several satellite-derived products are available tostudy tropical convection and a number of methods andalgorithms have been developed to estimate precipita-tion using visible, infrared and microwave imagery. Themost commonly used products are outgoing longwaveradation (OLR; e.g., Liebmann et al. 1998), the Geo-stationary Operational Environmental Satellite (GOES)Precipitation Index (GPI; e.g., Arkin and Meisner 1987;Morrissey and Greene 1993; Joyce and Arkin 1997), theSpecial Sensor Microwave Imager (SSM/I; e.g., Negriet al. 1994, 2000) and data from the Tropical RainfallMeasuring Mission (TRMM; e.g., Adler et al. 2000;Bendix et al. 2003). Some products, such as the GlobalPrecipitation Climatology Project (GPCP) and the Cli-mate Prediction Center (CPC) Merged Analysis of Pre-cipitation (CMAP) have combined information from sat-ellite and rain gauge data (e.g., Arkin and Xie 1994;Ebert et al. 1996; Huffman et al. 1997; Xie and Arkin1997). While all of these datasets have their advantagesand their limitations, none of them are very well suitedfor our purpose because of inadequate spatial resolution(OLR, GPI, GPCP, CMAP), temporal sampling (SSM/I,TRMM), or because of a too short record length (SSM/I,TRMM). Instead we used data from the InternationalSatellite Cloud Climatology Project (ISCCP), which hasbeen monitoring cloud properties at mesoscale resolu-tion for almost 20 yr (see Rossow and Schiffer 1999for a review of available products). A number of studieshave compared cloud data from ISCCP with satellite-derived or rain gauge–based estimates of precipitation(e.g., Marengo 1995; McCollum and Krajewski 1999;Todd and Washington 1999). Here we use ISCCP StageB3 data, a set of reduced volume infrared and visibleradiance images from the GOES, National Oceanic andAtmospheric Administration (NOAA), GeostationaryMeteorological Satellite (GMS) and Meteosat satellites.The B3 dataset is a compressed version of the originaldata with a resolution of 30 km, every 3 h (eight imagesper day, beginning at 0000 UTC) and is currently avail-able for the time period 1983–99. We use the calibratedvalues from the infrared (11.6 mm) dataset, representingequivalent blackbody temperatures T b emitted byclouds. Because the emitted temperature Tb at the cloudtop is directly proportional to the height of the cloudtop, it can be viewed as a measure of convective activity.Garreaud and Wallace (1997) successfully used this da-taset to study the diurnal cycle of convective activityover the tropical Americas, with a special emphasis onthe central Andes. In section 3 we show that the seasonalfractional cold cloud coverage derived from the originaldata is not only a good measure of convective activity,
but can be used directly as a reasonably good estimateof precipitation.
From the 3-hourly global datasets we extracted allavailable images for the months December to Marchbetween 1983 and 1999. Table 1 lists the satellites usedin this study with their corresponding sublongitudes. Foroverlapping time periods when information from severalsatellites was available, we used data from the satellitewith the smallest zenith angle (the one for which thelongitudinal distance between satellite sublongitude andthe central Andes is the least). Nonetheless variationsin zenith angle lead to a considerable bias of the equiv-alent brightness temperature Tb recorded by the satellite,with Tb being increasingly colder at locations fartheraway from the satellite nadir point (Joyce et al. 2001;Janowiak et al. 2001). This effect, known as limb dark-ening, is due to increased obstruction of radiation emit-ted from the earth’s surface by the sides of clouds withincreasing zenith angle (geometric effect) and the longeroptical path, which increases attenuation and emissionby cloud matter and water vapor (radiative effect). Weused the technique developed by Joyce et al. (2001) toadjust for this bias in each individual pixel of all imagesused. Comparison of the final seasonal (DJFM) com-posites, indicating the fraction of days F* with coldcloud coverage below 240 K (see section 3), with andwithout adjusting for this limb-darkening effect, showsthat the fraction of days F* with cold cloud coverageis reduced between 1% and 12% over the central Andesonce such a correction is applied. The changes dependon the subsatellite longitude, the location of the pixeland its brightness temperature Tb, and are largest forlarge zenith angles and temperatures around 230 K.
Each corrected image was subsequently geocoded andresampled into a new 0.338 latitude 3 0.338 longitudegrid, by averaging all pixel values located within eachgrid cell. Subsets over the domain 158–308S, 768–628Wwere extracted from each image for further processing.The choice of the grid-size resolution is a compromisebetween achieving the highest possible spatial resolu-tion and still maintaining a coarse enough resolution toguarantee pixel information in almost all grid cells. Ourresolution is thus considerably finer than that in thestudy by Garreaud and Wallace (1997), who used a 0.58latitude 3 0.58 longitude grid. A number of days aremissing in the B3 dataset, which together with the high-resolution resampling occasionally resulted in grid cellswithout information. However, since our analysis is

3338 VOLUME 17J O U R N A L O F C L I M A T E
TABLE 2. Percentage of days with data available at either 0000 or2100 UTC (averaged over all grid cells) between Dec and Mar ineach year.
Year %
1983/841984/851985/861986/871987/88
9891909275
1988/891989/901990/911991/921992/93
9095989797
1993/941994/951995/961996/971997/981998/99
899877928295
FIG. 3. Time–latitude diagram of diurnal cycle of fractional cold( 5 235 K) cloud coverage F* along 688W between 158 and 308ST*bduring DJF (avg 1983–91). Shading indicates values of F* . 5%(see scale below). Contour lines indicate 1% and 2%, respectively.Data are from Garreaud and Wallace (1997).
based on seasonal averages this should not affect theoutcome of the results. As shown in Table 2 all summerswere at least 75% complete and only in 3 yr (1987/88,1995/96, and 1997/98) were data available less than89% of the time (averaged over all grid cells).
Summertime convection and precipitation in the cen-tral Andes occurs almost exclusively in the late after-noon and early evening hours, presumably related tofavorable thermodynamic conditions (Fuenzalida andRutllant 1987; Garreaud and Wallace 1997). Figure 3illustrates this behavior based on the diurnal cycle ofconvective activity (fraction of days with Tb , 235 K)along the Altiplano at 688W between 158 and 308S.Since cold convective clouds occur with a frequency ofless than 2% (i.e., only on 2–3 days per summer) be-tween midnight and early afternoon, and we are onlyinterested in knowing whether rain producing convec-tive activity occurs on any given day, but not at whichtime of the day, we only used twice-daily data (2100and 0000 UTC, corresponding to 1700 and 2000 localtime in the central Andes). It is only north of 168S, asone descends along the northeast slopes of the Andes,where this characteristic changes and convective activitysuddenly exhibits a more equally distributed diurnal cy-cle with an early morning maximum (see Fig. 3). There-fore our analysis is restricted to the southern part of thecentral Andes (south of 158S) and to the higher eleva-tions (.3000 m along the northeast slopes and .1500m elsewhere).
From the twice-daily data seasonal (DJFM) compos-ites, indicating the fraction of days F* with cold cloudcoverage below a given temperature threshold , atT*beither 2100 or 0000 UTC were produced. The value F*thus describes the number of days (in %) per seasonwhen the cloud-top temperature Tb dropped below agiven threshold at either 2100 or 0000 UTC. The com-monly used threshold for convective activity is 235T*bK (Arkin and Meisner 1987). However, since we were
interested in achieving the best possible regional matchbetween the fraction of days with cold cloud coverageF* and rain gauge–based precipitation measurementsfrom the central Andes, we performed a series of testswith varying thresholds , to come up with the bestT*bpossible precipitation estimate (see section 3).
Monthly rain gauge totals from a network of stationsin Peru, Bolivia, and Chile were extracted from an An-dean precipitation database described in Vuille et al.(2000a,b). Data for Argentina was obtained from theBianchi and Yanez (1992) database.
The large-scale tropospheric circulation was analyzedbased on NOAA–Outgoing Longwave Radiation(NOAA–OLR) data (Liebmann and Smith 1996), andreanalysis fields produced by the National Centers forEnvironmental Prediction–National Center for Atmo-spheric Research (NCEP–NCAR), described in detail inKalnay et al. (1996) and Kistler et al. (2001). TheNCEP–NCAR reanalysis data consists of globally com-plete fields on a 2.58 latitude 3 2.58 longitude grid,including all mandatory pressure levels from 1000 to10 hPa (humidity up to only 300 hPa), as well as thenear-surface level (0.995 sigma).

1 SEPTEMBER 2004 3339V U I L L E A N D K E I M I G
FIG. 4. Precipitation amount (mm) vs number of days with pre-cipitation in DJFM at station Cotacotani (18.208S, 69.238W; 4500 m)between 1960 and 1991, (except missing data for summer 1961/62).
FIG. 5. Spatial correlation between seasonal rain gauge totals andfractional cold cloud cover F* as a function of based on a wetT*b(1983/84) and a dry (1989/90) summer (DJFM) with stations ,3000m along the northeast slope included (open symbols) and excluded(filled symbols) from correlation analysis. Correlations are based on174 and 162 (northeast slope excluded) data pairs, respectively.
3. Relationship between precipitation andfractional cold cloud coverage F*
The value F*, as defined here, only indicates on howmany days per season Tb reached a value below thethreshold at either 1700 or 2100 local time, but itT*bdoes not reveal how much below the threshold or forhow many hours. Hence we can not directly apply arain rate (e.g., 3 mm h21; Arkin and Meisner 1987) toour estimate of F*. However, as shown later, empiricalevidence indicates that there is nonetheless a very closerelationship between F* and precipitation amount onseasonal time scales. The main reason for this closeassociation is related to the convective nature of pre-cipitation on the Altiplano, which leads to a significantrelationship between Tb and precipitation of individualrainfall episodes (Garreaud 2000a). On seasonal time-scales, the inherently episodic nature of precipitation onthe Altiplano further strengthens this relationship, be-cause it leads to a high correlation between seasonalprecipitation amount and the number of days on whichprecipitation occurs. Figure 4 shows such an examplebased on 30 yr of daily data from the station Cotacotani(18.208S, 69.238W; 4500 m) on the border betweenChile and Bolivia. Evidently the seasonal precipitationamount is by and large a result of the number of dayson which precipitation occurs (r 5 0.88, p , 0.001), anumber that can easily be approximated by F*, giventhat the threshold is correctly chosen.T*b
a. Spatial correlation
To calculate the spatial correlation between precipi-tation amount and fractional cold cloud coverage F*,seasonal precipitation totals for each grid box were de-termined by averaging all available rain gauge mea-surements within each 0.338 latitude 3 0.338 longitudegrid cell. Since the precipitation network in the centralAndes is sparse and we relied on a high-resolution grid,
only few cases occurred where more than one stationfell within a certain grid box and many grid boxes re-mained empty.
The correlation between grid-cell precipitation andfractional cold cloud coverage F*, was calculated sev-eral times using different temperature thresholds be-T*btween 215 and 270 K (in 5-K increments), to determinewhich threshold yields the most accurate estimate ofprecipitation amount. Figure 5 shows the results fromthis analysis averaged over two extreme seasons, thewet summer 1983/84 and the dry summer 1989/90. Thehigh correlations, ranging from 0.78 to 0.83 (all sig-nificant at p , 0.001), point toward a close relationshipbetween F* and precipitation amount. If data from thenortheastern slope of the Andes, where precipitationdoes not exclusively fall in late afternoon and earlyevening hours (Fig. 3), are excluded from the analysis.the correlation is even higher (r value between 0.84 and0.90). Between 230 and 260 K the correlation analysisyields a broad and quite flat maximum, indicating thatit matters little which threshold is used. It is onlyT*bbelow 230 K and above 260 K where the correlationsstart to drop off significantly. Even though the corre-lations vary little, a peak at 240 K is evident, whichlead us to use this value as threshold for our subsequentanalysis.
Table 3 lists the correlation coefficient r and the slopeof the regression b between precipitation and F* (basedon a threshold 5 240K) separately for each summerT*bbetween 1983/84 and 1995/96. After 1996 insufficientstation data were available to verify the relationship with

3340 VOLUME 17J O U R N A L O F C L I M A T E
TABLE 3. Correlation coefficient r and spatial slope b (in mm %21)of linear regression between seasonal fractional cold (Tb* 5 240 K),cloud coverage F* (%), and seasonal rain gauge totals (mm) duringaustral summer (DJFM). Rain gauge data from the NE slope ,3000m has been excluded. Only years 1983/84–1995/96, with sufficientrain gauge data for comparison (.25 stations), are shown.
Year (DJFM) r b
1983/841984/851985/861986/871987/88
0.850.900.830.840.88
10.259.989.959.639.69
1988/891989/901990/911991/92
0.830.850.870.80
9.4910.78
9.6010.82
1992/931993/941994/951995/96
0.760.830.790.84
9.879.439.97
10.14
FIG. 6. Map of temporal correlation (1983–99) between seasonal(DJFM) fractional cold ( 5 240 K) cloud cover F* and rain gaugeT*bdata in the central Andes.
F*. The correlation varies between 0.76 and 0.90 (allsignificant at p , 0.001), and the slope of the regressionis on the order of 9.4–10.8 mm %21. This analysis thusconfirms that the spatial relationship between F* andprecipitation amount is stable over time. The quality ofthis relationship is quite remarkable given the high res-olution of our grid, as correlations between precipitationamount and F* tend to increase with larger grid cellsize (Richards and Arkin 1981).
b. Temporal correlation
Since the spatial correlation between precipitation andF* can not be used to deduce the quality of the temporalcorrelation at one specific site, it is worthwhile to in-vestigate how this precipitation–cloud coverage rela-tionship compares between individual stations through-out the central Andes. This is especially important sinceFig. 5 indicated a significant increase in the spatial cor-relation when data from the northeast slope of the Andeswere excluded. Figure 6 shows the temporal correlationbetween seasonal (DJFM) precipitation amount and F*at all grid cells where at least 10 yr of data were avail-able. The correlation is generally highest (r . 0.8) alongthe western cordillera north of 248S, while the valuesare somewhat lower (r values mostly in the order of0.6–0.8) further to the east. In the southernmost part ofthe central Andes data coverage is very poor, but thelimited information available suggests that the temporalcorrelation is reasonably good (r values between 0.63and 0.83). The only region where this relationship ap-parently falls apart (r values ,0.4) is to the northeastof the central Andes near the slope toward the Amazonbasin. The most probable explanation for this poor re-lationship is the change in the diurnal cycle of convec-tive activity (Fig. 3), and that the data used in this study(at 2100 and 0000 UTC) therefore does not capture thetrue number of days on which the temperature threshold
5 240 K is reached. It is also possible that theT*bthreshold , for which the correlation between precip-T*bitation and fractional cold cloud coverage F* is best,varies somewhat across the Andes. Overall however, thehigh correlations indicate that F* is not only a goodmeasure of convective activity, but also provides a rea-sonably good estimate of precipitation amount over thewestern, southern, and even the eastern central Andessouth of 228S.
4. Interannual variability of convective cloudinessand precipitation
Figure 7 shows four typical patterns of DJFM frac-tional cold ( 5 240 K) cloud coverage F* as stan-T*bdardized departures from the long-term mean (1983–99). 1983/84 (Fig. 7a) and 1997/98 (Fig. 7b) representthe typical case of a wet and dry year, respectively,where convective activity and precipitation amounts didindeed vary in phase throughout the Altiplano, consis-tent with the prevailing view that on interannual timescales the entire central Andes tend to show precipita-tion anomalies of the same sign. The only significantdeviation from this pattern occurred in southwesternPeru in 1997/98 (Fig. 7b), probably associated with en-hanced convective activity over the coastal Pacific re-gion during the 1997/98 El Nino event. Similar patternswith anomalies of the same sign throughout the studyregion are apparent in 1986/87 (wet) and 1987/88, 1989/90, and 1991/92 (all dry), respectively (not shown).
The more frequent situation, however, consists of de-partures of opposite sign to the north and the south. In

1 SEPTEMBER 2004 3341V U I L L E A N D K E I M I G
FIG. 7. Departure (standardized anomalies) of DJFM fractional cold ( 5 240 K) cloud coverage F*T*bfrom long-term mean (1983–99) in (a) 1983/84, (b) 1997/98, (c) 1992/93, and (d) 1996/97. Only resultsfor regions .1500 m are shown and northeast slope between 1500 and 3000 m is masked in gray. Blacklines indicate 0-, 1500-, and 3000-m contour line.
1992/93, for example, wet conditions prevailed over theentire southern Altiplano, while it was dry to the north(Fig. 7c). In 1996/97 the situation was reversed withpositive anomalies in the north but dry conditions to thesouth (Fig. 7d). Similar patterns are apparent in 1984/85, 1985/86, and 1990/91 (wet to the north and dry inthe south) and 1994/95 (dry to the north and wet in thesouth), respectively (not shown). However the N–S pre-cipitation gradient (Fig. 1a) is never fully reversed, thatis precipitation totals are still higher to the north, evenin the situation shown in Fig. 7c. Although such anantiphasing between south and north has not been rec-ognized before, it is consistent with results by Garreaud(2000a, see his Fig. 5), who shows that daily values of
Tb in a grid box at 17.58S are significantly correlatedwith Tb elsewhere between ;128 and 218S, but not fur-ther to the south.
a. REOF analysis
To decompose the precipitation signal into its regionalcomponents with common modes of variance, we ap-plied a rotated empirical orthogonal function (REOF)based on the correlation matrix of the standardized sea-sonal fractional cloud cover anomalies. While rotationleads to a relaxation of orthogonality and hence a lossof complete independence between the individual ro-tated EOFs, it helps to avoid problems with subdomain

3342 VOLUME 17J O U R N A L O F C L I M A T E
FIG. 8. (a) The first REOF 1 of fractional cold ( 5 240 K) cloud coverage F* in the central Andes. Percentage indicates total varianceT*bexplained. Only loadings $0.5 for regions .1500 m are shown and northeast slope between 1500 and 3000 m is masked in gray. Blacklines indicate 0-, 1500-, and 3000-m contour line. (b)–(c) As in (a) but for REOFs 2–3.
FIG. 9. (a) The first RPC 1 of DJFM fractional cold ( 5 240 K)T*bcloud coverage F*. (b) As in (a) but for RPC 2. White symbolsindicate average DJFM latitudinal position of 0 m s21 200-hPa zonalwind component at 708W (scale is reversed and plotted on right axis).(c) As in (a) but for RPC 3.
instability and generally leads to modes of variability,which are physically more meaningful (Richman 1986).Three modes were well resolved based on the criterionof North et al. (1982) and retained for Varimax rotation(Richman 1986). Those three leading rotated modes ex-plain 31.3%, 24.4%, and 14.5% of the total variance,respectively. Their eigenvectors reveal a nice spatialseparation with high loadings in the south (REOF 1),
northwest (REOF 2), and northeast (REOF 3), respec-tively (Fig. 8). The related principal components timeseries are shown in Fig. 9. Since REOF 3 exhibits high-est loadings in the northeast close to the region wherethe diurnal cycle of convective activity is altered (Fig.3) and the correlation with precipitation deterioratesconsiderably (Fig. 6), this mode was not included infurther analysis. We do not feel confident in interpretingREOF 3 as a representative mode of precipitation var-iability in this region.
b. Analysis of vertical cross sections
Since a number of studies have pointed out that theupper-tropospheric circulation aloft the central Andesexerts the primary control on precipitation variabilityon all time scales, it is of considerable interest to seewhether this is indeed the case for the two remainingmodes REOF 1 and 2. We used regression analysis toinvestigate the atmospheric circulation over both theREOF 1 and REOF 2 domains. The regression fieldspresented in Figs. 10 and 11 show the local NCEP–NCAR wind field and humidity anomalies in pressure–latitude (along 658W) and pressure–longitude cross sec-tions (along 27.58 and 17.58S) associated with a unitanomaly in the reference time series (principal com-ponents). The use of the rather coarse NCEP–NCARreanalysis data to study mesoscale circulation in a regionof high topographic relief may be somewhat question-able. However, Garreaud (2000a) has shown that theNCEP–NCAR reanalysis and near-surface in situ mea-surements of mixing ratio in the central Andes correlatereasonably well and that the reanalysis data captures

1 SEPTEMBER 2004 3343V U I L L E A N D K E I M I G
FIG. 10. (a) Pressure–latitude cross section to the east of the Andes (658W, between 358 and 108S) of RPC 1 regressed upon NCEP–NCARreanalysis zonal and meridional wind and vertical velocity. Wind vectors indicate meridional (m s 21) and vertical velocity anomalies(Pa s21) associated with a unit anomaly of the RPC 1 time series. Vectors are only plotted where the correlation between either meridionalwind or vertical velocity component and RPC 1 is significant at p # 0.05. Reference vector is given below. Contour lines indicate zonalwind speed anomalies; contour interval is 0.25 m s21 per std dev; zero-contour line is omitted and negative contours are dashed. Gray shadingindicates regions where the correlation between zonal wind and RPC 1 is significant at p # 0.05. Black area indicates Andean topography.(b) As in (a) but for RPC 2.
FIG. 11. (a) Pressure–longitude cross section at 27.58S of RPC 1 regressed upon NCEP–NCAR reanalysis zonal and meridional wind,vertical velocity, and specific humidity. Wind vectors indicate zonal (m s21) and vertical velocity anomalies (Pa s21) associated with a unitanomaly of the RPC1 time series. Vectors are only plotted where the correlation between either zonal wind or vertical velocity componentand RPC 1 is significant at p # 0.05. Reference vector is given below. Contour lines indicate meridional wind speed anomalies; contourinterval is 0.2 m s21 per std dev; zero contour line is omitted and negative contours are dashed. Dark (light) gray shading indicates regionswhere the correlation between specific humidity and RPC 1 is significant at p # 0.05 (0.1). Note that specific humidity data only extendsup to 300 hPa. Black area indicates Andean topography. (b) As in (a) but for RPC 2 at 17.58S.
most of the intraseasonal variability in near-surface hu-midity. Hardy et al. (2003) have shown that NCEP–NCAR 400–500-hPa temperature in a grid box centeredat 17.58S, 708W closely correlates with local air tem-perature measured on the summit of Sajama volcano(18.18S, 68.98W; 6542 m) on seasonal-to-interannualtime scales. Nieto Ferreira et al. (2003) provide evidencefor a close resemblance between observed and reana-lyzed daily fluctuations of the low-level meridional windto the east of the central Andes. Finally, Aceituno andMontecinos (2000) have reported that the reanalysiscaptures the general structure of the easterly moisture
flux with a maximum at 500 hPa over the Altiplano,although it underestimates its intensity. All this evidenceleads us to believe that the reanalysis fields do indeedcapture the essential features of the atmospheric cir-culation, at least in low levels to the east of the Andesand in the middle and upper troposphere.
The regression fields in Fig. 10 indeed indicate thateasterly (westerly) upper- and midtropospheric windanomalies dominate during wet (dry) summers overboth the REOF 1 (;228 to 358S) and the REOF 2 do-main (;108 to 228S). In both cases significant anoma-lous upper-air flow is limited to the region aloft its own

3344 VOLUME 17J O U R N A L O F C L I M A T E
FIG. 12. (a) Correlation of RPC 1 with NCEP–NCAR near-surface (0.995 sigma level) specific humidity.Only contours $0.4 over the continent are shown. Contour interval is 0.05. Correlations $0.5 (significantat p , 0.05) are shown as bold lines. Shading indicates Andean topography .1500 m. (b) As in (a) but forRPC 2.
domain, while a complete although insignificant signreversal of the upper-air wind anomalies occurs over theneighboring domain. This configuration provides themost likely scenario to explain the apparent antiphasingof wet and dry conditions as seen in Figs. 7c and 7d.It follows that the characterization of precipitation var-iability in the central Andes requires knowledge not onlyof the sign and strength but even more so of the exactlocation and extent of the anomalous flow. This notion,consistent with the results by Garreaud and Aceituno(2001), is illustrated by correlating rotated principalcomponent 2 (RPC 2) with the mean DJFM latitude ofthe southernmost limit of easterly winds (DJFM u200 50 m s21) at 708W. The resulting r value of 20.75 (Fig.9b) is larger than that between RPC 2 and the mean200-hPa zonal flow aloft (r 5 20.67, not shown). Thisresult can be interpreted in the sense that the farthersouth the seasonal expansion of the upper-air easterliesreaches, the wetter the summer in the REOF 2 domainwill be. Meridional wind and vertical velocity anomalieson the other hand do not appear to be closely relatedto convective activity in either of the two domains.
The pressure–longitude cross sections in Fig. 11 con-firm the easterly/wet–westerly/dry relationship at both27.58S for REOF 1 and at 17.58S for REOF 2. Howeverthere appears to be a fundamental difference in the con-nection between convective activity in the central Andesand low-level moisture availability in the lowlands tothe east between the two domains. At 27.58S convectiveactivity in the central Andes is significantly correlatedwith specific humidity in the lower troposphere to theeast of the Andes (Fig. 11a) suggesting that changes inthe moisture source region to the east might influenceprecipitation variability in the Andes. Farther to the
north at 17.58S such an influence is not at all apparent.Here enhanced convective activity is associated witheasterly wind anomalies, decreased subsidence over theeastern Pacific and significantly increased specific hu-midity over the western cordillera and farther down-stream to the west of the Andes (Fig.11b). There ishowever no apparent connection with moisture changesin the source region to the east. A correlation analysisbetween near-surface (0.995 sigma level) specific hu-midity and RPC 1 and RPC 2, confirms the notion thatprecipitation variability in the REOF 1 domain is influ-enced by low-level moisture fluctuations to the east,while this is not the case in the REOF 2 region (Fig.12). RPC 2 is significantly correlated with near-surfacespecific humidity over the northern Altiplano (the do-main of its eigenvector REOF 2), but not elsewhere (Fig.12b). This is consistent with previous studies showingthat intraseasonal moisture variability in the northernpart of the central Andes is not directly related to hu-midity fluctuations in the lowlands to the east (Garreaud2000a). Our results indicate that the same is also trueon interannual time scales. For the dry southern regionof the central Andes however, moisture fluctuations inthe lowlands to the southeast appear to be very relevant(Fig.12a). Here the interannual variability of the watervapor content in the source region to the east is almost3 times as large as farther north in the source region ofREOF 2.1 This might explain why there is such a highcorrelation between convective activity in the REOF 1
1 The standard deviation of the DJFM near-surface specific hu-midity between 1983 and 1999 is 0.36 g kg21 at 18.18S, 65.68W and0.99 g kg21 at 31.48S, 65.68W (location of maximum correlation inFig. 12a).

1 SEPTEMBER 2004 3345V U I L L E A N D K E I M I G
FIG. 13. (a) RPC 1 regressed upon DJFM 200-hPa NCEP–NCAR geopotential height and wind. Wind field is only plotted where thecorrelation between either zonal or meridional wind component and RPC 1 is significant at p # 0.05. Scale for wind vector (in m s21 perstd dev) is shown below. Contour interval is 5 gpm per std dev; negative contours are dashed. (b) As in (a) but for NOAA-interpolatedOLR and 200-hPa wind. Shading indicates OLR values above (below) 2.5 (22.5) W m22 per std dev (see scale below). (c) As in (a) butfor RPC 2. (d) As in (b) but for RPC 2.
domain and near-surface humidity fluctuations in themoisture source region to the southeast. Interannual var-iability in moisture content to the east of the centralAndes in turn is influenced by variations in the strengthof the Andean low-level jet (ALLJ), a conveyor beltwhich transports warm, moist air from the Amazon ba-sin toward subtropical latitudes (e.g., Saulo et al. 2000;Vernekar et al. 2003; Marengo et al. 2002), but also byextratropical cold air incursions (e.g., Garreaud 2000b).The weak but insignificant negative correlation betweenconvective activity in the REOF1 domain and the low-level meridional flow to the east of the Andes (Fig. 11a)suggests such a possible relationship with interannualvariations in the intensity of the ALLJ. An in-depthanalysis of the potential influence of the ALLJ on con-vection and precipitation in the southernmost centralAndes, however, is beyond the scope of this paper andwill be the focus of future work.
c. Large-scale analysis
To further investigate the causal relationship betweenthe dominant modes of convective activity and the large-scale atmospheric circulation we regressed the time se-ries of RPC 1 and RPC 2 upon DJFM OLR, and both200-hPa NCEP–NCAR geopotential height and wind
fields. The regression patterns of the two modes do notshare much in common, except that they both showsignificant easterly wind anomalies associated with wetconditions aloft the region of highest EOF loadings (Fig.13). Consistent with the results from the analysis ofvertical cross sections the large-scale regression fieldsindicate that the upper-air zonal flow is crucial in de-termining whether conditions are wet or dry in bothregions. The regression field of RPC 1 shows significantOLR anomalies over the Andes between 208 and 308S,indicative of enhanced convective activity and consis-tent with the results based on ISCCP imagery (Fig. 13b).Interestingly the most significant anomalies in geopo-tential height and wind field occur over the SouthernHemisphere midlatitudes, with an anticyclonic anomalycentered over southeastern South America (Fig. 13a).Projecting the anomaly on to the mean flow shows thatthis feature can be interpreted as a southward displace-ment of the Bolivian high. The associated relaxation ofthe upper-air westerly winds (easterly anomalies) allowsepisodic easterly transport of humid air toward the sub-tropical Andes. A similar pattern has been identified asone of the leading modes related to wet conditions inthe central Andes on intraseasonal time scales (Vuilleet al. 1998) and has been attributed to Rossby wavedispersion from the Southern Hemisphere extratropics,

3346 VOLUME 17J O U R N A L O F C L I M A T E
influencing the positioning of the Bolivian high (Gar-reaud 1999; Lenters and Cook 1999). Although the in-fluence of Rossby wave activity on the intensity andstrength of the Bolivian high is commonly assumed tobe strongest on intraseasonal time scales, our resultssuggest that such a forcing also acts as a primary controlon precipitation variability on interannual time scalesfor the southernmost part of the central Andes. Thisassumption is reasonable since precipitation in much ofthe REOF 1 domain is very sporadic and the seasonaltotals (50–200 mm; Fig. 1a) are based on a few rainfallevents per summer only. Hence the interannual signalmust be strongly influenced by intraseasonal variability.
The regression field of RPC 2 on the other hand re-veals circulation anomalies which are largely tropicalin nature. OLR anomalies show negative departures,indicative of enhanced convective activity and precip-itation, along the entire tropical Andes between 108Nand 208S (Fig. 13d). These anomalies are caused by asignificant enhancement of the upper-air easterly flowover the entire tropical Pacific–South American domainand in particular aloft the Andes. At its southern borderthese easterly anomalies (weakened upper-air westerlywinds) are in geostrophic balance with reduced merid-ional baroclinicity over the eastern Pacific, caused bycooling at low and warming at subtropical latitudes (Fig.13c), consistent with the mechanism put forward byGarreaud and Aceituno (2001). Large OLR anomaliesextend over the central equatorial Pacific and the SouthPacific convergence zone (SPCZ) (Fig. 13d). All ofthese features are consistent with the interannual re-gression field derived from an Altiplano convective in-dex by Garreaud and Aceituno (2001). In general thispattern is reminiscent of the atmospheric response to aLa Nina event, known to cause positive precipitationanomalies in the Altiplano and closely resembles theENSO-related anomalies presented by Yulaeva and Wal-lace (1994). Correlation of this mode with sea surfacetemperature anomalies (SSTAs) reveals the typicalENSO tongue, with negative correlations extendingfrom the west coast of South America across the tropicalPacific to the date line, and positive correlations to thenorth and south (not shown).
5. Summary and conclusions
Our analysis, based on twice-daily ISCCP-B3 reducedresolution radiance data corrected for limb-darkeningeffects and in situ rain gauge measurements, indicatesthat the fractional cold cloud coverage F* derived fromthe ISCCP-B3 data is a reasonably good proxy for sum-mertime convective activity and precipitation over mostof the central Andes. The correlation between F* andprecipitation amount is highest when a temperaturethreshold 5 240 K is used and applies everywhere,T*bexcept over the northeastern portion of the central An-des. The analysis of 16 yr (1983/84–1998/99) of dataindicates that the prevailing view of precipitation de-
partures varying in phase throughout the entire Altipla-no needs to be revised. While some years show precip-itation anomalies of the same sign along the entire cen-tral Andes between 158 and 308S, more often the northand the south are out of phase. A REOF analysis con-firms this notion yielding three spatially separatedmodes in the south, the northwest, and the northeast.
Regression analysis indicate that the upper-air zonalflow is the main control on precipitation anomalies inboth the northern and southern part of the central Andes,with an anomalous easterly flow aloft favoring wet con-ditions and westerly flow producing dry conditions. Ifthese wind anomalies are centered over the central partof the Altiplano and extend far enough north and south,the entire Altiplano will behave more or less coherently.This is consistent with many previous studies, but ourresults further indicate that these wind anomalies do notalways extend over the entire area from 158 to 308S,thereby causing wet conditions in the north and dryconditions to the south or vice versa. Hence besides thesign and the strength of the upper-air zonal flow, itsexact location and extent are equally important to de-termine the spatial pattern of precipitation anomalies inthe central Andes.
The regression of the principal component time seriesupon 200-hPa geopotential height, wind, and OLR dataindicates that interannual variability of convective ac-tivity and precipitation is caused by two different mech-anisms. The southern central Andes receive above-av-erage precipitation in association with a Bolivian highdisplaced anomalously far south. The intensity and po-sitioning of the anomalous anticyclone is influenced byRossby wave dispersion from the Southern Hemisphereextratropics. This pattern is similar to a previously pre-sented leading mode of atmospheric circulation, re-sponsible for precipitation variability in the central An-des on intraseasonal time scales. Since precipitation inthe dry southern central Andes is inherently episodicand the seasonal totals (50–200 mm) are based on a fewrainfall events per summer only, it is reasonable to as-sume that the interannual signal is strongly influencedby intraseasonal variability. Further north interannualvariability in convective activity and precipitation islargely of tropical nature. Wet summers are related toenhanced upper-air easterly wind anomalies aloft, withthe winds in geostrophic balance with the reduced me-ridional baroclinicity over the eastern Pacific, caused bycooling at low and warming at subtropical latitudes.Given the linear nature of our analysis the pattern duringdry summers is essentially reversed. Hence the circu-lation anomalies are reminiscent of the atmospheric re-sponse to ENSO events and in good agreement with thepreviously reported mechanism causing ENSO-relatedprecipitation departures in the central Andes (Garreaudand Aceituno 2001).
Besides the different atmospheric circulation mech-anisms causing wet and dry summers in the regions ofREOF 1 and 2, it appears as if the importance of mois-

1 SEPTEMBER 2004 3347V U I L L E A N D K E I M I G
ture fluctuations in the lowlands to the east is also adistinguishing factor between the two domains. RPC 2is significantly correlated with near-surface specific hu-midity in the northern central Andes, that is, in the do-main of its own eigenvector REOF 2, but not elsewhere.In particular there is no correlation with moisture fluc-tuations in the source region to the east, consistent withresults from previous studies on intraseasonal timescales. For the dry southern region of the central Andeshowever, moisture fluctuations in the lowlands to thesoutheast appear to be very relevant. Here wet condi-tions are accompanied by an enhanced specific humidityin the lower troposphere to the east of the Andes. Thereason why low-level moisture fluctuations to the eastmatter for the southern but not for the northern centralAndes is not entirely clear, but may be related to thefact that the interannual variability of the water vaporcontent in the source region to the east is almost 3 timeslarger in the south at 318S than farther north in thesource region of REOF 2 at 188S.
Acknowledgments. We wish to thank Robert Joyce forhis review and for providing us with the algorithm forthe zenith-angle correction. Rene Garreaud is gratefullyacknowledged for his helpful comments on this man-uscript and for contributing the data for Fig. 3. YelenaYarosh provided us with the information on weeklyGOES subsatellite longitude positions. Ricardo Villalbaand Martin Trauth contributed the precipitation data forArgentina. Two anonymous reviewers helped us withinspiring comments and suggestions that lead to a sub-stantial improvement of this manuscript. ISCCP-B3 datawere obtained from the NASA Langley Research CenterAtmospheric Sciences Data Center. NCEP–NCAR re-analysis and OLR data were provided by NOAA–CIRESClimate Diagnostics Center. This study was funded byNSF Grant ATM-0214285.
REFERENCES
Aceituno, P., 1988: On the functioning of the Southern Oscillationin the South American sector. Part I: Surface climate. Mon. Wea.Rev., 116, 505–524.
——, and A. Montecinos, 1993: Circulation anomalies associatedwith dry and wet periods in the South American Altiplano. Pre-prints, Fourth Int. Conf. on Southern Hemisphere Meteorologyand Oceanography, Hobart, Tasmania, Australia, Amer. Meteor.Soc., 330–331.
——, and ——, 1997: Meteorological field experiments in the SouthAmerican Altiplano. Preprints, Fifth Int. Conf. on SouthernHemisphere Meteorology and Oceanography, Pretoria, SouthAfrica, Amer. Meteor. Soc., 330–331.
——, and ——, 2000: Diurnal cycle over the South American Al-tiplano: Comparison of NCEP/NCAR reanalysis with upper-airobservations during the Visviri field experiment. Preprints, SixthInt. Conf. on Southern Hemisphere Meteorology and Ocean-ography, Santiago, Chile, Amer. Meteor. Soc., 412–413.
Adler, R. F., G. J. Huffman, D. T. Bolvin, S. Curtis, and E. J. Nelkin,2000: Tropical rainfall distributions determined using TRMMcombined with other satellite and rain gauge information. J.Appl. Meteor., 39, 2007–2023.
Arkin, P. A., and B. N. Meisner, 1987: The relationship between large-
scale convective rainfall and cold cloud over the Western Hemi-sphere during 1982–84. Mon. Wea. Rev., 115, 51–74.
——, and P. Xie, 1994: The Global Precipitation Climatology Project:First algorithm intercomparison project. Bull. Amer. Meteor.Soc., 75, 401–420.
Arnaud, Y., F. Muller, M. Vuille, and P. Ribstein, 2001: El Nino–Southern Oscillation (ENSO) influence on a Sajama volcanoglacier from 1963 to 1998 as seen from Landsat data and aerialphotography. J. Geophys. Res., 106, 17 773–17 784.
Baker, P. A., and Coauthors, 2001: The history of South Americantropical precipitation for the past 25,000 years. Science, 291,640–643.
Bendix, J., S. Gaemmerler, C. Reudenbach, and A. Bendix, 2003: Acase study of rainfall dynamics during El Nino/La Nina 1997/99 in Ecuador and surrounding areas as inferred from GOES-8and TRMM-PR observations. Erdkunde, 57, 81–93.
Betancourt, J. L., C. Latorre, J. A. Rech, J. Quade, and K. A. Rylander,2000: A 22,000-yr record of monsoonal precipitation from north-ern Chile’s Atacama desert. Science, 289, 1542–1546.
Bianchi, A. R., and C. E. Yanez, 1992: Las precipitaciones en elnoroeste Argentino. Instituto Nacional de Technologia Agro-pecuaria. Estacion Experimental Agropecuaria, Salta, 383 pp.
Bradley, R. S., M. Vuille, D. R. Hardy, and L. G. Thompson, 2003:Low latitude ice cores record Pacific sea surface temperatures.Geophys. Res. Lett., 30, 1174, doi:10.1029/2002GL016546.
Ebert, E. E., M. J. Manton, P. A. Arkin, R. J. Allam, G. E. Holpin,and A. Gruber, 1996: Results from the GPCP algorithm inter-comparison programme. Bull. Amer. Meteor. Soc., 77, 2875–2887.
Francou, B., M. Vuille, P. Wagnon, J. Mendoza, and J. E. Sicart,2003: Tropical climate change recorded by a glacier in the centralAndes during the last decades of the 20th century: Chacal-taya, Bolivia, 168S. J. Geophys. Res., 108, 4154, doi:10.1029/2002JD002959.
Fuenzalida, H. P., and J. Rutllant, 1987: Origen del vapor de aguaque precipita en el Altiplano de Chile. Proc. Anales del II Con-greso Interamericano de Meteorologia, Buenos Aires, Argen-tina, 6.3.1–6.3.4.
Garreaud, R. D., 1999: Multiscale analysis of the summertime pre-cipitation over the central Andes. Mon. Wea. Rev., 127, 901–921.
——, 2000a: Intraseasonal variability of moisture and rainfall overthe South American Altiplano. Mon. Wea. Rev., 128, 3337–3346.
——, 2000b: Cold air incursions over subtropical South America:Mean structure and dynamics. Mon. Wea. Rev., 128, 2544–2559.
——, and J. M. Wallace, 1997: The diurnal march of convectivecloudiness over the Americas. Mon. Wea. Rev., 125, 3157–3171.
——, and P. Aceituno, 2001: Interannual rainfall variability over theSouth American Altiplano. J. Climate, 14, 2779–2789.
——, M. Vuille, and A. Clement, 2003: The climate of the Altiplano:Observed current conditions and mechanisms of past changes.Palaeogeogr., Palaeoclimatol., Palaeoecol., 194, 5–22.
Grosjean, M., I. Cartajena, M. A. Geyh, and L. Nunez, 2003: Fromproxy data to paleoclimate interpretation: The mid-Holocene par-adox of the Atacama desert, northern Chile. Palaeogeogr., Pa-laeoclimatol., Palaeoecol., 194, 247–258.
Hardy, D. R., M. Vuille, C. Braun, F. Keimig, and R. S. Bradley,1998: Annual and daily meteorological cycles at high altitudeon a tropical mountain. Bull. Amer. Meteor. Soc., 79, 1899–1913.
——, ——, and R. S. Bradley, 2003: Variability of snow accumu-lation and isotopic composition on Nevado Sajama, Bolivia. J.Geophys. Res., 108, 4693, doi:10.1029/2003JD003623.
Huffman, G. J., and Coauthors, 1997: The Global Precipitation Cli-matology Project (GPCP) combined precipitation dataset. Bull.Amer. Meteor. Soc., 78, 5–20.
Janowiak, J. E., R. J. Joyce, and Y. Yarosh, 2001: A real-time globalhalf-hourly pixel-resolution infrared dataset and its applications.Bull. Amer. Meteor. Soc., 82, 205–217.
Joyce, R., and P. A. Arkin, 1997: Improved estimates of tropical and
3348 VOLUME 17J O U R N A L O F C L I M A T E
subtropical precipitation using the GOES precipitation index. J.Atmos. Oceanic Technol., 14, 997–1011.
——, J. Janowiak, and G. Huffman, 2001: Latitudinally and season-ally dependent zenith-angle corrections for geostationary sat-ellite IR brightness temperatures. J. Appl. Meteor., 40, 689–703.
Kalnay, E., and Coauthors, 1996: The NCEP/NCAR 40-Year Re-analysis Project. Bull. Amer. Meteor. Soc., 77, 437–471.
Kessler, A., 1974: Atmospharische Zirkulationsanomalien and Spie-gelschwankungen des Titicacasees. Bonn. Met. Abh., 17, 361–372.
——, 1981: Wasserhaushaltsschwankungen auf dem Altiplano in Ab-haengigkeit von der atmosphaerischen Zirkulation. AachenerGeographische Arbeiten, 14, 111–121.
Kistler, R., and Coauthors, 2001: The NCEP–NCAR 50-year reanal-ysis: Monthly means CD-ROM and documentation. Bull. Amer.Meteor. Soc., 82, 247–268.
Lenters, J. D., and K. Cook, 1999: Summertime precipitation vari-ability over South America: Role of the large-scale circulation.Mon. Wea. Rev., 127, 409–431.
Liebmann, B., and C. A. Smith, 1996: Description of a complete(interpolated) outgoing longwave radiation dataset. Bull. Amer.Meteor. Soc., 77, 1275–1277.
——, J. D. Glick, J. A. Marengo, V. E. Kousky, I. C. Wainer, andO. Massambani, 1998: A comparison of rainfall, outgoing long-wave radiation, and divergence over the Amazon basin. J. Cli-mate, 11, 2898–2909.
Marengo, J. A., 1995: Interannual variability of deep convection overthe tropical South American sector as deduced from ISCCP C2data. Int. J. Climatol., 15, 995–1010.
——, M. W. Douglas, and P. L. Silva Dias, 2002: The South Americanlow-level jet east of the Andes during the 1999 LBA-TRMMand LBA-WET AMC campaign. J. Geophys. Res., 107, 8079,doi:10.1029/2001JD001188.
McCollum, J. R., and W. F. Krajewski, 1999: On the relationshipbetween the GOES precipitation index and ISCCP dataset var-iables. J. Geophys. Res., 104, 31 467–31 476.
Morrissey, M. L., and J. S. Greene, 1993: Comparison of two satellite-based rainfall algorithms using Pacific atoll raingage data. J.Appl. Meteor., 32, 411–425.
Negri, A. J., R. F. Adler, E. J. Nelkin, and G. J. Huffman, 1994:Regional rainfall climatologies derived from Special Sensor Mi-crowave Imager (SSM/I) data. Bull. Amer. Meteor. Soc., 75,1165–1182.
——, E. N. Anagnostou, and R. F. Adler, 2000: A 10-yr climatologyof Amazonian rainfall derived from passive microwave satelliteobservations. J. Appl. Meteor., 39, 42–56.
Nieto Ferreira, R., T. M. Rickenbach, D. L. Herdies, and L. M. V.Carvalho, 2003: Variability of South American convective cloudsystems and tropospheric circulation during January–March1998 and 1999. Mon. Wea. Rev., 131, 961–973.
North, G. R., T. L. Bell, R. F. Cahalan, and F. J. Moeng, 1982: Sam-pling errors in the estimation of empirical orthogonal functions.Mon. Wea. Rev., 110, 699–706.
Richards, F., and P. Arkin, 1981: On the relationship between satellite-
observed cloud cover and precipitation. Mon. Wea. Rev., 109,1081–1093.
Richman, M. B., 1986: Rotation of principal components. Int. J.Climatol., 6, 293–335.
Rossow, W. B., and R. A. Schiffer, 1991: ISCCP cloud data products.Bull. Amer. Meteor. Soc., 72, 2–20.
——, and ——, 1999: Advances in understanding clouds from ISCCP.Bull. Amer. Meteor. Soc., 80, 2261–2287.
Saulo, A. C., M. Nicolini, and S. C. Chou, 2000: Model character-ization of the South American low-level flow during the 1997–98 spring–summer season. Climate Dyn., 16, 867–881.
Seltzer, G. O., D. T. Rodbell, and H. E. Wright, 2003: Late-quaternarypaleoclimates of the southern tropical Andes and adjacent re-gions. Palaeogeogr., Palaeoclimatol., Palaeoecol., 194, 1–3.
Thompson, L., E. Mosley-Thompson, and B. J. Arnao, 1984: El Nino–Southern Oscillation events recorded in the stratigraphy of thetropical Quelccaya ice cap, Peru. Science, 226, 50–52.
——, and Coauthors, 1998: A 25,000-year tropical climate historyfrom Bolivian ice cores. Science, 282, 1858–1864.
Todd, M., and R. Washington, 1999: A simple method to retrieve 3-hourly estimates of global tropical and subtropical precipitationfrom International Satellite Cloud Climatology Program (ISCCP)D1 data. J. Atmos. Oceanic Technol., 16, 146–155.
Vernekar, A. D., B. P. Kirtman, and M. J. Fennessy, 2003: Low-leveljets and their effects on the South American summer climate assimulated by the NCEP Eta Model. J. Climate, 16, 297–311.
Vuille, M., 1999: Atmospheric circulation over the Bolivian Altiplanoduring dry and wet periods and extreme phases of the SouthernOscillation. Int. J. Climatol., 19, 1579–1600.
——, and C. Ammann, 1997: Regional snowfall patterns in the higharid Andes. Climatic Change, 36, 413–423.
——, D. R. Hardy, C. Braun, F. Keimig, and R. S. Bradley, 1998:Atmospheric circulation anomalies associated with 1996/1997summer precipitation events on Sajama ice cap, Bolivia. J. Geo-phys. Res., 103, 11 191–11 204.
——, R. S. Bradley, and F. Keimig, 2000a: Interannual climate var-iability in the central Andes and its relation to tropical Pacificand Atlantic forcing. J. Geophys. Res., 105, 12 447–12 460.
——, ——, and ——, 2000b: Climate variability in the Andes ofEcuador and its relation to tropical Pacific and Atlantic sea sur-face temperature anomalies. J. Climate, 13, 2520–2535.
——, ——, R. Healy, M. Werner, D. R. Hardy, L. G. Thompson, andF. Keimig, 2003: Modeling d18O in precipitation over the tropicalAmericas: 2. Simulation of the stable isotope signal in Andeanice cores. J. Geophys. Res., 108, 4175, doi:10.1029/2001JD002039.
Wagnon, P., P. Ribstein, B. Francou, and J. E. Sicart, 2001: Anomalousheat and mass budget of Glaciar Zongo, Bolivia, during the1997–98 El Nino year. J. Glaciol., 47, 21–28.
Xie, P., and P. A. Arkin, 1997: Global Precipitation: A 17-year month-ly analysis based on gauge observations, satellite estimates, andnumerical model outputs. Bull. Amer. Meteor. Soc., 78, 2539–2558.
Yulaeva, E., and J. M. Wallace, 1994: The signature of ENSO inglobal temperature and precipitation fields derived from the mi-crowave sounding unit. J. Climate, 7, 1719–1736.
Recommended