Embed Size (px)
Citation preview

The Summer North Atlantic Oscillation: Past, Present, and Future
CHRIS K. FOLLAND AND JEFF KNIGHT
Met Office Hadley Centre, Exeter, Devon, United Kingdom
HANS W. LINDERHOLM
Department of Earth Sciences, University of Gothenburg, Gothenburg, Sweden
DAVID FEREDAY AND SARAH INESON
Met Office Hadley Centre, Exeter, Devon, United Kingdom
JAMES W. HURRELL
National Center for Atmospheric Research, Boulder, Colorado
(Manuscript received 31 January 2008, in final form 26 August 2008)
ABSTRACT
Summer climate in the North Atlantic–European sector possesses a principal pattern of year-to-year
variability that is the parallel to the well-known North Atlantic Oscillation in winter. This summer North
Atlantic Oscillation (SNAO) is defined here as the first empirical orthogonal function (EOF) of observed
summertime extratropical North Atlantic pressure at mean sea level. It is shown to be characterized by a
more northerly location and smaller spatial scale than its winter counterpart. The SNAO is also detected by
cluster analysis and has a near-equivalent barotropic structure on daily and monthly time scales. Although of
lesser amplitude than its wintertime counterpart, the SNAO exerts a strong influence on northern European
rainfall, temperature, and cloudiness through changes in the position of the North Atlantic storm track. It is,
therefore, of key importance in generating summer climate extremes, including flooding, drought, and heat
stress in northwestern Europe. The El Nino–Southern Oscillation (ENSO) phenomenon is known to influ-
ence summertime European climate; however, interannual variations of the SNAO are only weakly influ-
enced by ENSO. On interdecadal time scales, both modeling and observational results indicate that SNAO
variations are partly related to the Atlantic multidecadal oscillation. It is shown that SNAO variations extend
far back in time, as evidenced by reconstructions of SNAO variations back to 1706 using tree-ring records.
Very long instrumental records, such as central England temperature, are used to validate the reconstruction.
Finally, two climate models are shown to simulate the present-day SNAO and predict a trend toward a more
positive index phase in the future under increasing greenhouse gas concentrations. This implies the long-term
likelihood of increased summer drought for northwestern Europe.
1. Introduction
Climate variability in the North Atlantic–European
sector is strongly governed by variability in atmospheric
circulation. This is most true in winter, for which the
paradigm of the North Atlantic Oscillation (NAO; see
Walker 1924) has provided a clear framework for many
studies of the year-to-year climate variability of the
region. There is less recognition, however, of the role of
circulation variability in European summer climate, al-
though it has been noted in a number of previous studies,
often as an extension of analyses focused on the winter.
Thus the eigenvector analyses of North Atlantic–European
mean sea level pressure of Hurrell and van Loon (1997),
Hurrell and Folland (2002), and Hurrell et al. (2003) do
contain a leading pattern of summer circulation varia-
bility. In the latter study, this pattern explains 22.1% of
Corresponding author address: Prof. Chris Folland, Met Office
Hadley Centre, FitzRoy Road, Exeter, Devon EX1 3PB, United
Kingdom.
E-mail: [email protected]
1082 J O U R N A L O F C L I M A T E VOLUME 22
DOI: 10.1175/2008JCLI2459.1
� 2009 American Meteorological Society
June–August (JJA) mean sea level pressure (MSLP)
variance in the extratropical North Atlantic compared
with 36.7% for the NAO in winter. The summer pattern
has a smaller spatial extent than the winter NAO and
is located farther north, with the southern node over
northwest Europe, rather than the Azores–Spain region,
and a smaller-scale Arctic node (Fig. 6 of Hurrell et al.
2003). A similar result appears in the rotated eigenvec-
tor analysis of monthly Northern Hemisphere 700-hPa
geopotential height of Barnston and Livezey (1987,
hereafter BL87). BL87 show almost identical leading
patterns in June, July, and August, explaining similar
hemispheric variance (10%) to the typical winter monthly
NAO (12%). The results of these studies show there is
a summertime counterpart to the winter NAO, albeit
with different characteristics. By analogy with the win-
ter season, we refer to this pattern of variability as the
summer North Atlantic Oscillation (SNAO). Our aim
is to more firmly establish the SNAO as a key paradigm
in understanding European summer climate variability
and to explore its characteristics.
A different approach to characterizing the seasonal
cycle of the NAO was developed by Portis et al. (2001)
through their concept of the ‘‘mobile NAO.’’ For each
month of the year the points of maximum anticorrela-
tion of National Centers for Environmental Prediction
(NCEP) reanalysis (Kalnay et al. 1996) MSLP between
two regions (558–808N, 708W–08 and 208–458N, 708W–08)
were computed. In contrast to other studies, for July
and August they obtained dipoles with centers in the
western North Atlantic. The ranges of longitude and
latitude permitted by the anticorrelation calculations,
however, prevent the possibility of a more northward
and eastward southern node, excluding the SNAO as
defined above. It is important, therefore, that varia-
bility over the whole North Atlantic region be taken
into account in establishing the leading mode of sum-
mer variability.
Another method of identifying regional atmospheric
circulation patterns is through cluster analysis. Cassou
et al. (2005) carried out a k-means cluster analysis of
daily JJA 500-hPa heights over the North Atlantic–
European region (208–808N, 908W–308E). By retaining
only the days identified as being in the same cluster for 5
consecutive days or longer, they identified four clusters
each explaining about 18% of the variance. One of
these patterns (which they call the ‘‘summer European
blocking pattern’’) is similar to the SNAO as it appears
in Hurrell and van Loon (1997), Hurrell et al. (2003), or
BL87, despite being derived from daily data and a dif-
ferent level of the atmosphere. In their definition of its
positive mode, which fits that of the above investigators,
high pressure anomalies dominate northern Europe.
Horel (1981) noted a tendency for some 500-hPa
teleconnection patterns to possess a smaller meridional
scale in Northern Hemisphere summer than in winter,
which he partly ascribed to the northward movement of
the storm track between winter and summer. Recently,
Feldstein (2007) has analyzed the mechanisms of JJA
NAO dynamics using the BL87 index. The 300-hPa-
level pattern most strongly related to the BL87 index is
displaced a little to the west of the BL87 surface pat-
tern. The smaller scale of summer patterns compared to
those in winter is also noted. Ogi et al. (2004, 2005) have
identified a summer annular mode based on zonally
averaged data that parallels the winter annular mode of
Thompson and Wallace (1998). This mode also has a
smaller meridional scale than the corresponding winter
annular mode. The smaller zonal scale of the SNAO
compared to the winter NAO makes a relationship with
an annular mode less applicable. Nevertheless, Ogi et al.
(2004) point out it is likely that a consistent description
of modes of extratropical Northern Hemisphere climate
through the seasonal cycle demands analyses which are
seasonally specific because of seasonal changes in their
spatial scale.
In this paper we perform analyses which confirm that
the SNAO is a principal mode of climate variability in
North Atlantic–European summer. Although it has
different characteristics than the wintertime NAO, the
SNAO provides a similar paradigm for understanding
the year-to-year variations of seasonal climate. We con-
centrate on the ‘‘high summer’’ season July and August
because the temporal behavior of the SNAO in these
months is significantly correlated, unlike June. Never-
theless, as shown by BL87, the spatial pattern of the
SNAO in June is quite similar. Like the winter NAO,
the existence of the SNAO has important implications
for climate extremes such as heavy rainfall and flooding
events (e.g., northern European summer 2007). There
are, additionally, implications for heat stress caused by
high temperatures and for drought in the opposite phase
of the SNAO.
We use observational climate datasets and reanalysis
data to quantify the effect of the high summer SNAO on
surface and tropospheric circulation, surface tempera-
ture, cloudiness, rainfall and the position of the Atlantic
storm track. In addition, possible SST influences and
the temporal variability in the instrumental era (1850
onwards) are examined. This is extended by use of a
tree-ring data reconstruction, which permits the SNAO
record to be inferred back to 1706. Finally, we show
how the SNAO is represented in two coupled climate
models, and present projections of SNAO change in
enhanced CO2 simulations that are consistent with an-
ticipated climate change.
1 MARCH 2009 F O L L A N D E T A L . 1083

2. Eigenvector and cluster definitions of the SNAO
a. Eigenvector definition of the SNAO
We use a definition of the high summer (July–August,
henceforth JA) NAO involving an empirical orthogonal
function (EOF) covariance analysis of extratropical
North Atlantic–European mean sea level pressure
anomalies for 1881–2003. Data are taken from a daily
MSLP analysis by Ansell et al. (2006); the first eigen-
vector is defined to be the SNAO (Fig. 1a). We do not
use earlier, less accurate data back to 1850 to define the
SNAO pattern in case of distortion of the pattern in data
sparse high latitudes. We do, however, create time series
back to 1850 using this pattern. We tested whether there
are differences in the pattern of the SNAO when daily,
10-day mean or July and August mean MSLP data are
used. The patterns are almost identical between these
time scales over the period 1881–2003. The only ap-
preciable difference lies in the percentage of total var-
iance explained by the SNAO pattern on each time
scale. It explains 18.0% of the daily variance, 22.6% of
the 10-day mean variance, and 28.3% of the 2-month
mean variance over the analysis domain. For the re-
mainder of this paper, we have chosen to use the daily
pattern as this allows the day-by-day contribution of the
SNAO to a seasonal anomaly to be estimated.
The second daily EOF for high summer explains
14.5% of the variance and is a more zonal pattern with
centers over the central North Atlantic and northwest
Europe. The third EOF explains 12.1% of the daily
variance and has a dipole in the western North Atlantic.
The locations of the nodes of the dipole are broadly
similar to the positions of maximum negative correlation
at 700 hPa between the lower-middle and higher lati-
tudes of the Atlantic region found by Portis et al. (2001)
in their ‘‘mobile NAO’’ analysis for July and August.
Our analysis using 2-month means is nearest in time
scale to their analysis, so Fig. 1b shows the pattern of the
JA mean SNAO, again EOF1 as above, while the second
July–August mean EOF is similar to the July or August
pattern of Portis et al., explaining 19.1% of the JA mean
variance. Thus this mode is more prevalent for data
averaged over two months. We conclude that the mobile
summer NAO found by Portis et al. (2001) is likely to be
similar to the second most prominent high summer at-
mospheric circulation pattern in the extratropical North
Atlantic region for data averaged over two months and
the third most prominent EOF on daily as well as 10-day
time scales (not shown). We note in passing that the
actual duration of individual SNAO or mobile summer
NAO events is mostly considerably shorter than two
months.
b. Cluster analysis definition
A version of k-means cluster analysis of the daily July
and August MSLP data using a simulated annealing
algorithm (Philipp et al. 2007; Fereday et al. 2008) over
1881–2003 gives similar results. Here we use k 5 10, for
which two clusters appear as almost opposite MSLP
anomaly patterns (Fig. 1c). Other reasonable values of k
give similar results because the SNAO is so prominent.
In absolute MSLP terms, the positive cluster appears as
a strong extension of the Azores high over northwest
Europe, while the negative pattern emphasizes a rela-
tively deep southward- and eastward-displaced Iceland
low. Near symmetry of the two sets of cluster anomalies,
unlike the winter NAO (Hurrell et al. 2003; Cassou et al.
2004), indicates that EOF and cluster representations of
the SNAO give very similar results. We have therefore
used daily EOF1 in this paper in preference to the two
SNAO clusters as it is easier to use. Finally we note that
these patterns of the high summer SNAO are similar to
the first eigenvector of reconstructed 500-hPa height
anomalies in a combined eigenvector analysis of June–
August 500-hPa height, temperature, and rainfall for
the long period 1766–2000 created by Casty et al. (2007).
They called this pattern ‘‘the blocking mode.’’
c. Vertical and temporal structure of the SNAO
Figure 2a shows the regression of MSLP from the
NCEP dataset against the July and August mean index
of the daily SNAO for the period 1948–2007 to show the
Arctic-wide pattern of the SNAO. Figure 2b shows re-
gressions of the daily and 2-month mean high summer
North Atlantic Oscillation time series on the daily and
2-month mean NCEP reanalysis 300-hPa height time
series for July and August over the period 1948–2003.
The surface and 300-hPa patterns are similar, though
the Arctic node is weaker at 300 hPa compared to sur-
face. The positive and negative nodes are nearly geo-
graphically coincident so the pattern can be described as
quasi-equivalent barotropic. However the 10-day (not
shown) and 2-month 300-hPa patterns extend a little
farther west. All three time scales show a subsidiary
weak center over North America; that on the 2-month
time scale being relatively the strongest.
Three EOF1 time series are shown in Fig. 3 based on the
daily, 10-day, and 2-month mean MSLP EOF1 patterns
projected onto the MSLP data for 1850–2007. The time
series are very similar, reflecting the similar EOF1 pat-
terns, with a correlation of 0.98 between the 158-yr time
series of the high summer average of daily EOF1 and the
time series of the 2-month mean EOF1. Multidecadal and
interannual variability are very similar. Conclusions in the
rest of the paper based on daily EOF1 therefore will
apply almost equally well to the 2-month mean EOF1.
1084 J O U R N A L O F C L I M A T E VOLUME 22
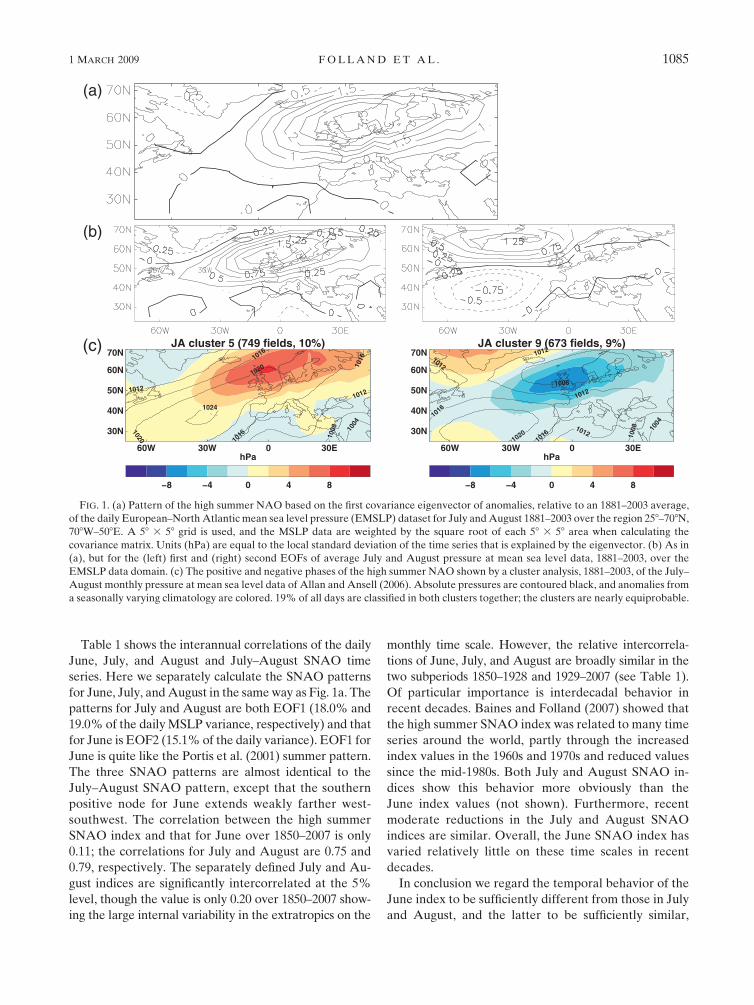
Table 1 shows the interannual correlations of the daily
June, July, and August and July–August SNAO time
series. Here we separately calculate the SNAO patterns
for June, July, and August in the same way as Fig. 1a. The
patterns for July and August are both EOF1 (18.0% and
19.0% of the daily MSLP variance, respectively) and that
for June is EOF2 (15.1% of the daily variance). EOF1 for
June is quite like the Portis et al. (2001) summer pattern.
The three SNAO patterns are almost identical to the
July–August SNAO pattern, except that the southern
positive node for June extends weakly farther west-
southwest. The correlation between the high summer
SNAO index and that for June over 1850–2007 is only
0.11; the correlations for July and August are 0.75 and
0.79, respectively. The separately defined July and Au-
gust indices are significantly intercorrelated at the 5%
level, though the value is only 0.20 over 1850–2007 show-
ing the large internal variability in the extratropics on the
monthly time scale. However, the relative intercorrela-
tions of June, July, and August are broadly similar in the
two subperiods 1850–1928 and 1929–2007 (see Table 1).
Of particular importance is interdecadal behavior in
recent decades. Baines and Folland (2007) showed that
the high summer SNAO index was related to many time
series around the world, partly through the increased
index values in the 1960s and 1970s and reduced values
since the mid-1980s. Both July and August SNAO in-
dices show this behavior more obviously than the
June index values (not shown). Furthermore, recent
moderate reductions in the July and August SNAO
indices are similar. Overall, the June SNAO index has
varied relatively little on these time scales in recent
decades.
In conclusion we regard the temporal behavior of the
June index to be sufficiently different from those in July
and August, and the latter to be sufficiently similar,
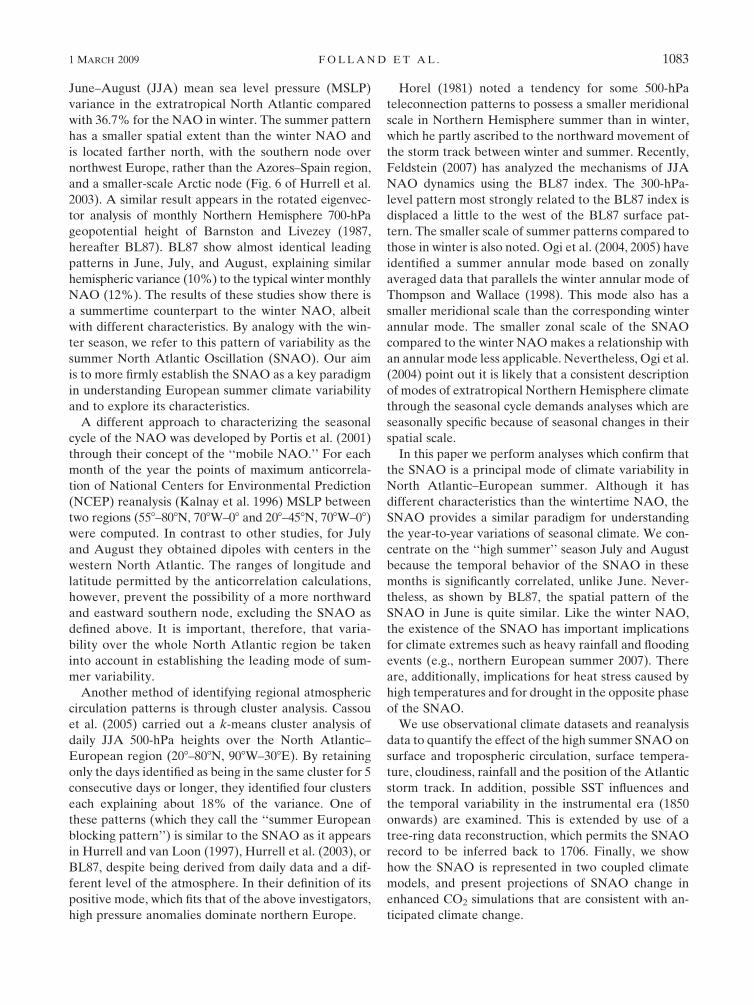
FIG. 1. (a) Pattern of the high summer NAO based on the first covariance eigenvector of anomalies, relative to an 1881–2003 average,
of the daily European–North Atlantic mean sea level pressure (EMSLP) dataset for July and August 1881–2003 over the region 258–708N,
708W–508E. A 58 3 58 grid is used, and the MSLP data are weighted by the square root of each 58 3 58 area when calculating the
covariance matrix. Units (hPa) are equal to the local standard deviation of the time series that is explained by the eigenvector. (b) As in
(a), but for the (left) first and (right) second EOFs of average July and August pressure at mean sea level data, 1881–2003, over the
EMSLP data domain. (c) The positive and negative phases of the high summer NAO shown by a cluster analysis, 1881–2003, of the July–
August monthly pressure at mean sea level data of Allan and Ansell (2006). Absolute pressures are contoured black, and anomalies from
a seasonally varying climatology are colored. 19% of all days are classified in both clusters together; the clusters are nearly equiprobable.
1 MARCH 2009 F O L L A N D E T A L . 1085

(a)
(b)FIG. 2. (a) Regression of pressure at mean sea level at each grid point using the daily NCEP reanalysis dataset
against the July and August mean index of the daily high summer NAO, 1948–2007, to show the Arctic-wide pattern
of the SNAO. Units are hPa (std dev)21 of the SNAO time series. The positive center is slightly stronger than for the
EMSLP dataset period 1881–2003. (b) Regression of the (left) daily and (right) 2-month mean high summer NAO
time series at each grid point on the global daily and 2-month mean NCEP reanalysis 300-hPa-height time series for
July and August over the period 1948–2003. Contours are every 20 m (std dev)21 of the SNAO time series except for
the first 10-m contour.
1086 J O U R N A L O F C L I M A T E VOLUME 22
especially on interdecadal time scales, to concentrate on
the high summer season.
3. The summer North Atlantic Oscillation,temperature, rainfall, cloudiness, andstorm tracks
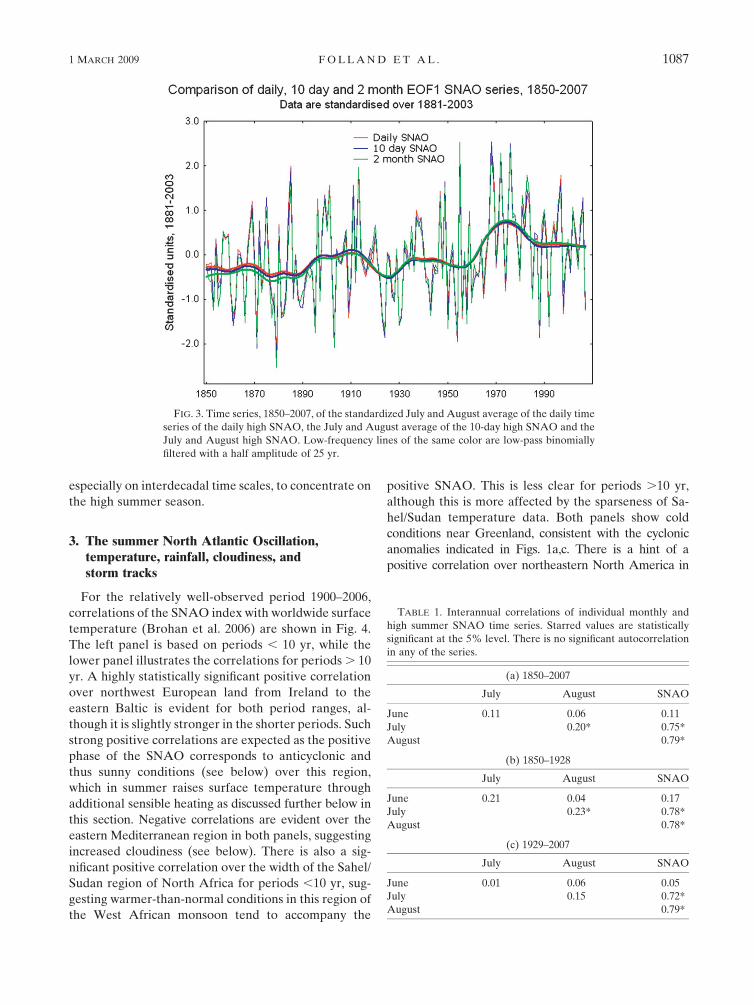
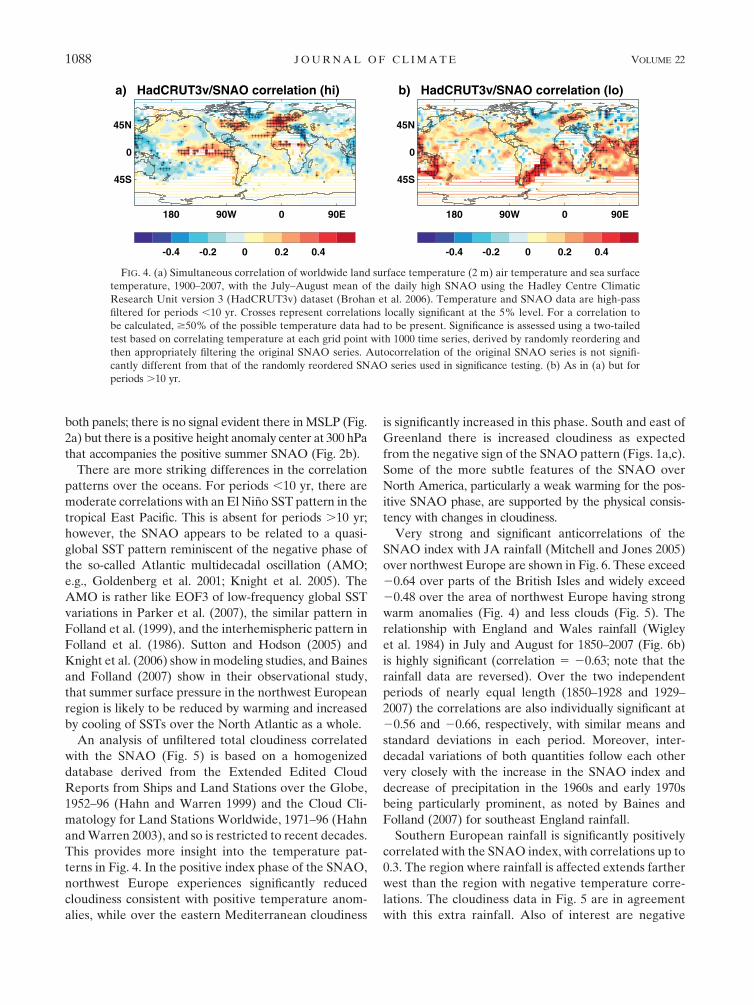
For the relatively well-observed period 1900–2006,
correlations of the SNAO index with worldwide surface
temperature (Brohan et al. 2006) are shown in Fig. 4.
The left panel is based on periods , 10 yr, while the
lower panel illustrates the correlations for periods . 10
yr. A highly statistically significant positive correlation
over northwest European land from Ireland to the
eastern Baltic is evident for both period ranges, al-
though it is slightly stronger in the shorter periods. Such
strong positive correlations are expected as the positive
phase of the SNAO corresponds to anticyclonic and
thus sunny conditions (see below) over this region,
which in summer raises surface temperature through
additional sensible heating as discussed further below in
this section. Negative correlations are evident over the
eastern Mediterranean region in both panels, suggesting
increased cloudiness (see below). There is also a sig-
nificant positive correlation over the width of the Sahel/
Sudan region of North Africa for periods ,10 yr, sug-
gesting warmer-than-normal conditions in this region of
the West African monsoon tend to accompany the
positive SNAO. This is less clear for periods .10 yr,
although this is more affected by the sparseness of Sa-
hel/Sudan temperature data. Both panels show cold
conditions near Greenland, consistent with the cyclonic
anomalies indicated in Figs. 1a,c. There is a hint of a
positive correlation over northeastern North America in
FIG. 3. Time series, 1850–2007, of the standardized July and August average of the daily time
series of the daily high SNAO, the July and August average of the 10-day high SNAO and the
July and August high SNAO. Low-frequency lines of the same color are low-pass binomially
filtered with a half amplitude of 25 yr.
TABLE 1. Interannual correlations of individual monthly and
high summer SNAO time series. Starred values are statistically
significant at the 5% level. There is no significant autocorrelation
in any of the series.
(a) 1850–2007
July August SNAO
June 0.11 0.06 0.11
July 0.20* 0.75*
August 0.79*
(b) 1850–1928
July August SNAO
June 0.21 0.04 0.17
July 0.23* 0.78*
August 0.78*
(c) 1929–2007
July August SNAO
June 0.01 0.06 0.05
July 0.15 0.72*
August 0.79*
1 MARCH 2009 F O L L A N D E T A L . 1087
both panels; there is no signal evident there in MSLP (Fig.
2a) but there is a positive height anomaly center at 300 hPa
that accompanies the positive summer SNAO (Fig. 2b).
There are more striking differences in the correlation
patterns over the oceans. For periods ,10 yr, there are
moderate correlations with an El Nino SST pattern in the
tropical East Pacific. This is absent for periods .10 yr;
however, the SNAO appears to be related to a quasi-
global SST pattern reminiscent of the negative phase of
the so-called Atlantic multidecadal oscillation (AMO;
e.g., Goldenberg et al. 2001; Knight et al. 2005). The
AMO is rather like EOF3 of low-frequency global SST
variations in Parker et al. (2007), the similar pattern in
Folland et al. (1999), and the interhemispheric pattern in
Folland et al. (1986). Sutton and Hodson (2005) and
Knight et al. (2006) show in modeling studies, and Baines
and Folland (2007) show in their observational study,
that summer surface pressure in the northwest European
region is likely to be reduced by warming and increased
by cooling of SSTs over the North Atlantic as a whole.
An analysis of unfiltered total cloudiness correlated
with the SNAO (Fig. 5) is based on a homogenized
database derived from the Extended Edited Cloud
Reports from Ships and Land Stations over the Globe,
1952–96 (Hahn and Warren 1999) and the Cloud Cli-
matology for Land Stations Worldwide, 1971–96 (Hahn
and Warren 2003), and so is restricted to recent decades.
This provides more insight into the temperature pat-
terns in Fig. 4. In the positive index phase of the SNAO,
northwest Europe experiences significantly reduced
cloudiness consistent with positive temperature anom-
alies, while over the eastern Mediterranean cloudiness
is significantly increased in this phase. South and east of
Greenland there is increased cloudiness as expected
from the negative sign of the SNAO pattern (Figs. 1a,c).
Some of the more subtle features of the SNAO over
North America, particularly a weak warming for the pos-
itive SNAO phase, are supported by the physical consis-
tency with changes in cloudiness.
Very strong and significant anticorrelations of the
SNAO index with JA rainfall (Mitchell and Jones 2005)
over northwest Europe are shown in Fig. 6. These exceed
20.64 over parts of the British Isles and widely exceed
20.48 over the area of northwest Europe having strong
warm anomalies (Fig. 4) and less clouds (Fig. 5). The
relationship with England and Wales rainfall (Wigley
et al. 1984) in July and August for 1850–2007 (Fig. 6b)
is highly significant (correlation 5 20.63; note that the
rainfall data are reversed). Over the two independent
periods of nearly equal length (1850–1928 and 1929–
2007) the correlations are also individually significant at
20.56 and 20.66, respectively, with similar means and
standard deviations in each period. Moreover, inter-
decadal variations of both quantities follow each other
very closely with the increase in the SNAO index and
decrease of precipitation in the 1960s and early 1970s
being particularly prominent, as noted by Baines and
Folland (2007) for southeast England rainfall.
Southern European rainfall is significantly positively
correlated with the SNAO index, with correlations up to
0.3. The region where rainfall is affected extends farther
west than the region with negative temperature corre-
lations. The cloudiness data in Fig. 5 are in agreement
with this extra rainfall. Also of interest are negative
180 90W 0 90E
45S
0
45N
a) HadCRUT3v/SNAO correlation (hi)
-0.4 -0.2 0 0.2 0.4
180 90W 0 90E
45S
0
45N
b) HadCRUT3v/SNAO correlation (lo)
-0.4 -0.2 0 0.2 0.4
FIG. 4. (a) Simultaneous correlation of worldwide land surface temperature (2 m) air temperature and sea surface
temperature, 1900–2007, with the July–August mean of the daily high SNAO using the Hadley Centre Climatic
Research Unit version 3 (HadCRUT3v) dataset (Brohan et al. 2006). Temperature and SNAO data are high-pass
filtered for periods ,10 yr. Crosses represent correlations locally significant at the 5% level. For a correlation to
be calculated, $50% of the possible temperature data had to be present. Significance is assessed using a two-tailed
test based on correlating temperature at each grid point with 1000 time series, derived by randomly reordering and
then appropriately filtering the original SNAO series. Autocorrelation of the original SNAO series is not signifi-
cantly different from that of the randomly reordered SNAO series used in significance testing. (b) As in (a) but for
periods .10 yr.
1088 J O U R N A L O F C L I M A T E VOLUME 22

rainfall correlations over the whole width of the African
Sahel, reaching 20.5 in a few places, and the weak
positive correlations to its south. This North African
precipitation dipole feature is consistent with a south-
ward-displaced and possibly more intense North Afri-
can intertropical convergence zone (e.g., Rowell et al.
1992) when the SNAO is in its positive index phase.
Although the cloudiness data only show weak correla-
tions, they are in the correct sense for lower rainfall and
higher temperature (Fig. 4) to be associated with posi-
tive SNAO index over the Sahel. Hurrell and Folland
(2002) noted a similar relationship with Sahel rainfall.
Finally, Figs. 4b and 6 are consistent with the results of
Rowell (2003) who analyzed physical reasons for an
influence of Mediterranean SSTs on Sahel rainfall, es-
pecially on decadal time scales.
We conclude that the North Atlantic region cloudi-
ness correlation pattern is consistent with the SNAO
MSLP and surface temperature and rainfall patterns,
with a lower cloudiness associated with higher temper-
atures, more sensible heating, and dry conditions, and a
higher cloudiness associated with cooler temperatures,
less sensible heating, and wetter conditions, as would be
expected in summer. There also appear to be distant
relationships between the SNAO and the West African
monsoon on a range of time scales.
Variations of the SNAO are associated with changes
in the North Atlantic storm track (Fig. 7) such that a
positive (negative) SNAO index is associated with
its northward (southward) movement over northwest
Europe and into the east Atlantic. In the late nine-
teenth and early twentieth century the SNAO index
was generally more negative (Fig. 3) compared to the
period after the mid-1960s. The storm track strength-
ened over Iceland and the Norwegian Sea in the latter
period and weakened farther south, particularly over
central-western Europe. Thus changes in temperature
and rainfall in regions most affected by changes in
the SNAO result from a combination of thermody-
namic and dynamical effects. Taking England as an
example, the positive index phase of the SNAO cor-
responds to anomalous easterly winds advecting warm
air from continental Europe (implied by Fig. 1a) as
well as more local solar radiation and surface sensible
heating. These effects reinforce the temperature and
rainfall response, resulting in the SNAO being a very
important control on summer heat, drought, and
flooding in northwest Europe. It is less effective over
southern Europe as the correlations with surface cli-
mate are lower, so that other summer atmospheric
patterns are likely to be at least as important (Cassou
et al. 2005).
4
4
4
4
4
2
2
2
2
2
2
2
2
2
2
2
2
2
2
2
2
2
0
0
00
0
0
0
0 00
0
0
0
0
0
0
0
0
00
0
0
0
0
0
−2
−2−2
−2
−2
−2
−2
−2
−2
−2
−2 −2
−2 −2
−2
−2
−2
−2
−2
−2
−4
−4−4
−4
−4
−4
Total Cloud Cover Anomalies Correlated with North Atlantic Oscillation Indicesr x 10
July, August (land 1971−1996, ocean 1954−1997) Daytime, Land and Ocean Areas
6*6*
−7*
−4*−5*−4*−4*−4*−4*5*
−4*−6*−4*−5*−4*4*
−4*−6*−5*−5*−6*
4*4*5*4*−4*−6*−4*
4*5*5*6*6*6*5*
4*4*5*5*5*4*4*4*4*
4*4*4*
6*
−4*
−4*−4*
−4*
5*4*
−5*
−6* −4*−3* −4*
5* 5* 4*−3* −3* −5*
5* 6* 5*3* 4* 3*
−4* −4* −3*
−3*−4* −4* −4*
−3*
121
−3−123−1−13
100−1−2−3−10−33312−4−1
0−1−2−3−30−1340−1−2
−2−3−2−2−3−3−31−20−1
−1−102200−3−3−10−12−3−3−3−1
13330−10−3−3−3−2−2−3−3−3−2
−13321−3−2−1−1−11−1−20
0−212−10−3−2−11
10022−132000−1−2032
1−1−12143−20−111031
30321−112031
01001−2−112−2−130101
0−2−2−20−2−3−2−2−44−100−2−1−1
−31−10−1−2−2−1−3130020−1−3
−1−2−101212−1−2−1
12 −1 −1
1 −1 0−2 −1 −1 2 −2
0 −1 0
4 2−1 −2 −3 0 2
21 −1 −1 0 0 −1
−1 12 3 2 0 3 2 1
−23 1 3 2 1 1 −1
−2 −20 −2 −3 2 0 1 2 0 1
90° W 60° W 30° W 0° 30° E 0°
10° N
20° N
30° N
40° N
50° N
60° N
70° N
80° N
FIG. 5. Correlation of July–August cloudiness with the SNAO. Correlations are multiplied by 10 and
cover the period 1971–96 over land and 1954–97 over the oceans. Negative correlation isopleths are
dashed and positive are solid. The resolution of the cloudiness data is 58 3 58 over land but only 108 3 108
over the oceans south of 508N, 108 lat 3 208 lon over the ocean region 508–708N and 108 3 408 lon between
708 and 808N. Starred values have a local significance of 5% or better. Over land this is measured by the
average correlation in a given box derived from correlation values at several stations using the Fishers Z
statistic.
1 MARCH 2009 F O L L A N D E T A L . 1089

4. Interannual and interdecadal variations of theSNAO in relation to ENSO and the AMO
a. Interannual time scales and ENSO
It was shown in Fig. 4 that local SST is affected by
the SNAO, with warm anomalies associated with the
southern node of the positive SNAO phase stretching
from west of the United Kingdom through the North
Sea to the Baltic, and cold anomalies in the eastern
Mediterranean associated with enhanced cloudiness
(Fig. 5). The region around southern Greenland is cold
in this phase of the SNAO as a result of cyclonic and
cloudy conditions there.
In addition to these features, there is a weak (corre-
lation 0.3–0.4) but widespread and locally statistically
significant positive correlation with SST in the ENSO
180 90W 0 90E90S
45S
0
45N
90NHulme/SNAO correlation 1900-1998
-0.8 -0.48 -0.16 0.16 0.48 0.8(a)
(b)FIG. 6. (a) Simultaneous correlation of worldwide July and August land rainfall over the land
with the high SNAO, using the Mitchell and Jones (2005) rainfall data for 1900–98. No filtering
has been done. Significance is assessed in a similar way to Fig. 4. (b) The SNAO and July–August
England and Wales rainfall, 1850–2007. The rainfall data have been reversed in sign and both
series are standardized over 1850–2007. The smooth lines are low-pass filtered for periods .25 yr.
1090 J O U R N A L O F C L I M A T E VOLUME 22

region of the tropical Pacific. This suggests, assuming
linearity, that a positive SNAO phase is associated with
El Nino and a negative SNAO phase with La Nina. The
direct correlation of the SNAO and the July–August
Nino-3.4 (58N–58S, 1708–1208W) index [taken from the
Rayner et al. (2003) Hadley Centre Sea Ice and Sea
Surface Temperature dataset (HadISST) analysis] over
the period 1876–2007 is 0.22, which is just significant at
the 5% level. Shorter periods give similar correlations,
consistent with HadISST being reliable since 1876 for
analyzing ENSO SSTs over the tropical east Pacific
(Folland et al. 2001) and consistent with the existence of
a link throughout the period. To account for the possi-
ble time lag between SST changes in the Pacific and
effects in the Atlantic extratropics, June and July
Nino-3.4 SST was also investigated, but this gave
slightly lower correlations with the SNAO indices. At
longer lead periods at this time of the year, Nino-3.4
SST anomalies are on average changing rapidly from
small values and so will not provide more predictive
information.
In Fig. 8, the relationship between the HadISST-
derived JA Nino-3.4 index and JA MSLP data from
the Second Hadley Centre Sea Level Pressure dataset
(HadSLP2) computed over the period 1876–2006 is in-
vestigated. Significant positive regressions (Fig. 8a) exist
over much of the Arctic region extending as far south as
the north coast of Scotland and east to northern Scan-
dinavia, with significant negative regressions in the
North Pacific. The regression coefficient over northern
Scotland and northwest Norway is modest (;0.6 hPa
8C21). We note, however, that the MSLP data (Allan
and Ansell 2006) are distinctly poorer over the higher
latitudes of Canada and Greenland before the 1940s,
which may reduce the variance there and hence di-
minish the regression coefficient. Over the northeast
Atlantic and Europe, the MSLP data should be rea-
sonably reliable throughout the period.
The composite analyses of Figs. 8b,c show that the
regression relationship of Fig. 8a is indeed linear to first
approximation, with broadly opposite MSLP anomalies
in a given place for El Nino and La Nina conditions. The
relationship is such that La Nina (negative Nino-3.4
SSTs) tends to give significantly lower MSLP over Eu-
ropean latitudes near 608–658N with anomalous west-
erly winds to the south. El Nino produces the opposite
Mean JA storm track
m
0 12 24 36 48 60
SNAO correlation
-0.4-0.2 0 0.2 0.4FIG. 7. (left) Mean storm tracks for 1948–2007 in July–August shown by the standard deviation of the 300-hPa
geopotential height (m) calculated from daily data and bandpass filtered on time scales of 2–8 days. (right)
Simultaneous correlation of the standard deviation of similarly filtered July–August values of 300-hPa height,
1948–2007, with the July–August SNAO index. Crosses represent correlations locally significant at the 5% level
using a two-tailed significance test at the 5% level obtained by correlating 1000 randomly reordered versions of the
SNAO time series.
1 MARCH 2009 F O L L A N D E T A L . 1091

influence but this is weaker and not significant over the
SNAO region. In both cases, any effect originating in
the tropical Pacific is of the same sign over both the
northern and southern nodes of the SNAO; thus, ENSO
influences project onto the SNAO only weakly. The
main effect is to give a weak tendency to westerly wind
or cyclonic anomalies and a negative SNAO phase in La
Nina conditions over northwest Europe. The effect on
the SNAO of El Nino conditions is too small to discern
in this analysis.
b. Interdecadal time scales and the AMO
On interdecadal time scales, Baines and Folland
(2007) suggest a link between the SNAO and the pattern
−0.8 −0.4 0 0.4 0.8 −0.8 −0.4 0 0.4 0.8
−0.8 −0.4 0 0.4 0.8
FIG. 8. ENSO relationship with JA MSLP. (top left) Regression of JA Nino-3.4 against JA pressure at mean sea level
over 1876–2007 in hPa 8C21 (colors). Contours show the edge of regions where regressions are significant at the 95%
level of a two-tailed t test. (top right) Composite MSLP anomaly (with respect to the mean of 1901–2000) for the coolest
20% of the Nino-3.4 JA seasons (La Nina case, with Nino-3.4 , 20.598C). Bold black lines show the edge of regions
where the mean La Nina MSLP is statistically different from the remainder of cases at the 95% level. Units are hPa.
(bottom) As in (top right), but for the warmest 20% of the Nino-3.4 JA seasons (El Nino case, Nino-3.4 . 0.448C).
1092 J O U R N A L O F C L I M A T E VOLUME 22
of the AMO SSTs globally. The AMO is thought to be
partly related to natural changes in the thermohaline
circulation (Knight et al. 2005, 2006). An important part
of this pattern is in the North Atlantic (Delworth and
Mann 2000; Enfield et al. 2001; Sutton and Hodson
2005; Knight et al. 2005) such that when the AMO is in
its warm North Atlantic phase, the SNAO tends to be in
its negative phase. The AMO SST pattern can vary
naturally (Trenberth and Shea 2006) or in recent times
may have been influenced by anthropogenic aerosols
(Rotstayn and Lohman 2002; Mann and Emanuel 2006).
Sutton and Hodson (2005) showed in a model analysis
using the Third Hadley Centre Atmosphere Model
(HadAM3; Pope et al. 2000) that pressure in the north-
west European area tends to be lower in the positive
phase of the AMO, corresponding therefore to a ten-
dency to a negative SNAO. Knight et al. (2006) showed
similar results in summer from a 500-yr control run of
the third climate configuration of the Hadley Centre
Coupled Model (HadCM3), which simulates the AMO
as part of its intrinsic variability. They also show that the
simulated central England temperature (CET; Manley
1974; Parker et al. 1992; Parker and Horton 2005) is
significantly modulated on decadal time scales. The
correlation of modeled June–August CET is highly
significant at 0.50 with the modeled AMO. A compari-
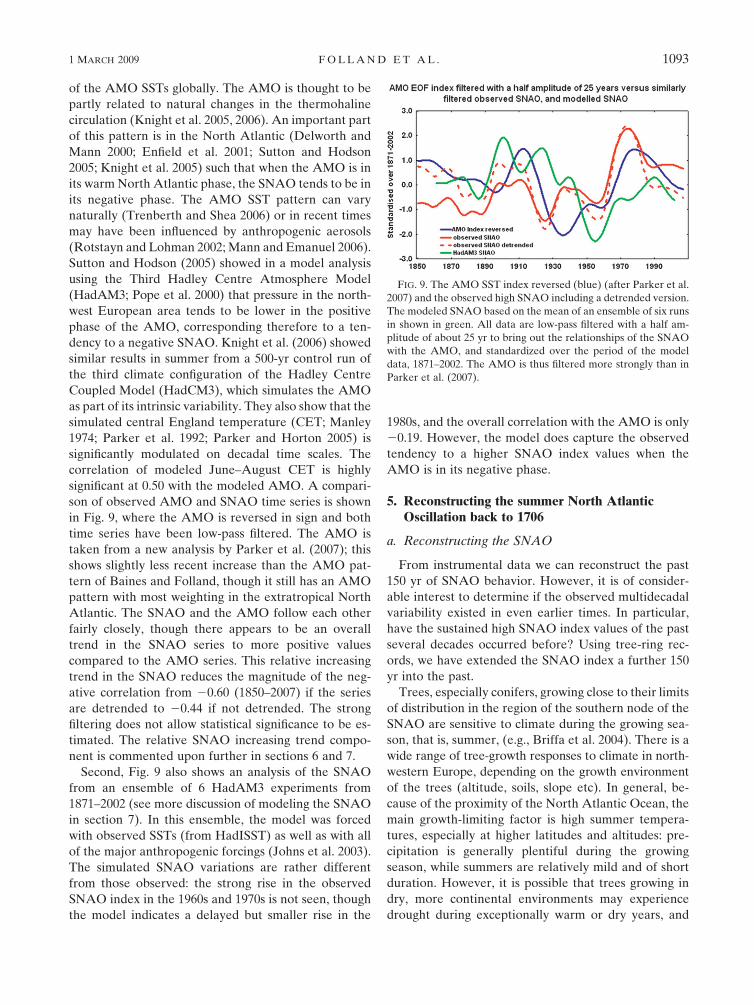
son of observed AMO and SNAO time series is shown
in Fig. 9, where the AMO is reversed in sign and both
time series have been low-pass filtered. The AMO is
taken from a new analysis by Parker et al. (2007); this
shows slightly less recent increase than the AMO pat-
tern of Baines and Folland, though it still has an AMO
pattern with most weighting in the extratropical North
Atlantic. The SNAO and the AMO follow each other
fairly closely, though there appears to be an overall
trend in the SNAO series to more positive values
compared to the AMO series. This relative increasing
trend in the SNAO reduces the magnitude of the neg-
ative correlation from 20.60 (1850–2007) if the series
are detrended to 20.44 if not detrended. The strong
filtering does not allow statistical significance to be es-
timated. The relative SNAO increasing trend compo-
nent is commented upon further in sections 6 and 7.
Second, Fig. 9 also shows an analysis of the SNAO
from an ensemble of 6 HadAM3 experiments from
1871–2002 (see more discussion of modeling the SNAO
in section 7). In this ensemble, the model was forced
with observed SSTs (from HadISST) as well as with all
of the major anthropogenic forcings (Johns et al. 2003).
The simulated SNAO variations are rather different
from those observed: the strong rise in the observed
SNAO index in the 1960s and 1970s is not seen, though
the model indicates a delayed but smaller rise in the
1980s, and the overall correlation with the AMO is only
20.19. However, the model does capture the observed
tendency to a higher SNAO index values when the
AMO is in its negative phase.
5. Reconstructing the summer North AtlanticOscillation back to 1706
a. Reconstructing the SNAO
From instrumental data we can reconstruct the past
150 yr of SNAO behavior. However, it is of consider-
able interest to determine if the observed multidecadal
variability existed in even earlier times. In particular,
have the sustained high SNAO index values of the past
several decades occurred before? Using tree-ring rec-
ords, we have extended the SNAO index a further 150
yr into the past.
Trees, especially conifers, growing close to their limits
of distribution in the region of the southern node of the
SNAO are sensitive to climate during the growing sea-
son, that is, summer, (e.g., Briffa et al. 2004). There is a
wide range of tree-growth responses to climate in north-
western Europe, depending on the growth environment
of the trees (altitude, soils, slope etc). In general, be-
cause of the proximity of the North Atlantic Ocean, the
main growth-limiting factor is high summer tempera-
tures, especially at higher latitudes and altitudes: pre-
cipitation is generally plentiful during the growing
season, while summers are relatively mild and of short
duration. However, it is possible that trees growing in
dry, more continental environments may experience
drought during exceptionally warm or dry years, and
FIG. 9. The AMO SST index reversed (blue) (after Parker et al.
2007) and the observed high SNAO including a detrended version.
The modeled SNAO based on the mean of an ensemble of six runs
in shown in green. All data are low-pass filtered with a half am-
plitude of about 25 yr to bring out the relationships of the SNAO
with the AMO, and standardized over the period of the model
data, 1871–2002. The AMO is thus filtered more strongly than in
Parker et al. (2007).
1 MARCH 2009 F O L L A N D E T A L . 1093

large amounts of snowfall during winter can affect the
following year’s growth (e.g., Vaganov et al. 1999). Tree-
ring data from the region (especially from Scandinavia)
have been used mainly to reconstruct temperatures, but
also precipitation, for the last hundreds to thousands of
years (e.g., Briffa et al. 2004; Helama and Lindholm 2003;
Gouirand et al. 2007). The potential for using tree-ring
data to reconstruct large-scale atmospheric features has
previously been shown, for example, for the winter mode
of the NAO (Cook et al. 1998, 2002). Since the SNAO is
associated with marked interannual climate variations in
this region, a link between SNAO variability and tree-
growth patterns is expected.
We analyzed over 100 tree-ring series (tree-ring
widths as well as maximum latewood density) from the
region to ascertain their association with the observed
SNAO. We used standardized tree-ring data, where neg-
ative exponentials or lines of zero or negative slope are
used on individual tree-ring series to remove age effects
and to preserve the low-frequency signal (Fritts 1976).
Highly significant correlations between tree growth and
SNAO were found in northern Great Britain and cen-
tral and northern Norway, with positive correlations
in Great Britain and inland Norway and negative cor-
relations on the Norwegian west coast, as would be
expected from the correlation patterns shown in Figs. 4a
and 6a. Furthermore, the strongest correlations (.0.4)
were found over Great Britain. Together, approximately
20 chronologies indicated strong associations with the
SNAO, although the lengths of the individual chronol-
ogies ranged from 130 to more than 1000 yr. Since our
aim was to reconstruct the SNAO for the last three
centuries, those seven chronologies reaching as far back
or further than 1700 were selected for further analysis
(Table 2). Principal component analysis was performed
over the 1706–1976 period and used to define the vari-
ance common to all chronologies. To reconstruct the
SNAO index, a linear regression model, with the ob-
served SNAO as the predictand and significant tree-ring
principal components as predictors, was used. The
model was initially calibrated using half of the available
instrumental data, withholding the remaining data for
verification. Consequently, 1850–1912 was first used for
calibration and 1913–76 for verification. The procedure
was then reversed. The final model, derived from re-
gression over the full period 1850–1976, was used to
reconstruct SNAO index back to 1706 (Table 3).
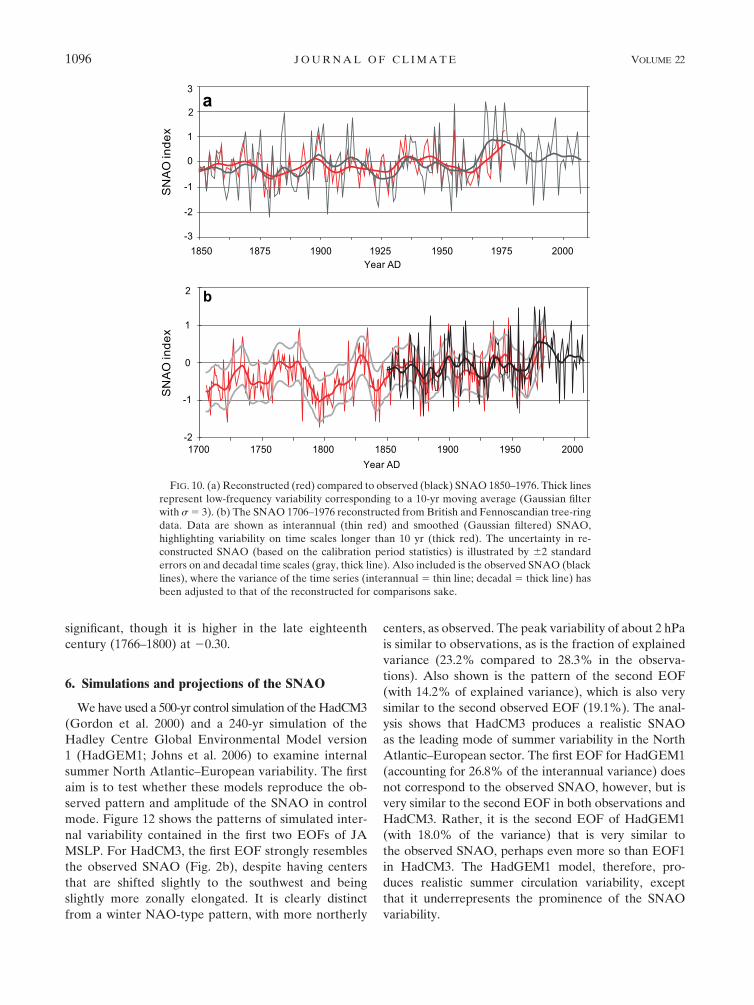
The reconstructed SNAO index compares well with
the observed (Fig. 10), although it fails to capture the
magnitude of the observed high-frequency variability.
There is a slightly stronger association between the re-
constructed and observed SNAO indices on interannual
(r 5 0.61) than on decadal to interdecadal (r 5 0.51)
time scales, but in general the SNAO evolution since
1850 is well captured. A more detailed analysis (not
shown) suggests that the reconstruction is actually poorest
for periods near 10 yr, and is best on multidecadal pe-
riods .25 yr. The full reconstruction (Fig. 10b) shows
clear multidecadal variability over 1706–1976, and a
tendency toward more positive values of the SNAO in
the latter part of the record.
b. Comparison of the reconstructed summer NorthAtlantic Oscillation, central England temperature,and England and Wales precipitation
We compare the reconstruction of the SNAO index
to that of July and August mean CET (Manley 1974;
Parker et al. 1992; Parker and Horton 2005). CET is the
longest monthly instrumental surface temperature se-
ries in the world and well homogenized. It therefore
provides a unique opportunity to compare the SNAO
with temperature over three centuries, with almost 150
yr of data independent of the calibration and verifica-
tion period of the proxy SNAO. Figure 11 shows, as
expected from the previous discussion, a strong corre-
lation of the SNAO with surface temperature in central
England over 1850–2006. In this diagram both series are
individually standardized to account for the fact that the
standard deviation of the reconstructed SNAO is too
small. The region represented by CET does not overlap
with that of the tree-ring reconstructions in the previous
section but lies centrally within the southern part of
the SNAO dipole. So it is reasonable to ask whether a
strong relationship is seen between CET and the re-
constructed SNAO data before 1850.
Over the period 1706–1976 as a whole, the correlation
between July and August CET and the SNAO is 0.55,
significant well beyond the 0.1% level. Over the com-
bined calibration and verification period 1850–1976 the
value is higher (0.66) as expected. However, over the
totally independent period 1706–1849 the relationship
remains generally strong (r 5 0.47) and significant at the
0.1% level. There is some relative loss of variance in the
eighteenth century compared to the nineteenth century
(Fig. 11) but with little relative loss of correlation (r 5
0.47 over the eighteenth century). This is despite a pe-
riod, 1790–1810, where the relationship appears to fail,
although there is no obvious extra loss in proxy data
reconstruction variability. Similar (but less strong) re-
lationships are seen between the SNAO index and
Stockholm temperatures back to 1756 (not shown), with
correlations for the 1756–1976 period (0.39), similar to
the 1756–1849 period (0.36) and the 1850–1976 period
(0.47; all significant beyond the 0.1% level). As with
CET, there is also a loss of coherency between these
two records centered on 1800, when the reconstructed
1094 J O U R N A L O F C L I M A T E VOLUME 22

SNAO index is in a strongly negative phase. Greatbatch
and Rong (2006) noticed a period of loss of correlation
between their quite similar version of a July–August
SNAO and CET around 1915–25. This is evident in Fig.
11. They attributed this loss of correlation to the dom-
inant influence on high summer CET in this period of
a different atmospheric circulation pattern. This gave
anomalous anticyclonic or cyclonic conditions over
northwest Europe which lacked the extended east–west
structure of the southern anticyclonic node of the SNAO;
the latter tends to enhance the effects of local differ-
ences of cloudiness on CET by advective effects as
noted above. Supporting this, the two clusters corre-
sponding to opposite phases of the SNAO (Fig. 1c) are
also both slightly less common in the 1915–25 period.
Some of the other clusters therefore become more
common to compensate, but no single pattern domi-
nates.
A striking feature of Fig. 11 is an overall rise in the
SNAO index on multidecadal time scales to a maximum
in the 1970s, the end of the data. Given that this higher
level has been almost sustained, there appears to be no
period back to 1706 when for decades the SNAO was as
high. Before 1850 there is a century time-scale fluctua-
tion but no sustained SNAO values higher than in the
nineteenth century. CET tends to follow the SNAO
index well on the low-frequency time scale since the late
nineteenth century as expected, but before that CET
tends to be relatively higher, particularly in the eigh-
teenth century. It is likely that there is a warm bias in
eighteenth- and early nineteenth-century high summer
instrumental and inferred instrumental data because of
poor thermometer exposures (P. Jones 2008, personal
communication); some of the early eighteenth-century
CET data are also not strictly instrumental (Manley
1974). Although insufficiently reliable on its own to
quantify this bias, Fig. 11 suggests the bias might be of
the order of one standardized unit or about 18C
in eighteenth-century high summer months relative to
the same months in the twentieth century. Thus sum-
mer CET may still contain inhomogeneities which would
tend to cause an underestimate of the warming of U.K.
summer climate over the last 300 yr.
England and Wales precipitation (EWP) is less reli-
able in earlier decades than CET and rainfall is less well
spatially correlated than temperature. EWP also only
starts in 1766. So a generally poorer relationship with
the SNAO would be expected. Over the calibration and
verification period of the SNAO index, the correlation
of EWP with the SNAO index is 20.56 and highly sig-
nificant. Over the independent period 1766–1849 the
correlation is still negative but only 20.15 and not
TABLE 2. Tree-ring chronologies selected for reconstructing SNAO. The first two columns give the name and country of the site where
tree-rings were sampled; the latitude and longitude of the chronologies are given in columns three and four; the fifth column indicates the
tree-ring data type used: tree-ring widths (TRW) or maximum latewood density (MXD); the time spans of the chronologies are shown in
column six. Data denoted a and c were obtained from the International Tree-Ring Data Bank, International Geosphere-Biosphere
Programme (IGBP) Past Global Changes (PAGES)/World Data Center for Paleoclimatology, National Oceanic and Atmospheric
Administration/National Climatic Data Center (NOAA/NCDC) Paleoclimatology Program, Boulder, Colorado.
Name Country Lat (8N) Lon (8E) Data Time span (year A.D.)
Forfjorddalena Norway 68848’ 15844’ TRW 878–1994
Femundsmarkab Norway 62800’ 12811’ TRW 1001–2000
Lofotenc Norway 68829’ 16802’ MXD 1485–1978
Coulinc United Kingdom 57832’ 5821’ TRW 1671–1978
Coulinc United Kingdom 57832’ 5821’ MXD 1671–1978
Narvikc Norway 68829’ 17844’ TRW 1702–1978
Invereyc United Kingdom 53800’ 3835’ MXD 1706–1976
a Data from Andreas Kirchhefer.b Data from Maarit Kalela-Brundin.c Data from Fritz Schweingruber.
TABLE 3. Calibration and verification statistics against the observed SNAO: r 5 correlation coefficient, r2 5 explained variance,
RE 5 reduction of error, CE 5 coefficient of efficiency, and DW 5 Durbin–Watson statistics.
Verification Calibration
r r2 RE CE R R2 DW
1850–1912 0.62 0.38 0.33 0.30 1913–76 0.65 0.43 1.55
1913–76 0.52 0.27 0.31 0.30 1850–1912 0.56 0.32 2.01
1850–1976 0.62 0.38 1.75
1 MARCH 2009 F O L L A N D E T A L . 1095
significant, though it is higher in the late eighteenth
century (1766–1800) at 20.30.
6. Simulations and projections of the SNAO
We have used a 500-yr control simulation of the HadCM3
(Gordon et al. 2000) and a 240-yr simulation of the
Hadley Centre Global Environmental Model version
1 (HadGEM1; Johns et al. 2006) to examine internal
summer North Atlantic–European variability. The first
aim is to test whether these models reproduce the ob-
served pattern and amplitude of the SNAO in control
mode. Figure 12 shows the patterns of simulated inter-
nal variability contained in the first two EOFs of JA
MSLP. For HadCM3, the first EOF strongly resembles
the observed SNAO (Fig. 2b), despite having centers
that are shifted slightly to the southwest and being
slightly more zonally elongated. It is clearly distinct
from a winter NAO-type pattern, with more northerly
centers, as observed. The peak variability of about 2 hPa
is similar to observations, as is the fraction of explained
variance (23.2% compared to 28.3% in the observa-
tions). Also shown is the pattern of the second EOF
(with 14.2% of explained variance), which is also very
similar to the second observed EOF (19.1%). The anal-
ysis shows that HadCM3 produces a realistic SNAO
as the leading mode of summer variability in the North
Atlantic–European sector. The first EOF for HadGEM1
(accounting for 26.8% of the interannual variance) does
not correspond to the observed SNAO, however, but is
very similar to the second EOF in both observations and
HadCM3. Rather, it is the second EOF of HadGEM1
(with 18.0% of the variance) that is very similar to
the observed SNAO, perhaps even more so than EOF1
in HadCM3. The HadGEM1 model, therefore, pro-
duces realistic summer circulation variability, except
that it underrepresents the prominence of the SNAO
variability.
1700 1750 1800 1850 1900 1950 2000
Year AD
-2
-1
0
1
2
xe
dni
OA
NS
b
1850 1875 1900 1925 1950 1975 2000Year AD
-3
-2
-1
0
1
2
3
xe
dni
OA
NS
a
FIG. 10. (a) Reconstructed (red) compared to observed (black) SNAO 1850–1976. Thick lines
represent low-frequency variability corresponding to a 10-yr moving average (Gaussian filter
with s 5 3). (b) The SNAO 1706–1976 reconstructed from British and Fennoscandian tree-ring
data. Data are shown as interannual (thin red) and smoothed (Gaussian filtered) SNAO,
highlighting variability on time scales longer than 10 yr (thick red). The uncertainty in re-
constructed SNAO (based on the calibration period statistics) is illustrated by 62 standard
errors on and decadal time scales (gray, thick line). Also included is the observed SNAO (black
lines), where the variance of the time series (interannual 5 thin line; decadal 5 thick line) has
been adjusted to that of the reconstructed for comparisons sake.
1096 J O U R N A L O F C L I M A T E VOLUME 22

To investigate possible future changes in the SNAO,
we used further HadCM3 and HadGEM1 simula-
tions which were identical to the control experiments
except for increasing levels of atmospheric CO2. In the
HadCM3 transient simulation, CO2 was increased by
2% yr21 for 70 yr, and in the HadGEM1 simulation it
was increased by 1% yr21 for 140 yr. In both experi-
ments, a level of 4 times the initial, preindustrial CO2
concentration of 285 ppmv was attained after this time,
and was held constant for 100 yr thereafter. We analyze
the final 50 yr of the experiments in order to ensure the
climate has stabilized and to minimize the influence of
the difference in the initial rates of CO2 increase. These
experiments are thought to be a useful, if extreme, an-
alog of future climate change, for which increasing CO2
is likely to be the dominant driver.
The difference between the mean JA MSLP for the
last 50 yr of the steady 4 3 CO2 phase of the transient
simulation and the equivalent part of the control simu-
lation is shown in Fig. 13. It is found that there are large-
scale reorganizations of atmospheric mass in the altered
climate of both models, but particularly in HadCM3.
These tend to increase MSLP over the tropical and
Southern Hemisphere Pacific Ocean and decrease MSLP
over the Northern Hemisphere, especially in the Eur-
asian sector. As these changes at very large scales are
expected to be independent of the synoptic-scale changes
investigated here, we subtract the average MSLP in the
region north of 308N from all grid points globally before
continuing the analysis. The resulting patterns of MSLP
change are also shown in Fig. 13 and reveal statistically
significant changes in circulation. In HadCM3, there
are MSLP decreases of over 6 hPa over Greenland and
increases of over 3 hPa west of the British Isles. HadGEM1
reveals similar changes, albeit smaller, with a 1-hPa de-
crease over Greenland and a 2–3-hPa increase over the
northern North Sea. These patterns, which are similar to
those found in multimodel assessments of future MSLP
change (Meehl et al. 2007; Giorgi and Coppola 2007),
have strong resemblances to each respective model’s
SNAO pattern (Fig. 12). The models additionally show
other MSLP changes which do not correspond to the
SNAO pattern, for example over southern Europe
stretching into central Asia. This is to be expected as the
SNAO is a regional feature and other responses could
occur in other regions. The southern Europe changes
are also seen in other models, and appear to be linked to
the robust drying signal simulated over this region. Over
northern Europe the simulations suggest that the
change in circulation will be equivalent to an increas-
ingly positive phase of the SNAO.
To further show this, we also present a time series of
the change in the SNAO defined by projecting each
model’s own SNAO pattern (EOF1 for HadCM3 and
FIG. 11. Comparison of standardized central England temperature and standardized re-
constructed SNAO using proxy data as in Fig. 10. Both series are standardized over 1706–1976,
the period of the reconstructed data to show the relationships clearly. The calibration and test
period for the SNAO was 1850–1976. The smoothed lines are the data low-pass filtered for
periods .25 yr.
1 MARCH 2009 F O L L A N D E T A L . 1097

EOF2 for HadGEM1) onto the control and transient
MSLP data (Fig. 13). We find that for both models the
SNAO shifts to more positive values, reaching mean
levels in the period 50–100 yr after CO2 stabilization
of 1.22 6 0.53 (latter value is two standard errors) and
0.53 6 0.38 standard deviations of the interannual var-
iability in the control simulations for HadCM3 and
HadGEM1. SNAO changes are highly significant well
beyond the 5% level. These shifts imply that JA seasons
with SNAO index values lower than the control average
are rare under conditions of 4 3 CO2 in HadCM3 and
still substantially less common (15 in the 50 yr used in
the upper panels of Fig. 13) in HadGEM1. Note that the
SNAO index increases in both models appear to mirror
the time series of the increase and the leveling off of the
increase in CO2 concentration.
It appears that the SNAO may be sensitive to large
changes in greenhouse gas forcing, although we do not
1020
1020
1016
1012
1012
1008
1012
1012
101210
16
1020
1024 1008
1004
1004
1000
996996
1020
1020
1016
1012
1012
1008
1012
1012
101210
16
1020
1024 1008
1004
1004
1000
996996
−2.5 −2 −1.5 −1 −0.5 0 0.5 1 1.5 2 2.5
10201016
1012
1008
1016
1020
1024
1012
1012
1012
1008
1008
1004
10041000
1016
1012
1024
10201016
1012
1008
1016
1020
1024
1012
1012
1012
1008
1008
1004
10041000
1016
1012
1024
−2.5 −2 −1.5 −1 −0.5 0 0.5 1 1.5 2 2.5
FIG. 12. Leading two EOF patterns of mean JA MSLP in control simulations of (left) HadCM3 and (right)
HadGEM1. The HadCM3 EOFs are derived from a 500-yr simulation and the HadGEM1 EOFs are derived from a
240-yr simulation. An area-weighted EOF analysis is performed for the region 258–708N, 708W–508E, and the re-
sulting standardized principal component is regressed onto the hemispheric MSLP data. Colors indicate the EOF
pattern in hPa, while contours show the climatological mean MSLP in hPa. (top) EOF1 accounts for 23.2% of the
total variance in HadCM3 and 26.8% in HadGEM1. (bottom) EOF2 accounts for 14.2% of the variance in HadCM3
and 18.0% in HadGEM1. Units are hPa.
1098 J O U R N A L O F C L I M A T E VOLUME 22

−6 −5 −4 −3 −2 −1 0 1 2 3 4 5 6
0 50 100 150Years
−3
−2
−1
0
1
2
3
Sta
nd
ard
ised
pro
ject
ion
0 50 100 150Years
−0.5
0.0
0.5
1.0
1.5
Sta
nd
ard
ised
pro
ject
ion
−6 −5 −4 −3 −2 −1 0 1 2 3 4 5 6
0 50 100 150 200Years
−3
−2
−1
0
1
2
3
0 50 100 150 200Years
−0.5
0.0
0.5
1.0
1.5
1 MARCH 2009 F O L L A N D E T A L . 1099

know whether the mechanisms are the same as those
involved in unforced variability. At the least, the results
imply that the climate change response projects onto
the SNAO. A typical ‘‘business as usual’’ emissions
scenario could, therefore, lead to increased frequency
of positive SNAO conditions and so warmer and drier
northwest European summers. In HadCM3, there are
indeed extreme reductions in JA rainfall across the
whole of Europe, peaking at greater than 80% over
western France for the 50-yr period used in Fig. 12. Over
the British Isles, where the HadCM3 SNAO has most
effect, reductions between 20% and 80% are projected.
Rowell and Jones (2006) show similar, if smaller, drying
signals across most of Europe in a simulation with a
higher resolution HadCM3 version for 2071–2100 using
the Special Report on Emissions Scenarios (SRES A2,
which has projected CO2 concentrations of about 2.5
times preindustrial levels). Large drying is also seen in
HadGEM1, but as with the MSLP response, the mag-
nitude is smaller than HadCM3. Peak reductions in rain-
fall of 60%–80% are predicted over southern France and
northern Spain, with reductions over the British Isles of
20%–60%. Changes over southern and central Europe
may also result from shifts in the position and intensity
of the subtropical anticyclone, but this is unlikely to
influence northern Europe directly. Rather, a contri-
bution from the more positive SNAO is likely. Support
for this idea is provided by Rowell and Jones (2006),
who were able to separate European climatic changes
arising through remotely generated large-scale atmo-
spheric changes from those arising from intrinsic climatic
warming by creating an isolated European domain within
their model. They found that the most important factor
in the simulated precipitation reductions in southern
and central Europe is climatic warming and drying of
the soils, whereas for northern and western Europe
(which corresponds to the southern node of the SNAO),
circulation-related factors play the more important role.
Our results and those in Rowell and Jones (2006) indi-
cate that climate change is likely to cause a dramatic
increase in droughts and the incidence of heat stress
throughout most of Europe for a combination of reasons.
Circulation-related changes in climate are over and above
the circulation-independent warming anticipated from
greenhouse gas increases.
7. Conclusions
The North Atlantic Oscillation (NAO) is the most
important single mode for interpreting winter climate
variability in the North Atlantic European sector. It is
expressed as changes in westerly winds over the North
Atlantic region and as a result is the primary determi-
nant of temperatures and storminess in the European
winter. Since the winter months are dynamically the
most active, most focus has previously been on the
winter NAO. Here we have shown that there exists a
pattern of variability we call the summer North Atlantic
Oscillation (SNAO), which is the summertime parallel
to the winter NAO. It is able to explain the principal
variations of summer climate over northern Europe,
including mean temperatures, precipitation, and cloud-
iness. While SNAO-like patterns have previously been
identified (BL87; Hurrell and van Loon 1997; Hurrell
and Folland 2002; Hurrell et al. 2003; Cassou et al.
2005), a definitive analysis is provided here for the first
time. Lack of this has led to disagreement in the scien-
tific literature about the pattern of the principal summer
mode in the North Atlantic sector. An important part of
this confusion arises from the more northerly position
and smaller spatial extent of the SNAO compared to its
winter counterpart.
The SNAO is defined as the first eigenvector of daily
extratropical North Atlantic–European MSLP during
high summer (July–August; Figs. 1a and 2a). These two
months were chosen for analysis because the July and
August time series of the SNAO pattern vary in a
broadly similarly way, especially on interdecadal times
scales whereas June varies differently. However, the
spatial signature of the June SNAO pattern is quite
FIG. 13. MSLP changes in response to 4 3 CO2 forcing in (left) HadCM3 and (right)
HadGEM1. (top) The raw model differences for the last 50 yr of data starting 50 yr after CO2
stabilization are shown with respect to the equivalent period in the control simulation. (upper
middle) Differences with the mean MSLP difference north of 308N subtracted everywhere over
the globe are shown in an attempt to remove the summer hemispheric mean climate change
signal of reduced MSLP. Units are hPa. (lower middle) The SNAO index defined as the pro-
jection over the SNAO area (508–808N, 608W–308E) of the model first (for HadCM3) or second
(for HadGEM1) EOF (computed over 258–708N, 708W–508E) for control (black) and transient
(red) simulations. The projections are normalized with respect to the control standard devia-
tion. Low-pass filtered projections are denoted by the thick curves. (bottom) The low-frequency
curves are reproduced, along with scaled curves showing the models’ CO2 increases above the
preindustrial level.
1100 J O U R N A L O F C L I M A T E VOLUME 22

similar to the other high summer months. The resulting
SNAO is a temporally stable pattern on daily to bi-
monthly time scales (Fig. 3a), explaining 18% (daily) to
28% (2-month mean) of the variance of a principal
component analysis over the analysis domain. In addition,
the SNAO has a quasi–equivalent barotropic structure.
The positive phase of the SNAO is associated with warm,
dry, and relatively cloud-free conditions over northwest
Europe, especially the United Kingdom and much of
Scandinavia, and, more weakly, cooler, wetter, and
cloudier conditions over southern Europe and the Med-
iterranean, especially in the east. (Figs. 4, 5, and 6a). Some
locally significant correlations are found over northeast
North America where higher-than-normal temperatures
are related to the positive phase of the SNAO. The evi-
dence for anomalous atmospheric circulation associated
with this feature is slight at the surface, but is clearest at
300 hPa and on the 2-month time scale.
Some significant negative correlations with rainfall
and cloudiness, and positive correlations with temper-
ature over the African Sahel region suggest distant re-
lationships between the SNAO and the West African
monsoon in July and August. These relationships are
consistent with links between multidecadal and inter-
annual variations in North Atlantic SSTs (and associ-
ated SST variations elsewhere) and climate in various
parts of the North Atlantic sector, as previously repor-
ted by, for example, Folland et al. (1986), Rowell et al.
(1995), Delworth and Mann (2000), Sutton and Hodson
(2005), Knight et al. (2006). Indeed, for periods greater
than 10 yr, the SNAO seems to be linked significantly to
the Atlantic multidecadal oscillation (AMO) in both
models (e.g., Knight et al. 2006) and the observations
shown in this paper. Here the warm and cold North
Atlantic phase of the AMO corresponds to a negative
and positive phase SNAO, respectively. This is partic-
ularly evident in the last few decades as noted by Baines
and Folland (2007).
On interannual time scales, small but significant corre-
lations with a La Nina SST pattern in the eastern Pacific
appear in high summer. An analysis of the atmospheric
patterns associated with El Nino conditions in high sum-
mer shows no significant signal with the SNAO.
The SNAO has been reconstructed back to 1706 using
tree-ring data from the United Kingdom and western
Scandinavia. The reconstruction explains almost 40%
of the variance in the observed SNAO in a testing pe-
riod. Its reconstruction phase, allowing for some loss
of interannual amplitude, agrees well with long meteo-
rological records from the United Kingdom and Scan-
dinavia. This can be seen as a measure of the temporal
stability of the reconstruction. Taken with the instru-
mental data, the high positive index values of the SNAO
attained in the period around 1970–95 has no counter-
part in the past three centuries. A trend to a more posi-
tive SNAO phase is also emerging relative to the varia-
tions in the AMO.
Simulations of possible future changes in the SNAO
using the HadCM3 and HadGEM1 models, in which
atmospheric CO2 was increased from preindustrial levels
until stabilization at 4 times preindustrial concentra-
tions, suggest that the associated change in circulation
will indeed be equivalent to an increasingly positive
SNAO phase. This result agrees qualitatively with the
pattern of change predicted by the Third Coupled
Model Intercomparison Project (CMIP3) multimodel
ensemble under doubled CO2 conditions. These results
indicate an increased longer-term risk of drought in
northwest Europe. Looking a couple of decades ahead
to around 2030, the AMO, or at least the component
related to variations in the Atlantic meridional over-
turning circulation, may have turned down both natu-
rally (Knight et al. 2005) and because of enhanced
greenhouse gases (Meehl et al. 2007). This could cause
a change to a more positive SNAO, with enhanced
droughts and heat waves over northwest Europe setting
in around that time.
Acknowledgments. The Met Office authors were
supported by the Joint Defra and MoD Programme,
(Defra) GA01101 (MoD) CBC/2B/0417_Annex C5.
Hans Linderholm was supported by the Swedish Re-
search Council (VR). The paper contributes to the
CLIVAR Climate of the Twentieth Century Interna-
tional Project and the European Union EMULATE
project. The authors thank Ryan Eastman for supplying
Fig. 5 and Adam Scaife and Dave Rowell for useful dis-
cussions. Two anonymous reviewers improved the paper.
REFERENCES
Allan, R. J., and T. J. Ansell, 2006: A new globally complete
monthly historical gridded mean sea level pressure data set
(HadSLP2): 1850–2003. J. Climate, 19, 5816–5842.
Ansell, T. J., and Coauthors, 2006: Daily mean sea level pressure
reconstructions for the European–North Atlantic region for
the period 1850–2003. J.Climate, 19, 2717–2742.
Baines, P. G., and C. K. Folland, 2007: Evidence for a rapid global
climate shift across the late 1960s. J. Climate, 20, 2721–2744.
Barnston, A. G., and R. E. Livezey, 1987: Classification, season-
ality and persistence of low-frequency atmospheric circulation
patterns. Mon. Wea. Rev., 115, 1083–1126.
Briffa, K. R., T. J. Osborn, and F. H. Schweingruber, 2004: Large-
scale inferences from tree rings: A review. Global Planet.
Change, 40, 11–26.
Brohan, P., J. J. Kennedy, I. Harris, S. F. B. Tett, and P. D. Jones,
2006: Uncertainty estimates in regional and global observed
1 MARCH 2009 F O L L A N D E T A L . 1101

temperature changes: A new dataset from 1850. J. Geophys.
Res., 111, D12106, doi:10.1029/2005JD006548.
Cassou, C., L. Terray, J. W. Hurrell, and C. Deser, 2004: North
Atlantic winter climate regimes: Spatial asymmetry, statio-
narity with time, and oceanic forcing. J. Climate, 17, 1055–1068.
——, ——, and A. S. Phillips, 2005: Tropical Atlantic influence on
European heat waves. J. Climate, 18, 2805–2811.
Casty, C., C. C. Raible1, T. F. Stocker, H. Wanner, and J.
Luterbacher, 2007: A European pattern climatology 1766–
2000. Climate Dyn., 29, 791–805, doi:10.1007/s00382-007-0257-6.
Cook, E. R., R. D. D’Arrigo, and K. R. Briffa, 1998: A reconstruction
of the North Atlantic Oscillation using tree-ring chronologies
from North America and Europe. Holocene, 8, 9–17.
——, ——, and M. E. Mann, 2002: A well-verified, multiproxy
reconstruction of the winter North Atlantic Oscillation index
since AD 1400. J. Climate, 15, 1754–1764.
Delworth, T. L., and M. E. Mann, 2000: Observed and simulated
multidecadal variability in the Northern Hemisphere. Climate
Dyn., 16, 661–676.
Enfield, D. B., A. M. Mestas-Nunez, and P. J. Trimble, 2001: The
Atlantic multidecadal oscillation and its relation to rainfall
and river flows in the continental U.S. Geophys. Res. Lett., 28,
2077–2080.
Feldstein, S. B., 2007: The dynamics of the North Atlantic Oscil-
lation during the summer season. Quart. J. Roy. Meteor. Soc.,
133, 1509–1518.
Fereday, D. R., J. R. Knight, A. A. Scaife, C. K. Folland, and A.
Philipp, 2008: Cluster analysis of North Atlantic–European
circulation types and links with tropical Pacific Sea surface
temperatures. J. Climate, 21, 3687–3703.
Folland, C. K., D. E. Parker, and T. N. Palmer, 1986: Sahel rainfall
and worldwide sea temperatures 1901–85. Nature, 320, 602–
607.
——, ——, A. Colman, and R. Washington, 1999: Large scale
modes of ocean surface temperature since the late nineteenth
century. Beyond El Nino: Decadal and Interdecadal Climate
Variability, A. Navarra, Ed., Springer-Verlag, 73–102.
——, and Coauthors, 2001: Observed climate variability and
change. Climate Change 2001: The Scientific Basis, J. T.
Houghton et al., Eds., Cambridge University Press, 99–181.
Fritts, H. C., 1976: Tree Rings and Climate. Academic Press,
567 pp.
Giorgi, F., and E. Coppola, 2007: European climate-change os-
cillation (ECO): 2007. Geophys. Res. Lett., 34, L21703,
doi:10.1029/2007GL031223.
Goldenberg, S. B., C. W. Landsea, A. M. Mestas-Nunez, and
W. M. Gray, 2001: The recent increase in Atlantic hurricane
activity: Causes and implications. Science, 293, 474–479.
Gordon, C., C. Cooper, C. A. Senior, H. Banks, J. M. Gregory,
T. C. Johns, J. F. B. Mitchell, and R. A. Wood, 2000: The
simulation of SST, sea ice extents and ocean heat transports
in a version of the Hadley Centre coupled model without flux
adjustments. Climate Dyn., 16, 147–168.
Gouirand, I., H. W. Linderholm, A. Moberg, and B. Wohlfarth,
2007: On the spatiotemporal characteristics of Fennoscandian
tree-ring based summer temperature reconstructions. Theor.
Appl. Climatol., 91, 1–25, doi:10.1007/s00704-007-0311-7.
Greatbatch, R. J., and P. P. Rong, 2006: Discrepancies between
different Northern Hemisphere summer atmospheric circu-
lation data products. J. Climate, 19, 1261–1273.
Hahn, C. J., and S. G. Warren, 1999: Extended edited cloud reports
from ships and land stations over the globe, 1952-1996. Nu-
merical Data Package NDP-026C, Carbon Dioxide Informa-
tion Analysis Center, Department of Energy, Oak Ridge, TN,
79 pp.
——, and ——, 2003: Cloud climatology for land stations world-
wide, 1971-1996. Numerical Data Package NDP-026D, Car-
bon Dioxide Information Analysis Center, Department of
Energy, Oak Ridge, TN, 35 pp.
Helama, S., and M. Lindholm, 2003: Droughts and rainfall in
south-eastern Finland since AD 874, inferred from Scots pine
ring-widths. Boreal Environ. Res., 8, 171–183.
Horel, J. D., 1981: A rotated principal component analysis of the
interannual variability of the Northern Hemisphere 500 mb
height field. Mon. Wea. Rev., 109, 2080–2092.
Hurrell, J. W., and H. van Loon, 1997: Decadal variations in cli-
mate associated with the North Atlantic Oscillation. Climatic
Change, 36, 301–326.
——, and C. K. Folland, 2002: A change in the summer circulation
over the North Atlantic. CLIVAR Exchanges, No. 25, Inter-
national CLIVAR Project Office, Southampton, United
Kingdom, 52–54.
——, Y. Kushnir, G. Ottersen, and M. Visbeck, 2003: An overview
of the North Atlantic Oscillation. The North Atlantic Oscil-
lation: Climatic Significance and Environmental Impact, Geo-
phys. Monogr., Vol. 134, Amer. Geophys. Union, 1–35.
Johns, T. C., and Coauthors, 2003: Anthropogenic climate change
for 1860 to 2100 simulated with the HadCM3 model under
updated emissions scenarios. Climate Dyn., 20, 583–612.
——, and Coauthors, 2006: The new Hadley Centre climate model
(HadGEM1): Evaluation of coupled simulations. J.Climate,
19, 1327–1353.
Kalnay, E., and Coauthors, 1996: The NCEP/NCAR 40-Year
Reanalysis Project. Bull. Amer. Meteor. Soc., 77, 437–471.
Knight, J. R., R. J. Allan, C. K. Folland, M. Vellinga, and M. E.
Mann, 2005: A signature of persistent natural thermohaline
circulation cycles in observed climate. Geophys. Res. Lett., 32,
L20708, doi:10.1029/2005GL024233.
——, C. K. Folland, and A. A. Scaife, 2006: Climatic impacts of the
Atlantic multidecadal oscillation. Geophys. Res. Lett., 33,
L17706, doi:10.1029/2006GL026242.
Manley, G., 1974: Central England temperatures: Monthly means
1659 to 1973. Quart. J. Roy. Meteor. Soc., 100, 389–405.
Mann, M. E., and K. A. Emanuel, 2006: Atlantic hurricane trends
linked to climate change. Eos, Trans. Amer. Geophys. Union,
87, 233–244.
Meehl, G. A., and Coauthors, 2007: Global climate projections.
Climate Change 2007: The Physical Science Basis, S. Solomon
et al., Eds., Cambridge University Press, 747–845.
Mitchell, T. D., and P. D. Jones, 2005: An improved method of
constructing a database of monthly climate observations and
associated high-resolution grids. Int. J. Climatol., 25, 693–712.
Ogi, M., K. Yamazaki, and Y. Tachibana, 2004: The summertime
annular mode in the Northern Hemisphere and its linkage to
the winter mode. J. Geophys. Res., 109, D20114, doi:10.1029/
2004JD004514.
——, ——, and ——, 2005: The summer northern annular mode
and abnormal summer weather in 2003. Geophys. Res. Lett.,
32, L04706, doi:10.1029/2004GL021528.
Parker, D. E., and E. B. Horton, 2005: Uncertainties in the central
England temperature series 1878-2003 and some improve-
ments to the maximum and minimum series. Int. J. Climatol.,
25, 1173–1188.
——, T. Legg, and C. K. Folland, 1992: A new daily central England
temperature series, 1772-1991. Int. J. Climatol., 12, 317–342.
1102 J O U R N A L O F C L I M A T E VOLUME 22

——, C. Folland, A. Scaife, J. Knight, A. Colman, P. Baines, and B.
Dong, 2007: Decadal to multidecadal variability and the cli-
mate change background. J. Geophys. Res., 112, D18115,
doi:10.1029/2007JD008411.
Philipp, A., P. M. Della-Marta, J. Jacobeit, D. R. Fereday, P. D.
Jones, A. Moberg, and H. Wanner, 2007: Long-term varia-
bility of daily North Atlantic–European pressure patterns
since 1850 classified by simulated annealing clustering. J.
Climate, 20, 4065–4095.
Pope, V. D., M. L. Gallani, P. R. Rowntree, and R. A. Stratton,
2000: The impact of new physical parametrizations in the
Hadley Centre climate model: HadAM3. Climate Dyn., 16,123–146.
Portis, D. H., J. E. Walsh, M. El Hamly, and P. J. Lamb, 2001:
Seasonality of the North Atlantic Oscillation. J. Climate, 14,2069–2078.
Rayner, N. A., D. E. Parker, E. B. Horton, C. K. Folland, L. V.
Alexander, D. P. Rowell, E. C. Kent, and A. Kaplan, 2003:
Global analyses of sea surface temperature, sea ice, and night
marine air temperature since the late nineteenth century. J.
Geophys. Res., 108, 4407, doi:10.1029/2002JD002670.
Rotstayn, L., and U. Lohman, 2002: Tropical rainfall trends and
the indirect aerosol effect. J. Climate, 15, 2103–2116.
Rowell, D. P., 2003: The impact of Mediterranean SSTs on the
Sahelian rainfall season. J. Climate, 16, 849–862.
——, and R. G. Jones, 2006: Causes and uncertainty of future
summer drying over Europe. Climate Dyn., 27, 281–299,
doi:10.1007/s00382-006-0125-9.
——, C. K. Folland, K. Maskell, and J. A. Owen, 1992: Modelling
the influence of global sea surface temperature on the varia-
bility and predictability of seasonal Sahel rainfall. Geophys.
Res. Lett., 19, 905–908.
——, ——, ——, and M. N. Ward, 1995: Variability of summer
rainfall over tropical North Africa (1906-92): Observations and
modelling. Quart. J. Roy. Meteor. Soc., 121, 669–704.
Sutton, R. T., and D. L. R. Hodson, 2005: Atlantic Ocean forcing
of the North American and European summer climate. Sci-
ence, 309, 115–118.
Thompson, D. W. J., and J. M. Wallace, 1998: The Arctic Oscil-
lation signature in the wintertime geopotential height and
temperature fields. Geophys. Res. Lett., 25, 1297–1300.
Trenberth, K. E., and D. J. Shea, 2006: Atlantic hurricanes and
natural variability in 2005. Geophys. Res. Lett., 33, L12704,
doi:10.1029/2006GL026894.
Vaganov, E. A., M. K. Hughes, A. V. Kirdyanov, F. H.
Schweingruber, and P. P. Silkin, 1999: Influence of snowfall
and melt timing on tree growth in subarctic Eurasia. Nature,
400, 149–151.
Walker, G. T., 1924: Correlation in seasonal variations of the
weather, IX. A further study of world weather. Indian Meteor.
Mem., 24, 275–332.
Wigley, T. M. L., J. M. Lough, and P. D. Jones, 1984: Spatial
patterns of precipitation in England and Wales and a revised,
homogeneous England and Wales precipitation series. J.
Climatol., 4, 1–25.
1 MARCH 2009 F O L L A N D E T A L . 1103


![Elchanan Mossel - Springer...1714 E. MOSSEL GAFA 1 Introduction 1.1 Harmonic analysis of boolean functions. This paper studies low influ-ence functions f:Ωn → [0,1], where (Ωn,µn)](https://img.dokumen.tips/doc/110x75/611bb7c0a20dfc58ec16fb87/elchanan-mossel-springer-1714-e-mossel-gafa-1-introduction-11-harmonic-analysis.jpg)


![PDJD]LQ F] - trampsky-magazin.cz · jistě pr tebo najdoe malu místečké a snao id večeř dajíi . ... 9 hubenýmé i ... Pozdě v noc felčarůi pomocnív ji spažk s hlavol n](https://img.dokumen.tips/doc/110x75/5cac49aa88c993d4278c0520/pdjdlq-f-trampsky-jiste-pr-tebo-najdoe-malu-mistecke-a-snao-id-vecer.jpg)


