ISSN: 2455-2631 © June 2017 IJSDR | Volume 2, Issue 6
IJSDR1706056 International Journal of Scientific Development and Research (IJSDR) www.ijsdr.org 366
INFLUENCE OF STIFFNESS DISCONTINUOUS
DIAPHRAGM CHARACTERISTICS ON THE SEISMIC
BEHAVIOR OF RC STRUCTURE
1Vinod V,
2Pramod Kumar H V
1,2Assistant Professor
Department of Civil Engineering
C.B.I.T, Kolar, Karnataka, India
ABSTRACT-Researchers of past and present earthquake had caused more damage to the R.C structural buildings that
fairly exposed to the damage and sudden breakdown of RC buildings during lower and strong ground motion. Diaphragm
act as roof and roof system in concrete based reinforced building under seismic loading, these diaphragm transfers the
series of lateral loads to the vertical members. In this present study, an attempt is made study the influence of various
parameters associated with diaphragm on the seismic behavior of RC framed structure. Attempts are made to study the
effect of discontinuities in the diaphragm namely 0%, 10%, 20%, and 30% openings with comparing the seismic behavior
of four and eight story RC building. For this purpose, ETABS 2015, FE analysis software withResponse Spectrum
Analysis as per IS 1893 is used to assess the seismic behavior.Parameters such as Natural Time Period, Base Shear, Mode
shape, Drift and Displacements and internal forces in members are used to compare the seismic performance.
Key Words: stiffness diaphragm, Dynamic Analysis, ETABS 2015
I. INTRODUCTION
Diaphragm act as roof and roof system in concrete based reinforced building under seismic loading, diaphragm transfers the series
of lateral loads to the vertical members and where as Floors play an important role in distributing seismic forces to vertical sub-structure; in the mass centers at each rigid floor have three degree of freedom represents two in plane translation and one in plane
rotation. These plane translation and plane rotations are called as slaved nodes. The main function of the diaphragm is to transfer
the torsion and shear from lateral members and distributing it to vertical resisting members. Stiffness diaphragm determines how
stiffness diaphragm transfers torsional moment and shear from lateral member to vertical member. In frequent cases revealed that
structural weakness tends to form discontinuities in mass, stiffness and strength along the sides of diaphragm. These
discontinuities in the diaphragm are equal to the sudden change in geometry along the length of building. According to IS
1893:2000 building with discontinuities gives lesser deformation and it is more used in earthquake affected areas.
Scope and Objectives of the Study
To study the discontinuities of diaphragm by seismic analysis in the RC building.
To compare the behavior of different discontinuities in the diaphragm systems during earthquake loading.
To study the above objective using response spectrum analysis with the help of using ETABS 2015 software considering
the parameters such as natural time period, drift, displacement and base shear.
II. Methodology
To succeed the above objectives from the following step-by-step procedures
A thorough literature review to understand the seismic evaluation of building structures and application of Response spectrum analysis
Selecting a four and eight story RC building with 0%, 10%, 20%, and 30%diaphragm discontinuity and will be analyzed
as per Indian Standard for dead load, live load, and earthquake load.
In analysis, design of three-dimensional structures in seismic loadings, the diaphragms often assumed to be perfectly
rigid
Analyze the building using seismic analysis method such as Response spectrum in ETABS 2015.
Analyzedresults will arrive in conclusions.
ABOUT ETABS 2015 SOFTWARE
INTRODUCTION
ETABS 2015 abbreviated as extended three dimensional analysis building system program. A very useful software program matured by computers and structure and that is improved by engineer’s analysis and design ability for any civil structure. This
software powers stay in array of option and features the other part how easy to use it. User creates a model using grid lines,
structural property, object tools and in last detailing about the material. Dynamic property such as mass source, mode shape and

ISSN: 2455-2631 © June 2017 IJSDR | Volume 2, Issue 6
IJSDR1706056 International Journal of Scientific Development and Research (IJSDR) www.ijsdr.org 367
direction of modes can be specified and analysis can be performed based on graphical, numerical and in tabular form too. The
following steps define some important concept in analyzing using ETABS 2015
ANALYSIS OF GRAVITY AND LATERAL LOADS IN ETAB 2015
The model is started with grid lines and depending upon size of the structure. Defining each component of the structure such as
material, diaphragm etc. for further we apply the loads andapplying the loading to boundary condition
RESPONSE SPECTRUM ANALYSIS USING ETABS 2015 SOFTWARE
As per IS 1893: 2002 part I seismic zone and its soil type considered in the response spectrum responses using ETABS
2015. Loading and modal combination will be specified from some available options in the analysis. Response spectrums have
three directional local co ordinate systems that define excitation angles. According to code there is one sealing factor that defines
while inputting the response spectrum either in X and Y direction.
𝑆𝑒𝑎𝑙𝑖𝑛𝑔𝐹𝑎𝑐𝑡𝑜𝑟 = 1/2× 𝐼/𝑅 × 𝑔
If base shear Vb is lesser than the static analyzed base shear V. we should impact sealing factor which is equal to product
of scale factor i.e.,
𝑆𝑐𝑎𝑙𝑖𝑛𝑔𝐹𝑎𝑐𝑡𝑜𝑟 =1
2×
𝐼
𝑅× 𝑔 ×
𝑉
𝑉𝑏
III. MODELING AND ANALYSIS
INTRODUCTION
In the present paper an action is made on the seismic behavior of the multistory building by using diaphragm and there
discontinuities. On the intention a regular four story and eight story building have analyzed and modeled by response spectrum
analysis using ETABS 2015.lateral load analysis as per the seismic code IS: 1893 (Part 1)-2002 is carried out for regular
building with rigid diaphragm by varying heights and even for the discontinuous diaphragm later an effort is made to study the
effect of seismic loads and comparative study between the response spectrum analysis for both X and Y direction.
DESCRIPTION OF BUILDING
Description of building
Type of structure : Multi-storey R C frame structure
Occupancy : Residential Building Number of stories : 5 (G+4) and 9(G+8)
Ground storey height : 3.0m
Intermediate floor height : 3.0m
Type of Soil : medium soil
Site location : Chennai
Seismic zone : IV
Materials
M20-concrete
Fe-415 steel
Member dimensions
Column size : 230mm x 450mm and 230mm x 600mm (8 floor) Slab thickness : 150mm and 250mm (flat plate)
Beam Size : 230mm x 450mm
Wall thickness : 230mm
Live load
Live load on floor/roof : 3kN/m2
Floor finishing load : 1.5kN/m2
Wall load : 15kN/m
LOAD COMBINATIONS
The following load combinations are considered in the analysis and designed as per IS 1893 (Part 1)-2002.
Table 1 load combination table as per IS code
Load Combination Load Factors
Gravity analysis 1.5 (DL+LL)

ISSN: 2455-2631 © June 2017 IJSDR | Volume 2, Issue 6
IJSDR1706056 International Journal of Scientific Development and Research (IJSDR) www.ijsdr.org 368
Equivalent static analysis
1.2 (DL + LL ± EQX)
1.2 (DL + LL ± EQY)
1.5 (DL ± EQX)
1.5 (DL ± EQY)
0.9 DL ± 1.5EQX
0.9 DL ± 1.5EQY
Response spectrum analysis
1.2 (DL+ LL ± RSY)
1.2 (DL+ LL ± RSX)
1.5 (DL ± RSX)
1.5 (DL ± RSY)
Where, DL is Dead load and LL is Live load, EQX and EQY are Earthquake loads in the X and Y- directions, respectively, RSX
and RSY are Earthquake Spectrum in the X- and Y- directions, respectively.
Modeling is done for four story building with 0% and 10% diaphragm discontinuity as shown in the fig 1 and 2 in 3D model
Fig 1: 3D View for four Story Building with 0% Diaphragm Discontinuity
Fig 2: 3D View for Four Story Building with 10% Diaphragm Discontinuity
Modeling is done for four story building with 20% and 30% diaphragm discontinuity as shown in the fig 3 and 4 in 3D model

ISSN: 2455-2631 © June 2017 IJSDR | Volume 2, Issue 6
IJSDR1706056 International Journal of Scientific Development and Research (IJSDR) www.ijsdr.org 369
Fig 3: 3D View for Four Story Building with 20% Diaphragm Discontinuity
Fig 4: 3D View for Four Story Building with 30% Diaphragm Discontinuity
Modeling is done for four and eight story building with 0% and 10% diaphragm discontinuity as shown in the fig 5 and 6 with
plan
Fig 5: Plain view for Four and Eight Story Building with 0% Diaphragm Discontinuity
Fig 6:Plain view for Four and Eight Story Building with 10% Diaphragm Discontinuity
Modeling is done for four and eight story building with 20% and 30% diaphragm discontinuity as shown in the fig 7and 8 with
plan

ISSN: 2455-2631 © June 2017 IJSDR | Volume 2, Issue 6
IJSDR1706056 International Journal of Scientific Development and Research (IJSDR) www.ijsdr.org 370
Fig 7: Plain view for Four and Eight Story Building with 20% Diaphragm Discontinuity
Fig 8: Plain view for Four and Eight Story Building with 30% Diaphragm Discontinuity
Modeling is done for eight story building with 0% and 10% diaphragm discontinuity as shown in the fig 9 and 10 in 3D model.
Fig 9: 3D View for Eight Story Building with 0% Diaphragm Discontinuity
Fig 10: 3D View for Eight Story Building with 10% Diaphragm Discontinuity
Modeling is done for eight story building with 20% and 30% diaphragm discontinuity as shown in the fig 11 and 12 in 3D model
Fig 11: 3D View for Eight Story Building with 20% Diaphragm Discontinuity
ISSN: 2455-2631 © June 2017 IJSDR | Volume 2, Issue 6
IJSDR1706056 International Journal of Scientific Development and Research (IJSDR) www.ijsdr.org 371
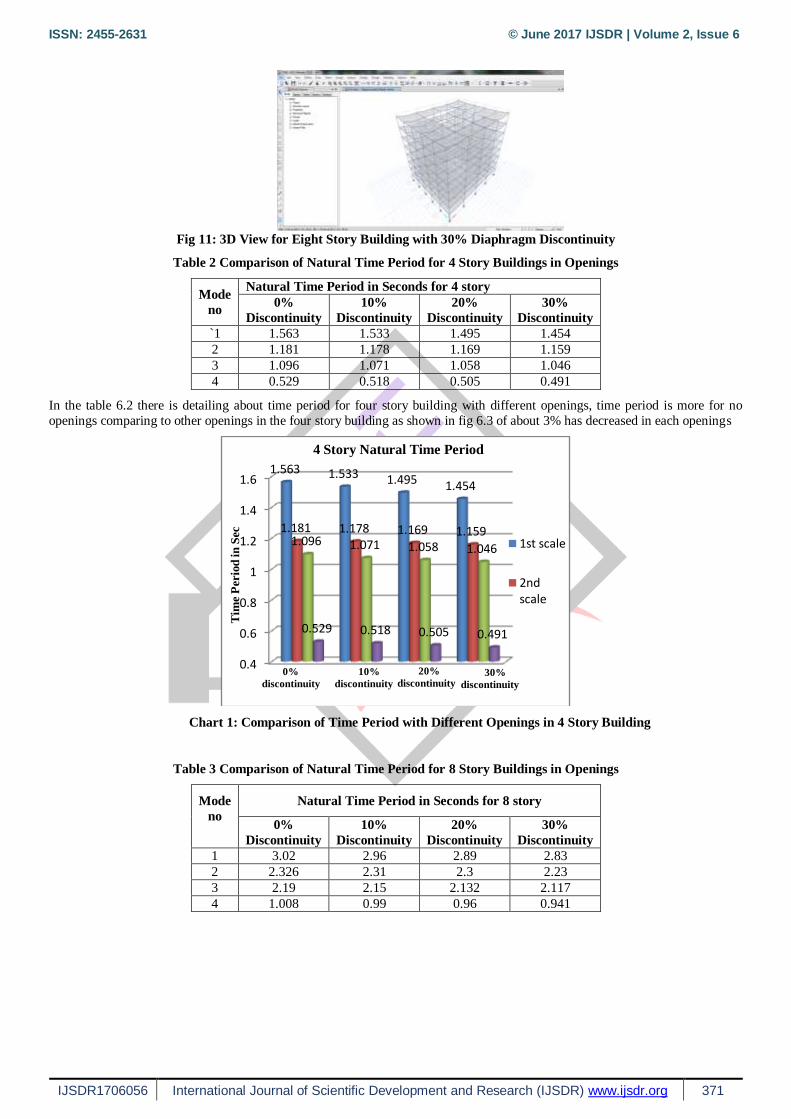
Fig 11: 3D View for Eight Story Building with 30% Diaphragm Discontinuity
Table 2 Comparison of Natural Time Period for 4 Story Buildings in Openings
Mode
no
Natural Time Period in Seconds for 4 story
0%
Discontinuity
10%
Discontinuity
20%
Discontinuity
30%
Discontinuity
`1 1.563 1.533 1.495 1.454
2 1.181 1.178 1.169 1.159
3 1.096 1.071 1.058 1.046
4 0.529 0.518 0.505 0.491
In the table 6.2 there is detailing about time period for four story building with different openings, time period is more for no
openings comparing to other openings in the four story building as shown in fig 6.3 of about 3% has decreased in each openings
Chart 1: Comparison of Time Period with Different Openings in 4 Story Building
Table 3 Comparison of Natural Time Period for 8 Story Buildings in Openings
Mode
no
Natural Time Period in Seconds for 8 story
0%
Discontinuity
10%
Discontinuity
20%
Discontinuity
30%
Discontinuity
1 3.02 2.96 2.89 2.83
2 2.326 2.31 2.3 2.23
3 2.19 2.15 2.132 2.117
4 1.008 0.99 0.96 0.941
0.4
0.6
0.8
1
1.2
1.4
1.61.563 1.533 1.495 1.454
1.181 1.178 1.169 1.1591.096 1.071 1.058 1.046
0.529 0.518 0.505 0.491
1st scale
2nd scale
4 Story Natural Time Period
0%
discontinuity
10%
discontinuity
20%
discontinuity30%
discontinuity
Tim
eP
erio
d in
Sec

ISSN: 2455-2631 © June 2017 IJSDR | Volume 2, Issue 6
IJSDR1706056 International Journal of Scientific Development and Research (IJSDR) www.ijsdr.org 372
Chart 2:Comparison of Time Period with Different Openings in 4 Story Building
MAXIMUM STORY DISPLACEMENT
In the opening like 20% discontinuity deflected more of about 4.1% increased than other openings it is because of eccentricity
loading in X direction as shown in table 6.14 fig 6.36 and 6.37.
Table 4 Comparison of Maximum Story Displacement 4 Story with Discontinuities
Natural Time Period in Seconds for 8 story
Elevati
on in
M
0%
Discon
tinuity
10%
Discon
tinuity
20%
Discon
tinuity
30%
Discontinu
ity
12 19.1 18.7 19.8 18.2
9 16.1 15.8 16.7 15.3
6 11.1 10.9 11.5 10.5
3 4.8 4.7 4.9 4.5
0 0 0 0 0
Chart 3: Maximum 4 Story Displacement in X Path with comparison in Different Discontinuity
In four story building the Y direction displacement is decreased of about 3% in top story in all other openings as shown in table
6.15 fig 6.38 and 6.39
0
0.5
1
1.5
2
2.5
3
3.53.02 2.96 2.89 2.83
2.326 2.31 2.3 2.232.19 2.15 2.132 2.117
1.008 0.99 0.96 0.941
1st scale
2nd scale
3rd scale
4th scale
8 Story Time Period
0%
discontinuity
10%
discontinuity
20%
discontinuity
30%
discontinuity
Tim
eP
erio
d i
n S
ec
0
2
4
6
8
10
12
14
0 5 10 15 20
0%
discontinuity
10%
discontinuity
20%
discontinuity
30%
discontinuity
Ele
vati
on
in m
Displacement in mm
Maximum story displacement For 4 Story

ISSN: 2455-2631 © June 2017 IJSDR | Volume 2, Issue 6
IJSDR1706056 International Journal of Scientific Development and Research (IJSDR) www.ijsdr.org 373
Table 5 Comparison of Maximum 4 Story Displacement for 4 Story with discontinuities
Maximum Story Displacement in Y Direction For Different
Discontinuities
Elevation
in M
0%
Discontinuity
10%
Discontinuity
20%
Discontinuity
30%
Discontinuity
12 26.9 26.4 25.7 25
9 23.3 22.8 22.3 21.6
6 17 16.7 16.3 15.8
3 8.6 8.4 8.2 7.9
0 0 0 0 0
Chart 4: Comparison for Maximum 4 Story Displacement in Response Y
In the opening like 20% discontinuity deflected more of about 7.1% increased for top story than other openings in same top story
it is because of eccentricity loading in X direction as shown in table 6.16 fig 6.40 and 6.41
Table 6 Comparison of Maximum Story Displacement for 8 Story with discontinuities in X Direction
Maximum Story Displacement in X Direction For Different
Discontinuities
Elevation
in M
0%
Discontinuity
10%
Discontinuity
20%
Discontinuity
30%
Discontinuity
24 38.9 38.1 40.9 37.7
21 37.1 36.4 38.9 35.8
18 34.1 33.4 35.7 32.8
15 29.9 29.3 31.3 28.7
12 24.9 24.4 26 23.8
9 18.9 18.5 19.7 18
6 12.2 11.9 12.6 11.5
3 5 4.9 5.1 4.6
0 0 0 0 0
0
2
4
6
8
10
12
14
0 10 20 30
0%
discontinuit
y
10%
discontinuit
y
20%
discontinuit
y
30%
discontinuit
y
Displacement in mm
Ele
vati
on
in m
Maximum story displacement For 4 Story

ISSN: 2455-2631 © June 2017 IJSDR | Volume 2, Issue 6
IJSDR1706056 International Journal of Scientific Development and Research (IJSDR) www.ijsdr.org 374
Chart 5: Similarity of Maximum Story Displacement for Response Y
In eight story building the Y direction displacement is decreased of about 2.3% in top story in all other openings as shown in table
6.17 fig 6.42 and 6.43
Table 7 Comparison of Maximum Story Displacement for 8 Story with discontinuities in Y Direction
Maximum Story Displacement in Y Direction For Different
Discontinuities
Elevation
in M
0%
Discontinuity
10%
Discontinuity
20%
Discontinuity
30%
Discontinuity
24 52.9 52.1 51.1 49.9
21 50.6 49.8 48.9 47.7
18 46.7 45.9 45 43.9
15 41.4 40.7 39.8 38.8
12 34.9 34.2 33.5 32.6
9 27.2 26.7 26.1 25.4
6 18.4 18 17.6 17.2
3 8.8 8.6 8.4 8.1
0 0 0 0 0
Chart 6: Similarity of Maximum 8 Story Displacement in Response y
0
5
10
15
20
25
30
0 5 10 15 20 25 30 35 40 45
0% discontinuity
10% discontinuity
20% discontinuity
Displacement in mm
Ele
vati
on
in m
Maximum story displacement For 8 Story
0
5
10
15
20
25
30
0 5 10 15 20 25 30 35 40 45 50 55
0% discontinuity
10% discontinuity
20% discontinuity
30% discontinuity
Ele
vati
on
in m
Displacement in mm
Maximum story displacement For 8 Story

ISSN: 2455-2631 © June 2017 IJSDR | Volume 2, Issue 6
IJSDR1706056 International Journal of Scientific Development and Research (IJSDR) www.ijsdr.org 375
MAXIMUM STORY DRIFT
In the opening like 20% discontinuity deflected more of about 7.9% increased than other openings in four stories building it is
because of eccentricity loading in X direction as shown in table 6.24 figs 6.58 and 6.59
Table 8 Comparison of Story Drift for Different Discontinuity in X
Optimum Story Drift in X Direction For Different Discontinuities
Elevation
in M
0%
Discontinuity
10%
Discontinuity
20%
Discontinuity
30%
Discontinuity
12 0.001066 0.001043 0.001114 0.001039
9 0.001722 0.001688 0.001796 0.001663
6 0.002123 0.002079 0.002205 0.002029
3 0.001602 0.001561 0.00164 0.001485
0 0 0 0 0
Chart 7:Comparison of Optimum Story Drift for 4 Story in Directory X
In four story building the Y direction displacement is decreased of about 3% in all other openings as shown in table 6.25 fig 6.60
and 6.61
Table 9 Comparison of Maximum Story Drift for Different Discontinuity in Y
Maximum Story Drift in Y Direction For Different Discontinuities
Elevation
in M
0%
Discontinuity
10%
Discontinuity
20%
Discontinuity
30%
Discontinuity
12 0.001444 0.001413 0.001371 0.001324
9 0.002292 0.002251 0.002193 0.002127
6 0.002847 0.0028 0.002734 0.002657
3 0.002875 0.002803 0.002726 0.002638
0 0 0 0 0
0
2
4
6
8
10
12
14
0 0.001 0.002 0.003
0%
discontinuity
10%
discontinuity
20%
discontinuity
30%
discontinuity
Drift in mm
Ele
vati
on
in m
Maximum Story Drift For 4 Story in X Direction

ISSN: 2455-2631 © June 2017 IJSDR | Volume 2, Issue 6
IJSDR1706056 International Journal of Scientific Development and Research (IJSDR) www.ijsdr.org 376
Chart 8:Similarity of Optimum Story Drift for 4 Story in Directory Y
In the opening like 20% discontinuity deflected more of about 8.5% increased than other openings in eight stories buildings it is
because of eccentricity loading in X direction as shown in table 6.26 figs 6.62 and 6.63
Table 10 Comparison of Optimum Story Drift for Different Discontinuity in X Direction for 8 Story
Story Drift in X Direction For Different Discontinuities
Elevation
in M
0%
Discontinuity
10%
Discontinuity
20%
Discontinuity
30%
Discontinuity
24 0.000746 0.000735 0.000805 0.000767
21 0.001254 0.001233 0.001333 0.001249
18 0.001624 0.001595 0.001716 0.001597
15 0.001864 0.001828 0.001963 0.001819
12 0.002066 0.002026 0.002171 0.002004
9 0.002282 0.002236 0.002391 0.0022
6 0.002391 0.00234 0.002493 0.00228
3 0.001666 0.001624 0.001715 0.001542
0 0 0 0 0
Chart 9:Similarity of Optimum Story Drift for 4 Story in Response X with Discontinuity
0
2
4
6
8
10
12
14
-0.00057E-180.00050.0010.00150.0020.00250.003
0%
discontin
uity10%
discontin
uity20%
discontin
uity30%
discontin
uity
Drift in mm
Ele
vati
on
in m
Maximum Story Drift For 4 Story in Y Direction
0
5
10
15
20
25
30
-0.00057E-180.00050.0010.00150.0020.00250.003
0%
disconti
nuity10%
disconti
nuity20%
disconti
nuity30%
disconti
nuity
Drift in mm
Ele
vati
on
in m
Maximum Story Drift For 8 Story

ISSN: 2455-2631 © June 2017 IJSDR | Volume 2, Issue 6
IJSDR1706056 International Journal of Scientific Development and Research (IJSDR) www.ijsdr.org 377
In four story building the Y direction displacement is decreased of about 2.5% in all other openings as shown in table 6.27 fig
6.64 and 6.65
Table 11 Optimum Story Drift for Different Discontinuity in Y Direction for 8 Story
Optimum Story Drift in Y Direction For Different Discontinuities
Elevation
in M
0%
Discontinuity
10%
Discontinuity
20%
Discontinuity
30%
Discontinuity
24 0.000911 0.00091 0.000904 0.000894
21 0.001602 0.001589 0.001568 0.00154
18 0.002096 0.002072 0.002039 0.001998
15 0.002418 0.002386 0.002344 0.002292
12 0.002679 0.002639 0.002589 0.002528
9 0.002961 0.002913 0.002854 0.002784
6 0.003222 0.003165 0.003098 0.003018
3 0.002926 0.002853 0.002785 0.002706
0 0 0 0 0
Chart 10: Similarity of Highest Story Drift for 8 Story in Response Y with Discontinuity
STORY BASE SHEARS
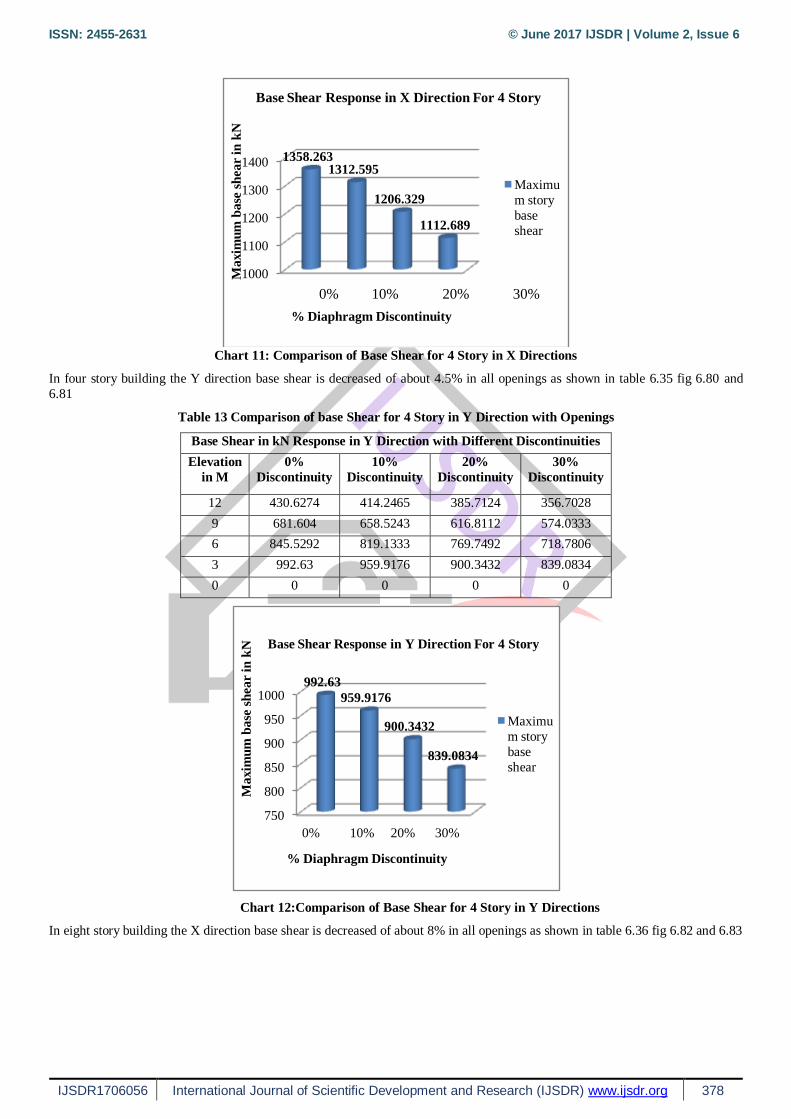
In four story building the X direction base shear is decreased of about 7.8% in all openings as shown in table 6.34 fig 6.78 and
6.79
Table 12 Comparison of base Shear for 4 Story in X Direction with Openings
Base Shear in kN Response in X Direction with Different Discontinuities
Elevation
in M
0%
Discontinuity
10%
Discontinuity
20%
Discontinuity
30%
Discontinuity
12 568.837 547.811 503.947 465.142
9 939.190 907.713 835.043 771.021
6 1198.147 1159.275 1066.489 984.828
3 1358.263 1312.595 1206.329 1112.689
0 0 0 0 0
0
5
10
15
20
25
30
-0.00052E-170.00050.0010.00150.0020.00250.0030.0035
0%
discontinu
ity10%
discontinu
ity20%
discontinu
ity30%
discontinu
ity
Drift in mm
Ele
vati
on
in m
Maximum Story Drift For 8 Story
ISSN: 2455-2631 © June 2017 IJSDR | Volume 2, Issue 6
IJSDR1706056 International Journal of Scientific Development and Research (IJSDR) www.ijsdr.org 378
Chart 11: Comparison of Base Shear for 4 Story in X Directions
In four story building the Y direction base shear is decreased of about 4.5% in all openings as shown in table 6.35 fig 6.80 and
6.81
Table 13 Comparison of base Shear for 4 Story in Y Direction with Openings
Base Shear in kN Response in Y Direction with Different Discontinuities
Elevation
in M
0%
Discontinuity
10%
Discontinuity
20%
Discontinuity
30%
Discontinuity
12 430.6274 414.2465 385.7124 356.7028
9 681.604 658.5243 616.8112 574.0333
6 845.5292 819.1333 769.7492 718.7806
3 992.63 959.9176 900.3432 839.0834
0 0 0 0 0
Chart 12:Comparison of Base Shear for 4 Story in Y Directions
In eight story building the X direction base shear is decreased of about 8% in all openings as shown in table 6.36 fig 6.82 and 6.83
1000
1100
1200
1300
1400 1358.2631312.595
1206.329
1112.689
Maximu
m story
base
shear
0% 10% 20% 30%
Maxim
um
base
sh
ear in
kN
Base Shear Response in X Direction For 4 Story
% Diaphragm Discontinuity
750
800
850
900
950
1000992.63
959.9176
900.3432
839.0834
Maximu
m story
base
shear
0% 10% 20% 30%
Ma
xim
um
ba
se s
hea
r in
kN Base Shear Response in Y Direction For 4 Story
% Diaphragm Discontinuity

ISSN: 2455-2631 © June 2017 IJSDR | Volume 2, Issue 6
IJSDR1706056 International Journal of Scientific Development and Research (IJSDR) www.ijsdr.org 379
Table 14 Comparison of base Shear for 8 Story in X Direction with Openings
Base Shear in kN Response in X Direction with Different Discontinuities
Elevation
in M
0%
Discontinuity
10%
Discontinuity
20%
Discontinuity
30%
Discontinuity
24 357.781 346.662 319.647 296.266
21 649.650 629.207 579.013 535.461
18 843.372 816.081 749.208 691.095
15 961.913 929.822 851.865 784.112
12 1065.336 1029.229 942.194 866.631
9 1191.126 1150.937 1054.121 970.151
6 1311.948 1268.081 1162.008 1070.031
3 1373.347 1327.509 1216.397 1120.041
0 0.000 0.000 0.000 0.000
Chart 13:Comparison of Base Shear for 8 Story in X Directions
In eight story building the Y direction base shear is decreased of about 6.4% in all openings as shown in table 6.34 fig 6.84 and
6.85
Table 15 Comparison of base Shear for 8 Story in Y Direction with Openings
Base Shear in kN Response in Y Direction with Different Discontinuities
Elevation
in M
0%
Discontinuity
10%
Discontinuity
20%
Discontinuity
30%
Discontinuity
24 245.878 238.268 224.753 210.726
21 453.395 439.067 413.982 387.984
18 599.021 579.525 545.997 511.295
15 693.845 670.669 631.390 590.787
12 772.423 746.319 702.325 656.878
9 860.452 831.476 782.512 731.933
6 947.156 915.450 861.744 806.251
3 998.642 965.156 908.633 850.221
0 0.000 0.000 0.000 0.000
1000
1100
1200
1300
14001373.347
1327.509
1216.397
1120.041
Maximu
m story
base
shear
0% 10% 20% 30%
Ma
xim
um
ba
se s
hea
r in
kN
Base Shear Response in X Direction for 8 story
% Diaphragm Discontinuity

ISSN: 2455-2631 © June 2017 IJSDR | Volume 2, Issue 6
IJSDR1706056 International Journal of Scientific Development and Research (IJSDR) www.ijsdr.org 380
Chart 14: Comparison of Base Shear for 8 Story in Y Directions
IV. CONCLUSION
Results procured from the response spectrum method of analysis has got preceding values in both eight and for four story
building
Natural time period is getting decreased as the percentage of openings
Maximum displacement for four and eight story building shown lesser displacement value in stiffness diaphragm
compared to no diaphragm and with all types of openings, 20% opening deflected more compared with other condition
and this is due to eccentricity loading in X direction where as in Y direction openings there is a gradual decrease in displacement of about 3%
Maximum drift for four and eight story building shown lesser drift value in stiffness diaphragm compared to no
diaphragm, 20% opening deflected more compared to other because of eccentricity loading in X direction where as in Y
direction openings there is a gradual decrease in drift of about 2.5%
In four and eight story building with stiffness diaphragm shown more story shear in response X and Y direction.
Building with 20% opening shows decreasing story shear value of about 7.8% in response X and 4.5% in response Y, in
flat plate the values are decreasing in nature.
These all results shows building with stiffness diaphragm are better to use in all multi story building for those areas
which are prone to earthquake. 20% of opening is a better one when compared other condition.
Optimum percentage 20% o opening or Discontinuity of stiffness diaphragm can be used in the seismic prone RC
multistory building, even the number of story height increases the same comparison results of 20% openings can be utilized
Discontinuity in diaphragm shows that optimum percentageof openings will with stand the seismic forces in earthquake
areas
Scope of the Future Study
The same data of four and eight story building can be analyzed in non linear method of analysis.
20% openings can be used in the different higher story buildings so that it decreases the seismic forces in any earthquake
affected areas
Openings in the RC buildings will control the seismic forces, more the openings lesser will be displacement, time period.
REFERENCE
[1] Suresh Chowdary, K., (2014) “Effect of Diaphragm Discontinuity in The Seismic Response of Multistoried Building”
[2] Arvind Reddy, and Fernandes, R. J., (2015) “Seismic Analysis of RC Regular and Irregular Frame Structure”, IRJET. Vol.02, pp.2395-0072
[3] Osama Maniar, and Roshini John, J., (2015) “Effects of Diaphragm Discontinuity on Seismic Response of Multistoried
Building”, IJETAE, Vol.5, ISSN.2250-245
[4] Mohana, H. S., and Kavan, M. R., (2015) “Compartive Study of Flat Slb and Conventionl Slab Structure Using Etabs for
Different Earthquake Zones in India” IRJET. Vol.02, pp.2395-0072
[5] Pathak, S.A., and Charney, (2008) “Effect Of Diaphragm Flexibility on The Seismic Performance of Light Frame Wood
Structures”, 14th world conference on earthquake engineering
[6] Devarshi, S.A., and Dr.Tande, S.N., “Diaphragm Flexibility In Buildings With Shear Walls”, IJETAE, Vol.4,
ISSN.2278-621
[7] LapronAkhir, “Lateral Forces In Diaphragm” world conference
800
850
900
950
1000
998.641
965.156
908.632
850.221
Maximu
m story
base
shear
0% 10% 20% 30%
% Diaphragm Discontinuity
Maxim
um
base
sh
ear
in k
N
Base Shear Response in Y Direction For 4 Story

ISSN: 2455-2631 © June 2017 IJSDR | Volume 2, Issue 6
IJSDR1706056 International Journal of Scientific Development and Research (IJSDR) www.ijsdr.org 381
[8] Vinod Kumar, P. P., “Effect of Diaphragm Openings In Multi Storied RC Building Using Pushover Analysis”, IRJET,
Vol.2, PP.2395-0072
[9] More, R. S., and Sawant, V. S., (2013) “Analysis Of Flat Slab”, IJSR, ISSN.2319-7064
[10] Raj KiranNanduri P.M.B, and Dr. Swami., B.L.P., “ Comparative Study of Wind Analysis of Flat Plate In Multi Storied
Frames With And Without Infill’s Walls”, IJEATE, Vol.2, ISSn.2250-2459
Recommended