Presented to:
By:
Rutgers Advisors:
Date:
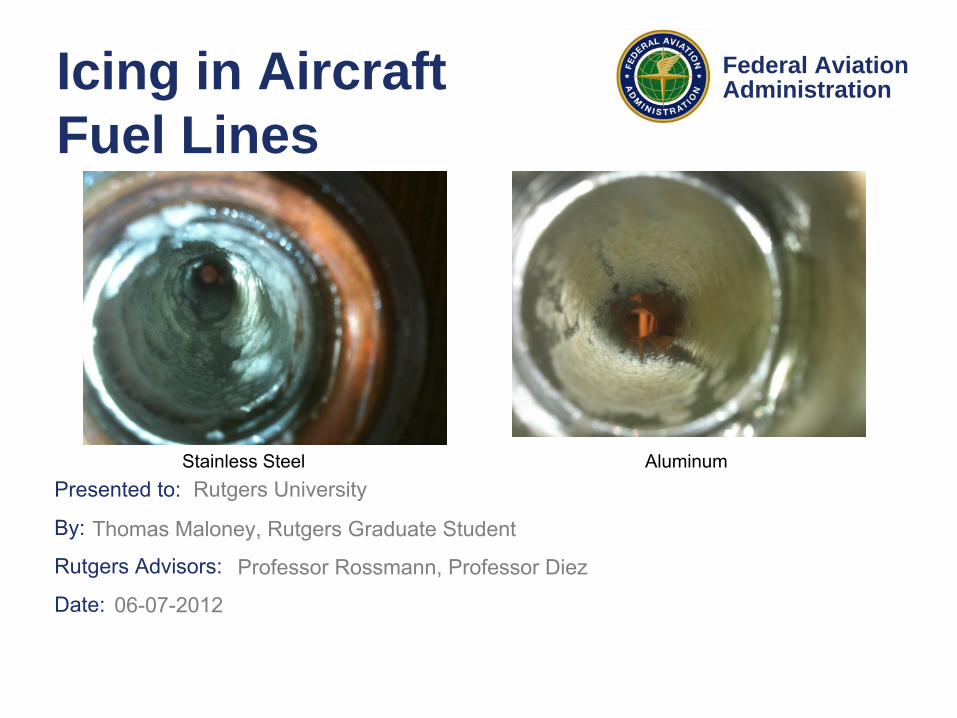
Federal AviationAdministrationIcing in Aircraft
Fuel Lines
Rutgers University
Thomas Maloney, Rutgers Graduate Student
06-07-2012
Professor Rossmann, Professor Diez
AluminumStainless Steel
2Federal AviationAdministration
Icing in Aircraft Fuel Lines02-23-12
Introduction
•
This thesis is to partially fulfill the requirements for a M.S. degree in mechanical and aerospace engineering at Rutgers University
•
The purpose is to understand ice accumulation in jet fuel such as that which caused flight accidents.
2

3Federal AviationAdministration
Icing in Aircraft Fuel Lines02-23-12
Background
•
A330 engine rollback (2009)•
Boeing 777 accident (2008) –
Blockage of the FOHE from ice.
•
Boeing 777 engine rollback (2008)•
B52 accident (1958)–
Fuel pump screen clogged with ice.
–
Over 200 previous “cause unknown”
accidents later attributed to fuel icing.
–
Fuel Heaters and Icing Inhibitors were introduced
3
[2]
[2]
[3]
4Federal AviationAdministration
Icing in Aircraft Fuel Lines02-23-12
4
Objective
•
Perform experiments to better understand the collection of ice in fuel pipes.–
Material Dependence•
How does the type of material effect ice accumulation?•
How does the roughness of pipe material effect ice accumulation?–
Temperature Effects•
Is there a preferred temperature for ice accumulation?–
Effects of Flow Rate and Flow Structure•
How does turbulence such as from a defined region of recirculation effect ice accumulation?
•
What is the effect of a Reynolds Number variation on ice accumulation?
–
Heat Transfer Effects•
If there is a greater heat transfer from the fuel pipe, will ice
accumulation be greater?

5Federal AviationAdministration
Icing in Aircraft Fuel Lines02-23-12
5
Experimental Setup (Altitude Chamber)•
Temperature Potential: -51.1C•
Pressure Potential: 2.73psi (40,000ft)•
Humidity Control•
Current fuel storage within the chamber: 115 gal.
Altitude Chamber

6Federal AviationAdministration
Icing in Aircraft Fuel Lines02-23-12
6
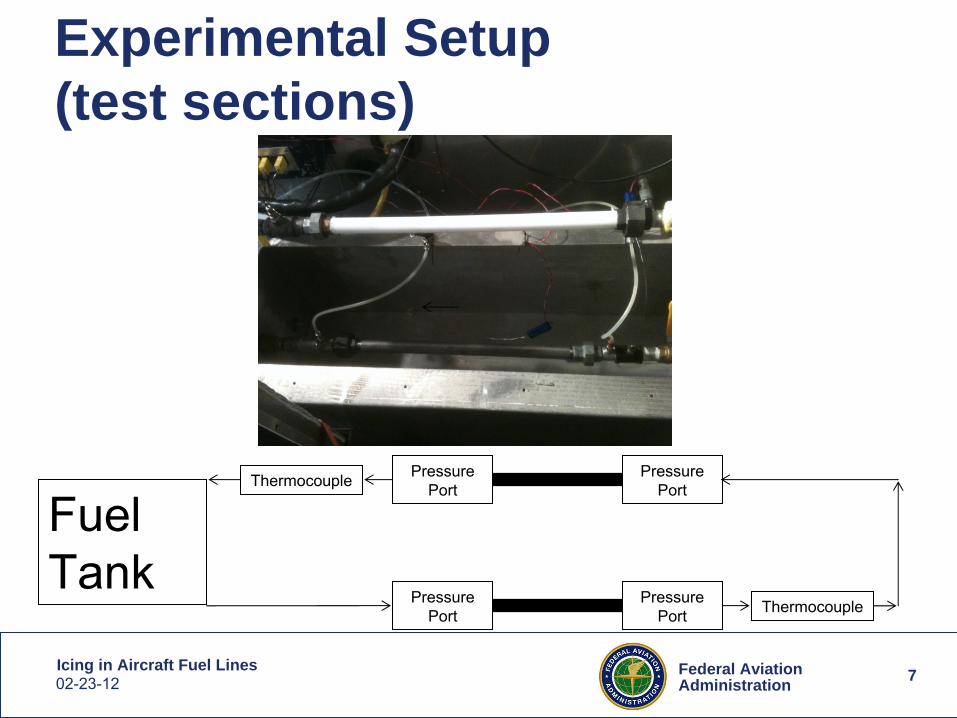
Experimental Setup (test sections)•
Test sections–
Each test pipe was fitted with ports for differential pressure measurement.
–
Each pipe had a type T thermocouple port downstream of the test area.
–
Each test pipe was easily removable for visual observation and ice quantity measurement.
7Federal AviationAdministration
Icing in Aircraft Fuel Lines02-23-12
Experimental Setup (test sections)
7
Pressure Port
Pressure Port
Pressure Port
Pressure Port Thermocouple
Thermocouple
Fuel Tank
8Federal AviationAdministration
Icing in Aircraft Fuel Lines02-23-12
Experimental Setup (Fuel Preparation)•
Jet A-1 fuel was saturated at about 21.5 Celsius with approximately 25mL of free water in a tray at the bottom of the fuel tank.
•
The fuel was filtered for particles and water prior to each test.
8

9Federal AviationAdministration
Icing in Aircraft Fuel Lines02-23-12
Experimental Setup (Data Processing)•
In later quantitative tests, pressure was normalized by a theoretical pressure drop that would exist without any ice accumulation.
•
Heat transfer was determined by a heat conduction analysis.•
The fuel temperature in the test pipe represented the inner pipe
wall temperature.•
A thermocouple was “zip-tied”
onto the outside of the pipe to determine the outside wall temperature.
9
10Federal AviationAdministration
Icing in Aircraft Fuel Lines02-23-12
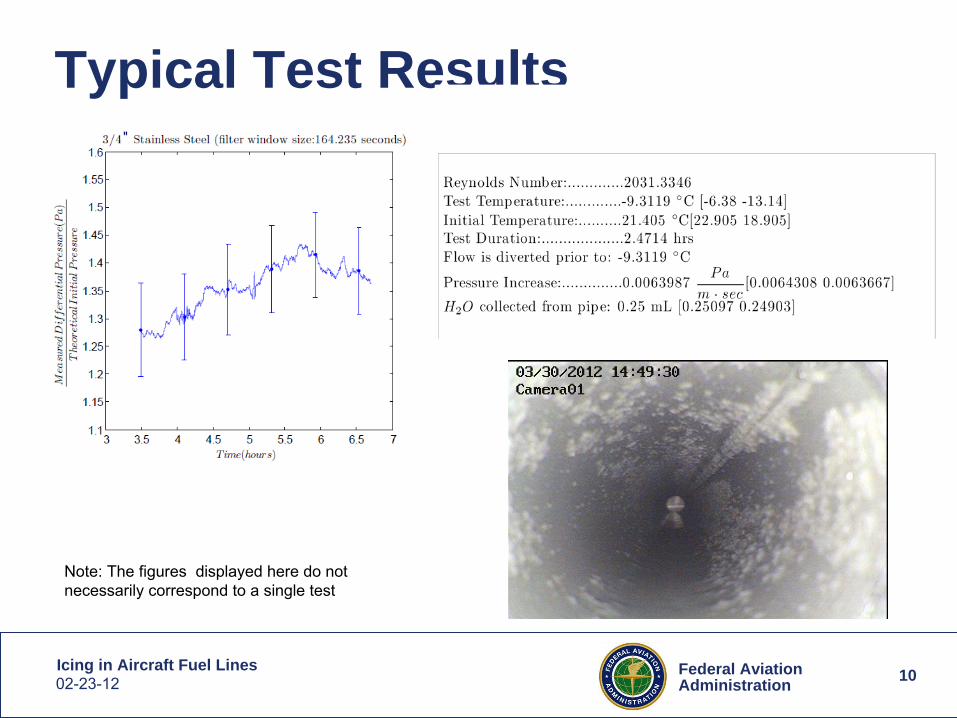
Typical Test Results
10
Note: The figures displayed here do not necessarily correspond to a single test

11Federal AviationAdministration
Icing in Aircraft Fuel Lines02-23-12
Initial conditions variation
•
Initial conditions in the test pipe –
Fuel flowed through the test pipe as the fuel cooled to the test temperature.
–
Air was present in the test pipe as the fuel cooled to the test temperature.
–
Stationary fuel was present in the test pipe as the fuel cooled to the test temperature. (in this case there was a small air gap in the pipe also.)
–
Air was present in the test pipe except for a defined region which was sprayed with water
11

12Federal AviationAdministration
Icing in Aircraft Fuel Lines02-23-12
Results of initial conditions variation
•
Fuel flow through the test pipe as the fuel cooled to the test temperature.
12

13Federal AviationAdministration
Icing in Aircraft Fuel Lines02-23-12
Results of initial conditions variation
–
Air in the test pipe as the fuel cooled to the test temperature.
13
A noticeable amount of ice but less than the previous condition.

14Federal AviationAdministration
Icing in Aircraft Fuel Lines02-23-12
Results of initial conditions variation
–
Stationary fuel in the test pipe as the fuel cooled to the test temperature. (in this case there was a small air gap in the pipe also.)
14
Ice along the top of the pipe where air was trapped

15Federal AviationAdministration
Icing in Aircraft Fuel Lines02-23-12
Results of initial conditions variation
–
Air in test pipe except for a defined region that was sprayed with water
15
Before AfterNote: A clear image of the other side of the pipe was not taken after the test where water was not sprayed but it had a lack of ice accumulation
16Federal AviationAdministration
Icing in Aircraft Fuel Lines02-23-12
Conclusion for initial conditions variation
–
The softer ice may stick to the pipe material but it stuck to hard ice substantially more.
–
The case that fuel flowed continually through the flow loop as the fuel cooled was chosen for further quantitative tests.
16

17Federal AviationAdministration
Icing in Aircraft Fuel Lines02-23-12
Pipe configuration Variation
•
Material variation –
6061 T6 Aluminum
–
6061 Aluminum that has been scratched with 80 grit sand paper.
–
Type 304 Stainless Steel–
PTFE Teflon
•
Geometry variation–
2 ½
inch diameter pipe bends
–
4 ½
inch diameter pipe bend–
50% area reduction step change
–
50% area increase step change
17
18Federal AviationAdministration
Icing in Aircraft Fuel Lines02-23-12
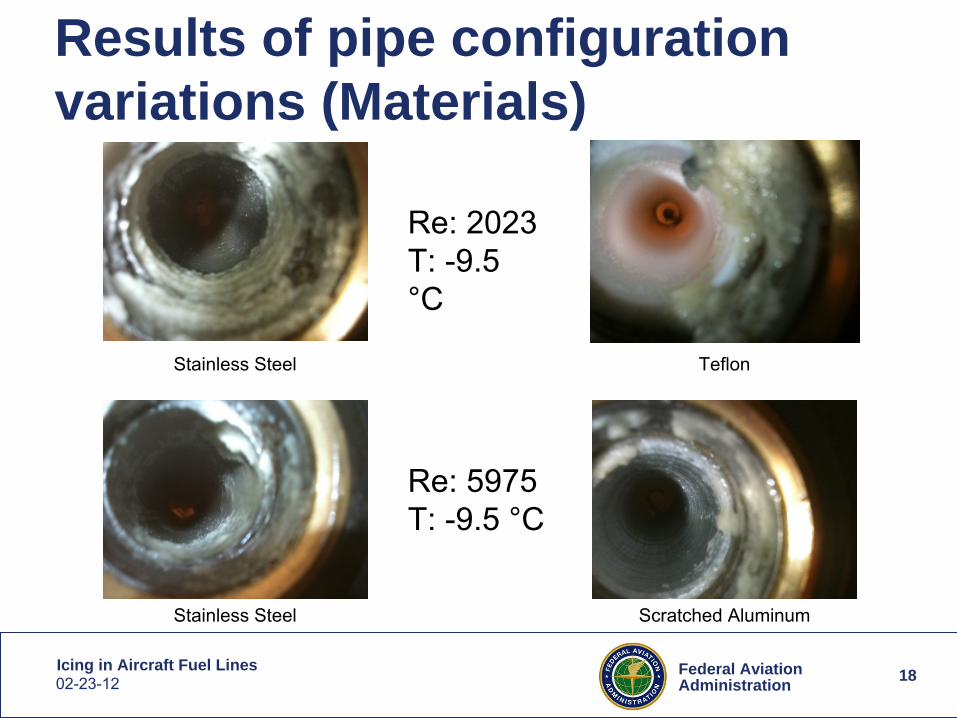
Results of pipe configuration variations (Materials)
18
Stainless Steel
Stainless Steel
Scratched Aluminum
Teflon
Re: 2023 T: -9.5 °C
Re: 5975T: -9.5 °C

19Federal AviationAdministration
Icing in Aircraft Fuel Lines02-23-12
Results of pipe configuration variations (Geometry)
19
Downstream of ≈
4 ½ inch radius pipe bend.
Downstream of ≈
2 ½ inch radius pipe
bend.Note: These images illustrate what happened immediately downstream of the pipe bends but conditions farther downstream could be affected also. These bends were also tested in series and can therefore have synergistic effects with each other.

20Federal AviationAdministration
Icing in Aircraft Fuel Lines02-23-12
Results of pipe configuration variations (Geometry)
20
Downstream of ≈
50% area reduction
Downstream of ≈
50% area increase
Note: These images illustrate what happened immediately downstream of the area change but conditions farther downstream could be effected also. These bends were also tested in series and can therefore have synergistic effects with each other.

21Federal AviationAdministration
Icing in Aircraft Fuel Lines02-23-12
Conclusions for Pipe Configuration Variations
–
Materials with a greater adhesion force to water will collect more water and will therefore have a greater potential to collect soft ice.
–
Pipe geometry variations created a change in the flow structure but lacked a defined region of ice accumulation where an eddy might exist.
21

22Federal AviationAdministration
Icing in Aircraft Fuel Lines02-23-12
Test Conditions Variation
•
Repeatability–
Repeatability tests were done at a Reynolds number of 8362 and temperature of -11 °C
•
Variation of Reynolds Number–
≈3150 to ≈13000–
This Re regime covered the range that a commercial airliner may typically encounter.
•
Variation of Temperature–
≈
-7 °C to ≈
-20 °C–
Boeing attributed -5 °C to -20 °C to be the temperature range that had sticky ice. [2]
•
Variation of Heat Transfer from the Pipe–
Insulated pipe or not insulated pipe–
This variation was done because of what was unintentionally found in earlier tests.
22

23Federal AviationAdministration
Icing in Aircraft Fuel Lines02-23-12
Results of test condition variation (Repeatability)
23
Test 1 Test 2

24Federal AviationAdministration
Icing in Aircraft Fuel Lines02-23-12
Results of test condition variation (Repeatability)
24
Test 1 Test 2

25Federal AviationAdministration
Icing in Aircraft Fuel Lines02-23-12
Results of test condition variation (Reynolds Number)
25
Re:12922Re: 8362Re: 4000
Thicker ice
Thinner ice-11 °C

26Federal AviationAdministration
Icing in Aircraft Fuel Lines02-23-12
Results of test condition variation (Reynolds Number)
26

27Federal AviationAdministration
Icing in Aircraft Fuel Lines02-23-12
Results of test condition variation (Temperature)
27
-7.4 °C -11.24 °C -19.35 °C

28Federal AviationAdministration
Icing in Aircraft Fuel Lines02-23-12
Results of test condition variation (Temperature)
28

29Federal AviationAdministration
Icing in Aircraft Fuel Lines02-23-12
Results of test condition variation (Heat Transfer)
29
Un-Insulated Insulated

30Federal AviationAdministration
Icing in Aircraft Fuel Lines02-23-12
Results of test condition variation (Heat Transfer)
30
Un-Insulated Insulated

31Federal AviationAdministration
Icing in Aircraft Fuel Lines02-23-12
Results of test condition variation (Heat Transfer)
31
Un-Insulated Insulated
32Federal AviationAdministration
Icing in Aircraft Fuel Lines02-23-12
Conclusions for test condition variations
–
Repeatability was shown to exist visually with the pipe images and quantitatively with pressure increase.
–
Higher Re decreased total accumulation because of an increase in shear stress
–
The ice accumulated the most at -11 °C.–
A greater heat transfer from the pipe increased ice accumulation.
32
33Federal AviationAdministration
Icing in Aircraft Fuel Lines02-23-12
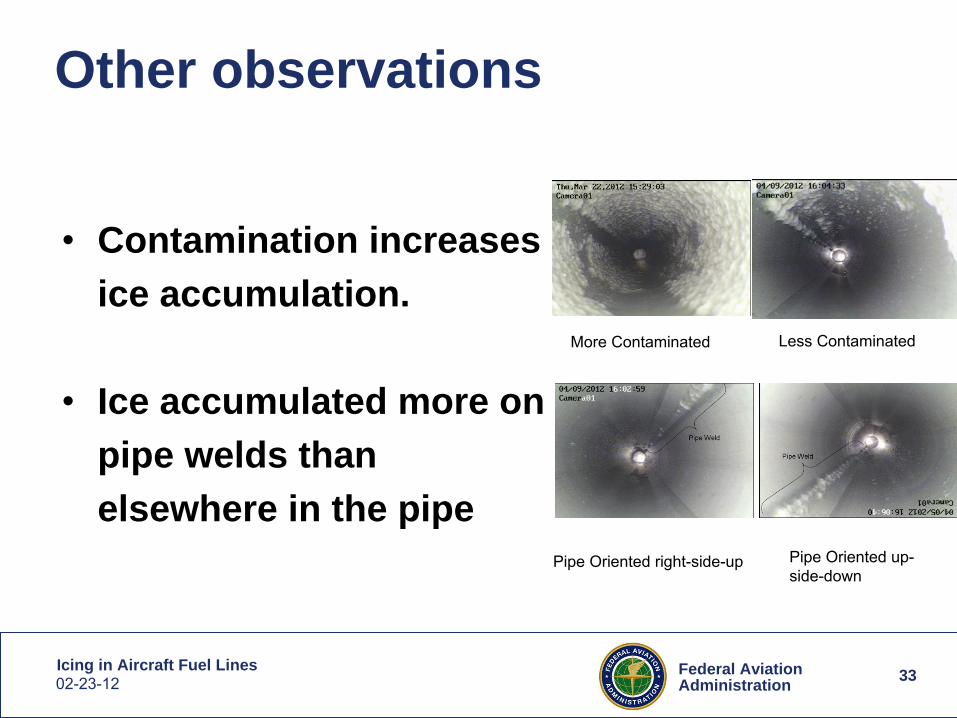
Other observations
•
Contamination increases ice accumulation.
•
Ice accumulated more on pipe welds than elsewhere in the pipe
33
Pipe Oriented right-side-up Pipe Oriented up-
side-down
More Contaminated Less Contaminated

34Federal AviationAdministration
Icing in Aircraft Fuel Lines02-23-12
Conclusions
•
Initial Conditions Variations–
The softer ice may stick to the pipe material surface but it stuck to hard ice substantially more.
•
Pipe Configuration Variations–
Materials with a greater adhesion force to water will therefore collect more water and have a greater potential to collect soft ice.
–
Pipe geometry variations lacked a defined region of ice accumulation immediately downstream.
•
Test Conditions Variation–
Higher Re decreased total accumulation because of an increase in shear stress.
–
The ice accumulated the most at -11 °C.–
A greater heat transfer from the pipe increased ice accumulation.
34

35Federal AviationAdministration
Icing in Aircraft Fuel Lines02-23-12
35
Questions?

36Federal AviationAdministration
Icing in Aircraft Fuel Lines02-23-12
Citations
•
[1] Lao, Liyun, David Hammond, Colin Ramshaw, and Hoi Yeung. Part 2 Ice Accretion. Rep. 2011. Print.
•
[2] Department for Transportation, Air Accident Investigations Branch. Report on the Accident to Boeing 777-236ER, G-YMMM, at London Heathrow Airport on 17 January 2008. Working paper. Crown, 2010. Print.
•
[3] Scotty, Leonard R. "Above and Beyond: Fire and Ice." History of Flight, Aviation, Space Exploration | AirSpaceMag.com. Web. 14 Nov. 2011. <http://www.airspacemag.com/military- aviation/Above--Beyond-Fire-and-Ice.html>.
36
Recommended