HLDI
Casualty Actuarial Society1999 Seminar on Ratemaking
Kim L. Hazelbaker Senior Vice President
Nashville, TN March 11-12, 1999

HLDI
HLDI

HLDI

HLDI

HLDI
Light Truck Sales By Model YearPercent of New Vehicle Sales
0%
10%
20%
30%
40%
50%
1908 1918 1928 1938 1948 1958 1968 1978 1988 1998
47.5%

HLDI
Percent of Passenger Vehicle Registrations By Vehicle Type, Weight, and Model Year
Vehicle type Weight(lb) 1975 1985 1995 1996 1997
Cars <2,500 12 28 15 13 12 2,500- 27 37 39 40 37 3,500+ 41 8 9 7 8
Passenger vans 0 2 8 8 6 Total 81 76 71 69 64
Pickups <3,500 1 12 4 5 5 3,500- 9 2 5 3 3 4,000+ 3 2 6 8 11 Total 13 16 16 16 19
Utility <3,500 1 4 2 2 3vehicles 3,500- 1 0 5 5 5
4,000+ 1 1 5 6 8 Total 2 5 11 13 15

HLDI
1998 Model Ford Passenger Vehicles
Escort 2,585 lbsExplorer 4,325 lbsExpedition 5,290 lbs
curb weight

HLDI
Metro 2,065 lbsBlazer 4,225 lbsSuburban 5,640 lbs
curb weight
1998 Model GM Passenger Vehicles

HLDI
1997 Ford Escort 1997 Ford Expedition

HLDI1997 Ford Escort
1997 Ford Expedition

HLDI
1997 Ford Escort 1997 Ford Expedition

HLDI
Ford Excursion - 2000 Model Year

HLDI
Ford Super Concept Truck

HLDI
0
100
200
300
400
<2500 2500- 3000- 3500- 4000- 4500- 5000+
cars/passenger vans
utility vehicles
pickups
vehicle weight (lb)
Occupant Death Rates 1990-95 Passenger VehiclesDeaths per Million Vehicles per Year
HLDI
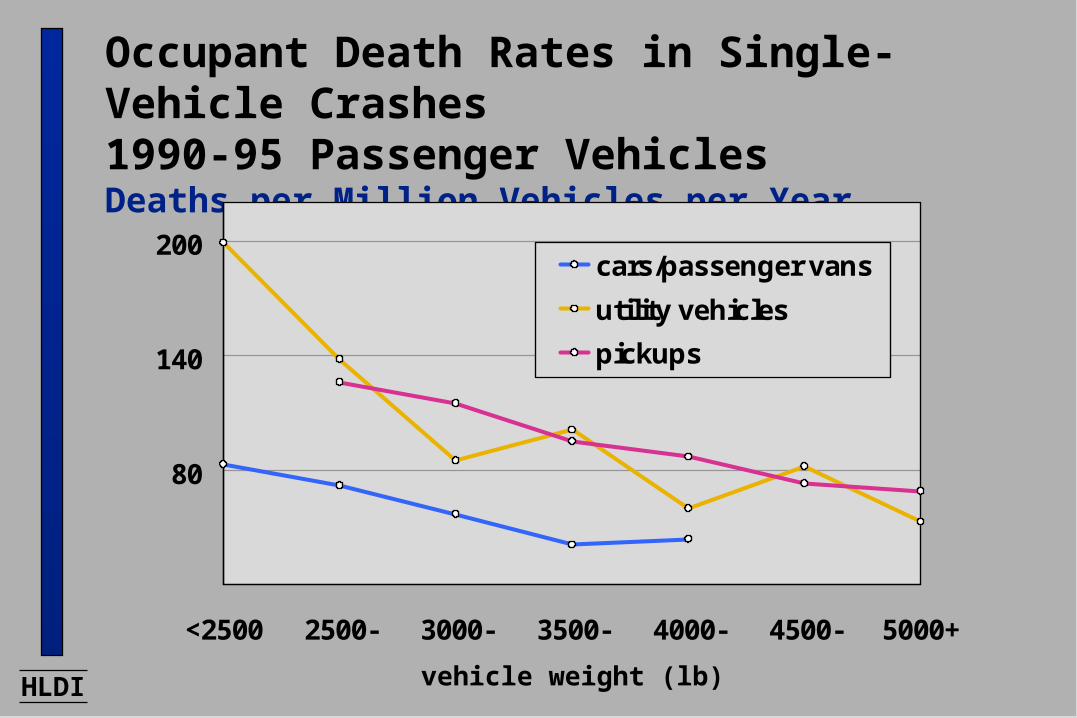
Occupant Death Rates in Single-Vehicle Crashes 1990-95 Passenger VehiclesDeaths per Million Vehicles per Year
20
80
140
200
<2500 2500- 3000- 3500- 4000- 4500- 5000+
cars/passenger vans
utility vehicles
pickups
vehicle weight (lb)

HLDI
Occupant Death Rates in Two-Vehicle Crashes 1990-95 Passenger VehiclesDeaths per Million Vehicles per Year
0
20
40
60
80
100
120
<2500 2500- 3000- 3500- 4000- 4500- 5000+
cars/passenger vans
utility vehicles
pickups
vehicle weight (lb)

HLDI
Occupant Death Rates in Other Vehicles inTwo-Vehicle Crashes, 1990-95 Passenger Vehicles Deaths per Million Vehicles per Year
0
40
80
120
160
200
<2500 2500- 3000- 3500- 4000- 4500- 5000+
cars/passenger vans
utility vehicles
pickups
vehicle weight (lb)

HLDI
Mix of Other Vehicles in Two-Vehicle Fatal Crashes 1990-95 Passenger Vehicles
<2500 2500- 3000- 3500+
deaths in carsOTHER
MEDIUM/HEAVYTRUCK
UTILITIES
CARS3500-
CARS2500-
CARS <2500
PICKUPS
<3000 3000- 3500- 4000+
vehicle weight (lb)
deaths in pickupsOTHER
MEDIUM/HEAVYTRUCK
UTILITIES
CARS3500-
CARS2500-
CARS <2500
PICKUPS
<3000 3000- 3500- 4000+
deaths in utility vehicles
OTHER
MEDIUM/HEAVYTRUCK
UTILITIES
CARS3500-
CARS2500-
CARS <2500
PICKUPS
100
80
60
40
20
100
80
60
40
20
100
80
60
40
20

HLDI
Characteristics That Influence Compatibility/Aggressivity in Crashes Between Two Passenger Vehicles
Weight Differences decrease risk in the heavier vehicles and increase risk in the lighter vehicles
Structural Mismatches contribute to override/underride
Stiffness Differences can decrease the risk if the heavier vehicles are less stiff than the lighter vehicles
High Performance is associated with increased crash severity

HLDI Crash compatibility

HLDI
Companies that Supply Data to HLDI
Aetna/Travelers
Allstate
American Family
Auto Club of Michigan
Farmers
GEICO
The Hartford
Kemper
Liberty Mutual
Mass. CAR
Motors
Nationwide
Progressive
Prudential
SAFECO
State Farm
USAA
HLDI
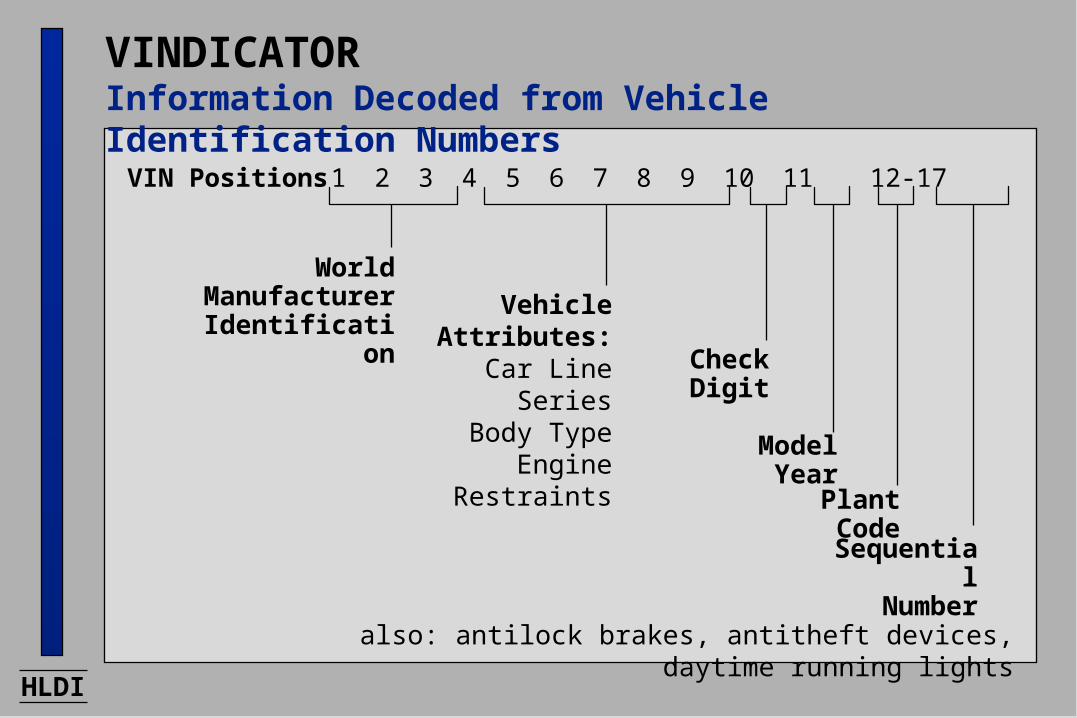
VINDICATORInformation Decoded from Vehicle Identification Numbers
VIN Positions 1 2 3 4 5 6 7 8 9 10 11 12-17
World ManufacturerIdentification
Vehicle Attributes:
Car LineSeries
Body TypeEngine
Restraints
Check Digit
Model Year
Plant Code
SequentialNumber
also: antilock brakes, antitheft devices, daytime running lights

HLDI
Size of HLDI DatabaseNumber of Vehicles in Files, December 1997
Model Year Number of Vehicles
1990 12,906,0891991 12,649,0431992 12,104,9871993 12,856,6151994 12,517,6611995 12,129,4751996 8,898,2631997 7,759,4901998 1,319,290
Total 93,139,913

HLDI
Collision Losses vs. Property Damage Losses1995-97 Models
Average LossPayment Per Insured
Vehicle YearAverage Loss
Payment Per Claim
collision propertydamage
Claim Frequency(claims per 100
insured vehicle years)
collision propertydamage
9.0
6.0
3.0
collision propertydamage
$270
$180
$90
$3,000
$2,000
$1,000
passenger cars, and passenger vans
pickups, utility vehicle,and large vans

HLDI
Collision and Property Damage Liability LossesBy Vehicle Type and Size Class, 1995-97 ModelsAverage Loss Payment per Insured Vehicle Year
$ relative $ relative
Cars small $268 120 $79 98 midsize $250 112 $73 90 large $206 92 $62 77
Passenger Vans $165 74 $64 79
Pickups small $200 89 $101 125standard $168 75 $95 117
Utility small $211 94 $94 116Vehicles midsize $212 95 $98 121
large $135 60 $107 132
All passenger vehicles $224 100 $81 100
CollisionProperty
Damage Liability

HLDI
$100
$200
$300
$400
$500
$50 $60 $70 $80 $90 $100 $110 $120
Collision vs. Property Damage LiabilityAverage Loss Payment Per Insured Vehicle Year, 1995-97 Models
property damage liability
High CollisionLow Property Damage
Low CollisionLow Property Damage
Low CollisionHigh Property Damage
High CollisionHigh Property Damage
collision
smallsports
mdsizesports
mdsizeluxury
minisports
large luxury
very lg luxury
mdsize2-dr
mdsize4-dr
very lg sw
2-dr and 4-dr cars, station wagons, & passenger vans
sports and luxury cars
pickups, utility vehiclesand large vans
all vehicle average
very lg 4-dr
large4-dr
passvans
small4-dr
mini4-dr
mini 2-dr
small2-dr
smallutility
stdpickup
midsizeutility
largevan
largeutility
smallpickup
mdsizesw
large2-dr

HLDIThe Washington Post — January 24, 1999

HLDINew Yorker — March 9, 1998

HLDI
Miami Herald — February 14, 1998

HLDI
Nissan SUT - 2000 Model Year

HLDI
Ford Explorer SportTrac - 2001 Model Year

HLDI
Lincoln Blackwood - 2001 Model Year

HLDI
Recommended