1
Supporting Information for
Magnetic Fano resonance-induced second-harmonic
generation enhancement in plasmonic metamolecule rings †
Da-Jie Yang,a,b Song-Jin Im,*c Gui-Ming Pan,b Si-Jing Ding,b Zhong-Jian Yang,a,d Zhong-Hua Hao,b Li Zhou,*b and Qu-Quan Wang*a,b
a. The Institute for Advanced Studies, Wuhan University, Wuhan 430072, P. R. China. E-mail: [email protected],
b. Key Laboratory of Artificial Micro- and Nano-structures of the Ministry of Education and School of Physics and Technology, Wuhan
University, Wuhan 430072, P. R. China. E-mail: [email protected],
c. Department of Physics, Kim Il Sung University, Pyongyang, Democratic People’s Republic of Korea. email: [email protected].
d. Hunan Key Laboratory of Super Microstructure and Ultrafast Process, School of Physics and Electronics, Central South University,
Changsha, Hunan 410083, P.R. China
The influence of the absorption
While Fano resonances will lead to strongly asymmetric scattering spectra, Fano resonances can’t
be observed in the absorption spectra of the oligomer structures. But there will usually be an
absorption peak at the subradiant mode.1,2 The nanostructure gets energy from the light through
absorption and the energy is stored as the plasmonic energy.3 The plasmonic energy will undergo
radiative losses and nonradiative losses.3 The radiative losses are related to the scattering of the
nanoparticles. Since it harvests more energy at the absorption peak than other frequency, it is
necessary to compare the SHG corresponding to the Fano dip with that corresponding to the
absorption peak. Because the scattering dip and absorption peak of the trimer with r1 = 125 nm are
not corresponding to the same wavelength as shown in Fig. S6, this structure is chosen to be
further studied in Fig. S7. The comparison of the scattering dip and the absorption peak at
different wavelengths will further prove the advantage of the magnetic Fano dip in enhancing
SHG.
The scattering and absorption cross sections are shown in Fig. S7a and Fig. S7b respectively.
The scattering dip is denoted by the yellow bar and the absorption peak is denoted by the green bar.
The scattering cross section at the green bar is about 2.9 times that at the yellow bar, while the
Electronic Supplementary Material (ESI) for Nanoscale.This journal is © The Royal Society of Chemistry 2017

2
absorption cross section at the green bar is about 1.4 times that at the yellow bar. Fig. S7c shows
the electric near fields at the scattering dip (left) and absorption peak (right). The electric on the
right is a little stronger than that on the left. The strong electric near field is mainly determined by
the energy absorption and dissipation. The right one harvest more energy than the left one. At the
same time, the right one suffers more radiative losses. But the SHG near field in Fig. 7d and the
SHG far field in Fig. 7e corresponding to the absorption peak are weaker than the Fano dip. There
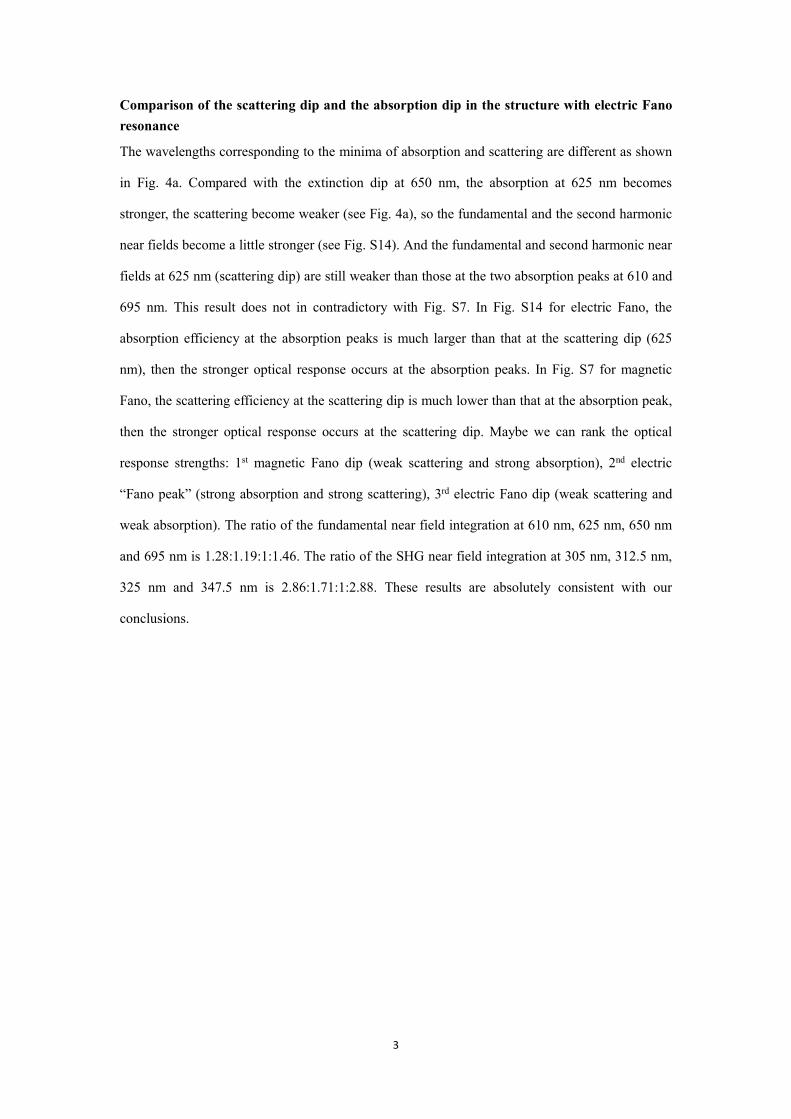
seems two reason. Firstly, at the particle surface where the centrosymmetry is broken, the
surface-perpendicular components of the near field is stronger for the scattering dip than that for
the absorption peak as shown in Fig. S8, although the absorption peak produces stronger near field
at the three gaps. The stronger surface-perpendicular components of the near field at the magnetic
Fano dip is attributed to the ring current mode. Secondly, at the scattering dip, even with smaller
absorption, the trimer suffers the minimum radiative losses and the influence of the radiative
losses on SHG may be stronger than on the fundamental electric near field. By this conclusion, we
don’t deny that on some specified conditions the absorption peak will produce stronger SHG
signal. But in our case, the magnetic mode and electric quadrupole mode cause vary small energy
radiation, so the strongest SHG happens with the excitation at the magnetic Fano dip.
SHG of nanostructures without Fano resonance
As another evidence to show the superiorities of the magnetic Fano resonance, the fundamental
and harmonic behaviors of two dimers (without Fano resonance) — small-small dimer and
big-small dimer — are compared with the fundamental and harmonic behaviors of the trimer. In
the scattering spectra in Fig. S9a, the small-small dimer and the big-small dimer show obvious
longitudinal modes at about 745 nm and 1160 nm respectively. The excitation wavelengths are
denoted by the triangular symbols. We compare the SHG of the trimer with the two dimers. The
trimer shows the largest SHG enhancement for both the near field Fig. S9b and the far field Fig.
S9c, and the enhancement of the SHG far field is especially obvious. This is because the two
dimers possess large electric dipole moments, which means the fundamental radiation losses is
relatively strong, and at the trimer scattering dip the magnetic Fano resonance reduces radiative
losses in the trimer structure.
3
Comparison of the scattering dip and the absorption dip in the structure with electric Fano
resonance
The wavelengths corresponding to the minima of absorption and scattering are different as shown
in Fig. 4a. Compared with the extinction dip at 650 nm, the absorption at 625 nm becomes
stronger, the scattering become weaker (see Fig. 4a), so the fundamental and the second harmonic
near fields become a little stronger (see Fig. S14). And the fundamental and second harmonic near
fields at 625 nm (scattering dip) are still weaker than those at the two absorption peaks at 610 and
695 nm. This result does not in contradictory with Fig. S7. In Fig. S14 for electric Fano, the
absorption efficiency at the absorption peaks is much larger than that at the scattering dip (625
nm), then the stronger optical response occurs at the absorption peaks. In Fig. S7 for magnetic
Fano, the scattering efficiency at the scattering dip is much lower than that at the absorption peak,
then the stronger optical response occurs at the scattering dip. Maybe we can rank the optical
response strengths: 1st magnetic Fano dip (weak scattering and strong absorption), 2nd electric
“Fano peak” (strong absorption and strong scattering), 3rd electric Fano dip (weak scattering and
weak absorption). The ratio of the fundamental near field integration at 610 nm, 625 nm, 650 nm
and 695 nm is 1.28:1.19:1:1.46. The ratio of the SHG near field integration at 305 nm, 312.5 nm,
325 nm and 347.5 nm is 2.86:1.71:1:2.88. These results are absolutely consistent with our
conclusions.

4
400 600 800 1000 12000
5
10
15
20
25
30
35
40
45
50
55
g3 g
2 g
1
Sca
tte
rin
g c
ross s
ectio
n (1
0-1
4 m
2)
Wavelength (nm)
5 nm 5 nm 5 nm
20 nm 5 nm 5 nm
Fig. S1 The scattering cross sections of the trimer with different gaps between the big and small
disks (g1 or g2). The three disk radii r1 = 175 nm, r2 = r3 = 80 nm. Even with smaller g3, we can’t get
deeper Fano dip. This is because it induces symmetry when the three gaps are the same. So it
paves the way releasing the restricted small gap size limitation for fabrication.
400 600 800 1000 12000
10
20
30
40
50
60
70
80
Sca
tte
rin
g c
ross s
ectio
n (
10
-14
m2
)
Wavelength (nm)
220 nm 80 nm 80 nm
175 nm 80 nm 80 nm
r1 r
2 r
3
Fig. S2 The scattering cross sections of the trimer with big disk radii r1 = 220 nm and 175 nm. The
three gaps g1 = g2 = 5 nm, g3 = 20 nm. With larger r1, we can’t get deeper Fano dip. When r1
becomes 220 nm, on the one hand, the dipole moments in the big and small disks become more
inequivalent; on another, the overlap of the spectra of the big and small disks become smaller.

5
400 600 800 1000 1200
0
10
20
30
40
50
60
70
Sca
tte
rin
g c
ross s
ectio
n (
10
-14 m
2)
Wavelength (nm)
small disk
big disk
small-small dimer
big-small dimer
Fig. S3 The scattering cross section of the unit cells in the trimer. The individual small disk (black
line), the individual big disk (red line), the small-small disk dimer (blue line) and the big-small disk
dimer (pink line) are from the trimer with big disk radius r1 = 175 nm, small disk radii r2 = r3 = 80
nm, small-small dimer gap g3 = 20 nm, and big-small dimer gap g1 = 5 nm.
0.00
0.01
0
30
60
90
120
150
180
210
240
270
300
330
0.00
0.01
720 nm
900 nm
1080 nm
0.00
0.01
0
30
60
90
120
150
180
210
240
270
300
330
0.00
0.01
720 nm
900 nm
1080 nm
0.000
0.003
0.006
0
30
60
90
120
150
180
210
240
270
300
330
0.000
0.003
0.006
720 nm
900 nm
1080 nm
0.00E+000
6.00E-008
0
30
60
90
120
150
180
210
240
270
300
330
0.00E+000
6.00E-008
720 nm
900 nm
1080 nm
0.00E+000
4.50E-008
9.00E-008
0
30
60
90
120
150
180
210
240
270
300
330
0.00E+000
4.50E-008
9.00E-008
720 nm
900 nm
1080 nm
0.00E+000
3.50E-008
7.00E-008
0
30
60
90
120
150
180
210
240
270
300
330
0.00E+000
3.50E-008
7.00E-008
720 nm
900 nm
1080 nm
(b)
(a) (d)
(e)
(c) (f)
Fig. S4 The fundamental (a-c) and harmonic (d-f) far field with excitation wavelengths of 720 nm
(black line), 900 nm (red line) and 1080 nm (blue line) in x = 0 plane (a, d), y = 0 plane (b, e) and z
= 0 plane(c, f). For the fundamental response, the minimum far field is found at the Fano dip in
each normal. SHG far field corresponding to the Fano dip dominates head and shoulders above
those corresponding to the two peaks.

6
350 400 450 500 550
0.0
2.0
4.0
6.0
8.0
10.0
Se
con
d h
arm
on
ic f
ar
fie
ld m
axim
um
(V
/m)
Wavelength (nm)
1
2
3
4
Se
con
d h
arm
on
ic n
ea
r fie
ld A
ve
rag
ing
(V
/m)
10-8
Fig. S5 The SHG efficiency at the whole spectra range. The blue line stand for the maximum value
of second harmonic far field collected at any angle. The red line stands for the second harmonic
near field averaging in the central plane of the trimer. The area we make the averaging is a circle
centered on the three disks. The radium of the circle is 1500 nm. The dash lines from left to right
show the wavelengths corresponding to the scattering peak on the high energy side, the
magnetic Fano dip and the scattering peak on the low energy side.
0
10
20
30
40
50
Sca
tterin
g c
ross s
ectio
n (
10
-14 m
2)
175
125
80
r1
400 600 800 1000 12000
3
6
9
Ab
so
rptio
n c
ross s
ectio
n(
10
-14 m
2)
Wavelength (nm)
Fig. S6 The comparison of the scattering and absorption cross sections of the trimer with
different big disk radii r1. The three gaps g1 = g2 = 5 nm, g3 = 20 nm. The small disk radii r2 = r3 =
80 nm. With r1 = 175 nm, the absorption peak near 900 nm is nearby the scattering peak and the
absorption peak near 1050 nm is too broad and unclear. With r1 = 80 nm, the absorption peak is
clear but the quadrupolar mode in the big disk disappears. In order to show the generality of the
results in the trimer, the scattering dip at 850 nm and the absorption at 930 nm with r1 = 125 nm
are chosen to be further studied in Figure 4.
7
0
10
20
30
Sca
tte
rin
g c
ross s
ectio
n (
10
-14 m
2)
125 nm
r1
500 750 10000
2
4
6
8
Abso
rptio
n c
ross s
ectio
n (
10
-14 m
2)
Wavelength (nm)
(a)
(d)
(b)
(c)
(e)
xzy
Fig. S7 (a, b) The scattering and absorption cross sections of the trimer structures with the big
disk radius of 125 nm. (c) The in-plane electric near field at the fundamental frequency. (d, e) The
in-plane electric field and the electric far field at harmonistic frequency respectively. The left
column and the right column in (c-e) correspond to the excitation wavelengths of scattering dip
and the absorption peak as denoted by the yellow and green bars in (a) and (b) respectively. The
harmonic near fields are shown on a logarithmic scale.
Scattering dip Absorption peak
Fig. S8 The electric near field and the surface-perpendicular components at the fundamental
frequencies of the scattering dip (left) and the absorption peak (right) of the trimer with the big
disk radius of 125 nm. The colors show the near field distribution on the central plane of the
trimer. The arrow lengths show the amplitudes of the surface-perpendicular components of the
electric near field and the arrow directions show the directions of the surface-perpendicular
components of the electric near field at the arrow heads. At the particle surface where the
centrosymmetry is broken, the surface-perpendicular components of the near field are stronger
for the scattering dip than that for the absorption peak, although the absorption peak produces
stronger near field at the three gaps.

8
(b)
(c)
400 600 800 1000 12000
10
20
30
40
50
60
70S
cattering c
ross s
ection (
10
-14 m
2)
Wavelength (nm)
trimer
small-small dimer
big-small dimer
(a)
xzy
Max
Min
E(2)/E0
Max
Min
E(2)/E0
Fig. S9 (a) The scattering cross sectionsof the trimer (black line), small-small dimer (red line) and
big-small dimer (blue line). SHG near field (b) and SHG far field (c) are corresponding to the
excitation wavelength of the trimer Fano dip, the small-small dimer longitudinal mode and
big-small dimer longitudinal mode, respectively. These three excitation positions are denoted by
the triangular symbols in (a). The harmonic near fields are shown on a logarithmic scale.
550 600 650 700 750
0
1
2
3
4
5
Cro
ss s
ection (
10
-14 m
2)
Wavelength (nm)
Absorption
Scattering
Extinction
Fig. S10 The absorption (black line), scattering (red line), and extinction (blue line) of the shorter
rod in Fig. 4 in the main text. The incident light polarizes along the long axis of the rod.

9
550 600 650 700 750
0.0
0.1
0.2
0.3
0.4
0.5
0.6
Scattering c
ross s
ection (
10
-14 m
2)
Wavelegnth (nm)
0.0
0.2
0.4
0.6
0.8
Radia
tion d
ecay
Fig. S11 The scattering (red line), and radiation rate (blue line) of the longer rod in Fig. 4 in the
main text. The incident light polarizes along the long axis of the rod. The distance between the
dipole source and the rod end is 10 nm. The peak in the radiation spectrum does not appear in
the scattering spectra indicate this mode is a dark mode.
400 600 800 1000 12000
5
10
15
20
25
30
Sca
tte
rin
g c
ross s
ectio
n
Wavelength (nm)
20 nm 20 nm 20 nm
20 nm 5 nm 5 nm
g3 g
2 g
1
Fig. S12 The scattering cross sections of the trimer with different gaps between the big and small
disks (g1 or g2). The three disk radii r1 = r2 = r3 = 80 nm. Even when the three disk radii are the
same, the trimer with different gaps shows a clear Fano dip. Only on the conditions that all the
trimer gaps and the disk radii are the same respectively, will the Fano resonance disappear.

10
550 600 650 700 750
0.4
0.6
0.8
1.0
1.2
1.4
1.6A
bsorp
tion
Wavelegnth (nm)
Model Lorentz
Equation y = y0 + (2*A/PI)*(w/(4*(x-xc)^2 + w^2))
Reduced Chi-Sqr
0.00493
Adj. R-Squar 0.9483
Value Standard Err
Peak1(B) y0 0.3223 0.03399
Peak1(B) xc 608.8601 0.68874
Peak1(B) w 38.52371 2.89556
Peak1(B) A 69.23499 5.57995
Peak1(B) H 1.14414 0.04591
Peak2(B) y0 0.3223 0.03399
Peak2(B) xc 696.1636 1.07938
Peak2(B) w 24.85912 4.15402
Peak2(B) A 22.83978 3.73021
Peak2(B) H 0.58491 0.05289
Fig. S13 Fitting of absorption cross section for the nanostructure supporting electric Fano
resonance. The black solid line stands for the simulated result, the blue solid line stands for the
fitting result, and the red and green dash lines stand for the two Lorentz profiles for fitting the
absorption. Two absorption peaks are somewhat asymmetric.
610 nm
650 nm
695 nm
305 nm
312.5 nm
347.5 nm
-6.3
-14.3
ln(|E
(2
)|/|E0 |)
|E(
)|/|E
0|
5
0.5
625 nm
325 nm
Fig. S14 The electric near field distributions at the fundamental (left) frequency of 610 nm, 625
nm, 650 nm, 695 nm and the electric near field distributions at the second harmonic (right)
frequency of 305 nm, 312.5 nm, 325 nm, 347.5 nm.

11
References
1 M. Yorulmaz, A. Hoggard, H. Zhao, F. Wen, W. S. Chang, N. J. Halas, P. Nordlander and S . Link, Nano
Lett., 2016, DOI: 10.1021/acs.nanolett.6b03080. 2 Z. Fang, Y. Wang, Z. Liu, A. Schlather, P. M. Ajayan, F. H. Koppens, P. Nordlander and N. J. Halas, ACS
Nano, 2012, 6, 10222. 3 M. W. Knight, H. Sobhani, P. Nordlander and N. J. Halas, Science, 2011, 332, 702.
Recommended