Embed Size (px)
Citation preview

Plasmonic Monitoring of Catalytic Hydrogen Generation by a SingleNanoparticle ProbeDaeha Seo, Garam Park, and Hyunjoon Song*
Department of Chemistry, Korea Advanced Institute of Science and Technology, Daejeon 305-701, Korea
*S Supporting Information
ABSTRACT: Plasmonic nanostructures such as gold nano-particles are very useful for monitoring chemical reactionsbecause their optical properties are highly dependent upon theenvironment surrounding the particle surface. Here, wedesigned the catalytic structure composed of platinizedcadmium sulfide with gold domains as a sensitive probe, andwe monitored the photocatalytic decomposition of lactic acidto generate hydrogen gas in situ by single-particle dark-fieldspectroscopy. The plasmon band shift of the gold probethroughout the reaction exhibits significant particle-to-particlevariation, and by simulating the reaction kinetics, the rate constant and structural information (including the diffusion coefficientthrough the shell and the relative arrangement of the active sites) can be estimated for individual catalyst particles. This approachis versatile for the monitoring of various heterogeneous reactions with distinct components at a single-particle level.
■ INTRODUCTIONHeterogeneous catalysts have been widely used in variouschemical transformations from the synthesis of chemicalresources and pollutant removal to electrochemical cells forenergy conversion. Heterogeneous catalytic systems are rathersophisticated because the associated reactions mainly occur atthe interface between multiple phases, where the solid surfaceprovides active reaction sites. Numerous catalytic factorsinfluence the reaction rates, including the surface facets, theactive surface atoms at edges and kinks, and the atomicarrangement, as well as the average surface area andcomposition.1−6 To simplify the reaction system, solidsubstrates with single-crystalline faces have been employed asmodel catalysts to investigate surface-dependent reactionproperties.7−10 Recently, the model catalysts have beenextended to three-dimensional structures bearing metal nano-particles and have provided valuable information regardingactual catalytic reactions.11 However, these approaches havefundamental limitations due to ensemble average measure-ments because the individual catalyst particles have broaddistributions of particle size and reaction environment. Anotherserious challenge is in situ reaction monitoring during thereaction process. For the detection of intermediate stages, thereactions have been investigated using special surfacetechniques, which usually require high-vacuum conditionswith powerful irradiation of light or subatomic particles,producing situations that are far from the real reactionconditions.8−10
Surface plasmon resonance (SPR) is a phenomenoninvolving the coupling of irradiated light and conductingelectrons. It leads to intense light scattering, which is highlydependent upon the dielectric constants of the surrounding
media.12 Accordingly, it is useful in monitoring changes in thesurfaces of metallic nanostructures. Anker et al. employed SPRfor highly sensitive chemical and biomolecular detection,13 andLarsson et al. used it to continuously monitor gas-phasereactions.14 These plasmon-based techniques are advantageousin terms of real-time, label-free, and high-resolution sensingwithout requiring special treatment of the specimen.Recent developments in surface plasmon measurement have
made it possible to study chemical properties at a single-particlelevel. Novo et al. and Xu et al. reported the direct observationof chemical reactions on individual gold nanocrystal surfa-ces.15,16 The optical property of single gold nanorods wasmodulated by electrochemical charge injection, which wouldguide the redox reaction mechanisms at the level of singleelectrons.17 Hydrogen adsorption and desorption on individualPd nanoparticles were also detected by introducing plasmonicgold nanostructures.18,19
In the present study, we introduced gold probes into aheterogeneous catalytic system and monitored the reactionprogress in situ by single-particle dark-field spectroscopy.Specially designed catalytic structures bearing the gold probescarried out the hydrogen generation reaction, and the SPR peakchange provided critical information regarding individualparticle properties, such as reaction kinetics and the geometryof individual catalytic nanoparticles.
■ EXPERIMENTAL SECTIONSynthesis of AuPt/CdS Hollow Cubes. Silver cubes were
synthesized via the polyol process developed by Zhang et al.20 First,
Received: October 5, 2011Published: December 13, 2011
Article
pubs.acs.org/JACS
© 2011 American Chemical Society 1221 dx.doi.org/10.1021/ja2093663 | J. Am. Chem.Soc. 2012, 134, 1221−1227

a silver cube dispersion in ethanol (2.6 mL, 0.19 mmol with respect tothe original silver precursor concentration) was added to a boilingaqueous solution of PVP (Mw = 55 000, 50 mL, 0.60 mmol). Next,HAuCl4 (10 mL, 0.016 mmol) and H2PtCl6 (10 mL, 0.011 mmol)aqueous solutions were added dropwise to the boiling mixture for 7min, followed by reflux for another 3 min. After centrifugation, theresultant AuPt−Ag hollow cubes were dispersed in water (30 mL).Second, the aqueous dispersion of the AuPt−Ag hollow cubes (26
mL) and PVP (0.049 g, 0.44 mmol) was added to water (200 mL).The Na2S aqueous solution (8.9 mL, 10 mM) was added, and thereaction mixture was allowed to stir for 1 d. After centrifugation, theresultant AuPt/Ag2S hollow cubes were dispersed in methanol (10mL).Third, the methanol dispersion of the AuPt/Ag2S hollow cubes (9.0
mL), Cd(NO3)2 solution in methanol (8.0 mL, 8.0 mmol), andtributylphosphine (TBP, 2.2 mL, 9.9 mmol) was added to methanol(40 mL), and the reaction mixture was stirred for 3 d. Aftercentrifugation, the resultant AuPt/CdS hollow cubes were dispersed inmethanol (5.0 mL).Synthesis of Au@Pt/CdS Cubes. Au@Ag core−shell cubes were
synthesized via the seed-mediated polyol process developed by Park etal.21 First, the Au@Ag core−shell cube dispersion in ethanol (5.0 mL,0.076 and 0.53 mmol with respect to the original gold and silverprecursor concentrations, respectively) was added to the boilingaqueous solution of PVP (100 mL, 0.31 mmol). Next, the H2PtCl6 (12mL, 0.0056 mmol) aqueous solution was added dropwise to theboiling mixture for 3 min, followed by reflux for another 3 min. Aftercentrifugation, the resultant Au@Pt−Ag cubes were dispersed in water(10 mL).Second, PVP (0.017 g, 0.15 mmol) was added to the aqueous
dispersion of the Au@Pt−Ag cubes (5.0 mL). The Na2S aqueoussolution (2.2 mL, 10 mM) was added, and the reaction mixture wasallowed to stir for 1 d. After centrifugation, the resultant Au@Pt/Ag2Scubes were dispersed in methanol (10 mL).Third, the Cd(NO3)2 solution in methanol (1.3 mL, 1.3 mmol) and
TBP (0.37 mL, 1.7 mmol) was added to the methanol dispersion ofthe Au@Pt/Ag2S cubes (3.0 mL), and the reaction mixture wasallowed to stir for 3 d. After centrifugation, the resultant Au@Pt/CdScubes were dispersed in methanol (5.0 mL).Monitoring Photocatalytic Decomposition of Lactic Acid.
Glass slides and coverslips were cleaned using aqua regia and piranhasolutions, and ultimately a large amount of distilled water. Thereaction chamber was formed using double-sided tape on the glassslide. The highly diluted catalyst dispersion (∼1/1000 dilution of theoriginal dispersion with methanol) was cast onto the glass slide, andthe sample was allowed to dry for 1 min. For the reaction, 10% lacticacid was added onto the reaction chamber. A coverslip covered thechamber.Dark-field scattering measurements were performed with an
inverted microscope (Carl Zeizz, Axiovert 40). The sample wasilluminated by a halogen lamp (35 W) using a dark-field condenser
(N.A. = 1.3) with immersion oil. Light was collected through a 43×microscope objective lens (N.A. = 0.98) and captured by a 640 × 480pixel color video camera (SONY, SSC-DC80) for images and a CCDcamera (ANDOR, NEWTON DU971N) with monochromator(Dongwoo, 500i) for spectra. The extinction spectrum was integratedfor 45 s and was extracted by background subtraction and lampspectrum correction.
■ RESULTS AND DISCUSSION
To demonstrate, we chose the photocatalytic decomposition oflactic acid on platinized cadmium sulfide (Pt/CdS), whichyields pyruvic acid and hydrogen gas.22 The Pt/CdS system isknown to efficiently decompose organic molecules due to thelarge bandgap of CdS (2.410 eV). The reaction was expected tocause a large change in the refractive index (n) between thereactants (1.425 for lactic acid) and the products (1.416 forpyruvic acid and 1.000 for H2 gas). If the catalyst structure is ahollow shell with the active sites located inside, the reactionmainly occurs on the internal surface, and hydrogen gas shouldaccumulate in the vacancy.To effectively probe the reaction, we introduced Au(0)
domains into the catalyst structure in two ways. The first was tolocate the Au domains in close proximity to the active Pt sitesto detect hydrogen evolution directly (Figure 1a). In thisarrangement, the reaction progress can be monitored from veryearly moments, but the Au domains may interact electronicallywith the active Pt sites and affect catalytic behaviors. Thesecond way to detect hydrogen evolution is to separate the Audomains by some distance from the Pt sites to observe theactual reaction progress on the Pt/CdS catalyst surface withoutany interference (Figure 1b). These two distinct catalystdesigns are referred to as AuPt/CdS hollow cubes and Au@Pt/CdS cubes, respectively.The catalysts were synthesized via three steps. For the former
structure, partial galvanic replacement of the silver cubes20 withplatinum and gold precursors yielded AuPt−Ag alloy hollowcubes. Subsequent chalcogenization with S2− and cationicexchange with Cd2+ yielded AuPt/CdS hollow cubes. Scanningelectron microscopy (SEM), high-angle annular dark-field-scanning electron microscopy (HAADF-STEM), high-resolu-tion transmission electron microscopy (HRTEM), and X-raydiffraction (XRD) data show that the structures are completelyconverted from silver cubes to AuPt−Ag alloy hollow cubes,AuPt/Ag2S hollow cubes, and eventually AuPt/CdS hollowcubes, respectively, with the preservation of the cubicframeworks (Supporting Information, Figures S1−S3, and
Figure 1. Structural design and synthetic scheme of catalytic particles bearing gold probes: (a) AuPt/CdS hollow cubes; (b) Au@Pt/CdS cubes.
Journal of the American Chemical Society Article
dx.doi.org/10.1021/ja2093663 | J. Am. Chem.Soc. 2012, 134, 1221−12271222
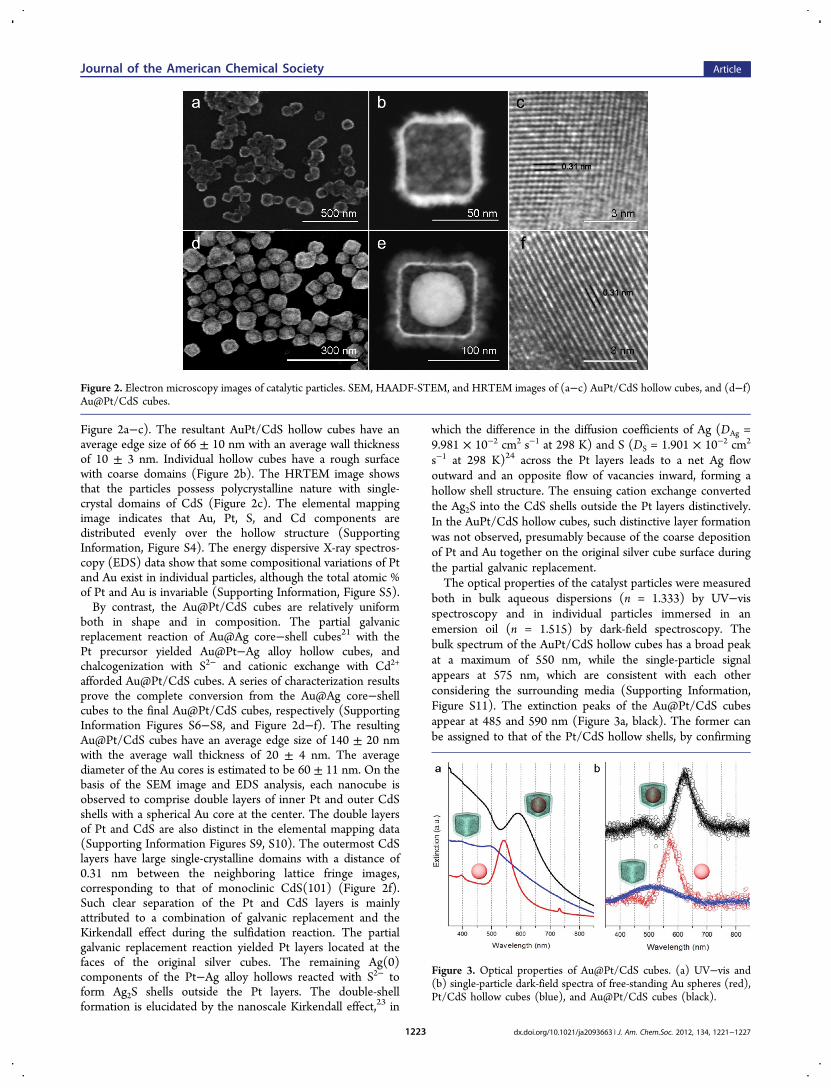
Figure 2a−c). The resultant AuPt/CdS hollow cubes have anaverage edge size of 66 ± 10 nm with an average wall thicknessof 10 ± 3 nm. Individual hollow cubes have a rough surfacewith coarse domains (Figure 2b). The HRTEM image showsthat the particles possess polycrystalline nature with single-crystal domains of CdS (Figure 2c). The elemental mappingimage indicates that Au, Pt, S, and Cd components aredistributed evenly over the hollow structure (SupportingInformation, Figure S4). The energy dispersive X-ray spectros-copy (EDS) data show that some compositional variations of Ptand Au exist in individual particles, although the total atomic %of Pt and Au is invariable (Supporting Information, Figure S5).By contrast, the Au@Pt/CdS cubes are relatively uniform
both in shape and in composition. The partial galvanicreplacement reaction of Au@Ag core−shell cubes21 with thePt precursor yielded Au@Pt−Ag alloy hollow cubes, andchalcogenization with S2− and cationic exchange with Cd2+
afforded Au@Pt/CdS cubes. A series of characterization resultsprove the complete conversion from the Au@Ag core−shellcubes to the final Au@Pt/CdS cubes, respectively (SupportingInformation Figures S6−S8, and Figure 2d−f). The resultingAu@Pt/CdS cubes have an average edge size of 140 ± 20 nmwith the average wall thickness of 20 ± 4 nm. The averagediameter of the Au cores is estimated to be 60 ± 11 nm. On thebasis of the SEM image and EDS analysis, each nanocube isobserved to comprise double layers of inner Pt and outer CdSshells with a spherical Au core at the center. The double layersof Pt and CdS are also distinct in the elemental mapping data(Supporting Information Figures S9, S10). The outermost CdSlayers have large single-crystalline domains with a distance of0.31 nm between the neighboring lattice fringe images,corresponding to that of monoclinic CdS(101) (Figure 2f).Such clear separation of the Pt and CdS layers is mainlyattributed to a combination of galvanic replacement and theKirkendall effect during the sulfidation reaction. The partialgalvanic replacement reaction yielded Pt layers located at thefaces of the original silver cubes. The remaining Ag(0)components of the Pt−Ag alloy hollows reacted with S2− toform Ag2S shells outside the Pt layers. The double-shellformation is elucidated by the nanoscale Kirkendall effect,23 in
which the difference in the diffusion coefficients of Ag (DAg =9.981 × 10⁻² cm2 s−1 at 298 K) and S (DS = 1.901 × 10⁻² cm2
s−1 at 298 K)24 across the Pt layers leads to a net Ag flowoutward and an opposite flow of vacancies inward, forming ahollow shell structure. The ensuing cation exchange convertedthe Ag2S into the CdS shells outside the Pt layers distinctively.In the AuPt/CdS hollow cubes, such distinctive layer formationwas not observed, presumably because of the coarse depositionof Pt and Au together on the original silver cube surface duringthe partial galvanic replacement.The optical properties of the catalyst particles were measured
both in bulk aqueous dispersions (n = 1.333) by UV−visspectroscopy and in individual particles immersed in anemersion oil (n = 1.515) by dark-field spectroscopy. Thebulk spectrum of the AuPt/CdS hollow cubes has a broad peakat a maximum of 550 nm, while the single-particle signalappears at 575 nm, which are consistent with each otherconsidering the surrounding media (Supporting Information,Figure S11). The extinction peaks of the Au@Pt/CdS cubesappear at 485 and 590 nm (Figure 3a, black). The former canbe assigned to that of the Pt/CdS hollow shells, by confirming
Figure 2. Electron microscopy images of catalytic particles. SEM, HAADF-STEM, and HRTEM images of (a−c) AuPt/CdS hollow cubes, and (d−f)Au@Pt/CdS cubes.
Figure 3. Optical properties of Au@Pt/CdS cubes. (a) UV−vis and(b) single-particle dark-field spectra of free-standing Au spheres (red),Pt/CdS hollow cubes (blue), and Au@Pt/CdS cubes (black).
Journal of the American Chemical Society Article
dx.doi.org/10.1021/ja2093663 | J. Am. Chem.Soc. 2012, 134, 1221−12271223

the peak at 490 nm of the Pt/CdS hollow particles (blue) thatare directly synthesized from the silver cubes. The 590 nm peakis the extinction of the Au cores, which is significantly red-shifted as compared to that of the free-standing Au spheres withidentical diameters (542 nm, red). A similar peak shift isobserved in the single-particle dark-field spectra (Figure 3b).The spectrum of a single particle exhibits a broad peak at 474nm arising from the Pt/CdS hollow shell (blue), and a sharppeak at 629 nm assignable to that of the Au core. A red-shift of52 nm from the peak of a free-standing Au sphere (577 nm,red) is ascribed to the plasmon coupling of the Au core and thePt/CdS hollow shell.25,26
To check the relationship between the refractive index ofsurrounding medium (n) and the maximum plasmon peak shift(Δλ),12 the catalyst particles were immersed in four differentmedia, air, water, ethylene glycol (n = 1.438), and immersionoil, respectively, and the maximum extinction peaks weremeasured (Supporting Information, Figure S12). From theslopes of the linear fits, the sensitivity factors, Δλ/Δn, wereestimated to be 34.5 nm RIU−1 for the AuPt/CdS hollow cubes
and 32.9 nm RIU−1 for the Au@Pt/CdS cubes, respectively.Such low sensitivity factors as compared to those (∼60 nmRIU−1) of Au nanoparticles27 are due to the existence of othercomponents such as Pt and CdS around the Au probes.On the basis of these optical properties, the two different
catalysts were employed for hydrogen gas evolution by thephotocatalytic decomposition of lactic acid, and the reactionswere monitored by single-particle dark-field spectroscopy.Under white-light irradiation with a halogen lamp (35 W)through a dark-field condenser (N.A. = 1.3), photonscoincident with the band gap are absorbed in the CdS shellsto generate photoelectrons, which transfer to the Pt sites, andreact with protons in solution to generate hydrogen gas. Theoperational model of dark-field spectroscopy and the detectionscheme on a single particle are depicted in Figure 4a.At t = 0, 10% lactic acid solution in water was introduced as a
proton source, and the plasmon scattering signal of anindividual particle was measured every minute. Figure 4bshows the extinction peak change of a single AuPt/CdS hollowcube during the reaction. The plasmon band at 569 nm
Figure 4. Monitoring of hydrogen evolution by single-particle dark-field spectroscopy. (a) Schematic diagram of single-particle measurement anddetection on a single Au@Pt/CdS catalyst particle. (b) Extinction spectra and (c) plasmon band shifts of a single AuPt/CdS hollow cube along thereaction progress. (d) Extinction spectra and (e) plasmon band shifts of a single Au@Pt/CdS cube along the reaction progress. (c and e insets)Kinetic plots along the reaction progress based on eq 1.
Journal of the American Chemical Society Article
dx.doi.org/10.1021/ja2093663 | J. Am. Chem.Soc. 2012, 134, 1221−12271224

gradually shifts to a shorter wavelength, and the maximum peakshift (Δλmax) is −14 nm during the reaction. If the environmentaround the Au probe is completely converted from the reactantsolution (10% lactic acid in water, n = 1.342) to hydrogen gas(n = 1.000), the plasmon band shift is estimated to be −12 nmby Mie theory, indicating that our measurement is reasonablewithin the error range. In a control experiment, the presentreaction conditions in the absence of lactic acid did not exhibitany plasmon shifts during the reaction period (SupportingInformation, Figure S13), which excludes the possibility ofplasmon frequency change by photoelectron injection fromCdS (ωp
2 = de2/meffε0, where ωp is plasmon frequency, d iselectron density, e is electron charge, meff is effective mass of theelectron, and ε0 is vacuum permittivity).28 After the irradiation,the catalyst particle showed a peak shift pattern similar to thatof the fresh catalyst, indicating high stability of the catalystagainst photocorrosion.22
Figure 4c shows the relationship between the plasmon bandshift and reaction time. The effective refractive index (neff) ofthe solution is given by neff = fnreact + (1 − f)nprod, where nreactand nprod are the refractive indexes of the reactant and products,respectively, and f is a fraction of the reactant with respect tothe total reagent concentration.29 Therefore, the plasmon shiftcan be converted to f or the concentration of lactic acid, [L], byusing the sensitivity factor (34.5 nm RIU−1) of the AuPt/CdShollow cubes. From the point of view of the reaction kinetics,lactic acid decomposition is a first-order reaction. If we suggestthat the hydrogen generated from the reaction is in a gaseousstate,30 the hydrogen gas hinders the diffusion of the reactantson the active Pt sites and subsequently slows the reaction rate.This effect is reflected by the kinetic equation assuming that thehindrance of the active sites is commensurate with the
hydrogen gas concentration. The observed reaction rate, kobs,is then corrected to be {(A − ax)/A}·k, where A is the pre-exponential Arrhenius factor, a is the site hindrance factor byhydrogen gas, x is the hydrogen gas concentration, and k is theactual reaction rate on the Pt sites. It is noted that A is ameasure of the rate at which collisions occur irrespective of theparticles’ energy. The solution to the first-order kineticequation with the site hindrance factor is (SupportingInformation, illustration S1):
−−
−=
⎛⎝⎜
⎞⎠⎟
xx
x xx x
kt[L]
ln[L]
[L]sat
sat 0
sat
sat
0
0 (1)
where [L]0 is the original concentration of lactic acid, x is thehydrogen concentration, and xsat is the hydrogen concentrationat the saturation state. The experimental data are plotted on thebasis of this equation (Figure 4c, inset), and k is estimated to be5.3 × 10−6 M−1 s−1 using a least-squares regression.Figure 4d is a graph of the change in the extinction peak
during the reaction time for a single Au@Pt/CdS cube. TheΔλmax is −4.6 nm, which is nearly one-third of the value of theAuPt/CdS hollow cube. This is because the Au core is, onaverage, 20 nm removed from the active Pt sites on the hollowshell; thus, the surroundings around the Au core are notcompletely filled with hydrogen gas even in the saturation state.The kinetic analysis estimates k to be 2.6 × 10⁻⁶ M−1 s−1
(Figure 4e, inset). It is interesting that the peak shift is delayedfor 3 min after the reaction starts (Figure 3e), which is also dueto the distance between the Au probe and the actual reactionsite (vide infra).Ten individual particles for both catalyst structures were
investigated by dark-field spectroscopy (Table 1). Figure 5a
Table 1. Estimation of Rate Constant (k), Diffusion Coefficient (D), and Pt−Au Distance (d) of 10 Individual (a) AuPt/CdSHollow Cubes and (b) Au@Pt/CdS Cubes
(a) Individual AuPt/CdS Hollow Cubes
particle no. peak shift (nm) rate constant k (10−6 M−1 min−1) reverse peak shift (nm) diffusion coefficient D (10−19 m2 s−1)
1 −16.7 5.82 −14.6 14.2 5.2 3.73 −10.4 9.9 7.4 1.24 −18.5 9.05 −9.4 9.36 −6.3 7.27 −14.0 5.38 −8.1 17.39 −6.8 7.6 2.9 2.810 −11.8 4.1average −10.7 ± 4.1 9.5 ± 4.5
(b) Individual Au@Pt/CdS Cubes
particle no. peak shift (nm)rate constant k
(10−6 M−1 min−1) reverse peak shift (nm)diffusion coefficient D
(10−19 m2 s−1) delay time (s) Pt−Au distance d (nm)
1′ −4.5 6.1 3 17.82′ −5.5 8.4 2.4 1.8 8 25.33′ −2.9 4.8 2.2 2.1 3 17.24′ −3.9 4.1 3 16.95′ −4.6 2.6 4 16.66′ −2.8 2.7 10 19.27′ −8.1 6.8 2 17.18′ −3.3 2.2 1.8 1.2 4 16.39′ −4.8 12.8 12 38.610′ −3.9 4.6 2.7 2.9 4 17.8average −4.4 ± 1.5 6.5 ± 3.2 5 ± 3 20.3 ± 7.0
Journal of the American Chemical Society Article
dx.doi.org/10.1021/ja2093663 | J. Am. Chem.Soc. 2012, 134, 1221−12271225

shows the plasmon band shifts of three characteristic particlesduring the reaction for the AuPt/CdS hollow cubes. Allparticles exhibit plasmon band shifts to shorter wavelengths. Akinetic analysis of the peak shifts using eq 1 estimates theaverage k to be (9.5 ± 4.5) × 10−6 M−1 min−1 (Table 1a),which is reasonable considering the structural and composi-tional variations of the catalyst particles. At the initial state ofthe reaction when t approaches zero, hydrogen molecules aregenerated at an average rate of 5.7 × 10⁻¹⁷ mL min−1 or 1500molecules per minute on a single catalyst particle. For theindividual Au@Pt/CdS cubes, the average rate constant isestimated to be (6.5 ± 3.2) × 10−6 M−1 min−1, and the averagerate of hydrogen generation at the initial state is 5.1 × 10⁻¹⁷ mLmin−1 or 1300 molecules per minute on a single particle(Figure 5b and Table 1b).As shown in Figure 5a and b, some particles exhibit
interesting reverse red-shifts of the extinction peaks at certaintimes during the reaction. These red-shifts are attributed to thefact that the internal pressure of the hollow cube continuouslyincreases due to hydrogen gas generation when the poredensity of the hollow shell is not sufficient to release thepressure. At a certain time, the hydrogen gas begins to leak outthrough the shell, and the solution diffuses back into theinternal vacancy to reach the equilibrium state. The diffusioncoefficient (D) of the hollow cube is derived from D = πχ2/4t,where χ is the average diffusion distance of the solution and t isthe period to close the equilibrium state. Haes et al. reportedthat the plasmon shift was linearly proportional to thethicknesses of the self-assembled monolayers on Au and Agnanoparticles within a distance of 15 nm and was nearlysaturated above this range.31 If we regard this value as theeffective plasmon shift distance for one of the single AuPt/CdShollow cubes (red in Figure 4a), χ can be derived using theratio of the reverse red-shift (5.2 nm) by back-diffusion of thesolution and the maximum blue-shift (−14.6 nm) by hydrogengas generation. The resultant diffusion coefficient through theshell is estimated to be 3.7 × 10⁻¹⁹ m2 s−1, which is comparableto coefficients of silica32 and polymer hollow nanoparticles.33
The other catalyst particle (black in Figure 5a) has a diffusioncoefficient of 1.2 × 10⁻¹⁹ m2 s−1. For the Au@Pt/CdS cube, thediffusion coefficients of the two individual particles (red andblack in Figure 4b) are estimated to be 1.8 × 10⁻¹⁹ and 2.1 ×10⁻¹⁹ m2 s−1. Thirteen out of 20 particles did not exhibit suchreversal red-shifts of the plasmon bands, because of large
defects or sufficiently high pore density in their hollow shells(Table 1, Supporting Information, Figures S14, S15).Another noticeable feature is that the Au@Pt/CdS cubes
show an initial delay time in the plasmon band shift withparticle-to-particle variation, whereas the AuPt/CdS hollowcubes do not. When the active Pt site is far from the Au probeas in the Au@Pt/CdS cube, it takes some time for the hydrogengas evolved at the active sites to reach the effective detectionrange from the Au core. Using the initial reaction rate and thedelay time of each catalyst particle, the distance (d) betweenthe Pt site and the Au probe can be calculated. For the threeparticles in Figure 5b, the distances are estimated to be 25.3(red), 17.2 (black), and 16.9 nm (blue), respectively. The totalaverage distance for 10 particles is 20.3 nm, which exactlymatches the average distance (20 nm) between the Pt/CdSshells and the Au cores measured from the SEM images (Table1b). This confirms that the maximum detection range of theplasmon band shift, 15 nm, is a reasonable value in ourmeasurements.
■ CONCLUSIONS
In summary, a rational design of Pt/CdS catalysts with Auprobes enables us to monitor the hydrogen generation reactionin situ at the single-particle level by dark-field spectroscopy.The plasmon band shifts of the Au probes show significantparticle-to-particle variation, and kinetic analyses provideaccurate information regarding the rate constant (k), diffusioncoefficient (D), and average distance (d) between the activesites and the probe of individual catalyst particles. This strategyis versatile and can be applied to various reactions that featurelarge refractive index differences between the reactants andproducts. Optimization of the measurement using a laser lightsource would allow the monitoring of fast reactions withextremely high sensitivity up to the molecular level.
■ ASSOCIATED CONTENT
*S Supporting InformationAdditional figures of characterization data and reaction profilesfor individual catalyst particles. This material is available free ofcharge via the Internet at http://pubs.acs.org.
■ AUTHOR INFORMATION
Corresponding [email protected]
Figure 5. Reaction behaviors of individual catalyst particles. Plasmon band shifts along the reaction progress for three individual (a) AuPt/CdShollow cubes and (b) Au@Pt/CdS cubes, respectively.
Journal of the American Chemical Society Article
dx.doi.org/10.1021/ja2093663 | J. Am. Chem.Soc. 2012, 134, 1221−12271226

■ ACKNOWLEDGMENTSWe acknowledge helpful discussions of single-particle measure-ment with S. K. Kim. This work was supported by the CoreResearch Program (2010-07592) and a National ResearchFoundation (NRF) grant funded by the Korea Government(Ministry of Education, Science, and Technology) (R11-2007-050-00000-0).
■ REFERENCES(1) Turner, M.; Golovko, V. B.; Vaughan, O. P. H.; Abdulkin, P.;Berenguer-Murcia, A.; Tikhov, M. S.; Johnson, B. F. G. Nature 2008,454, 981−984.(2) Herzing, A. A.; Kiely, C. J.; Carley, A. F.; Landon, P.; Hutchings,G. J. Science 2008, 321, 1331−1335.(3) Li, Y.; El-Sayed, M. A. J. Phys. Chem. B 2001, 105, 8938−8943.(4) Narayanan, R.; El-Sayed, M. A. Nano Lett. 2004, 4, 1343−1348.(5) Park, I.; Lee, K.; Choi, J.; Park, H.; Sung, Y. J. Phys. Chem. C2007, 111, 19126−19133.(6) Chen, X.; Moskovits, M. Nano Lett. 2007, 7, 807−812.(7) Baldauf, M.; Kolb, D. M. J. Phys. Chem. 1996, 100, 11375−11381.(8) Ertl, G. Angew. Chem., Int. Ed. 2008, 47, 3524−3535.(9) Somorjai, G. A.; Park, J. Y. Catal. Lett. 2007, 115, 87−98.(10) Goodman, D. W. Chem. Rev. 1995, 95, 523−536.(11) Habas, S. E.; Lee, H.; Radmilovic, V.; Somojai, G. A.; Yang, P.Nat. Mater. 2007, 6, 692−697.(12) Haes, A. J.; Zou, S.; Schatz, G. C.; Van Duyne, R. P. J. Phys.Chem. B 2004, 108, 6961−6968.(13) Anker, J. N.; Hall, W. P.; Lyandres, O.; Shah, N. C.; Zhao, J.;Van Duyne, R. P. Nat. Mater. 2008, 7, 442−453.(14) Larsson, E. M.; Langhammer, C.; Zoric, I.; Kasemo, B. Science2009, 326, 1091−1094.(15) Novo, C.; Funston, A. M.; Mulvaney, P. Nat. Nanotechnol. 2008,3, 598−602.(16) Xu, W.; Kong, J. S.; Yeh, Y.-T. E.; Chen, P. Nat. Mater. 2008, 7,992−996.(17) Novo, C.; Funston, A. M.; Gooding, A. K.; Mulvaney, P. J. Am.Chem. Soc. 2009, 131, 14664−14666.(18) Liu, N.; Tang, M. L.; Hentschel, M.; Giessen, H.; Alivisatos, A.P. Nat. Mater. 2011, 10, 631−636.(19) Tang, M. L.; Liu, N.; Dionne, J. A.; Alivisatos, A. P. J. Am. Chem.Soc. 2011, 133, 13220−13223.(20) Zhang, Q.; Li, W.; Wen, L.-P.; Chen, J.; Xia, Y. Chem.-Eur. J.2010, 16, 10234−10239.(21) Park, G.; Seo, D.; Jung, J.; Ryu, S.; Song, H. J. Phys. Chem. C2011, 115, 9417−9423.(22) Harada, H.; Ueta, T.; Sakata, T. J. Phys. Chem. 1989, 93, 1542−1548.(23) Wark, S. E.; Hsia, C.-H.; Son, D. H. J. Am. Chem. Soc. 2008, 130,9550−9555.(24) Allen, R. L.; Moore, W. J. J. Phys. Chem. 1959, 63, 223−226.(25) Prodan, E.; Radloff, C.; Halas, N. J.; Nordlander, P. Science2003, 17, 419−422.(26) Sheikholeslami, S.; Jun, Y.-w.; Jain, P. K.; Alivisatos, A. P. NanoLett. 2010, 10, 2655−2660.(27) Sun, Y.; Mayers, B.; Xia, Y. Adv. Mater. 2003, 15, 641−646.(28) Mulvaney, P. Langmuir 1996, 12, 788−800.(29) Novo, C.; Funston, A. M.; Pastoriza-Santos, I.; Liz-Marzan, L.M.; Mulvaney, P. J. Phys. Chem. C 2008, 112, 3−7.(30) Holmberg, M.; Kuhle, A.; Garnaes, J.; Morch, K. A.; Boisen, A.Langmuir 2003, 19, 10510−10513.(31) Haes, A. J.; Zou, S.; Schatz, G. C.; Van Duyne, R. P. J. Phys.Chem. B 2004, 108, 109−116.(32) Lee, J.; Park, J. C.; Song, H. Adv. Mater. 2008, 20, 1523−1528.(33) Kamata, K.; Lu, Y.; Xia, Y. J. Am. Chem. Soc. 2003, 125, 2384−2385.
Journal of the American Chemical Society Article
dx.doi.org/10.1021/ja2093663 | J. Am. Chem.Soc. 2012, 134, 1221−12271227