From Topographic Maps to Digital Elevation Models
Daniel SheehanDUE Office of Educational Innovation & Technology
Anne GrahamMIT Libraries
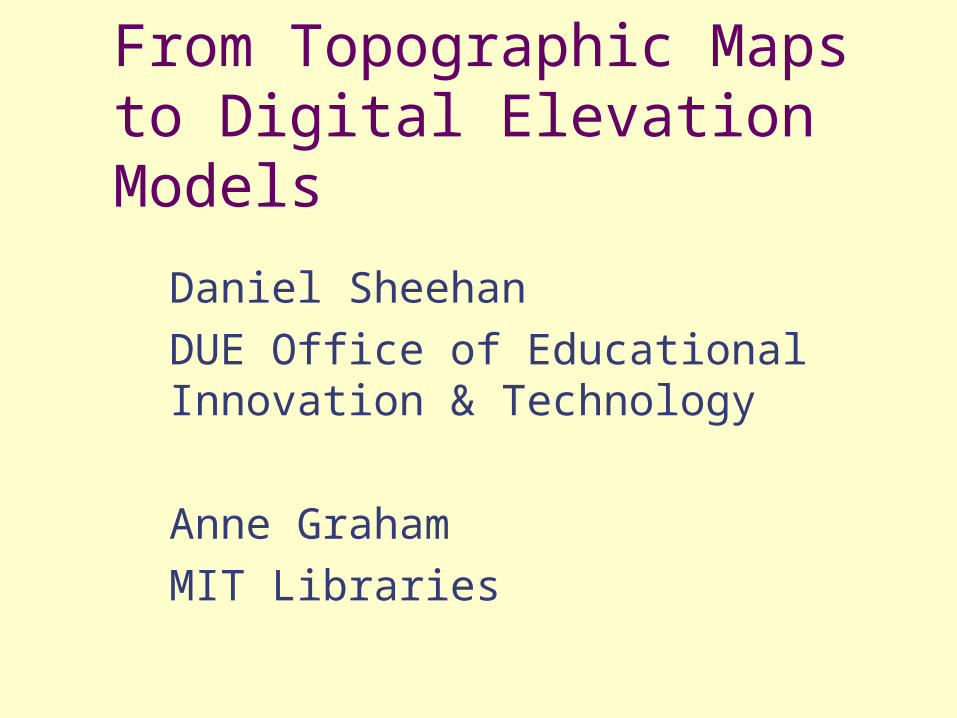
Which Way Does the Water Flow?
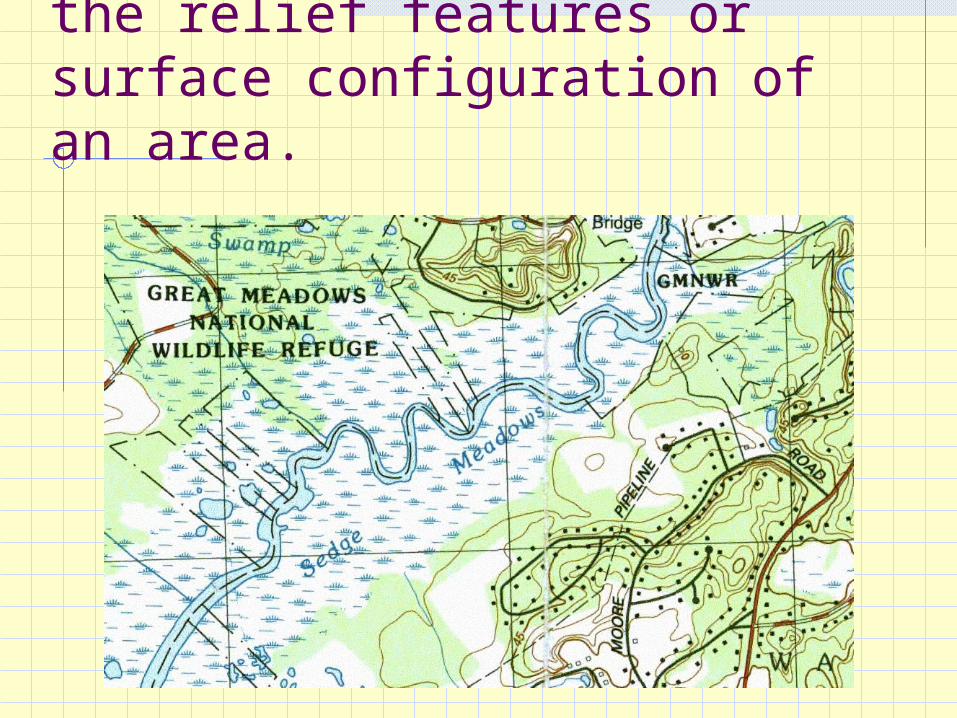
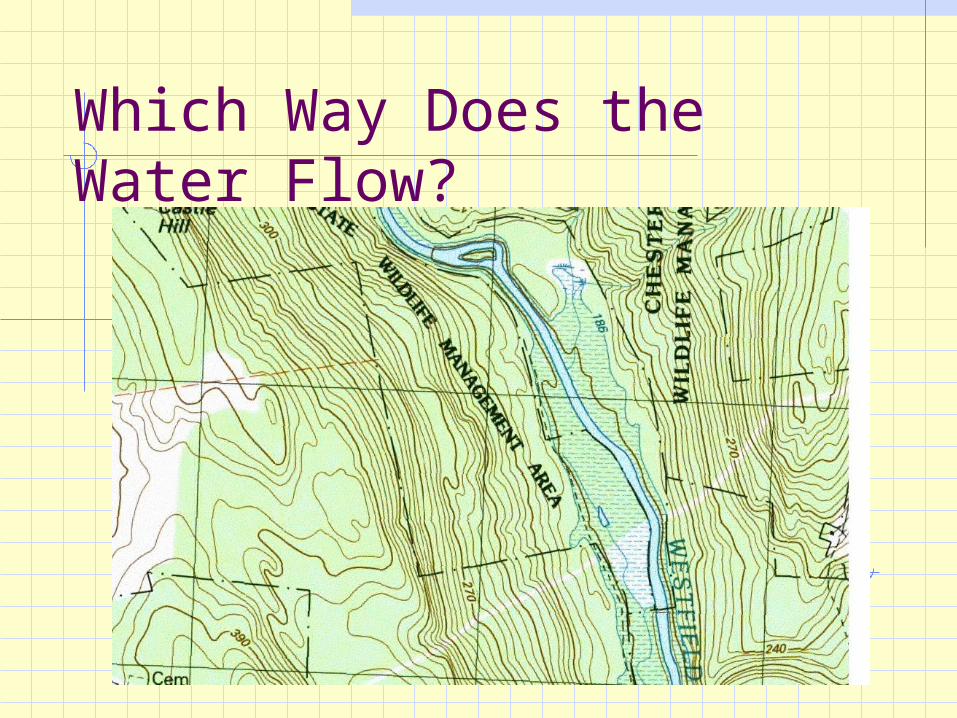
A topographic map shows the relief features or surface configuration of an area.

A hill is represented by lines of equal elevation above mean sea level. Contours never cross.

Elevation values are printed in several places along these lines.
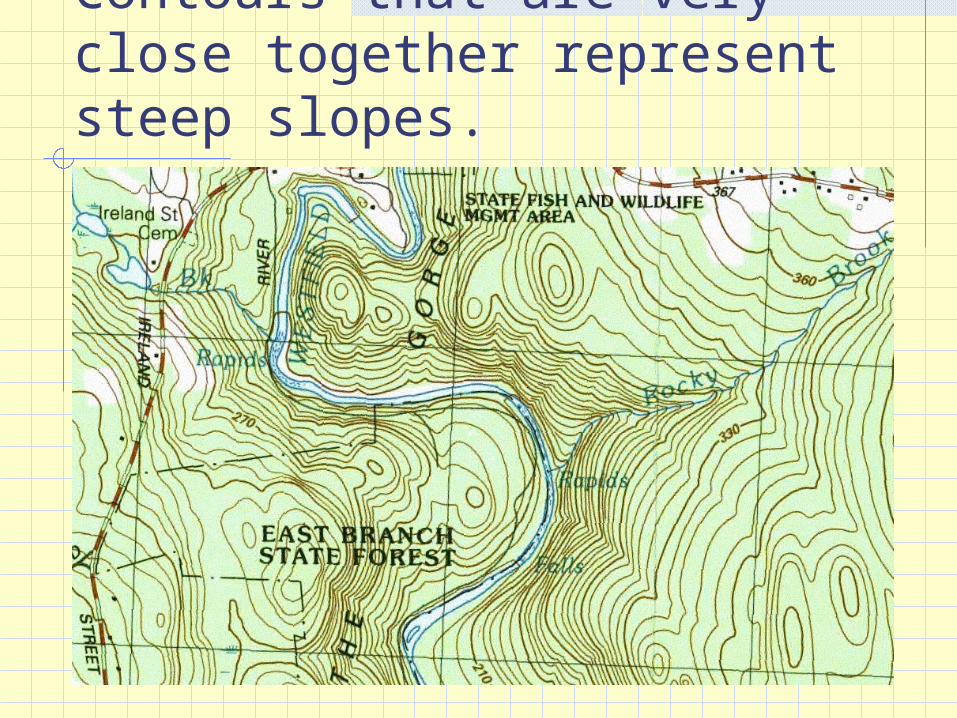
Contours that are very close together represent steep slopes.
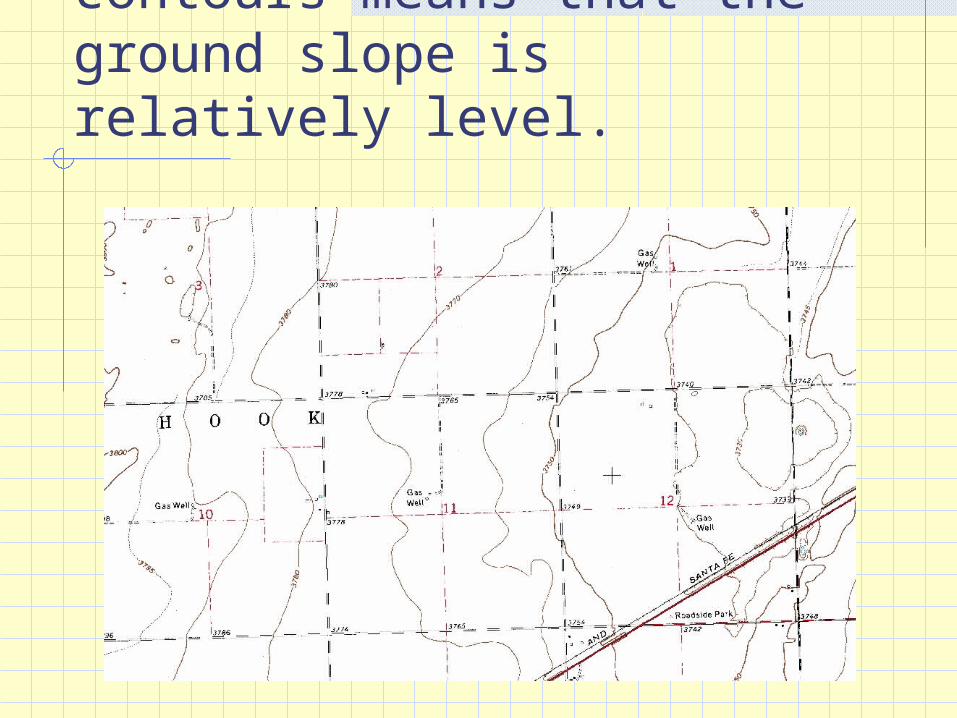
Widely spaced contours or an absence of contours means that the ground slope is relatively level.
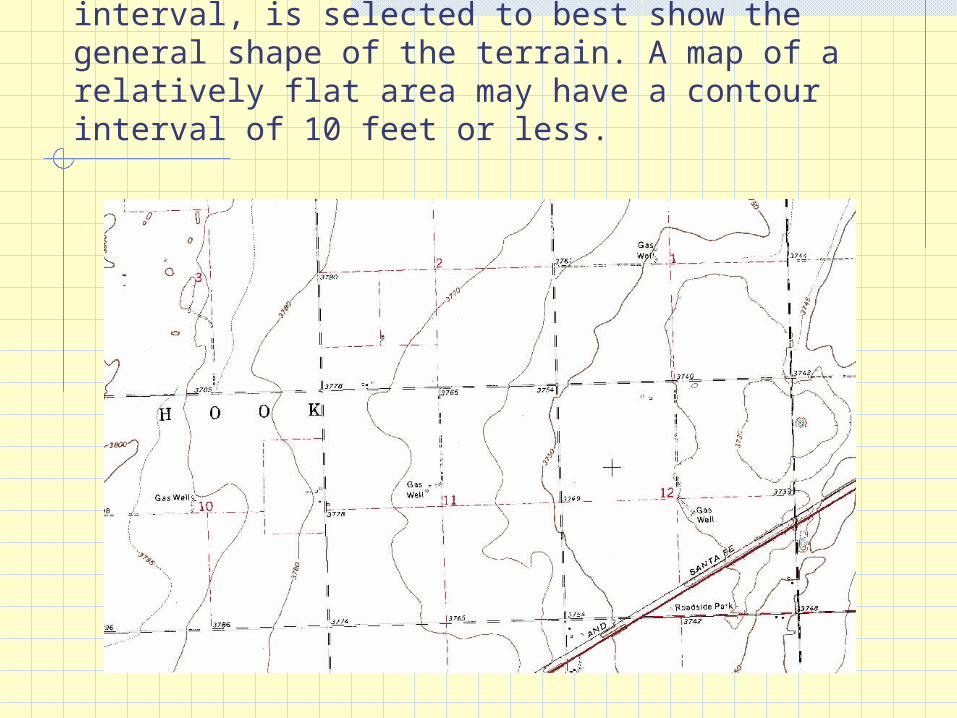
The elevation difference between adjacent contour lines, called the contour interval, is selected to best show the general shape of the terrain. A map of a relatively flat area may have a contour interval of 10 feet or less.

Maps in mountainous areas may have contour intervals of 100 feet or more.

A city can be overlain on a topographic map.
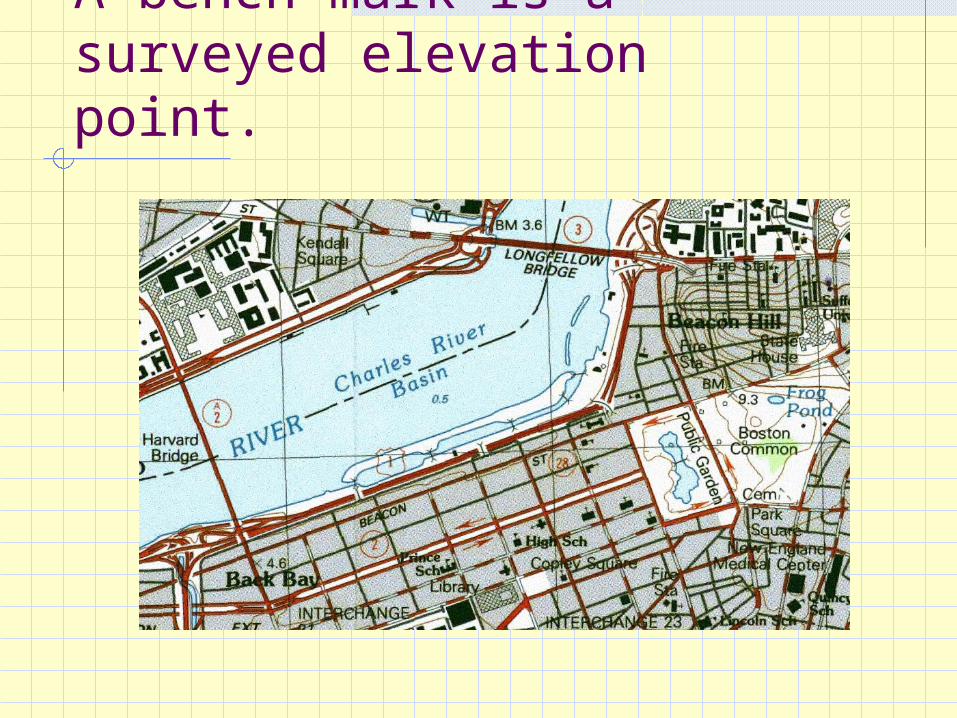
A bench mark is a surveyed elevation point.
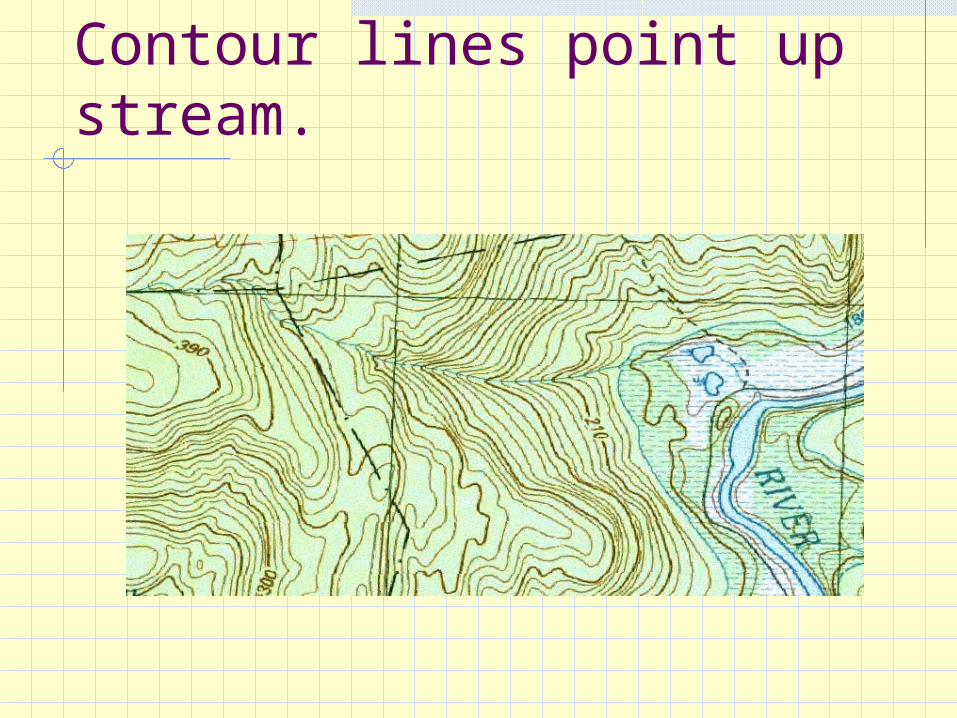
Contour lines point up stream.
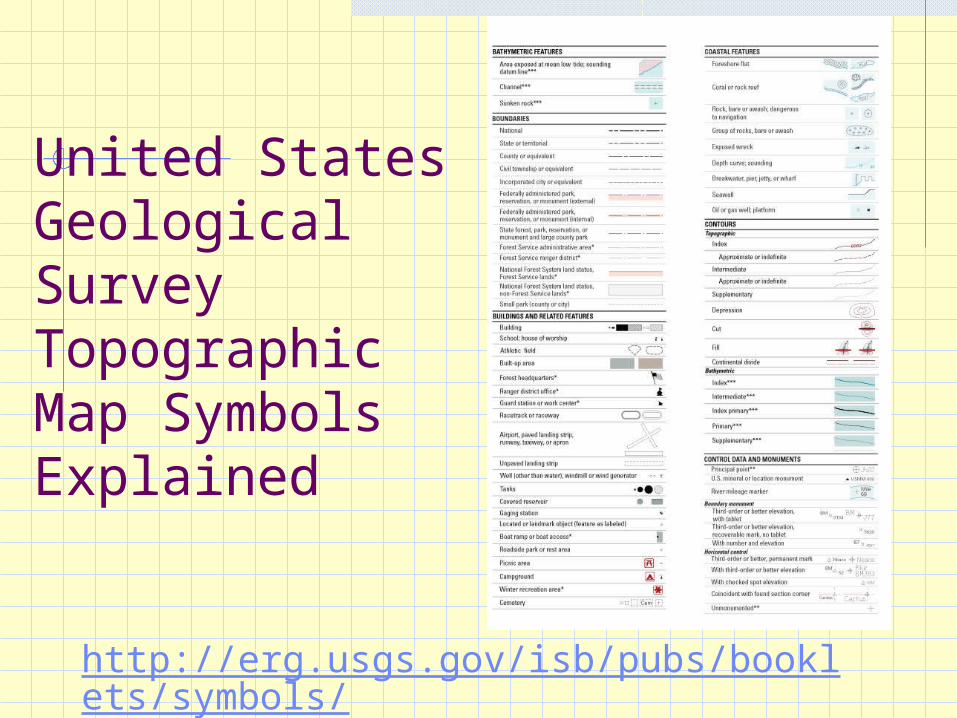
United States Geological Survey Topographic Map Symbols Explained
http://erg.usgs.gov/isb/pubs/booklets/symbols/


Digital Elevation Models
Using elevation data in raster format in a GIS

What is a Digital Elevation Model (DEM)?
Digital representation of topography Cell based with a single
elevation representing the entire area of the cell

Basic storage of data
340 335 330 340 345
337 332 330 335 340
330 328 320 330 335
328 326 310 320 328
320 318 305 312 315
DEM as matrix of elevations with a uniform cell size

Adding geography to data
340 335 330 340 345
337 332 330 335 340
330 328 320 330 335
328 326 310 320 328
320 318 305 312 315
Xmin, Ymin – XY are in projected units
Xmax, Ymax
Cell indexnumber xcell size definesposition relativeto Xmin, Yminand Xmax,Ymax and infersAn exact location

Uses of DEMs
Determine characteristics of terrain Slope, aspect Watersheds drainage networks, stream channels

Scale in DEMs
Scale determines resolution (cell size) Depends on source data
Resolution determines use of DEM and what spatial features are visible

Estimating slopes in a DEM
Slopes are calculated locally using a neighborhood function, based on a moving 3*3 window
Distances are different in horizontal and vertical directions vs diagonal
Only steepest slopes are used
1.41… 1 1.41…
1 0 1
1.41… 1 1.41…
* cell size
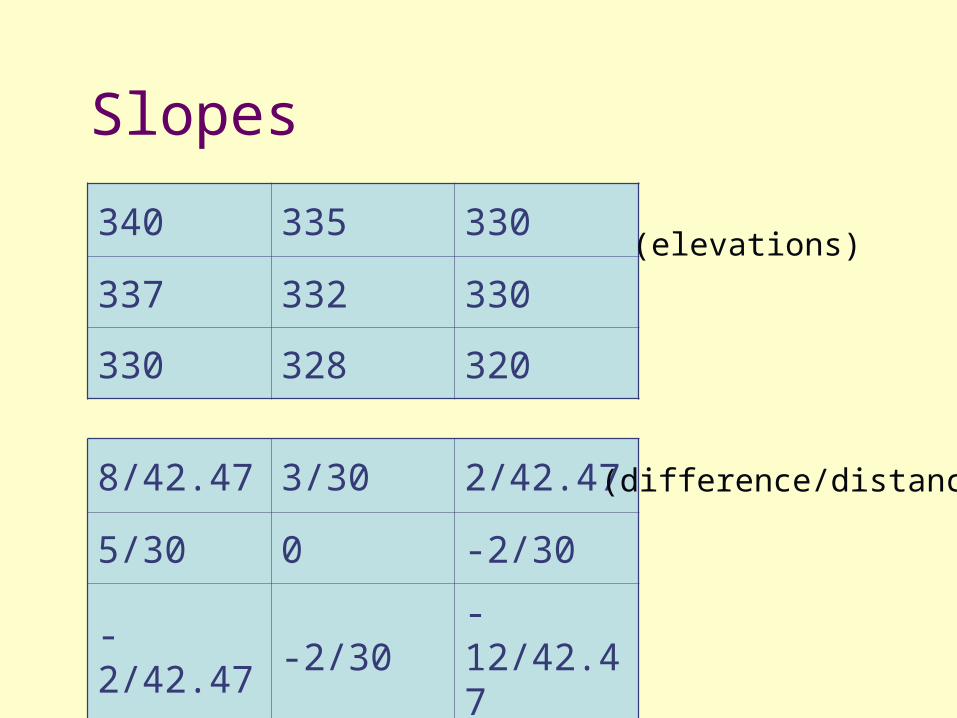
Slopes
340 335 330
337 332 330
330 328 320
(elevations)
8/42.47 3/30 2/42.47
5/30 0 -2/30
-2/42.47 -2/30-12/42.47
(difference/distance)
Flow Direction
Useful for finding drainage networks and drainage divides
Direction is determined by the elevation of surrounding cells Water can flow only into one cell
Water is assumed to flow into one other cell, unless there is a sink GIS model assumes no sinks
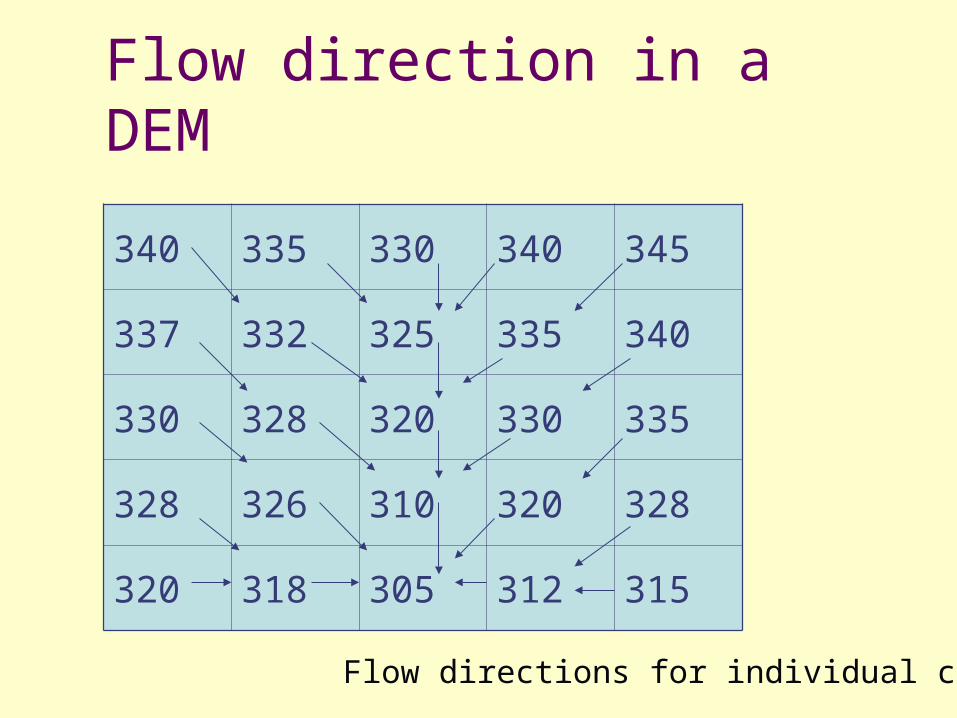
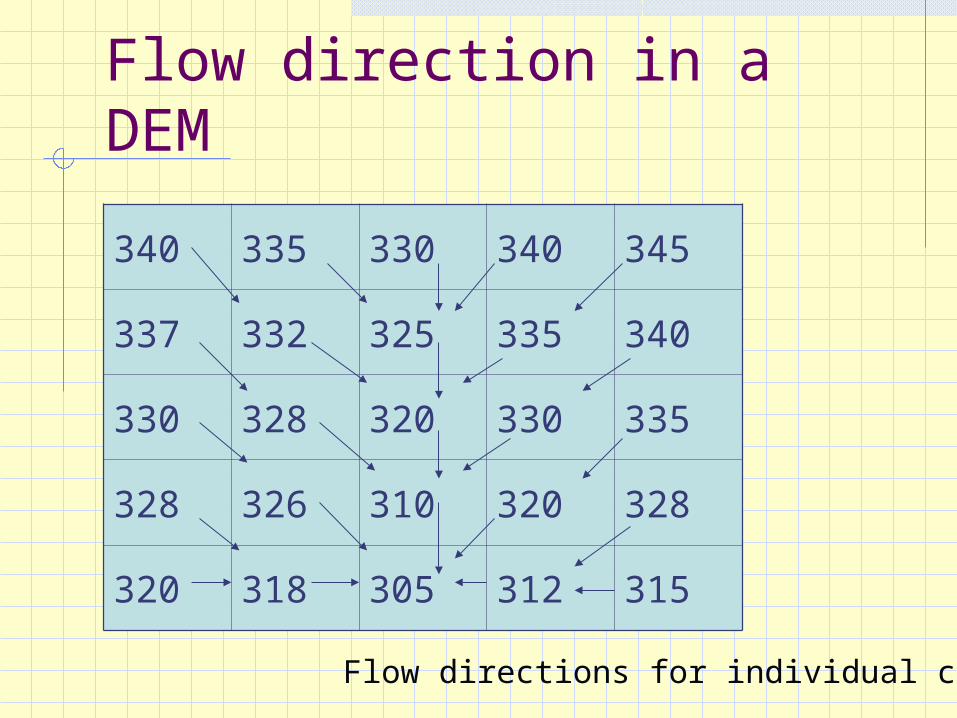
Flow direction in a DEM
340 335 330 340 345
337 332 325 335 340
330 328 320 330 335
328 326 310 320 328
320 318 305 312 315
Flow directions for individual cells
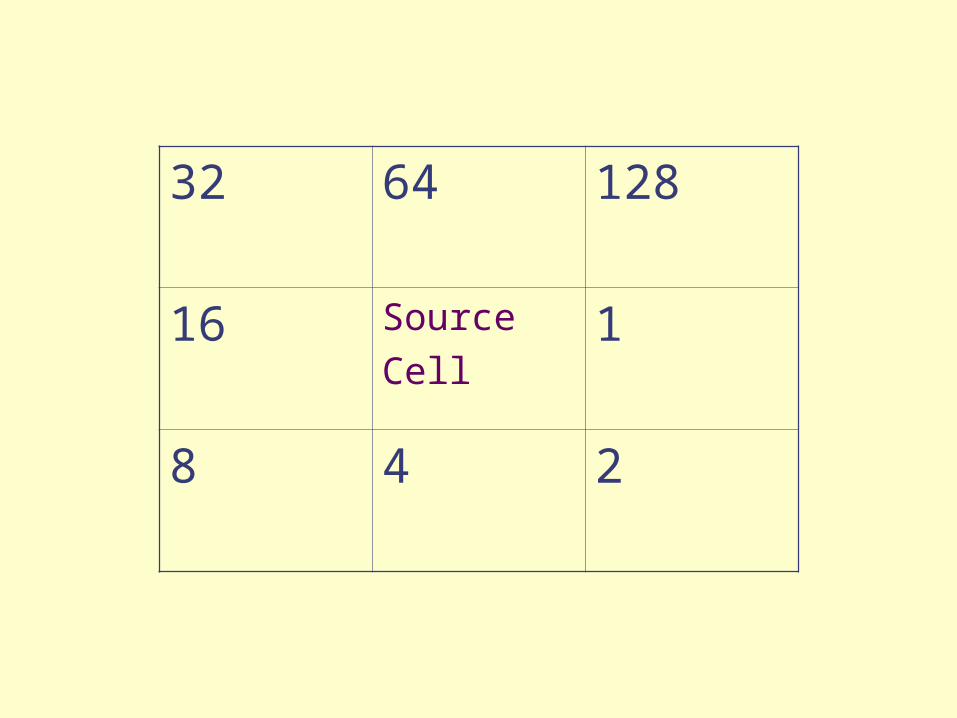
32 64 128
16 SourceCell
1
8 4 2
Finding watersheds …
Begin at a source cell of a flow direction database, derived from a DEM (not from the DEM itself Find all cells that flow into the source cell Find all cells that flow into those cells.
Repeat …
All of these cells comprises the watershed
The resulting watershed is generalized, based on the cell size of the DEM

Watersheds …
Contour lines (brown)Drainage (blue)Watershed boundary (red)
Once done manually …
Flow accumulation
The number of cells, or area, which contribute to runoff of a given cell
The accumulation function determines the area of a watershed that contributes runoff to any given cell
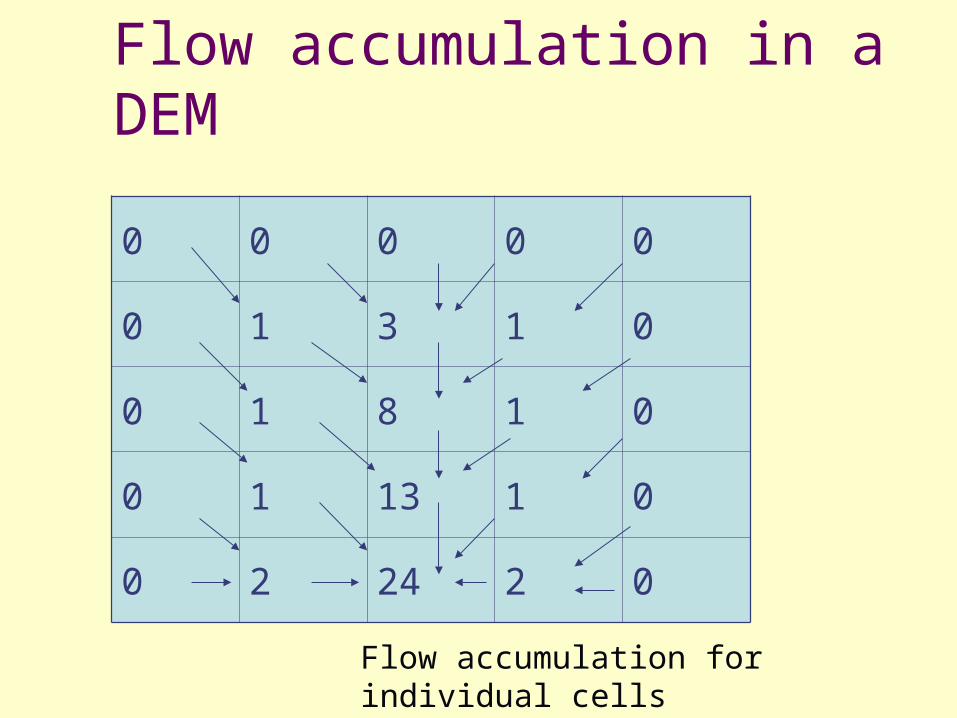
Flow accumulation in a DEM
0 0 0 0 0
0 1 3 1 0
0 1 8 1 0
0 1 13 1 0
0 2 24 2 0
Flow accumulation for individual cells
Flow direction in a DEM
340 335 330 340 345
337 332 325 335 340
330 328 320 330 335
328 326 310 320 328
320 318 305 312 315
Flow directions for individual cells
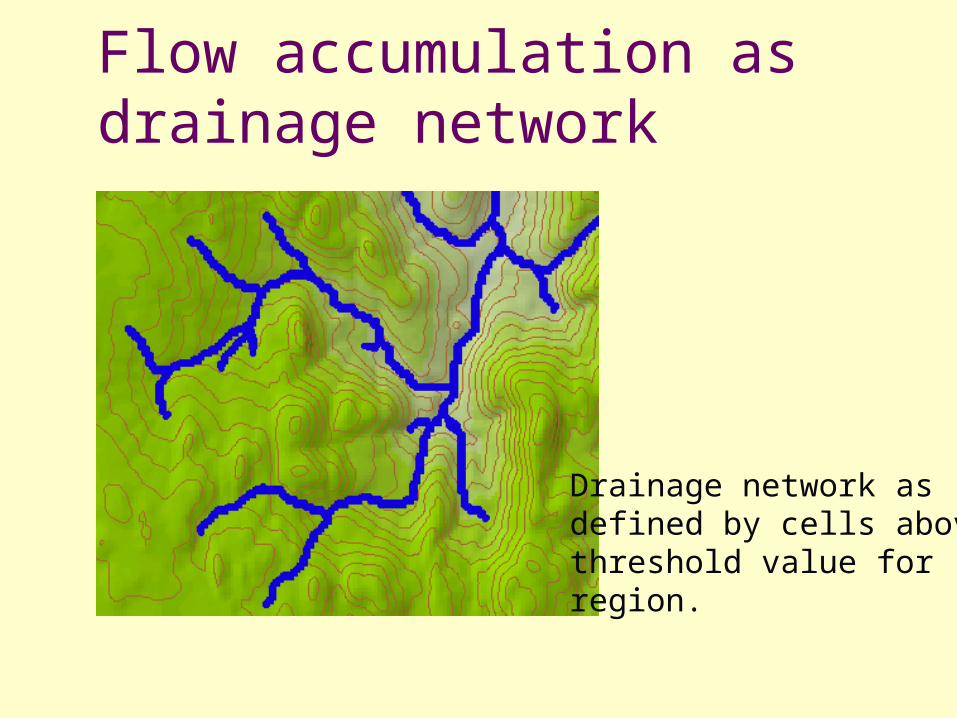
Flow accumulation as drainage network
Drainage network asdefined by cells abovethreshold value forregion.

Things to do before the exercise:
In Windows, create a new folder under your username on the F:\Usertemp folder.
In Arcgis Desktop, click on tools then Extension. Check the box for Spatial Analyst and close the window. Again click on tools and then Customize. Again, check the box for the Spatial Analyst toolbox and close the window.
Recommended