DiRAC/PATC/VI-HPS MPI Tools Workshop
EPCC/DiRAC/ECS MPI Tools Workshop Introduction
Brian Wylie1 and Tobias Hilbrich2
1Research Center Jülich and 2Technische Universität Dresden
DiRAC/PATC/VI-HPS MPI Tools Workshop
Virtual Institute – High Productivity Supercomputing
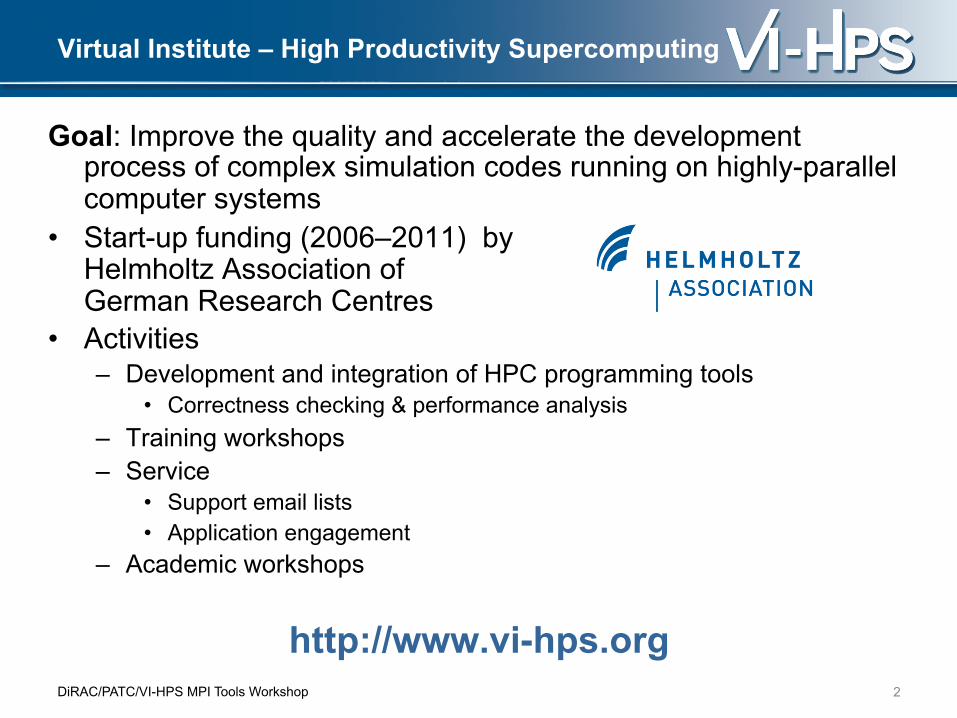
Goal: Improve the quality and accelerate the development process of complex simulation codes running on highly-parallel computer systems
• Start-up funding (2006–2011) by Helmholtz Association of German Research Centres
• Activities – Development and integration of HPC programming tools
• Correctness checking & performance analysis – Training workshops – Service
• Support email lists • Application engagement
– Academic workshops
http://www.vi-hps.org 2
DiRAC/PATC/VI-HPS MPI Tools Workshop
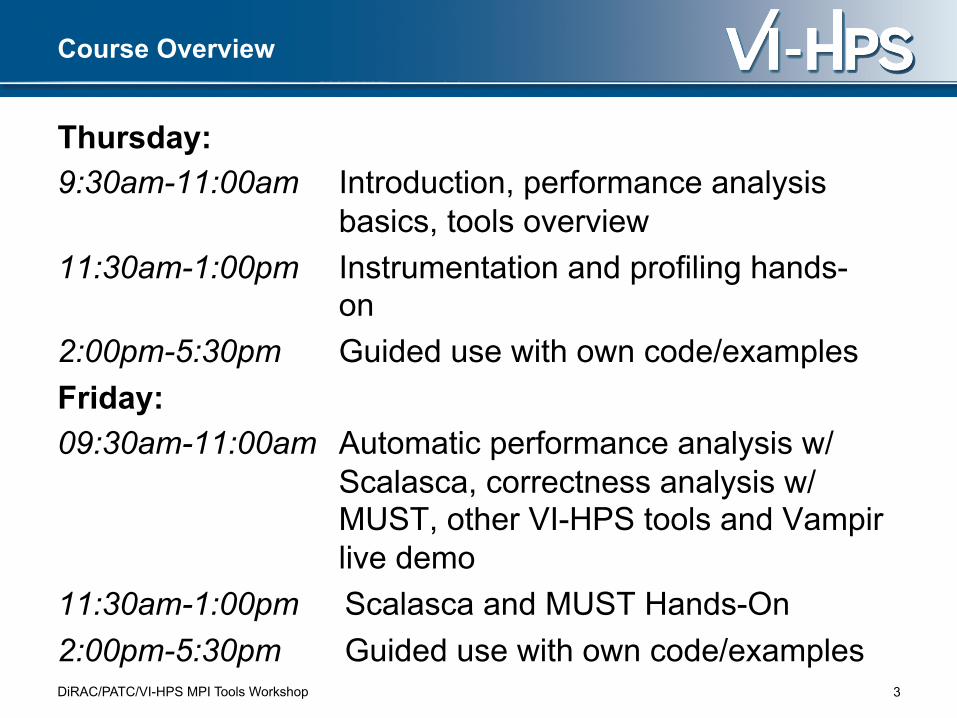
Course Overview
Thursday: 9:30am-11:00am Introduction, performance analysis
basics, tools overview 11:30am-1:00pm Instrumentation and profiling hands-
on 2:00pm-5:30pm Guided use with own code/examples Friday: 09:30am-11:00am Automatic performance analysis w/
Scalasca, correctness analysis w/ MUST, other VI-HPS tools and Vampir live demo
11:30am-1:00pm Scalasca and MUST Hands-On 2:00pm-5:30pm Guided use with own code/examples
3

DiRAC/PATC/VI-HPS MPI Tools Workshop
COSMO-SPECS a coupling of: - Weather forecast model - Detailed cloud microphysics scheme
COSMO: Approximation of cloud droplet size
COSMO-SPECS: Bin-wise discretization of cloud droplet size
Developer observation: Runtime per iteration increases over time, why?
Motivation Story 1
DiRAC/PATC/VI-HPS MPI Tools Workshop
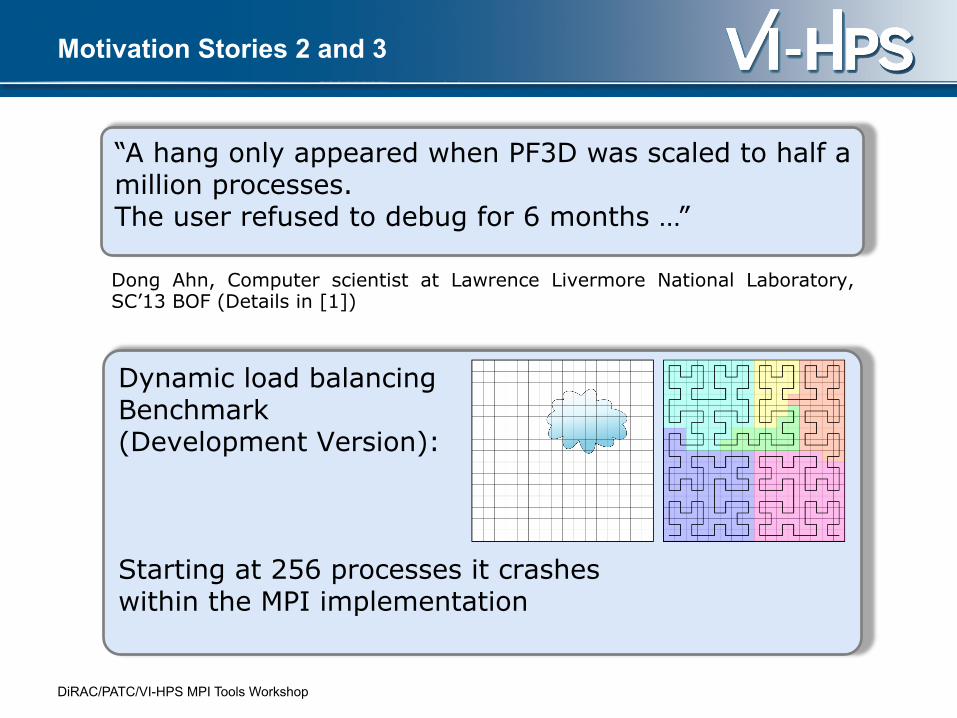
Motivation Stories 2 and 3
“A hang only appeared when PF3D was scaled to half a million processes. The user refused to debug for 6 months …”
Dong Ahn, Computer scientist at Lawrence Livermore National Laboratory, SC’13 BOF (Details in [1])
Dynamic load balancing Benchmark (Development Version): Starting at 256 processes it crashes within the MPI implementation

DiRAC/PATC/VI-HPS MPI Tools Workshop
Tools assist you in your HPC development:
Performance optimization MUST: Correct MPI usage
Course Message
DiRAC/PATC/VI-HPS MPI Tools Workshop
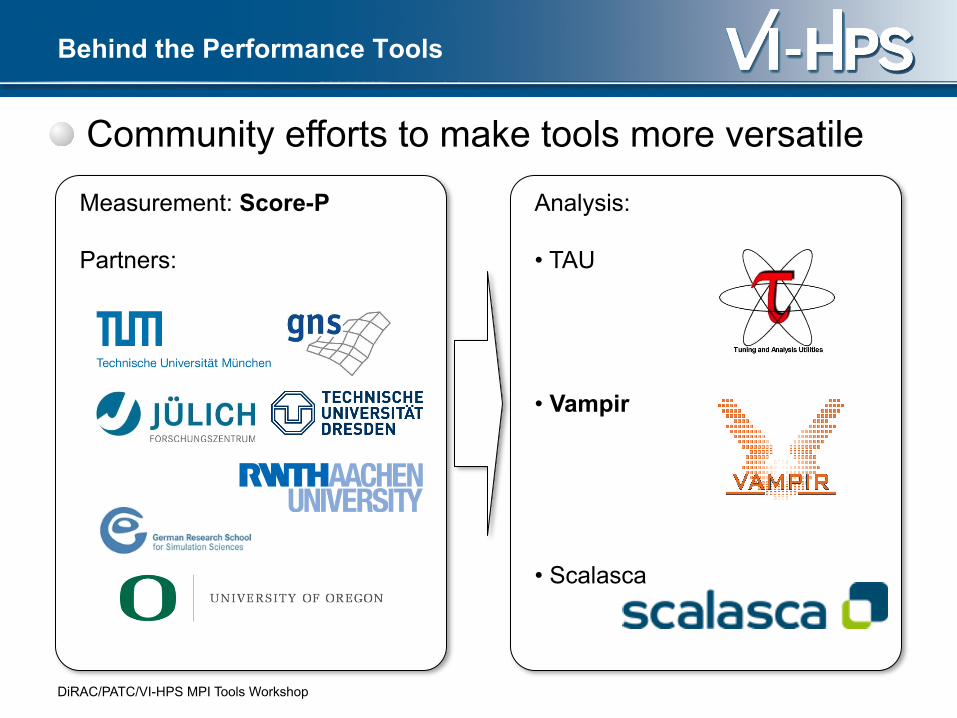
Analysis: • TAU
• Vampir
• Scalasca
Measurement: Score-P Partners:
Community efforts to make tools more versatile
Behind the Performance Tools

DiRAC/PATC/VI-HPS MPI Tools Workshop
MUST Developers: Goal: - Scalable, Push-button,
no false positives
Umpire Developers: Issue: - Scalability, local checks
Marmot Developers: Issue: - Lack of Non-local checks
Merging runtime MPI correctness approaches
Behind the Correctness Tool MUST
DiRAC/PATC/VI-HPS MPI Tools Workshop
Next
• Before we dive into the VI-HPS tools and their use, we: – Provide basic terms used in performance analysis – Present our performance analysis workflows – Highlight common pitfalls
9

DiRAC/PATC/VI-HPS MPI Tools Workshop
EPCC/DiRAC/ECS MPI Tools Workshop Parallel Performance Engineering
Brian Wylie1 and Tobias Hilbrich2
1Research Center Jülich and 2Technische Universität Dresden
(with content used with permission from tutorials
by Bernd Mohr/JSC and Luiz DeRose/Cray)

DiRAC/PATC/VI-HPS MPI Tools Workshop
Today: the “free lunch” is over
■ Moore's law is still in charge, but ■ Clock rates no longer increase ■ Performance gains only through
increased parallelism
■ Optimizations of applications more difficult
■ Increasing application complexity ■ Multi-physics ■ Multi-scale
■ Increasing machine complexity ■ Hierarchical networks / memory ■ More CPUs / multi-core
✦ Every doubling of scale reveals a new bottleneck!
11

DiRAC/PATC/VI-HPS MPI Tools Workshop
Performance factors of parallel applications
■ “Sequential” factors ■ Computation
✦ Choose right algorithm, use optimizing compiler ■ Cache and memory
✦ Tough! Only limited tool support, hope compiler gets it right ■ Input / output
✦ Often not given enough attention
■ “Parallel” factors ■ Partitioning / decomposition ■ Communication (i.e., message passing) ■ Multithreading ■ Synchronization / locking
✦ More or less understood, good tool support
12

DiRAC/PATC/VI-HPS MPI Tools Workshop
Tuning basics
■ Successful engineering is a combination of ■ The right algorithms and libraries ■ Compiler flags and directives ■ Thinking !!!
■ Measurement is better than guessing ■ To determine performance bottlenecks ■ To compare alternatives ■ To validate tuning decisions and optimizations
✦ After each step!
13

DiRAC/PATC/VI-HPS MPI Tools Workshop
Performance engineering workflow
14
■ Prepare application (with symbols), insert extra code (probes/hooks)
■ Collection of data relevant to execution performance analysis
■ Calculation of metrics, identification of performance metrics
■ Presentation of results in an intuitive/understandable form
■ Modifications intended to eliminate/reduce performance problems
Preparation
Measurement
Analysis
Examination
Optimization
DiRAC/PATC/VI-HPS MPI Tools Workshop
The 80/20 rule
■ Programs typically spend 80% of their time in 20% of the code
■ Programmers typically spend 20% of their effort to get 80% of the total speedup possible for the application
✦ Know when to stop!
■ Don't optimize what does not matter
✦ Make the common case fast!
15
“If you optimize everything, you will always be unhappy.”
Donald E. Knuth

DiRAC/PATC/VI-HPS MPI Tools Workshop
Classification of measurement techniques
■ How are performance measurements triggered? ■ Sampling ■ Code instrumentation
■ How is performance data recorded?
■ Profiling / Runtime summarization ■ Tracing
■ How is performance data analyzed? ■ Online ■ Post mortem
16

DiRAC/PATC/VI-HPS MPI Tools Workshop
Sampling
17
■ Running program is periodically interrupted to take measurement
■ Timer interrupt, OS signal, or HWC overflow ■ Service routine examines return-address stack ■ Addresses are mapped to routines using
symbol table information
■ Statistical inference of program behavior ■ Not very detailed information on highly
volatile metrics ■ Requires long-running applications
■ Works with unmodified executables
Time
main foo(0) foo(1) foo(2)
int main() { int i; for (i=0; i < 3; i++) foo(i); return 0; } void foo(int i) { if (i > 0) foo(i – 1); }
Measurement
t9 t7 t6 t5 t4 t1 t2 t3 t8

DiRAC/PATC/VI-HPS MPI Tools Workshop
Instrumentation
18
Time
Measurement
■ Measurement code is inserted such that every event of interest is captured directly
■ Can be done in various ways
■ Advantage: ■ Much more detailed information
■ Disadvantage: ■ Processing of source-code / executable
necessary
■ Large relative overheads for small functions
int main() { int i; for (i=0; i < 3; i++) foo(i); return 0; } void foo(int i) { if (i > 0) foo(i – 1); }
Time
t1 t2 t3 t4 t5 t6 t7 t8 t9 t10 t11 t12 t13 t14
main foo(0) foo(1) foo(2)
Enter(“main”);
Leave(“main”);
Enter(“foo”);
Leave(“foo”);

DiRAC/PATC/VI-HPS MPI Tools Workshop
Instrumentation techniques
■ Static instrumentation ■ Program is instrumented prior to execution
■ Dynamic instrumentation ■ Program is instrumented at runtime
■ Code is inserted ■ Manually ■ Automatically
■ By a preprocessor / source-to-source translation tool ■ By a compiler ■ By linking against a pre-instrumented library / runtime system ■ By binary-rewrite / dynamic instrumentation tool
19

DiRAC/PATC/VI-HPS MPI Tools Workshop
Critical issues
■ Accuracy ■ Intrusion overhead
■ Measurement itself needs time and thus lowers performance ■ Perturbation
■ Measurement alters program behaviour ■ E.g., memory access pattern
■ Accuracy of timers & counters ■ Granularity
■ How many measurements? ■ How much information / processing during each measurement?
✦ Tradeoff: Accuracy vs. Expressiveness of data
20

DiRAC/PATC/VI-HPS MPI Tools Workshop
Profiling / Runtime summarization
■ Recording of aggregated information ■ Total, maximum, minimum, …
■ For measurements ■ Time ■ Counts
■ Function calls ■ Bytes transferred ■ Hardware counters
■ Over program and system entities ■ Functions, call sites, basic blocks, loops, … ■ Processes, threads
✦ Profile = summarization of events over execution interval
21

DiRAC/PATC/VI-HPS MPI Tools Workshop
Tracing
■ Recording information about significant points (events) during execution of the program
■ Enter / leave of a region (function, loop, …) ■ Send / receive a message, …
■ Save information in event record ■ Timestamp, location, event type ■ Plus event-specific information (e.g., communicator,
sender / receiver, …)
■ Abstract execution model on level of defined events
✦ Event trace = Chronologically ordered sequence of event records
22

Event tracing
void foo() { ... send(B, tag, buf); ... }
Process A
void bar() { ... recv(A, tag, buf); ... }
Process B
MONITOR
MONITOR
sync
hron
ize(
d)
void bar() { trc_enter("bar"); ... recv(A, tag, buf); trc_recv(A); ... trc_exit("bar"); }
void foo() { trc_enter("foo"); ... trc_send(B); send(B, tag, buf); ... trc_exit("foo"); }
instrument
Global trace view
58 A ENTER 1
60 B ENTER 2
62 A SEND B
64 A EXIT 1
68 B RECV A
...
69 B EXIT 2
...
merge
unify
1 foo
2 bar
...
58 ENTER 1
62 SEND B
64 EXIT 1
...
...
Local trace A
Local trace B
foo 1
...
bar 1
...
60 ENTER 1
68 RECV A
69 EXIT 1
...
...

DiRAC/PATC/VI-HPS MPI Tools Workshop
Tracing vs. Profiling
■ Tracing advantages ■ Event traces preserve the temporal and spatial relationships
among individual events (✦ context) ■ Allows reconstruction of dynamic application behaviour on any
required level of abstraction ■ Most general measurement technique
■ Profile data can be reconstructed from event traces
■ Disadvantages ■ Traces can very quickly become extremely large ■ Writing events to file at runtime causes perturbation ■ Writing tracing software is complicated
■ Event buffering, clock synchronization, ...
24

DiRAC/PATC/VI-HPS MPI Tools Workshop
Online analysis
■ Performance data is processed during measurement run ■ Process-local profile aggregation
■ More sophisticated inter-process analysis using
■ “Piggyback” messages
■ Hierarchical network of analysis agents
■ Inter-process analysis often involves application steering to interrupt and re-configure the measurement
25

DiRAC/PATC/VI-HPS MPI Tools Workshop
Post-mortem analysis
■ Performance data is stored at end of measurement run
■ Data analysis is performed afterwards ■ Automatic search for bottlenecks
■ Visual trace analysis
■ Calculation of statistics
26

DiRAC/PATC/VI-HPS MPI Tools Workshop
No single solution is sufficient!
27
✦ A combination of different methods, tools and techniques is typically needed!
■ Analysis ■ Statistics, visualization, automatic analysis, data mining, ...
■ Measurement ■ Sampling / instrumentation, profiling / tracing, ...
■ Instrumentation ■ Source code / binary, manual / automatic, ...

DiRAC/PATC/VI-HPS MPI Tools Workshop
Typical performance analysis procedure
■ Do I have a performance problem at all? ■ Time / speedup / scalability measurements
■ What is the key bottleneck (computation / communication)? ■ MPI / OpenMP / flat profiling
■ Where is the key bottleneck? ■ Call-path profiling, detailed basic block profiling
■ Why is it there? ■ Hardware counter analysis, trace selected parts to keep trace size
manageable
■ Does the code have scalability problems? ■ Load imbalance analysis, compare profiles at various sizes
function-by-function
28

DiRAC/PATC/VI-HPS MPI Tools Workshop
EPCC/DiRAC/ECS MPI Tools Workshop VI-HPS Tools and Workshop Tools
Brian Wylie1 and Tobias Hilbrich2
1Research Center Jülich and 2Technische Universität Dresden

DiRAC/PATC/VI-HPS MPI Tools Workshop
Execution monitoring, checking & debugging
• system/batchqueue monitoring (PTP/SysMon) • lightweight execution monitoring/screening (LWM2) • portable performance counter access (PAPI) • MPI library profiling (mpiP) • MPI execution outlier detection (AutomaDeD) • MPI memory usage checking (memchecker) • MPI correctness checking (MUST) • lightweight stack trace debugging (STAT) • task dependency debugging (Temanejo)
30
DiRAC/PATC/VI-HPS MPI Tools Workshop
Integrated appl. execution profile & trace analysis
• instrumentation & measurement (Score-P, Extrae) • profile analysis examination (CUBE, ParaProf) • execution trace exploration ((Vampir), Paraver) • automated trace analysis (Scalasca) • on-line automated analysis (Periscope)
31

DiRAC/PATC/VI-HPS MPI Tools Workshop
Complementary tools & utilities
• parallel performance frameworks (O|SS, TAU) • performance analysis data-mining (PerfExplorer) • parallel execution parametric studies (Dimemas) • cache usage analysis (kcachegrind) • assembly code optimization (MAQAO) • process mapping generation/optimization (Rubik) • parallel file I/O optimization (SIONlib) • uniform tool/utility installation/access (UNITE)
32

DiRAC/PATC/VI-HPS MPI Tools Workshop
Application execution monitoring, checking & debugging
33

DiRAC/PATC/VI-HPS MPI Tools Workshop
Execution monitoring, checking & debugging
• system/batchqueue monitoring (PTP/SysMon) • lightweight execution monitoring/screening (LWM2) • portable performance counter access (PAPI) • MPI library profiling (mpiP) • MPI execution outlier detection (AutomaDeD) • MPI memory usage checking (memchecker) • MPI correctness checking (MUST) • lightweight stack trace debugging (STAT) • task dependency debugging (Temanejo)
34

DiRAC/PATC/VI-HPS MPI Tools Workshop
• MPI runtime error detection tool
• Open source (BSD license) https://doc.itc.rwth-aachen.de/display/CCP/Project+MUST
• Wide range of checks, strength areas:
- Overlaps in communication buffers
- Errors with derived datatypes
- Deadlocks
• Largely distributed, can scale with the application • Developed by RWTH Aachen, TU Dresden, LLNL & LANL
MUST

DiRAC/PATC/VI-HPS MPI Tools Workshop
• C code:
• Tool Output:
... MPI_Type_contiguous (2, MPI_INTEGER, &newtype); MPI_Send (buf, count, newtype, target,
tag, MPI_COMM_WORLD); ...
Use of uncommitted type
What? Where? Details Who?
MUST Correctness Reports
DiRAC/PATC/VI-HPS MPI Tools Workshop
Need for runtime error checking
• Programming MPI is error-prone • Interfaces often define requirements for function
arguments – non-MPI Example: memcpy has undefined behaviour for
overlapping memory regions
• MPI-2.2 Standard specification has 676 pages – Who remembers all requirements mentioned there?
• For performance reasons MPI libraries run no checks
• Runtime error checking pinpoints incorrect, inefficient & unsafe function calls
37
DiRAC/PATC/VI-HPS MPI Tools Workshop
MUST features
• Local checks: - Integer validation - Integrity checks (pointer validity, etc.) - Operation, Request, Communicator, Datatype & Group
object usage - Resource leak detection - Memory overlap checks
• Non-local checks: - Collective verification - Lost message detection - Type matching (for P2P and collectives) - Deadlock detection (with root cause visualization)
38
DiRAC/PATC/VI-HPS MPI Tools Workshop
STAT
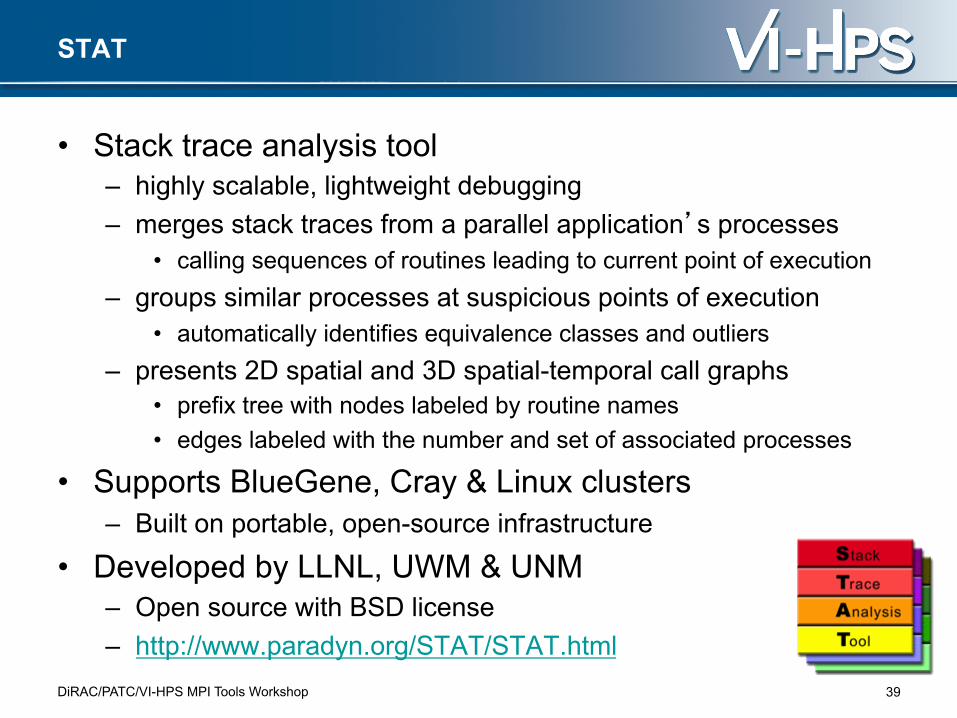
• Stack trace analysis tool – highly scalable, lightweight debugging – merges stack traces from a parallel application’s processes
• calling sequences of routines leading to current point of execution – groups similar processes at suspicious points of execution
• automatically identifies equivalence classes and outliers – presents 2D spatial and 3D spatial-temporal call graphs
• prefix tree with nodes labeled by routine names • edges labeled with the number and set of associated processes
• Supports BlueGene, Cray & Linux clusters – Built on portable, open-source infrastructure
• Developed by LLNL, UWM & UNM – Open source with BSD license – http://www.paradyn.org/STAT/STAT.html
39
DiRAC/PATC/VI-HPS MPI Tools Workshop
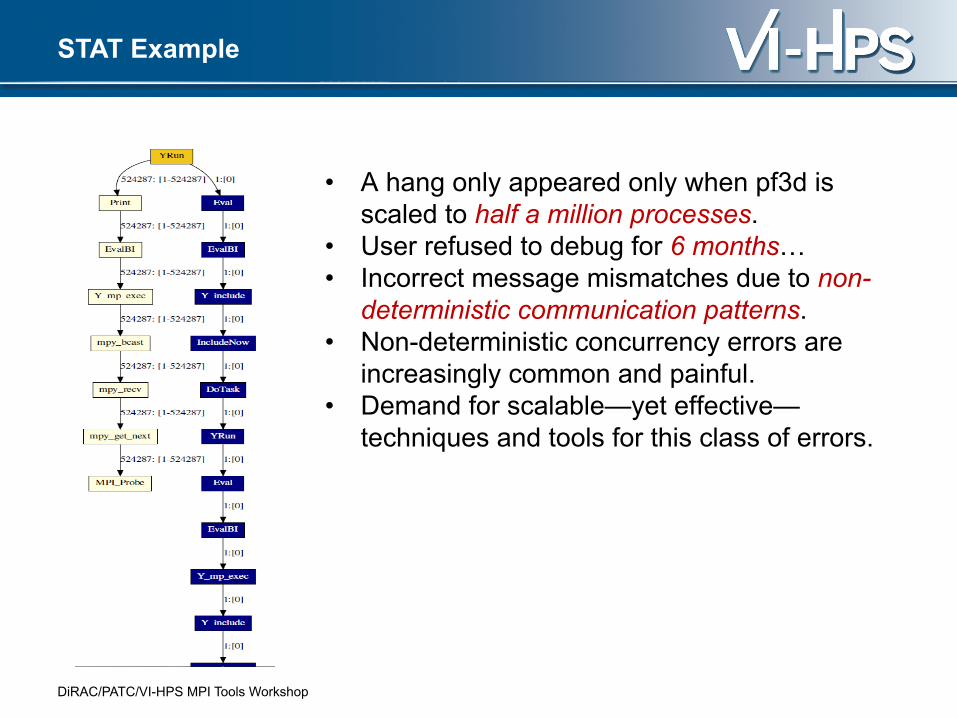
• A hang only appeared only when pf3d is scaled to half a million processes.
• User refused to debug for 6 months… • Incorrect message mismatches due to non-
deterministic communication patterns. • Non-deterministic concurrency errors are
increasingly common and painful. • Demand for scalable—yet effective—
techniques and tools for this class of errors.
STAT Example
DiRAC/PATC/VI-HPS MPI Tools Workshop
Integrated application execution profiling and trace analysis
DiRAC/PATC/VI-HPS MPI Tools Workshop
Integrated appl. execution profile & trace analysis
• instrumentation & measurement (Score-P, Extrae) • profile analysis examination (CUBE, ParaProf) • execution trace exploration (Vampir, Paraver) • automated trace analysis (Scalasca) • on-line automated analysis (Periscope)
42

DiRAC/PATC/VI-HPS MPI Tools Workshop
Analysis: • TAU
• Vampir
• Scalasca
Measurement: Score-P Partners:
Community efforts to make tools more versatile
Behind the Performance Tools
DiRAC/PATC/VI-HPS MPI Tools Workshop
Vampir
• Interactive event trace analysis – Alternative & supplement to automatic trace analysis – Visual presentation of dynamic runtime behaviour
• event timeline chart for states & interactions of processes/threads • communication statistics, summaries & more
– Interactive browsing, zooming, selecting • linked displays & statistics adapt to selected time interval (zoom) • scalable server runs in parallel to handle larger traces
• Developed by TU Dresden ZIH – Open-source VampirTrace library bundled with OpenMPI 1.3 – http://www.tu-dresden.de/zih/vampirtrace/ – Vampir Server & GUI have a commercial license – http://www.vampir.eu/
44

DiRAC/PATC/VI-HPS MPI Tools Workshop
Vampir interactive trace analysis GUI
45

DiRAC/PATC/VI-HPS MPI Tools Workshop
Scalasca
• Automatic performance analysis toolset – Scalable performance analysis of large-scale applications
• particularly focused on MPI & OpenMP paradigms • analysis of communication & synchronization overheads
– Automatic and manual instrumentation capabilities – Runtime summarization and/or event trace analyses – Automatic search of event traces for patterns of inefficiency
• Scalable trace analysis based on parallel replay – Interactive exploration GUI and algebra utilities for XML callpath
profile analysis reports
• Developed by JSC & GRS – Released as open-source – http://www.scalasca.org/
46

DiRAC/PATC/VI-HPS MPI Tools Workshop
Scalasca automatic trace analysis report
47

DiRAC/PATC/VI-HPS MPI Tools Workshop
Course Overview
Thursday: 9:30am-11:00am Introduction, performance analysis
basics, tools overview 11:30am-1:00pm Instrumentation and profiling hands-
on 2:00pm-5:30pm Guided use with own code/examples Friday: 09:30am-11:00am Automatic performance analysis w/
Scalasca, correctness analysis w/ MUST, other VI-HPS tools and Vampir live demo
11:30am-1:00pm Scalasca and MUST Hands-On 2:00pm-5:30pm Guided use with own code/examples
48
Recommended