Prof. Dr. Volker QuaschningHTW Berlin – University of Applied Sciences
Energy Transition in Germany –The Way to a 100% Renewable Electricity Supply
Energy Transition in Germany –The Way to a 100% Renewable Electricity Supply
www.volker-quaschning.de
US Congress Longworth BuildingMarch 12, 2012Washington DC

Prof. Dr. Volker Quaschning
HTW Berlin – University of Applied Sciences
2
Impact of Climate Change
Source: NASA

Prof. Dr. Volker Quaschning
HTW Berlin – University of Applied Sciences
3
Impact of Climate Change
Source: NASA

Prof. Dr. Volker Quaschning
HTW Berlin – University of Applied Sciences
4
High Risk Areas due to Sea Level Rise
+7 m
Washington DC
Gra
phic
: N
orb
ert
Geuder

Prof. Dr. Volker Quaschning
HTW Berlin – University of Applied Sciences
5
High Risk Areas due to Sea Level Rise
Washington DC
Gra
phic
: N
orb
ert
Geuder
+70 m

Prof. Dr. Volker Quaschning
HTW Berlin – University of Applied Sciences
0
5000
10000
15000
20000
25000
30000
35000
40000
1860
1870
1880
1890
1900
1910
1920
1930
1940
1950
1960
1970
1980
1990
2000
2010
2020
2030
2040
2050
CO
2em
issio
ns r
ela
ted to e
nerg
y
Mt
former CO2 emissions
reduction pathfor the two degree target
6
Global Requirements for Climate Protection
data: WRI, IEA, PIK-Potsdam

Prof. Dr. Volker Quaschning
HTW Berlin – University of Applied Sciences
Some Nuclear Incidents with Impact on Germany
7
Chernobylaccident 1986
Forsmarknear-accident 2006
Asseradioactivestorage disaster 2007

Prof. Dr. Volker Quaschning
HTW Berlin – University of Applied Sciences
8
Goals for Renewable Electricity of German Parties
Federal Government
shutdown of nuclear power until 2022>80% renewables until 2050
Opposition
0% 20% 40% 60% 80% 100%
2050
2030
2020
2010
0% 20% 40% 60% 80% 100%
2050
2030
2020
2010
100% renewables until 2030
75% renewables until 2030
0% 20% 40% 60% 80% 100%
2050
2030
2020
2010

Prof. Dr. Volker Quaschning
HTW Berlin – University of Applied Sciences
Installed Renewable Capacity in Germany
9

Prof. Dr. Volker Quaschning
HTW Berlin – University of Applied Sciences
0
100
200
300
400
500
600
7001990
1995
2000
2005
2010
2015
2020
2025
2030
2035
2040
2045
2050
Gro
ss e
lectr
icity d
em
and in
TW
h
fossil power
nuclear power
import (renewable)
photovoltaic
wind power
geothermal power
biomass
hydropower
10
Gross Electricity Demand in Germany
HTW scenario: climate protection and sustainable development
20 % 100 %

Prof. Dr. Volker Quaschning
HTW Berlin – University of Applied Sciences
Power Generation of a 100 % Renewable Power Supply
11
mean monthly power generation and demand
0
10
20
30
40
50
60
70
80
90
solar import
geothermal
hydro power
biomass
wind power
photovoltaics
gross demand
GW

Prof. Dr. Volker Quaschning
HTW Berlin – University of Applied Sciences
Storage Solutions for a Renewable Electricity Supply
12
decentralizedbattery storage
electrolysis
methanization
water
oxygen
hydrogen
carbon dioxide
water
methanenatural gasstorage
natural gaspowerstation
naturalgas grid
heat
electricity
excesselectricity

Prof. Dr. Volker Quaschning
HTW Berlin – University of Applied Sciences
0
20
40
60
80
100
120
1990 1995 2000 2005 2010 2015 2020
coal or nuclear power
PV Germany, roof
PV Germany, open space
PV North Africa
wind power
domestic electricity price
ct/kWh
Development of Electricity Prices
13
grid parity

Prof. Dr. Volker Quaschning
HTW Berlin – University of Applied Sciences
0
10
20
30
40
50
602004
2005
2006
2007
2008
2009
2010
2011
2012
2013
2014
2015
2016
2017
2018
2019
2020
ct/
kW
h
domestic PV
domestic fuel oil +5% .p.a.
domestic fuel oil +3% p.a.
domestic fuel oil +1% p.a.
Cost Development of Domestic Fuels
14
Assumptions: Boiler efficiency 80%, calorific value of fuel oil 10.5 kWh/l
oilparity
Prof. Dr. Volker Quaschning
HTW Berlin – University of Applied Sciences
0
5000
10000
15000
20000
25000
30000
35000
40000
45000
1995 2000 2005 2010 2015 2020 2025 2030 2035 2040 2045 2050
TWh
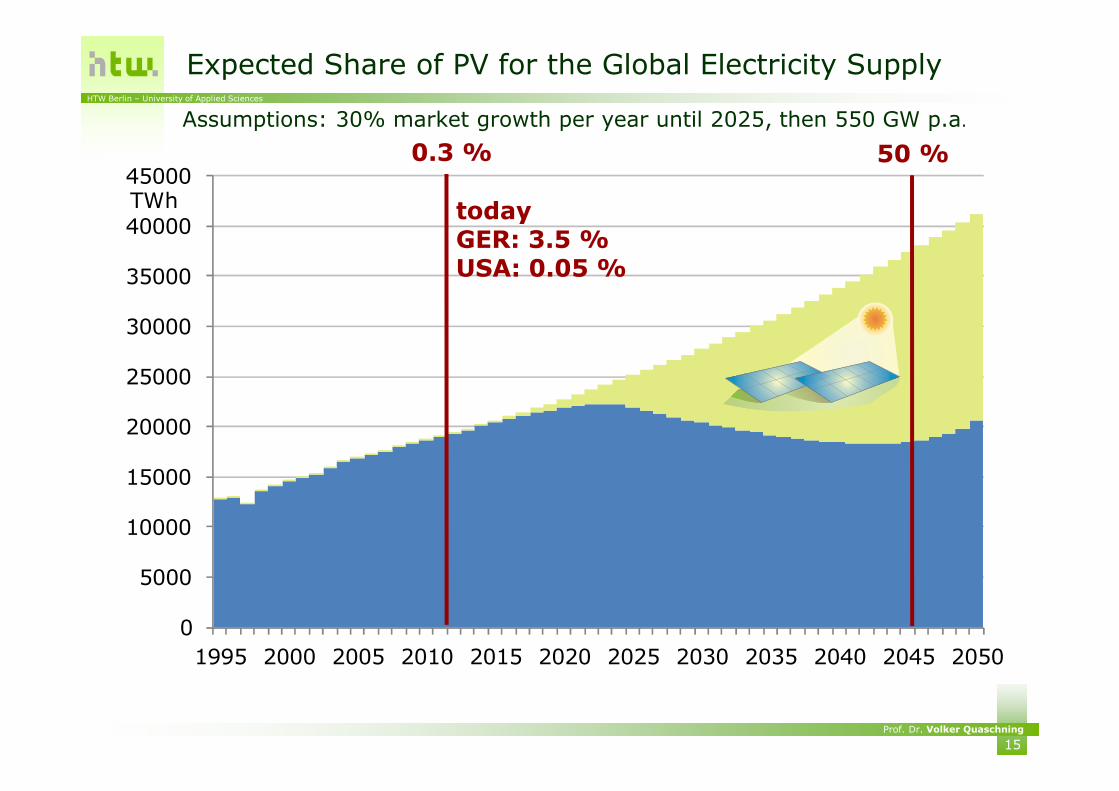
Expected Share of PV for the Global Electricity Supply
15
0.3 % 50 %
Assumptions: 30% market growth per year until 2025, then 550 GW p.a.
todayGER: 3.5 %USA: 0.05 %

Prof. Dr. Volker Quaschning
HTW Berlin – University of Applied Sciences
Thank you for your Attention
16
www.volker-quaschning.de
For further reading…
Recommended