IADIS International Journal on WWW/Internet
Vol. 11, No. 2, pp. 49-61
ISSN: 1645-7641
49
E-GOVERNMENT IMPACT IN DOING BUSINESS
DIMENSIONS, CORRUPTION PERCEPTION,
ENTREPRENEURIAL ATTITUDES AND
ACTIVITIES
Deborah Moraes Zouain. The Brazilian School of Public and Business Administration - Getulio
Vargas Foundation Praia de Botafogo, 190 - Botafogo, Rio de Janeiro - RJ, 22250-040
Gustavo de Oliveira Almeida. The Brazilian School of Public and Business Administration –
Getulio Vargas Foundation Praia de Botafogo, 190 - Botafogo, Rio de Janeiro - RJ, 22250-040
ABSTRACT This article seeks to understand the impact of e-government readiness on ease of doing business,
Corruption Perception and its relationships the on the attitude toward entrepreneurship and rate of new
entrepreneurs. Data was collected from various databases, for the years 2008, 2010 and 2012 using a
panel data study design. The study several reports: Doing Business Report from World Bank,
E-Government Survey from the United Nations, Corruption Perception Index by Transparence
International and GEM data from Global Entrepreneurship Monitor. Nonparametric correlation analysis
and other statistical tests were performed. A model based on Azjen’s Theory of Reasoned Action (with
attitude, subjective norms and perceived control of behavior) was employed to predict entrepreneurial
intention, and new business rate using the methodology of the partial least squares. The model was able
to predict over 57% of the intention of starting a new business, which in turn predicted over 55 % of the
rate of new business in the sample of countries and years considered (2008, 2010 and 2012). Future
research to understand the real of impact of e-government is suggested.
KEYWORDS
E-Government; Entrepreneurship; Doing Business; Attitudes; New Business
1. INTRODUCTION
International research concerning e-government, its effects and benefits still is in the initial
stages. Even though the volume of publications is growing, the first relevant articles only
started to emerge in the 1990’s, and did not receive much attention until the start of the 2000

IADIS International Journal on WWW/Internet
50
decade. According to the Zouain, Almeida and Mahecha (2013) e-government is the most
commonly cited term according to literature findings, but other terms like e-governance,
online government, digital government, one-stop government, and electronic government,
among others have been used interchangeably, although some authors point conceptual
difference between them (Layne & Lee, 2001).
Consequently, the definition of what is e-government is still under construction; given that
the term often carry many related meanings. For instance, West (2005) presents e-government
as ‘‘public sector use of the Internet and other digital devices to deliver services, information,
and democracy itself” (p. 1). Lau, Aboulhoson, Lin, and Atkin (2008) define it as the process
of connecting citizens digitally to their government so it becomes possible to use information
and services offered by government agencies. Howard (2001) defines e-government as the
application of the tools and techniques of e-commerce to build the government interface with
its stakeholders, focusing on cost reduction, efficiencies and gains of scale.
It is important is to be aware that most definitions highlight that e-government does not
mean the mere use of information technology (IT) in the government. Instead it represents the
introduction of a new interface with governmental stakeholders, since even long before the
Internet had emerged in the late 1980s governments around the world were already actively
pursuing IT solutions to improve operational efficiency, costs saving and data management
(Brown 1999; Norris & Kraemer 1996).
However, modern forms of interaction between government and the stakeholders have
emerged more recently. Due to the high growth of social media sites, Web 2.0 and related
technologies, the e-government became more participative following these Internet trends. In
this new form of interaction the e-government is becoming more consultative, with a two-way
relationship, using citizens’ opinions and suggestions, and sporting a much higher
participation of the citizens to support the definition of policies and priorities to the
government, and providing a higher transparency of the government actions and spending
(Halpern and Katz, 2012).
Business also can potentially benefit from a fast, responsive and complete e-government
strategy. These characteristics are known as enablers for enterprise creation and maintenance,
as measured by The Doing Business Report (World Bank, 2011). The Doing Business Report
provides a quantitative measure of regulations for starting a business, dealing with
construction permits, employing workers, registering property, getting credit, protecting
investors, paying taxes, trading across borders, enforcing contracts and closing business—
as they apply to domestic small and medium-size enterprises (World Bank, 2011).
A better e-government strategy could, in theory, also diminish the corruption perception
via added transparency and accountability of governmental transactions (Xenos & Moy, 2007)
and provide easier access to services to start or operate a business, avoiding chances for
corruption, since the procedures tend to be fast, functional and well reported. This would make
a country more competitive with lower corruption and easier to conduct business, potentially
resulting in creation of new firms.
Reduction of administrative costs, and time spent on government employees also are
indicated as results of successful implementation of e-government (Jaeger, 2003). Gupta and
Jana (2003) state that e-government is no longer just an option but a necessity for countries
aiming for better governance. Similarly, Brunetti and Weder (2003) point out that free press
has a strong association between level of press freedom and level of corruption across
countries, even when using various instruments to measure freedom and corruption.

E-GOVERNMENT IMPACT IN DOING BUSINESS DIMENSIONS, CORRUPTION PERCEPTION,
ENTREPRENEURIAL ATTITUDES AND ACTIVITIES
51
The United Nations (UN) has created an index known as e-government Readiness Index,
as an initiative to measure the progress of the adoption of the electronic government solutions
in different countries composed by three sub-indexes: (four in 2012 e-government Readiness
Index) online service, human capital, telecommunication infrastructure and e-participation
indexes (UN, 2011). The e-readiness concept was created to provide a unified framework to
evaluate the breadth and depth of the digital divide between more and less developed countries
(P. Hanafizadeh, M.R. Hanafizadeh, & Khodabakhshi, 2009).
The Web Measure Index 2008 is based upon a five-stage model (Andersen & Henriksen,
2006), while in the 2010 report it was renamed to Online Service Development (United
Nations, 2011), both were built upon the previous levels of sophistication of an UN Member
State’s online presence. As a country goes upwards through the various stages, it is ranked
higher in the Web Measure Index (United Nations, 2009).
The Connected Government Stage is the most developed level of sophistication of the e-
government and implies a governmental transformation into a connected entity that responds
to the needs of its citizens by the development of an integrated back office. It also means a
greater connection with different levels of governmental agencies (i.e., local, federal, state),
between citizens and government, and between the citizen, government, and all stakeholders
(United Nations, 2009).
In the past decade the most developed nations have made greater progress in the
implementation of e-government solutions, especially the most developed European countries,
U.S., South Korea and Japan, letting most of the world in a more modest state of adoption of
more sophisticated e-government (Alomari, Woods & Sandhu, 2012; Khalil, 2011).
Dunleavy, Margetts, Bastow and Tinkle (2007) state that governments around the world
spend every year billions of dollars in IT systems, in many countries it costs around 1.5 per
cent of GDP yearly, for instance, the United Kingdom alone commits 14 billion £ a year to
support public sector IT operations. Therefore, the level of e-government sophistication varies
widely across the globe, since it requires substantial investment to enhance infrastructures as
well as services to citizens (Ebrahim, & Irani, 2005).
In a study conducted by Zhao (2011), high correlations were found between GDP per
capita and e-government development index (r=0.69) and the telecommunication
infrastructure index (r=0.81), indicating that the level of economic development of a country is
one of the major factors affecting the development of e-government and telecommunication
infrastructures. Likewise, Khalil’s (2011) study found that GDP explains 53% of the variance
in e-government readiness.
Similarly, countries worldwide also significant a huge amount of resources to encourage,
support and stimulate citizens to start new business (WONGLIMPIYARAT, 2009). The idea
that the growth of small companies contributes to the economic prosperity is universally
accepted (MARTIN & PICAZO, 2009). Regardless, the entrepreneurial rates and conditions
vary widely between countries (BAUMOL, 1990, p.898), indicating that the entrepreneurial
process has innumerous variables and particularities. Shapero and Sokol (1982) indicate that
the convergence of attitudes and situational factors that spur a person to the start a business.
Robinson, Shaver and Wrightsman (1991) define attitude as a learned predisposition to behave
in a consistently favorable or unfavorable manner with respect to a given object.
One of the most used models to explain relationship between attitudes and behavior is the
Theory of Reasoned Action (TRA) (Fishbein & Ajzen, 1975). The authors affirm that attitudes
and subjective norms should be combined to determine the intentions of behavior, which in
turn would initiate the actual behavior or action. Ajzen (2011) also indicates that human

IADIS International Journal on WWW/Internet
52
action is influenced by three different factors: a positive or negative evaluation of a behavior
(attitude), a social pressure to realize or not the behavior (subjective norms) and the perception
of being able to execute the behavior (self-efficacy).
Therefore, due to the nature of the data available, this study attempted to link the macro
sociologic and micro sociologic approaches to understand how individual level attitudes,
perceptions and intentions (like entrepreneurial intention, desirability of entrepreneurial
career, etc.) and can be related (impact or be impacted) to country level behaviors and
characteristics (doing business dimensions, e-government readiness, etc.).
According to Collins (1981) macrosociology is the analysis of events of large scale and of
long-term impact, in aggregate levels like organizational, societal regional and cultural, while
considering the macro sociological concepts as an aggregation of micro-events. The use of the
multi-level sociological analysis is widely employed in many areas of the Social Sciences
(Collins, 1981) and is considered an important and promising research approach (Borgatta,
1992).
In this paper, the impact of e-government readiness on corruption perception, the ease of
doing business (macro level – country) and entrepreneurial attitudes (individual level –
aggregated) were used to predict the intention of starting a business (also an individual level
measure aggregated), on a model based on the TRA (Azen, 2011).
2. METHOD
This study used a panel design. Panel data means that a variable is measured more than once
for the same subject, in different time periods. According to Hsiao (2003), panel data have
been increasing popular mostly because there is a trend of a greater availability of data in this
format, which is more able to answer substantial questions than a single set of indicators
measured in a single point time that is usually found in cross sectional data. Although the use
of panel data does not support the implication of causality, it certainly gives a stronger support
in making assumptions about causality and directions of observed effects in many research
areas.
The study can be classified as a non-experimental, since it uses survey data. The data used
in this study is secondary, that is, other researchers or organizations collected it. All data and
databases selected in this study are widely employed in many researches and were collected
and compiled by internationally recognized institutions, such as World Bank, United Nations
and others, which contribute to the validity and reliability of the data.
In addition, the study can be classified as a correlational study, since it is conducted to
determine the relationship between variables (MARCZYK et al, 2005), even though it
employs additional techniques such as partial least squares (PLS) modelling.
The statistical analysis were performed with the software: SPSS 20.0 (IBM) and
SMARTPLS 2.0, employed to compute non-parametric correlations, partial least square model
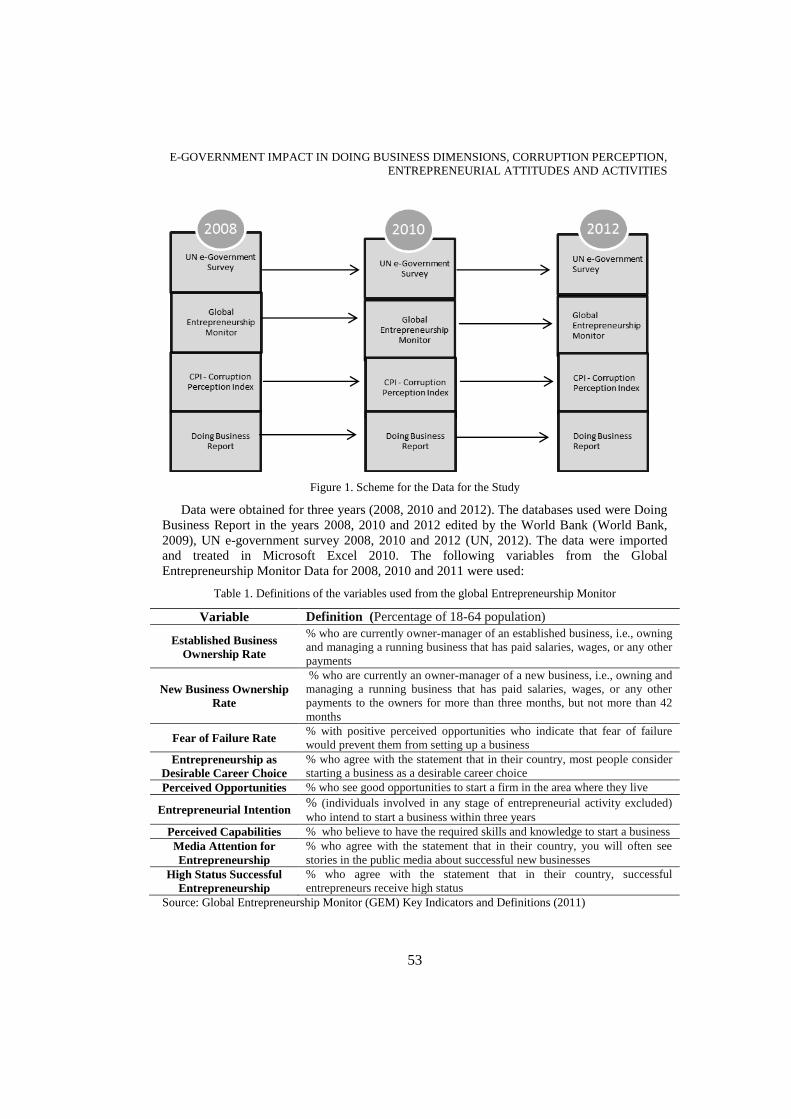
specification, and data input, analysis and treatment. The figure 1 shows the study design:
E-GOVERNMENT IMPACT IN DOING BUSINESS DIMENSIONS, CORRUPTION PERCEPTION,
ENTREPRENEURIAL ATTITUDES AND ACTIVITIES
53
Figure 1. Scheme for the Data for the Study
Data were obtained for three years (2008, 2010 and 2012). The databases used were Doing
Business Report in the years 2008, 2010 and 2012 edited by the World Bank (World Bank,
2009), UN e-government survey 2008, 2010 and 2012 (UN, 2012). The data were imported
and treated in Microsoft Excel 2010. The following variables from the Global
Entrepreneurship Monitor Data for 2008, 2010 and 2011 were used:
Table 1. Definitions of the variables used from the global Entrepreneurship Monitor
Variable Definition (Percentage of 18-64 population)
Established Business
Ownership Rate
% who are currently owner-manager of an established business, i.e., owning
and managing a running business that has paid salaries, wages, or any other
payments
New Business Ownership
Rate
% who are currently an owner-manager of a new business, i.e., owning and
managing a running business that has paid salaries, wages, or any other
payments to the owners for more than three months, but not more than 42
months
Fear of Failure Rate % with positive perceived opportunities who indicate that fear of failure
would prevent them from setting up a business
Entrepreneurship as
Desirable Career Choice
% who agree with the statement that in their country, most people consider
starting a business as a desirable career choice
Perceived Opportunities % who see good opportunities to start a firm in the area where they live
Entrepreneurial Intention % (individuals involved in any stage of entrepreneurial activity excluded)
who intend to start a business within three years Perceived Capabilities % who believe to have the required skills and knowledge to start a business
Media Attention for
Entrepreneurship
% who agree with the statement that in their country, you will often see
stories in the public media about successful new businesses
High Status Successful
Entrepreneurship
% who agree with the statement that in their country, successful
entrepreneurs receive high status
Source: Global Entrepreneurship Monitor (GEM) Key Indicators and Definitions (2011)

IADIS International Journal on WWW/Internet
54
Finally, the last report utilized was the Corruption Perception Index (CPI), that measures
the perceived level of public-sector corruption in 180 countries and territories around the
world (Transparency International, 2010), for 2008, 2010 and 2012.
Concerning GEM data, when the data was analyzed, the GEM 2011 was the most updated
year, and was used as a proxy for 2012 data. During the presentation of the results, some
indicators were inverted to provide an easier interpretation of the correlation coefficients; and
are represented with (INV).
3. ANALYSIS
After the consolidation, test for errors, and visual inspection, the distribution of the data was
tested by the Kolmogorov-Smirnov one-sample test. The null hypothesis of this procedure
states that the distribution is normal, and p-values higher than 0.05 indicate that the data has
an approximately normal distribution, and therefore suited to undergo tests and procedures
that require the normality to provide adequate results (HAIR et al, 2010).
The results indicated that the majority of the variables tested did not have a normal
distribution. Just four variables had non-significant results (i.e p-value> 0.05), that means that
the distribution is normal: E-government index (Z=1.142; p=0.147), % respondents that think
that having a new business is desirable career choice (Z=0.961; p=0.314), % respondents
agree entrepreneurship has high status (Z=1.112; p=0.168) and % respondents that see
opportunities where they live (Z=0.662; p=0.774). All others variable were non-normal.
Given the results, the Spearman’s correlation coefficient was used to understand the
relationship between the variables. According to Miles and Shevlin (2001) when the
relationship between two variables is not normally bi-variate or when one is measured at a
ordinal level, the Pearson coefficient may not be the best estimative. The Spearman coefficient
measures the intensity of relationship using ranking position instead of the observed values
(Miles & Shevlin, 2001). The results are presented in the table 2:
Table 2. Spearman correlations between E-government ranking and ease of doing business rankings
E-Government
ranking (INV)
Corruption
Perception
New Business
Ownership
E-Government Ranking (INV) 1,000 ,742** -,540**
Corruption Perception Index ,742** 1,000 -,514**
Doing Business - Closing a Business (INV) ,657** ,660** 1,000
Doing Business - Construction Permit (INV) ,365** ,491** -,417**
Doing Business - Enforcing Contracts (INV) ,561** ,508** -,252**
DB - Ease of doing business ranking (INV) ,777** ,785** -,318**
Doing Business - Getting Credit (INV) ,639** ,541** -,411**
Doing Business - Paying taxes (INV) ,363** ,530** -,294**
Doing Business - Protecting investors (INV) ,457** ,431** -,194**
Doing Business -Registering property (INV) ,481** ,438** -,170*
Doing Business - Starting a business (INV) ,488** ,528** -,112
DB - Trading (INV) ,668** ,733** -,357**
**. Correlation is significant at the 0.01 level (2-tailed). (INV) –variables inverted to provide easier
interpretation. *. Correlation is significant at the 0.05 level (2-tailed).

E-GOVERNMENT IMPACT IN DOING BUSINESS DIMENSIONS, CORRUPTION PERCEPTION,
ENTREPRENEURIAL ATTITUDES AND ACTIVITIES
55
For the data relations considered, a higher ranking in e-government readiness was
associated with lower Corruption Perception. In addition, the dimensions of Ease of Doing
Business were inversely associated with perception of corruption.
Tests performed indicate that there is no significant difference between the attitudes and
activities in the years 2008 2009 and 2012 (ANOVA test, p statistic ranging from 0.331 to
0.773), indicating that these attribute tend to be constant throughout the years, although all
indicators are widely unequal between countries (F statistic ranging from 9.06 to 40.706,
p<0.001).
Furthermore, the ranking scores were inverted to allow an easier interpretation of the
results, since a high CPI indicates low perception of corruption. It means that the better a
given country ranks in e-government readiness and ease of doing business, the less corrupt it
appears. Nevertheless, countries with better ranking on doing business, and e-government
readiness seem to sport a lower rate of population owning a new business than the countries
that are more perceived as corrupt.
Table 3. Correlations between entrepreneurship attitudes and activities
1 2 3 4 5 6 7 8 9
New Bus. Owner. Rate(1) 1,000 , 515** ,732** -,291** ,704** ,494** ,449** ,342** ,554**
Perceived Opport.(2) ,515** 1,000 ,279** -,256** ,494** ,349** ,333** ,351** ,577**
Estab. Bus Owner. (3) ,732** ,279** 1,000 -,221** ,424** ,211** ,324** ,262** ,350**
Fear of Failure Rate (4) -,291** -,256** -,221** 1,000 -,240** -,240** -,116 -,074 -,445**
Ent. Intention (5) ,704** ,494** ,424** -,240** 1,000 ,562** ,272** ,288** ,647**
Ent. Desirable Career (6) ,494** ,349** ,211** -,240** ,562** 1,000 ,358** ,447** ,553**
Media Attention (7) ,449** ,333** ,324** -,116 ,272** ,358** 1,000 ,380** ,241**
High Status Ent. (8) ,342** ,351** ,262** -,074 ,288** ,447** ,380** 1,000 ,280**
Perceived Capabil. (9) ,554** ,577** ,350** -,445** ,647** ,553** ,241** ,280** 1,000
**. Correlation is significant at the 0.01 level (2-tailed).
The correlation analysis indicate that the higher percentage of the population perceive
opportunities to start a firm, and where entrepreneurship holds a higher status as an
occupation, and a more favorable media coverage, people tend to have less fear of failure to
start a business, and are more willing to start a new business in the next three years. These
countries also have a present with a higher rate of new business.
After performing the correlational analysis, a Partial Least Squares (PLS) model was
specified to regress the various predictors into the new business owner rate. Rigdon (1998)
point out that structural equation modeling (SEM) has taken up a prominent role within the
academic literature of many fields.
The partial least squares approach to SEM (or PLS path modeling), was originally
developed by Wold (1966), and is an alternative to the more prominent covariance-based
method.
In PLS the explained variance of the endogenous latent variables is maximized by
estimating partial model relationships in an iterative sequence of ordinary least squares (OLS)
regressions. Other advantage is that PLS path modeling is a soft-modeling technique that has
less rigid distributional assumptions on the data (Hair, Ringle, & Sarstedt, 2011).
For this procedure were selected the variables that could be possible predictors of new
business, according to the literature review, and then those variables were inserted in
SmartPLS software version 2.0. To emulate Azjen’s (2011) components of the Theory of

IADIS International Journal on WWW/Internet
56
Reasoned Action we used the Perceived Opportunities and Entrepreneurship as Desirable
Career as the Altitudinal component, the variables High Status Entrepreneurship and Media
Attention for Entrepreneurship as the Subjective component and perceived capabilities as the
Perceived Behavioral Control component.
Furthermore the other variables were e-government ranking (INV), Doing Business
Ranking (INV), Corruption Perception Index, and as the dependent variables, we have
selected new business ownership rate and entrepreneurial intention. The model, with the
associated statistics, is available in figure 2:
Figure 2. PLS Model Estimation of entrepreneurial intention and new business ownership rate
The model was able to explain almost 56% of the variance on the rate of new
entrepreneurs (r2=0.554; p<0.000). In a similar way, the proposed three components of
attitude toward entrepreneurship, subjective norms and perceived control of behavior,
explained almost 58 % of the entrepreneurial intention.
Although the e-government was positively correlated, and predicted very well doing
business ranking position (r2=0.510; p<0.000) and lower perception of corruption (r2=0.686;
p<0.000), it did not influence positively the entrepreneurial intention, and only had a marginal
impact in the rate of new business.
To access the statistical significance of the path coefficients a bootstrapping with 1000
resampling was performed. Boot strapping is a resampling method for assigning measures of
accuracy to sample estimates, allowing the estimation of the distribution of almost any statistic
(Efron & Tibshirani, 1993). In addition, the bootstrapping is robust to violations of normality
of the data, which is in turn, an assumption of most parametric techniques.
Additionally, another feature of PLS (and SEM family of analysis) is that the relationship
between variables can be better modelled than in regular linear regression models, since it
allows for the calculation of direct, indirect and total effects. The calculation of the total effect

E-GOVERNMENT IMPACT IN DOING BUSINESS DIMENSIONS, CORRUPTION PERCEPTION,
ENTREPRENEURIAL ATTITUDES AND ACTIVITIES
57
is important to understand relationships modeled that employ a more complex logic of inter-
relationships that are better representations of real world phenomena.
Although all effects were calculated (direct, indirect and total), for the sake of the
simplicity, only the total effects and bootstrap related statistics are displayed in table 4:
Table 4. Boot strapping - Total effects and related statistics
Effect
(Endogenous -> Exogenous)
Original
Sample
(O)
Sample
Mean
(M)
Std Dev Std
Error
T
Statistic
Attitude -> Ent. Intention 0,2612 0,2648 0,0435 0,0435 6,0063
Attitude -> New Business Rate 0,2011 0,2039 0,0350 0,0350 5,7493
Corruption Percep. -> Entr. Intention -0,2411 -0,2413 0,0380 0,0380 6,3480
Corruption Perception -> New Business Rate -0,1650 -0,1641 0,0469 0,0469 3,5173
DB Ranking -> Corruption Perception 0,4383 0,4395 0,0306 0,0306 14,3041
DB Ranking -> Entrepreneurial Intention -0,2099 -0,2107 0,0391 0,0391 5,3663
DB Ranking -> New Business Rate -0,1260 -0,1275 0,0516 0,0516 2,4405
Entr Intention -> New Business Rate 0,7701 0,7698 0,0333 0,0333 23,1451
Perceived C. of Behavior -> Ent. Intention 0,2651 0,2607 0,0372 0,0372 7,1161
Perceived C. of Behavior -> New Bus. Rate 0,2041 0,2010 0,0319 0,0319 6,3969
Subjective Norms -> Ent. Intention 0,0969 0,0977 0,0347 0,0347 2,7892
Subjective Norms -> New Business Rate 0,0746 0,0753 0,0272 0,0272 2,7475
E-gov ranking -> Corruption Perception 0,7691 0,7688 0,0120 0,0120 64,0158
E-gov ranking -> DB rank 0,7144 0,7135 0,0213 0,0213 33,4746
E-gov ranking -> Entrepreneurial Intention -0,2599 -0,2605 0,0295 0,0295 8,7961
E-government ranking -> New Business Rate -0,1653 -0,1661 0,0303 0,0303 5,4501
Parameters: Missing Values - Case Wise replacement- 549 cases (all periods included) - 1000 resampling performed
The results of the boot strapping show that all total effects were statistically significant (t-
statistic ranging from 2.774 to 64.015). The higher effect was from E-government to
Corruption Perception with a path coefficient of 0.7691 (p<0.001), the lower was from the
Subjective Norms Component, composed of high status and positive media depiction of
entrepreneurship, to New Business Rate with a path coefficient of 0.0746 (p=0.005).
Since the e-government readiness is composed by the three sub-indexes: human capital,
infrastructure and online services, an additional correlation analysis was performed, and infra-
structure was the most related index to new business rate, again in an inverse relationship, as
seen in figure 3:

IADIS International Journal on WWW/Internet
58
Figure 3. E-government readiness and infrastructure compared with new business rate.
The figure 3 shows a multi-year representation that shows a clear pattern indicating that
the less developed countries (using infrastructure as a proxy) have a significantly higher
percentage of owner or manager of a new business in three years considered. These countries
seem to be economies that have been sporting a recent growth in recent years. This fact lead to
a spurious correlation, that in a first sight would suggest that e-government and better business
atmosphere (as measured by doing business indicators) would be in detrimental to new
business creation, but in fact indicate that other factors that are driving growth in those
countries despite the difficulty to conduct business in those economies.
4. CONCLUSION
The results were in the most part according to the expected relationships according to the
literature review, indicating that the e-government readiness is highly related with the ease of
doing business dimensions and with lower perception of corruption in the studied countries. In
addition, in the model that was specified to test Azjen’s Theory of Reasoned Action in context
of entrepreneurship was also statistically significant, predicting over 57% of the intention of
starting a new business, which in turn predicted over 55 % of the rate of new business in the
sample of countries and years considered (2008, 2010 and 2012).
E-GOVERNMENT IMPACT IN DOING BUSINESS DIMENSIONS, CORRUPTION PERCEPTION,
ENTREPRENEURIAL ATTITUDES AND ACTIVITIES
59
An important feature of PLS methodology that was used is to calculate the total effect, that
is, direct and indirect effects, and its significance. These results show that all considered
relationships were statistically significant, although the sign of the impact of e-government
readiness ranking, doing business ranking and corruption perception index were all negative.
This result can be attributed to the lower growth of the more developed countries in the
considered years, coupled with a lower intention to start a new business, probably due to
economic crisis and governmental austerity measures, mainly in European countries. To test
this hypothesis future research should run models with different groups, and considering GDP
growth and other variables to corroborate those affirmations.
In the same way, it is always important to note that the composition formula for the e-
government readiness index indicates that to furnish a successful web-presence is not the sole
answer for a successful e-govern implementation (UN, 2009).
The dimensions of formal education and infrastructure are determinant to the use of the
electronic platforms by the recipients, the country citizens. The more prepared the population
is to use the tools provided, the higher would be the effectiveness of a given e-govern
initiative. Several studies point out that in the implementation of e-government projects the
main problems usually are not technical, but instead were policy issues (EGOV, 2003).
Also, although e-government can help the establishment of entrepreneurship, many other
factors are at play including economic and social variables that were not considered in this
research, and in most cases are not within e-government possible range of interference. For the
future research, we suggest that the way in which the e-government initiatives impacts
developed and in development countries be investigated, using divided samples, and
additional databases, and other research designs, including case studies.
REFERENCES
AJZEN, I., 2011. Behavioral Interventions: Design and Evaluation Guided by the Theory of Planned
Behavior. In M.M Mark, S.I. Donaldson, B. Campbel (Eds.) Social Psychology And Evaluation. (pp. 72-100) New York: GUILFORD PRESS.
ANDERSEN, K.V, HENRIKSEN, H. Z., 2006. E-government maturity models: Extension of the Layne and Lee model. Government Information Quarterly, 23, pp. 236–248.
BORGATTA, E. F. 1992. Encyclopedia of Sociology: Volume 3, Simon & Schuster Macmillan.
BROWN, D. M., 1999. Information Systems for Improved Performance Management: Development
Approaches in U.S. Public Agencies. In Reinventing Government in the Information Age.
International Practice in IT-Enabled Public Sector Reform, edited by Richard Heeks, pp. 113–34.
London: Routledge.
BRUNETTI, A., WEDER, B., 2003. A free press is bad news for corruption. Journal of Public Economics, 87, pp. 1801–1824.
CARTER,L. BÉLANGER,F., 2005.The utilization of e-government services: citizen trust, innovation and acceptance factors. Information Systems Journal, 15, pp. 5–25.
CARTER, L., WEERAKKODY, V., 2008. E-government adoption: A cultural comparison, Inf Syst Front, 10, pp. 473–482.
COLLINS, R. 1981. On the Microfoundations of Macrosociology. American Journal of Sociology, Volume 86, number 5.
DAVIS, F., 1989. Perceived usefulness, perceived ease of use and user acceptance of information technology. MIS Quarterly, 13, pp. 319–340.

IADIS International Journal on WWW/Internet
60
EBRAHIM, Z., & IRANI, Z., 2005. E-government adoption: Architecture and barriers. Business Process Management Journal, 11(5), pp. 589−612.
EFRON, B.; TIBSHIRANI, R., 1993. An Introduction to the Bootstrap. Boca Raton, FL: Chapman & Hall/CRC.
EGOV, 2003. E-government strategy: Implementing the President’s management agenda for e-
government. Available: http://www.whitehouse.gov/omb/egov/ 2003egov_strat.pdf. Access in:
5/1/2010.
FISHBEIN, M. AJZEN I. Belief, Attitude, Intention and Behavior: An Introduction to Theory and
Research. Addison-Wesley, Reading, MA, 1975.
GIL-GARCIA, J.R, PARDO, A.T., 2005. E-government success factors: Mapping practical tools to
theoretical foundations, Government Information Quarterly, 22, pp. 187–216.
GRIGOROVICI, D. M., SCHEMENT, J. R., & TAYLOR, R. D., 2003. Weighing the intangible: Towards a framework for information society indices. Pennsylvania University Park, PA, USA.
GUPTA, M.P., JANA, D., 2003. E-government evaluation: A framework and case study. Government Information Quarterly, 20, pp. 365–387.
HSIAO, C., (2003), Analysis of Panel Data, Second Edition, Cambridge University Press.
HAIR, J., BLACK, W., BABIN, B., ANDERSON, R. Multivariate data analysis (7th ed.): Prentice-Hall, Inc. Upper Saddle River, NJ, USA. 2010.
HAIR JF, RINGLE CM, SARSTEDT, M., 2011. PLS-SEM: Indeed a Silver Bullet." Journal of Marketing Theory and Practice, 19(2), 139-151.
HANAFIZADEH, P., HANAFIZADEH, M.R., KHODABAKHSHI, M., 2009. Taxonomy of e-readiness assessment measures. International Journal of Information Management, 29, 189–195.
HOWARD, M., 2001. E-government across the globe: How will “e” change government? Government Finance Review, 17(4), 6-9.
JAEGER, P.T, 2003. The endless wire: E-government as global phenomenon. Government Information
Quarterly , 20, 323–33.
JAEGER, P.T; THOMPSON, K.M., 2003. E-government around the world: Lessons, challenges, and future directions, Government Information Quarterly, 20 (2003) 389–394
JORGENSEN, D. & CABLE, S., 2002. Facing the challenges of e-government: a case study of the city of Corpus Christi, Texas. SAM Advanced Management Journal, 67, 15– 22.
LAU, T., ABOULHOSON, M., LIN, C., ATKIN, D. (2008). Adoption of E-government in three Latin American countries. Telecommunications Policy, 32, 88–100.
LAYNE, K., & LEE, J. W., 2001. Developing fully functional e-government: A four-stage model.
Government Information Quarterly, 18(2), pp. 122–136.
NORRIS, D. F., & KRAEMER. K. L., 1996. Mainframe and PC Computing in American Cities: Myths and Realities, Public Administration Review, 56(6), pp. 568–76.
MARCZYK, G., DEMATTEO, D., & FESTINGER, D. Essentials of Research Design and
Methodology. John Wiley & Sons: Hoboken, New Jersey, 2005.
MARTIN, M.A.G; PICAZO, M.T.M, 2009. Entrepreneurship And Economic Policy Objectives In: M.
V. Bradshaw and P. T. Carrington, Entrepreneurship and its Economic Significance, (pp-193-204). Nova Science Publishers, Inc.: New York
MACINTOSH, A., ROBSON, E., SMITH, E., & WHYTE, A., 2003. Electronic democracy and young people. Social Science Computer Review, 21(1), pp. 43-54.
MILES, J., SHEVLIN, M., 2001 Applying Regression & Correlation: A Guide for Students and Researchers: Sage Publications.
MORGESON, F.V, MITHAS, S., 2009. Does E-Government Measure Up to E-Business? Comparing
End User Perceptions of U.S. Federal Government and E-Business Web Sites, Public Administration
Review, Jul-Ago, pp.740-752.

E-GOVERNMENT IMPACT IN DOING BUSINESS DIMENSIONS, CORRUPTION PERCEPTION,
ENTREPRENEURIAL ATTITUDES AND ACTIVITIES
61
ROBINSON,J.P., SHAVER, P.R., & WRIGHTSMAN, L.S., 1991. Measures of Personality and Social Psychological Attitudes. San Diego, CA: Harcourt Brace Jovanovich.
RAUCH, J., EVANS, P., 2000. Bureaucratic structures and economic performance in less developed countries, Journal of Public Economics, 75, pp. 49–71.
SCHWAB, K., 2009. The Competitiveness Report 2009-2010. World Economic Forum, Geneva,
Switzerland. http://www.weforum.org/pdf/GCR09/GCR20092010fullreport.pdf. Retrieved 2010-03-
10.
SHAPERO, A. AND SOKOL, L., 1982. The social dimensions of entrepreneurship, in C.A. Kent, D.L.
Sexton and K.H. Vesper (Eds.) Encyclopedia of Entrepreneurship, Englewood Cliffs, NJ: Prentice-Hall, pp.72–90.
TRANSPARENCY INTERNATIONAL, 2012. Corruption Perception Report. Available www.transparency.org/policy_research/survey_indices/cpi. Retrieved: 2012-08-02
UN, United Nations, 2008. United Nations e-Government Survey 2008. From e-Government to Connected Governance, New York.
WEST, D. M., 2000. Assessing E-government: The Internet, democracy, and service delivery by state
and federal government. The Genesis Institute. Available: http://www.insidepolitics.org/egovtreport00.html.
WEST, D. M. (2005) Digital Government Technology and Public Sector Performance. Princeton, NJ:
Princeton University Press.
WORLD BANK, 2003. A definition of e-government. World Bank: Washington, DC.
WORLD BANK, 2009. Doing Business 2010. The World Bank: New York, 2009.
ZOUAIN, D.M, ALMEIDA, G.O., MAHECHA, Y.L.R. The Status of Global E-Government Research:
A Bibliometric Study. Global Business & Technology Association’s Fifteenth Annual International Conference, July 2 - 6, 2013, Helsinki, Finland
Recommended