Drivers, Successes, Challenges and Opportunities for Onsite Industrial Water
Reuse: a Path Forward for Collaboration and Growth (WateReuse-13-04)
Joan Oppenheimer, Mohammad Badruzzaman, Carla Cherchi, Jason Weakley, Jonathon Pohl
The WateReuse Research Foundation is a nonprofit charitable organization that conducts research to improve the treatment, distribution, and acceptance of water reuse. More Information www.watereuse.org/foundation Research Reports www.watereuse.org/foundation/publications
About WateReuse
2
Today’s webcast will be 60 minutes.
There is one Professional Development Hour available.
A PDF of today’s presentation can be downloaded when you complete the survey at the conclusion of this webcast.
If you have questions for the presenters, please send a message by typing it into the chat box located on the panel on the left side of your screen.
If you would like to enlarge your view of the slides, please click the Full Screen button in the upper right corner of the window. To use the chat box, you must exit full screen.
A Few Notes Before We Get Started…
3
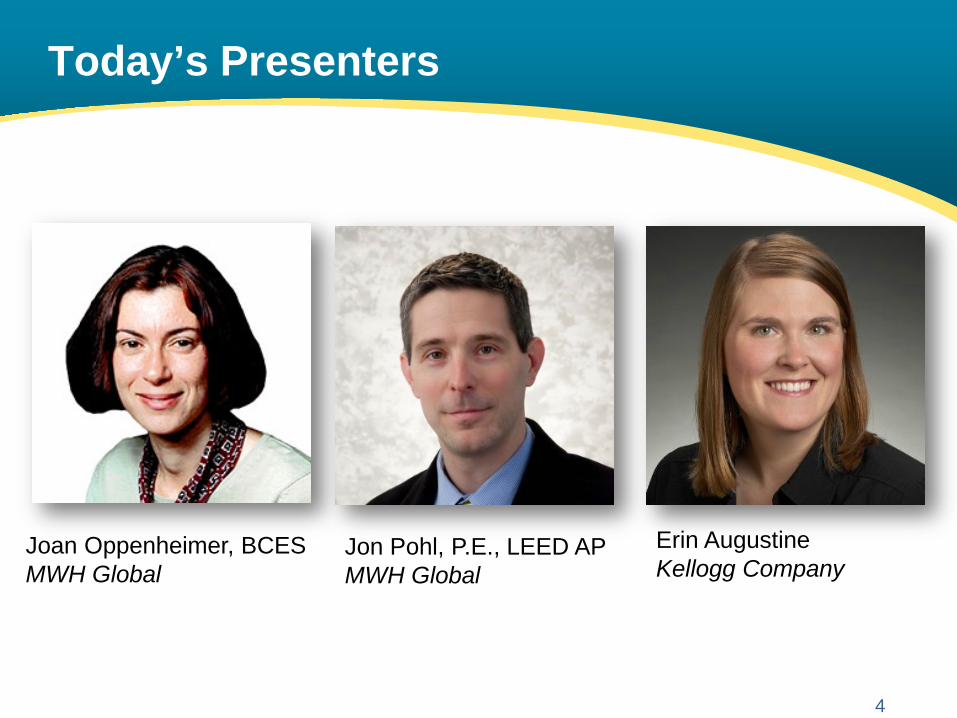
Today’s Presenters
4
Erin Augustine Kellogg Company
Joan Oppenheimer, BCES MWH Global
Jon Pohl, P.E., LEED AP MWH Global
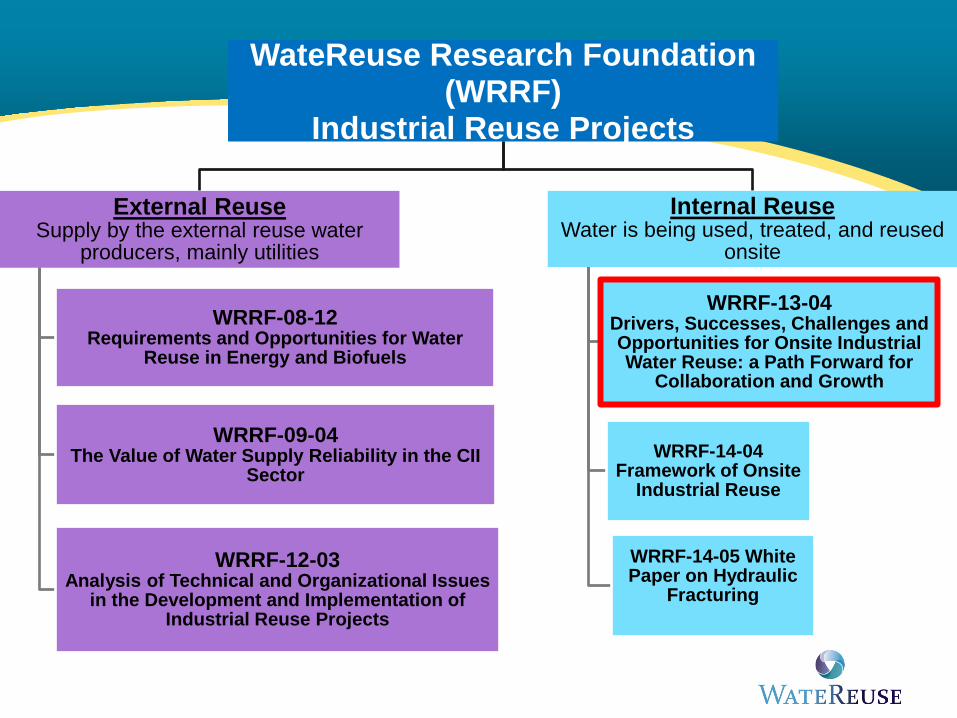
WateReuse Research Foundation (WRRF)
Industrial Reuse Projects
External Reuse Supply by the external reuse water
producers, mainly utilities
WRRF-08-12 Requirements and Opportunities for Water
Reuse in Energy and Biofuels
WRRF-09-04 The Value of Water Supply Reliability in the CII
Sector
WRRF-12-03 Analysis of Technical and Organizational Issues
in the Development and Implementation of Industrial Reuse Projects
Internal Reuse Water is being used, treated, and reused
onsite
WRRF-13-04 Drivers, Successes, Challenges and Opportunities for Onsite Industrial Water Reuse: a Path Forward for
Collaboration and Growth
WRRF-14-04 Framework of Onsite
Industrial Reuse
WRRF-14-05 White Paper on Hydraulic
Fracturing
Acknowledgements
• Project Officer - Justin Mattingly • Technical Advisory Committee
– Jimmy Yu (PepsiCo) – Anthony Lau (IDI) – Greta Zornes (ConocoPhillips) – Richard Cisterna (Natural Systems Utilities)
• Active Industry Participants – Boeing, Coca-Cola, Dow, Duke Energy, GE, Gold Fields,
Kellogg, Jackson Family Wines, Newmont Mining, Perrigo, Veolia
Definition of “Onsite / Internal” Water Reuse
Retention of water within a given facility that has served a useful purpose
& then using the same water again for a beneficial
purpose within the same facility.
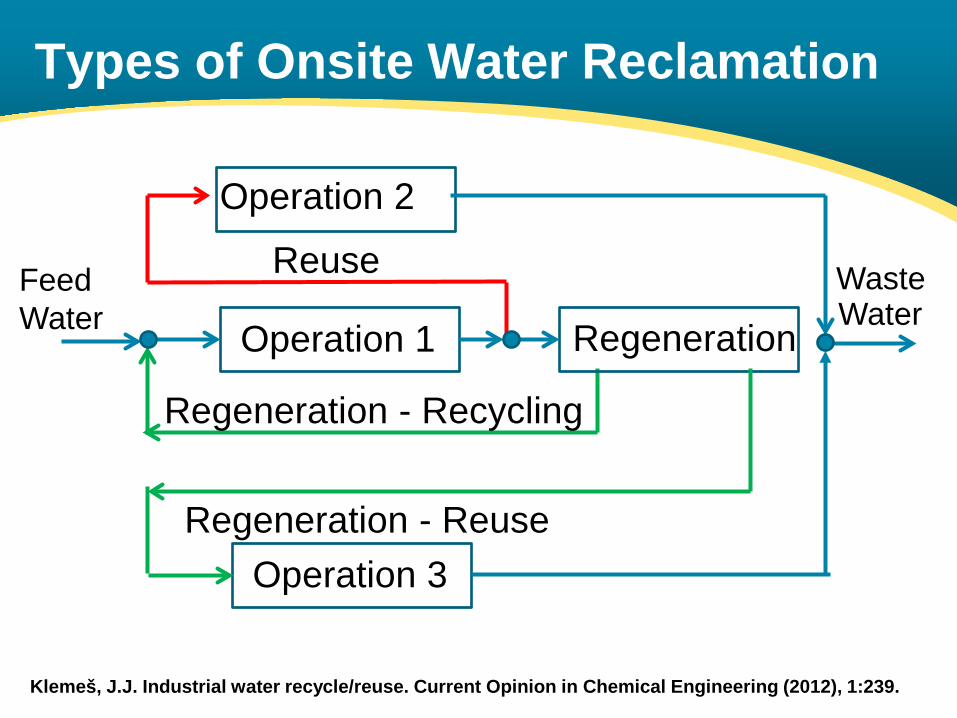
Types of Onsite Water Reclamation
Waste Reuse
Operation 2
Operation 1
Operation 3
Regeneration Water
Feed Water
Regeneration - Recycling
Regeneration - Reuse
Klemeš, J.J. Industrial water recycle/reuse. Current Opinion in Chemical Engineering (2012), 1:239.
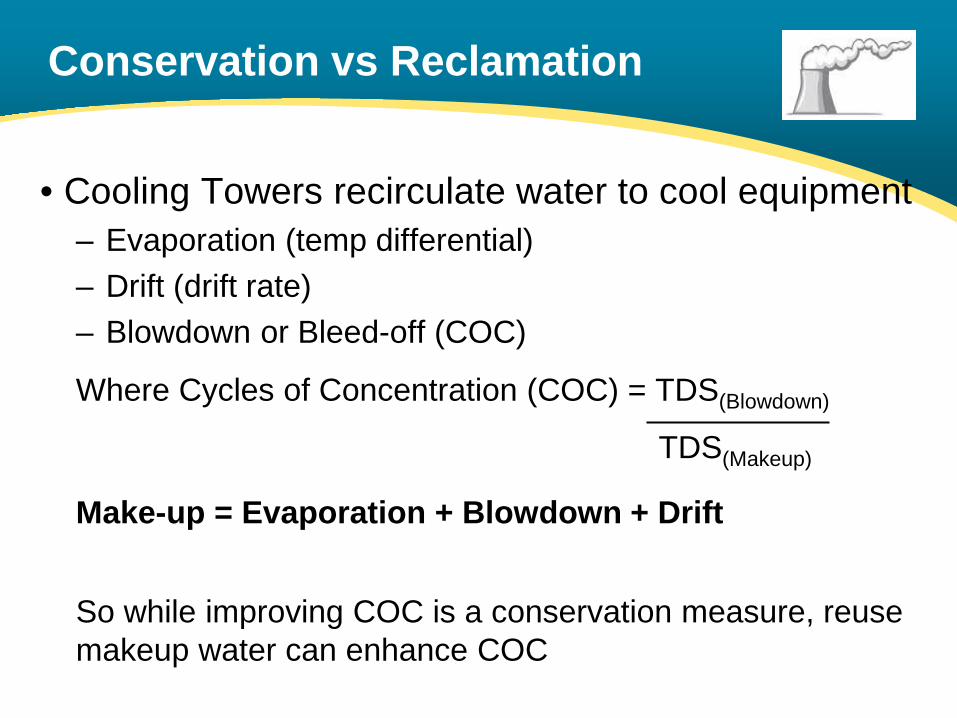
Conservation vs Reclamation
• Cooling Towers recirculate water to cool equipment – Evaporation (temp differential) – Drift (drift rate) – Blowdown or Bleed-off (COC)
Where Cycles of Concentration (COC) = TDS(Blowdown)
TDS(Makeup)
Make-up = Evaporation + Blowdown + Drift
So while improving COC is a conservation measure, reuse makeup water can enhance COC
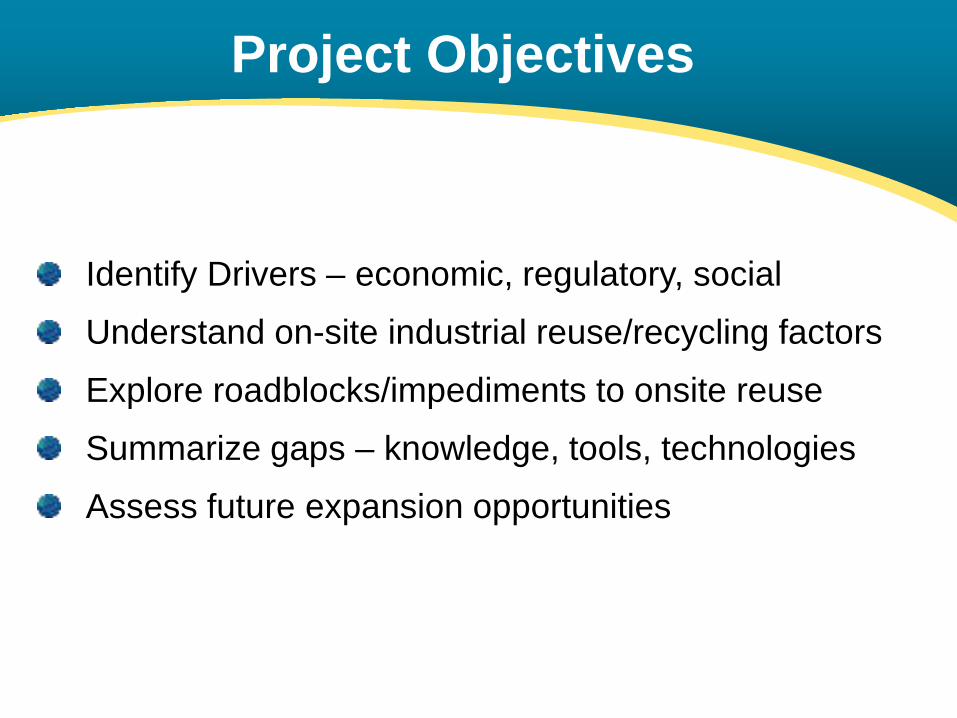
Identify Drivers – economic, regulatory, social
Understand on-site industrial reuse/recycling factors
Explore roadblocks/impediments to onsite reuse
Summarize gaps – knowledge, tools, technologies
Assess future expansion opportunities
Project Objectives
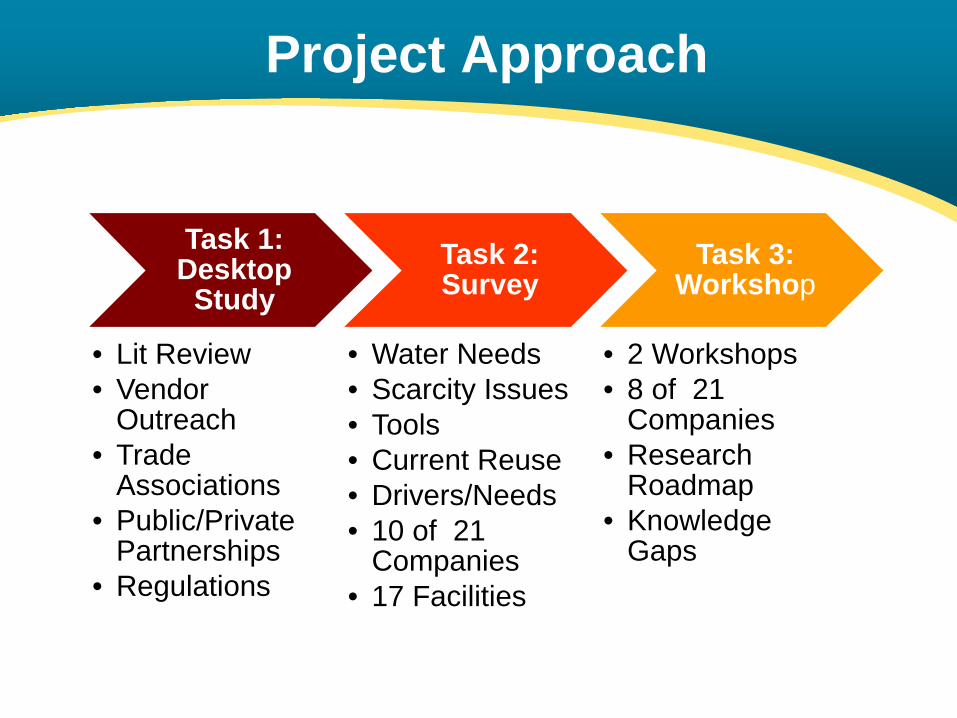
Project Approach
Task 1: Desktop
Study
• Lit Review • Vendor
Outreach • Trade
Associations • Public/Private
Partnerships • Regulations
Task 2: Survey
• Water Needs • Scarcity Issues • Tools • Current Reuse • Drivers/Needs • 10 of 21
Companies • 17 Facilities
Task 3: Workshop
• 2 Workshops • 8 of 21
Companies • Research
Roadmap • Knowledge
Gaps
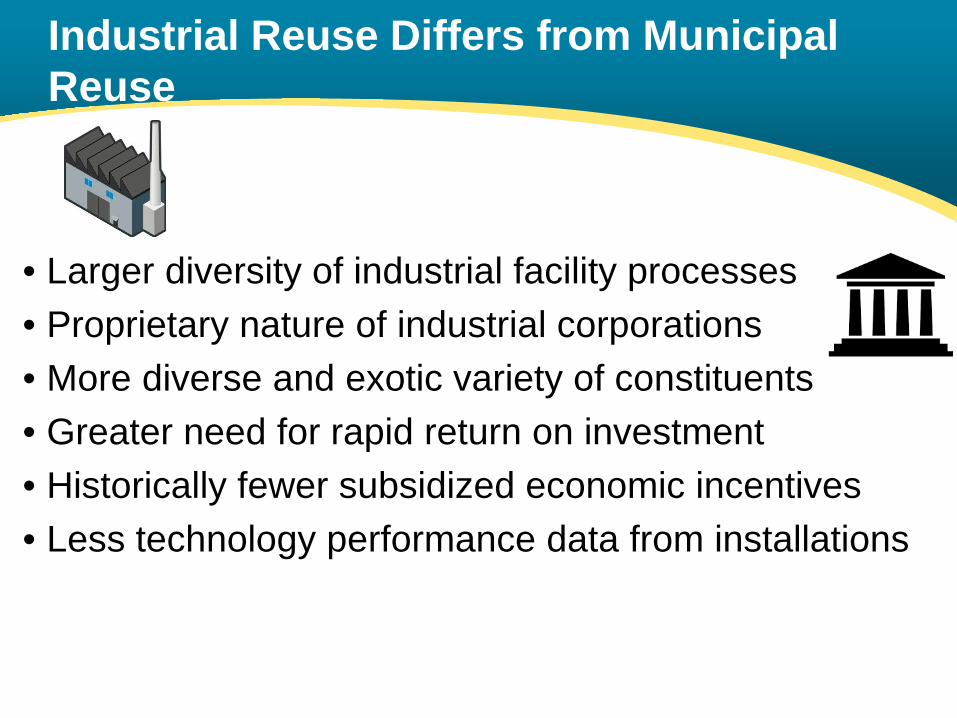
Industrial Reuse Differs from Municipal Reuse
• Larger diversity of industrial facility processes • Proprietary nature of industrial corporations • More diverse and exotic variety of constituents • Greater need for rapid return on investment • Historically fewer subsidized economic incentives • Less technology performance data from installations
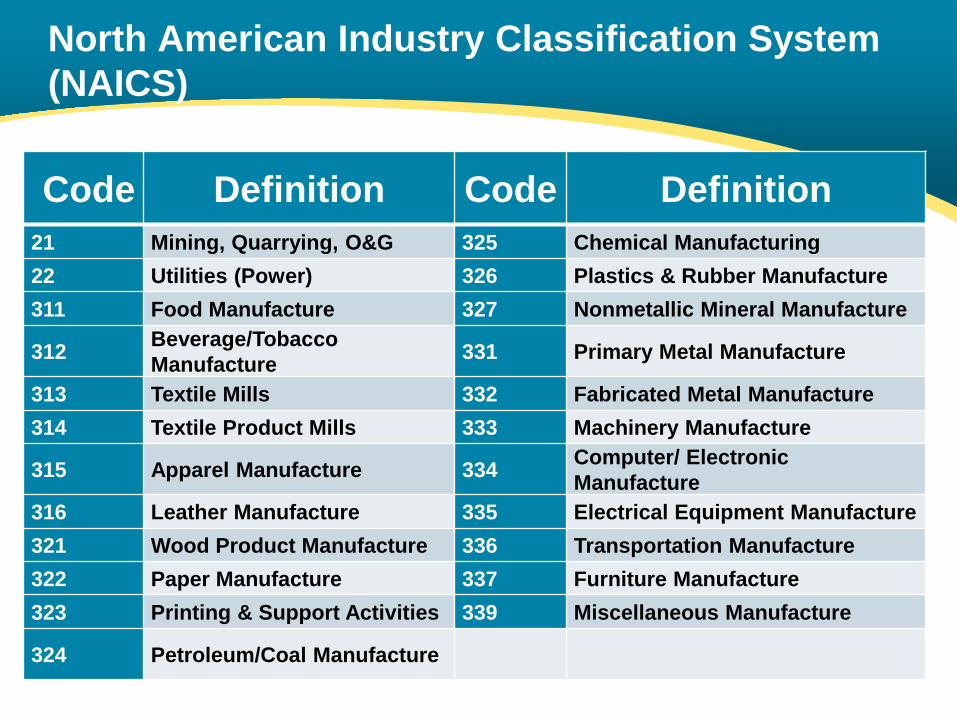
North American Industry Classification System (NAICS)
Code Definition Code Definition 21 Mining, Quarrying, O&G 325 Chemical Manufacturing 22 Utilities (Power) 326 Plastics & Rubber Manufacture 311 Food Manufacture 327 Nonmetallic Mineral Manufacture
312 Beverage/Tobacco Manufacture 331 Primary Metal Manufacture
313 Textile Mills 332 Fabricated Metal Manufacture 314 Textile Product Mills 333 Machinery Manufacture
315 Apparel Manufacture 334 Computer/ Electronic Manufacture
316 Leather Manufacture 335 Electrical Equipment Manufacture 321 Wood Product Manufacture 336 Transportation Manufacture 322 Paper Manufacture 337 Furniture Manufacture 323 Printing & Support Activities 339 Miscellaneous Manufacture
324 Petroleum/Coal Manufacture
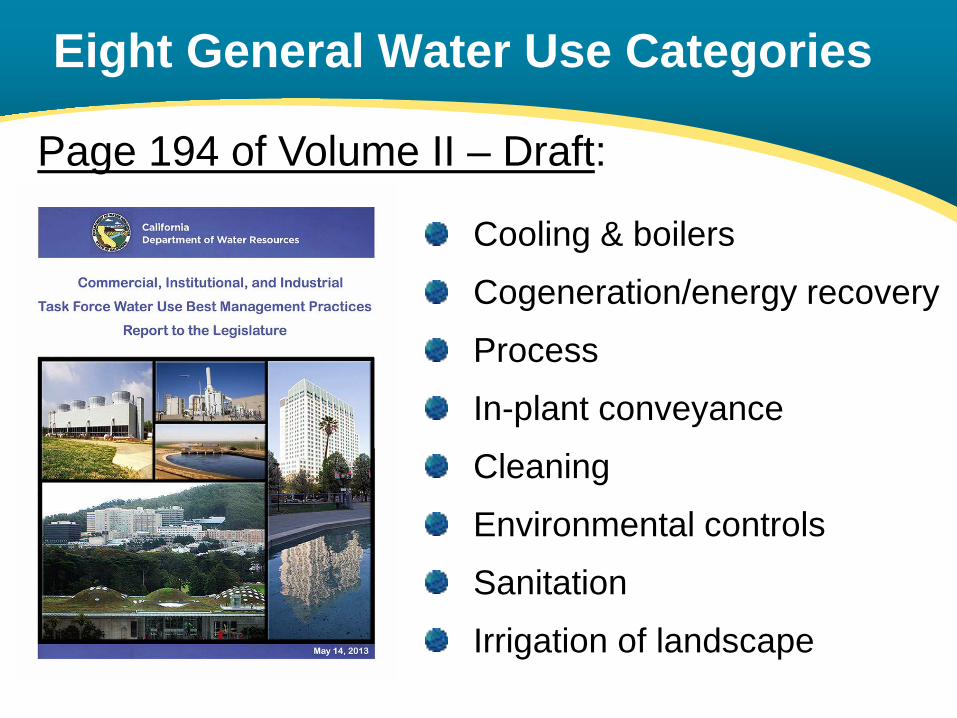
Cooling & boilers
Cogeneration/energy recovery
Process
In-plant conveyance
Cleaning
Environmental controls
Sanitation
Irrigation of landscape
Eight General Water Use Categories
Page 194 of Volume II – Draft:
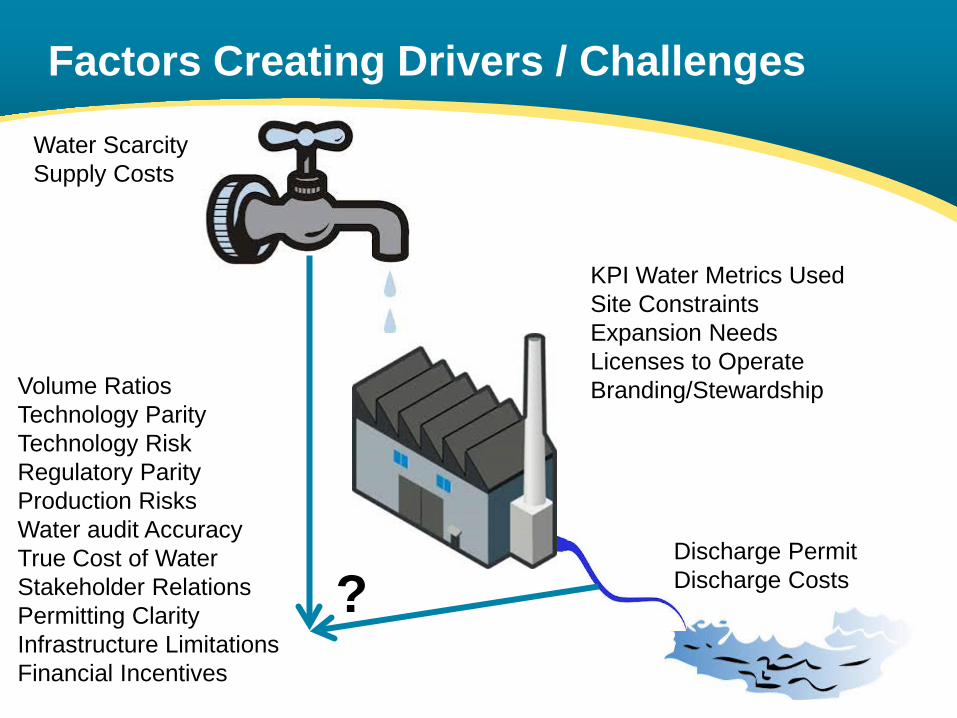
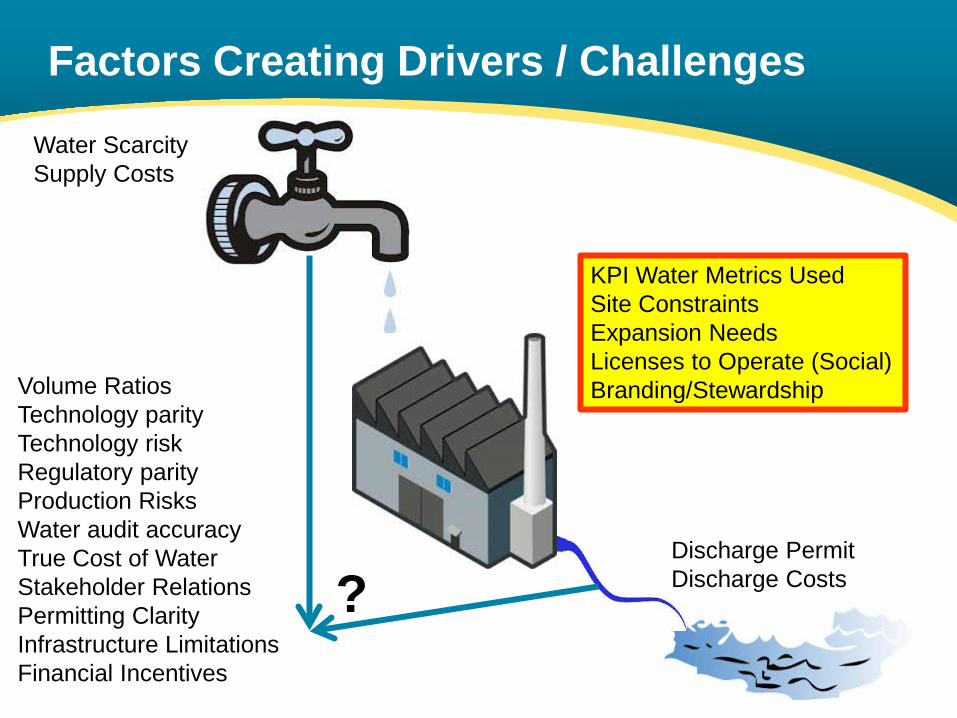
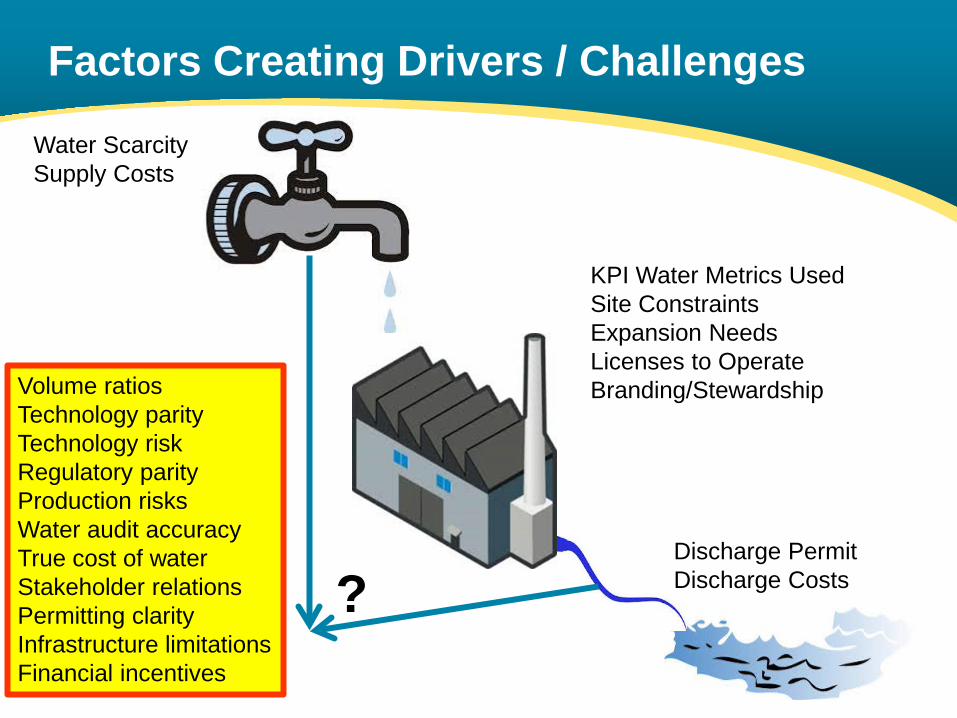
Factors Creating Drivers / Challenges
KPI Water Metrics Used Site Constraints Expansion Needs Licenses to Operate Branding/Stewardship Volume Ratios
Technology Parity Technology Risk Regulatory Parity Production Risks Water audit Accuracy True Cost of Water Stakeholder Relations Permitting Clarity Infrastructure Limitations Financial Incentives
Water Scarcity Supply Costs
Discharge Permit Discharge Costs ?
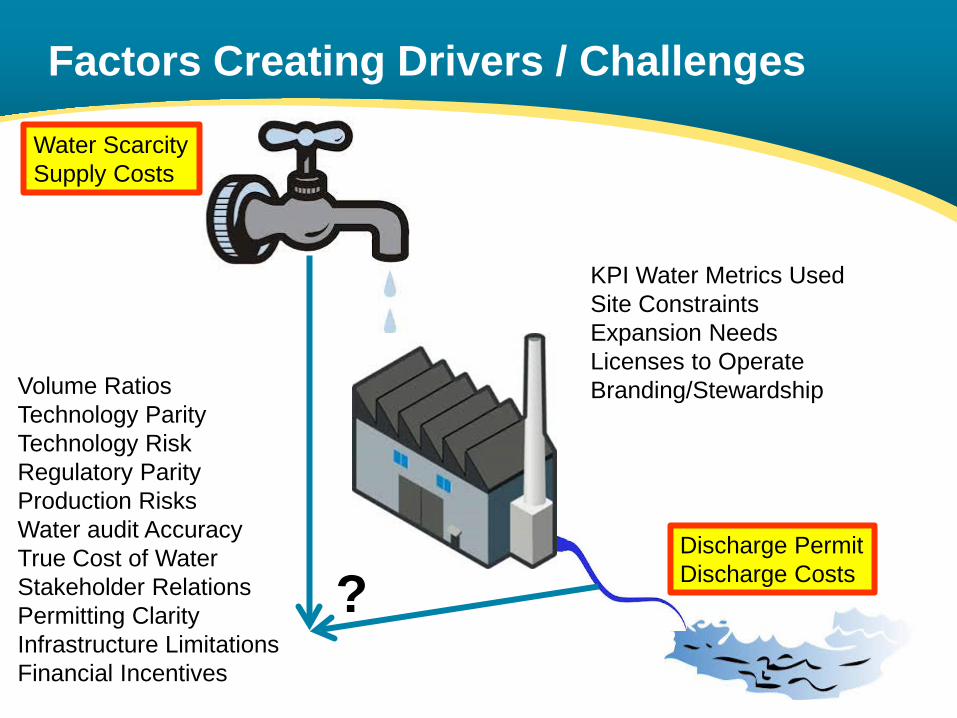
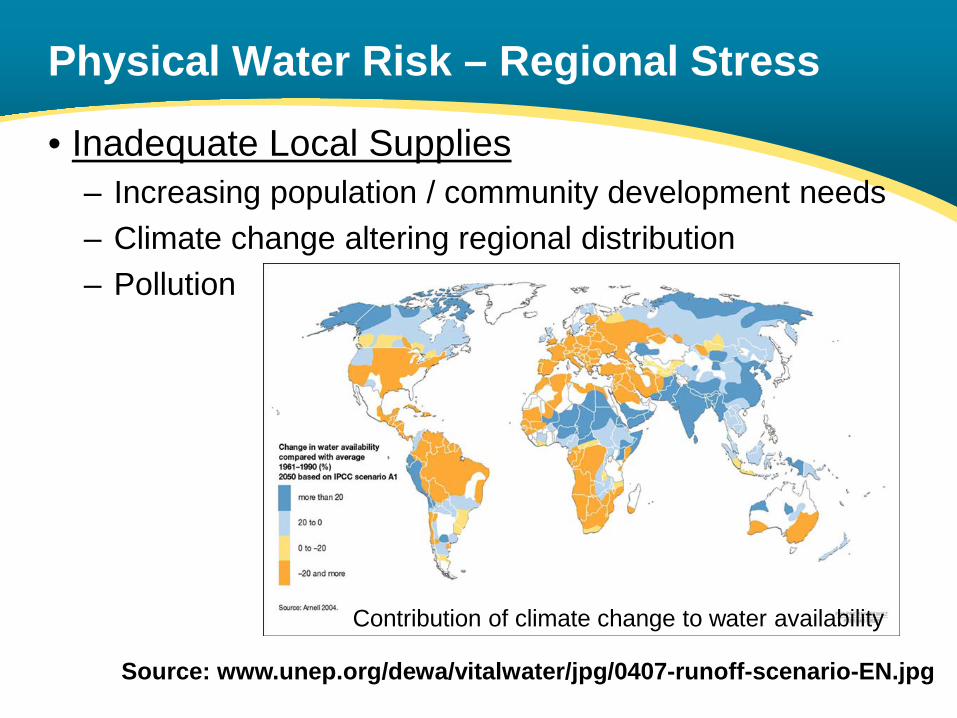
Physical Water Risk – Regional Stress
• Inadequate Local Supplies – Increasing population / community development needs – Climate change altering regional distribution – Pollution
Contribution of climate change to water availability
Source: www.unep.org/dewa/vitalwater/jpg/0407-runoff-scenario-EN.jpg
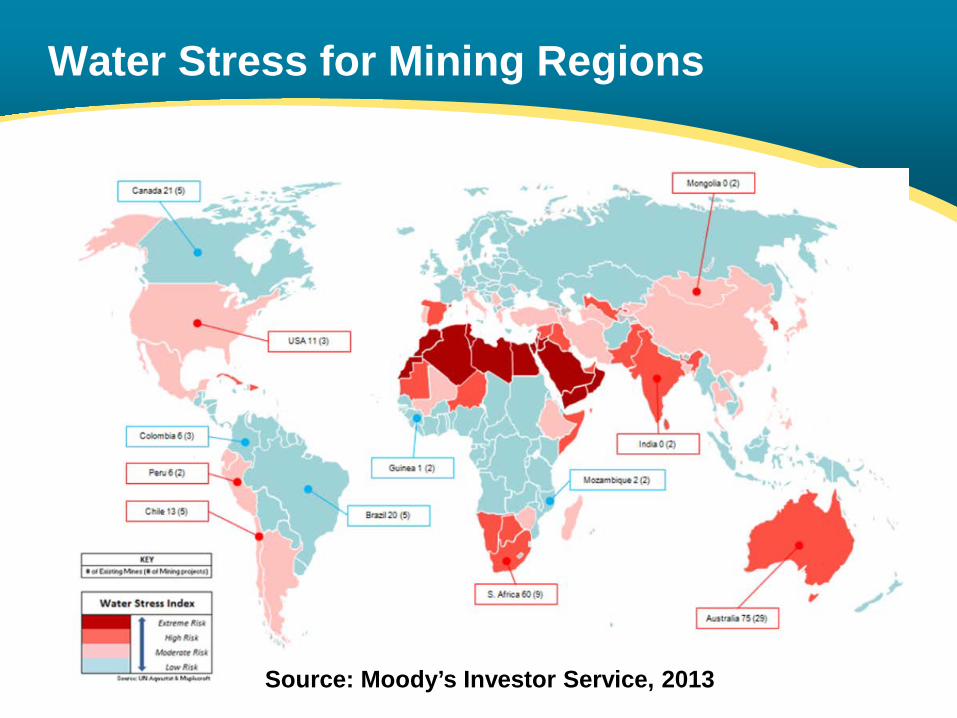
Water Stress for Mining Regions
Source: Moody’s Investor Service, 2013
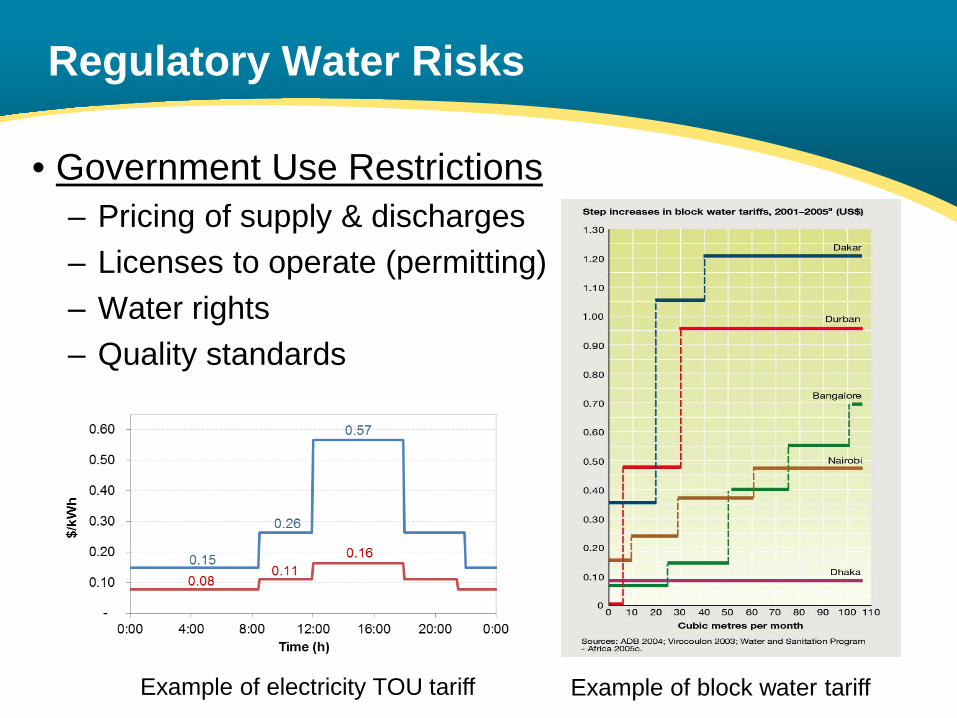
Regulatory Water Risks
• Government Use Restrictions – Pricing of supply & discharges – Licenses to operate (permitting) – Water rights – Quality standards
Example of electricity TOU tariff Example of block water tariff
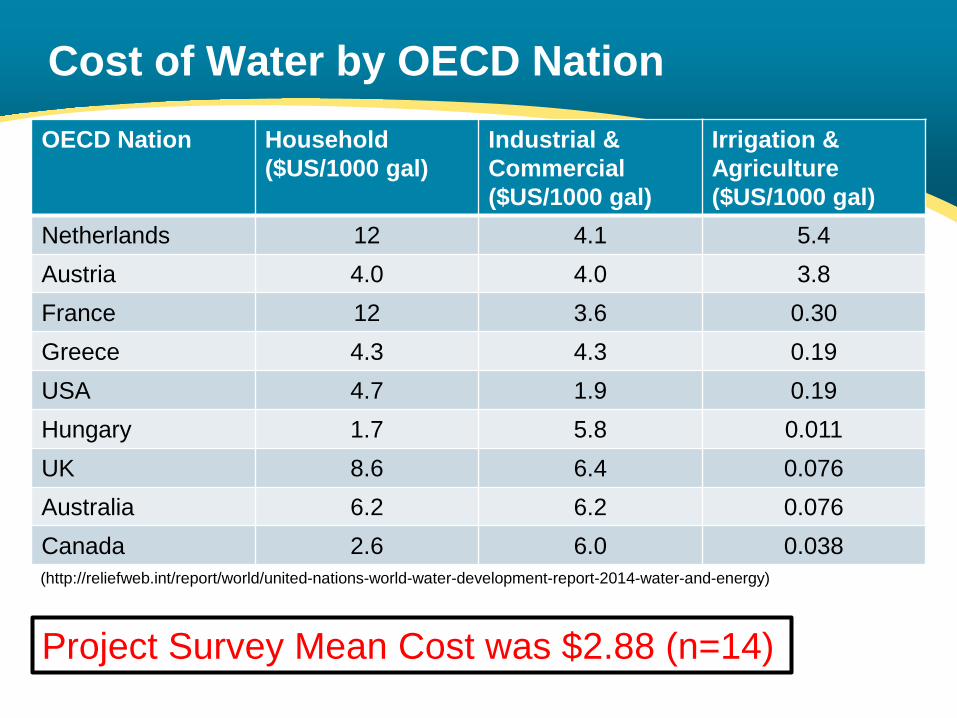
Cost of Water by OECD Nation OECD Nation Household
($US/1000 gal) Industrial & Commercial ($US/1000 gal)
Irrigation & Agriculture ($US/1000 gal)
Netherlands 12 4.1 5.4 Austria 4.0 4.0 3.8 France 12 3.6 0.30 Greece 4.3 4.3 0.19 USA 4.7 1.9 0.19 Hungary 1.7 5.8 0.011 UK 8.6 6.4 0.076 Australia 6.2 6.2 0.076 Canada 2.6 6.0 0.038 (http://reliefweb.int/report/world/united-nations-world-water-development-report-2014-water-and-energy)
Project Survey Mean Cost was $2.88 (n=14)
Factors Creating Drivers / Challenges
KPI Water Metrics Used Site Constraints Expansion Needs Licenses to Operate (Social) Branding/Stewardship Volume Ratios
Technology parity Technology risk Regulatory parity Production Risks Water audit accuracy True Cost of Water Stakeholder Relations Permitting Clarity Infrastructure Limitations Financial Incentives
Water Scarcity Supply Costs
Discharge Permit Discharge Costs ?
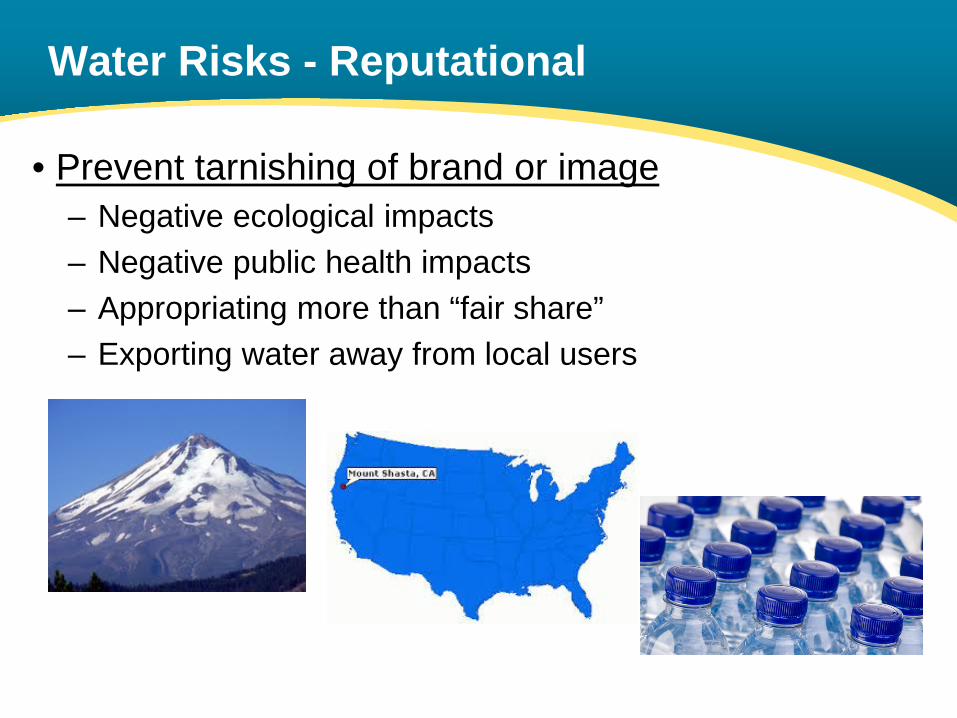
Water Risks - Reputational
• Prevent tarnishing of brand or image – Negative ecological impacts – Negative public health impacts – Appropriating more than “fair share” – Exporting water away from local users
Factors Creating Drivers / Challenges
KPI Water Metrics Used Site Constraints Expansion Needs Licenses to Operate Branding/Stewardship Volume ratios
Technology parity Technology risk Regulatory parity Production risks Water audit accuracy True cost of water Stakeholder relations Permitting clarity Infrastructure limitations Financial incentives
Water Scarcity Supply Costs
Discharge Permit Discharge Costs ?
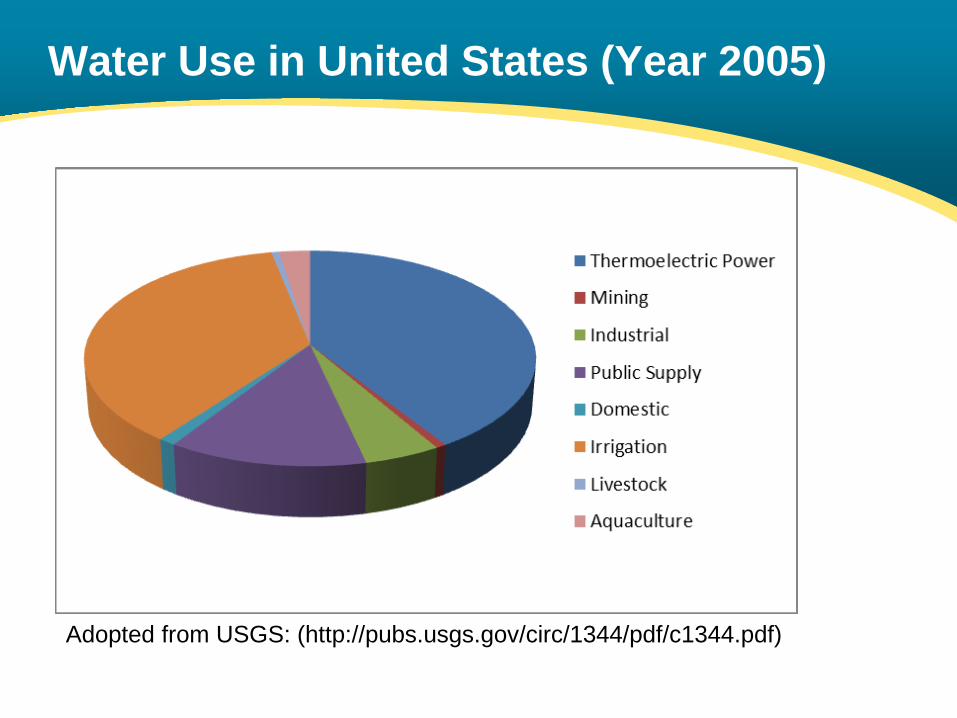
Water Use in United States (Year 2005)
Adopted from USGS: (http://pubs.usgs.gov/circ/1344/pdf/c1344.pdf)
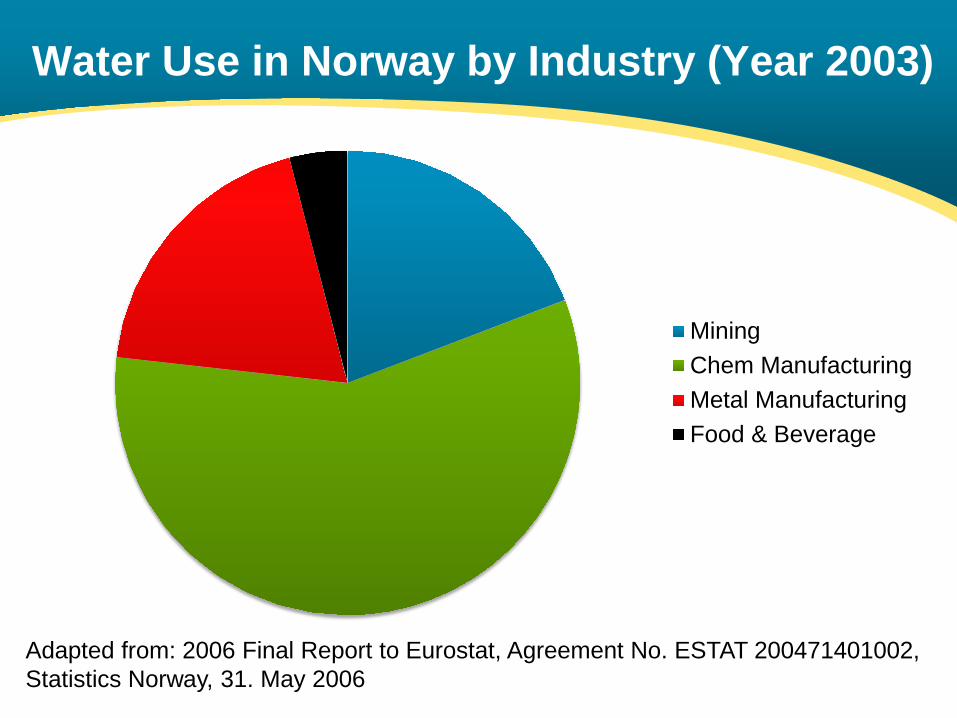
Water Use in Norway by Industry (Year 2003)
MiningChem ManufacturingMetal ManufacturingFood & Beverage
Adapted from: 2006 Final Report to Eurostat, Agreement No. ESTAT 200471401002, Statistics Norway, 31. May 2006
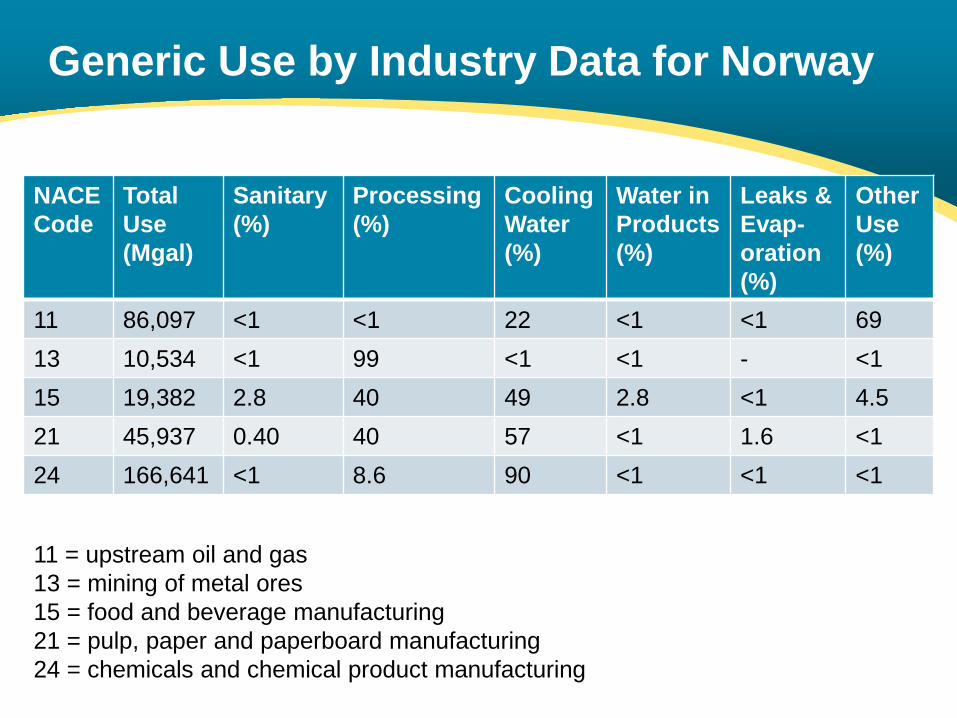
Generic Use by Industry Data for Norway
NACE Code
Total Use (Mgal)
Sanitary (%)
Processing (%)
Cooling Water (%)
Water in Products (%)
Leaks & Evap-oration (%)
Other Use (%)
11 86,097 <1 <1 22 <1 <1 69 13 10,534 <1 99 <1 <1 - <1 15 19,382 2.8 40 49 2.8 <1 4.5 21 45,937 0.40 40 57 <1 1.6 <1 24 166,641 <1 8.6 90 <1 <1 <1
11 = upstream oil and gas 13 = mining of metal ores 15 = food and beverage manufacturing 21 = pulp, paper and paperboard manufacturing 24 = chemicals and chemical product manufacturing
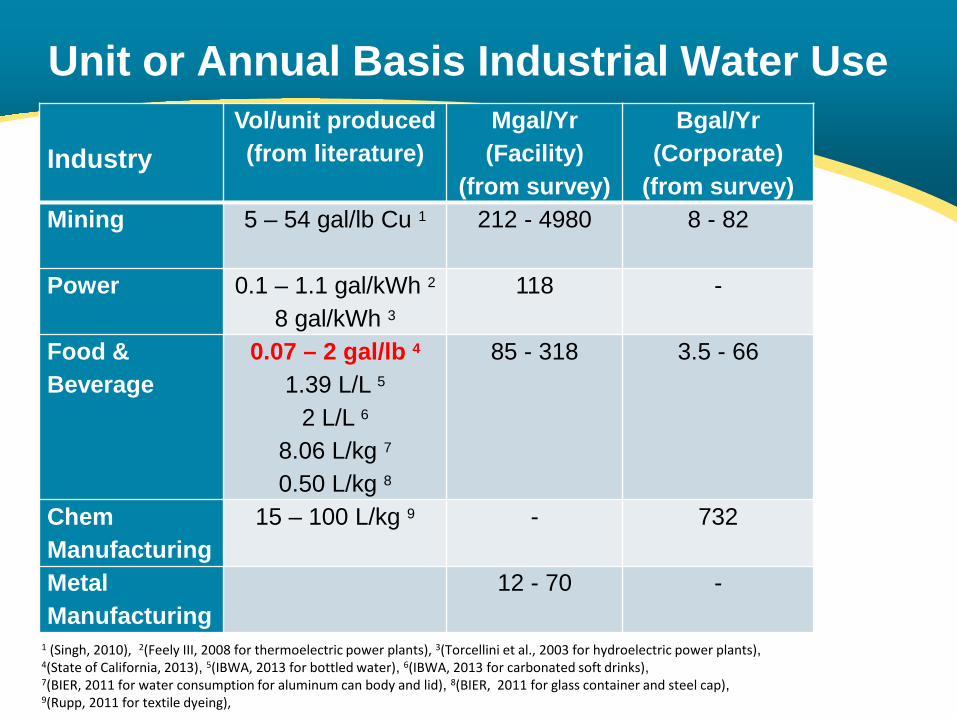
Unit or Annual Basis Industrial Water Use
Industry Vol/unit produced (from literature)
Mgal/Yr (Facility)
(from survey)
Bgal/Yr (Corporate)
(from survey) Mining 5 – 54 gal/lb Cu 1
212 - 4980 8 - 82
Power 0.1 – 1.1 gal/kWh 2 8 gal/kWh 3
118 -
Food & Beverage
0.07 – 2 gal/lb 4 1.39 L/L 5
2 L/L 6 8.06 L/kg 7 0.50 L/kg 8
85 - 318 3.5 - 66
Chem Manufacturing
15 – 100 L/kg 9 - 732
Metal Manufacturing
12 - 70 -
1 (Singh, 2010), 2(Feely III, 2008 for thermoelectric power plants), 3(Torcellini et al., 2003 for hydroelectric power plants), 4(State of California, 2013), 5(IBWA, 2013 for bottled water), 6(IBWA, 2013 for carbonated soft drinks), 7(BIER, 2011 for water consumption for aluminum can body and lid), 8(BIER, 2011 for glass container and steel cap), 9(Rupp, 2011 for textile dyeing),
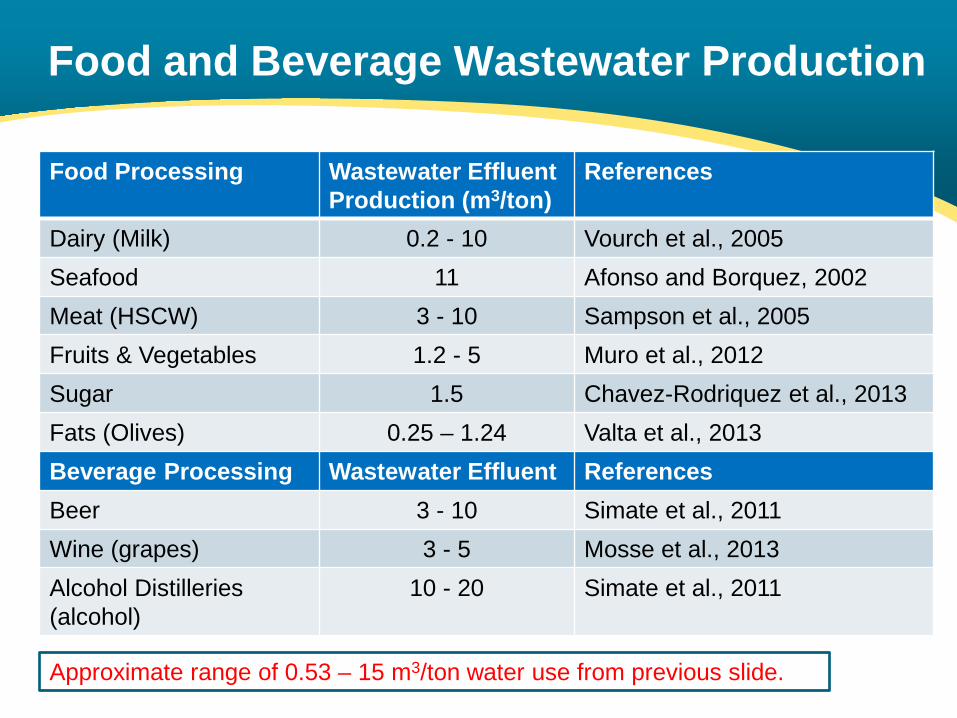
Food and Beverage Wastewater Production
Food Processing Wastewater Effluent Production (m3/ton)
References
Dairy (Milk) 0.2 - 10 Vourch et al., 2005 Seafood 11 Afonso and Borquez, 2002 Meat (HSCW) 3 - 10 Sampson et al., 2005 Fruits & Vegetables 1.2 - 5 Muro et al., 2012 Sugar 1.5 Chavez-Rodriquez et al., 2013 Fats (Olives) 0.25 – 1.24 Valta et al., 2013 Beverage Processing Wastewater Effluent References Beer 3 - 10 Simate et al., 2011 Wine (grapes) 3 - 5 Mosse et al., 2013 Alcohol Distilleries (alcohol)
10 - 20 Simate et al., 2011
Approximate range of 0.53 – 15 m3/ton water use from previous slide.
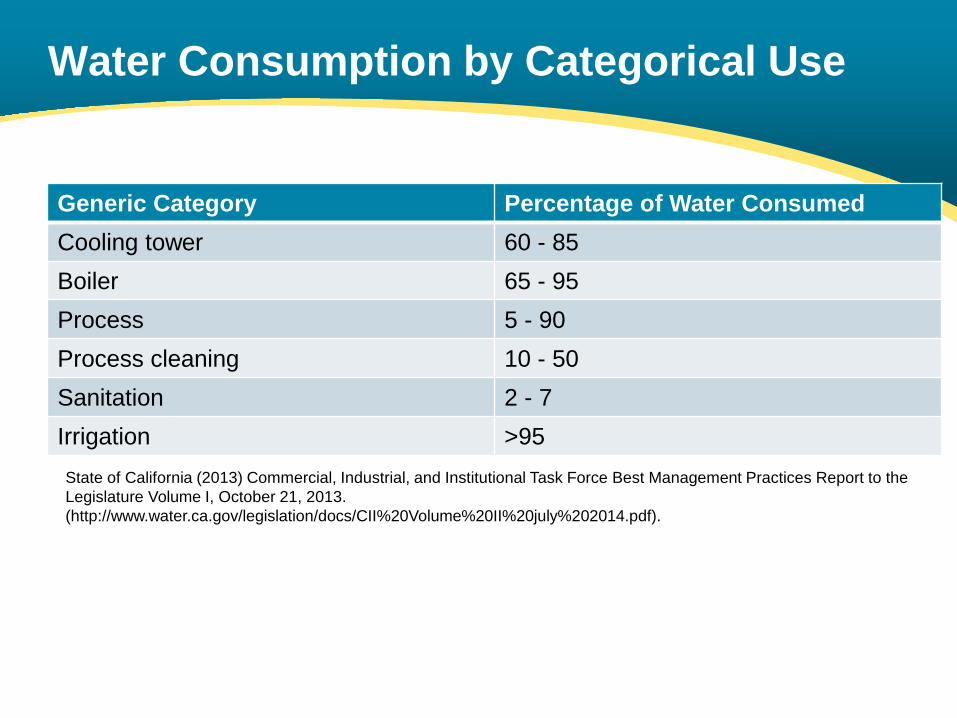
Water Consumption by Categorical Use
Generic Category Percentage of Water Consumed Cooling tower 60 - 85 Boiler 65 - 95 Process 5 - 90 Process cleaning 10 - 50 Sanitation 2 - 7 Irrigation >95 State of California (2013) Commercial, Industrial, and Institutional Task Force Best Management Practices Report to the Legislature Volume I, October 21, 2013. (http://www.water.ca.gov/legislation/docs/CII%20Volume%20II%20july%202014.pdf).
Evaluation of Water Use and Reuse/Recycling Opportunities
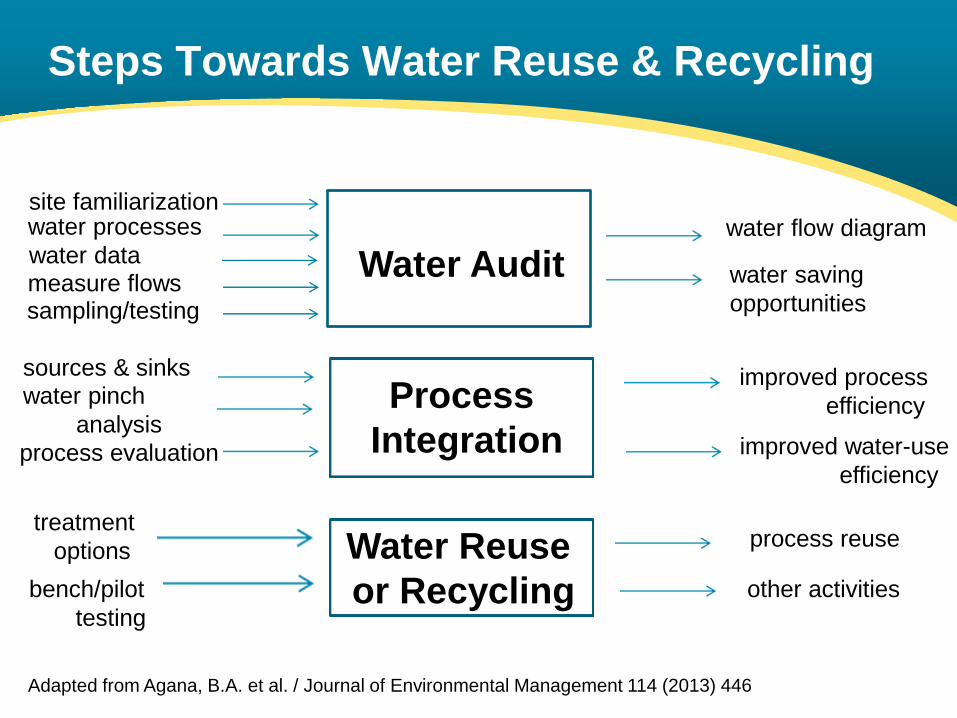
Steps Towards Water Reuse & Recycling
Water Audit
Process Integration
Water Reuse or Recycling
water flow diagram
water saving opportunities
improved process efficiency
improved water-use efficiency
process reuse
other activities
treatment options bench/pilot testing
site familiarization water processes water data measure flows sampling/testing
sources & sinks water pinch analysis
Adapted from Agana, B.A. et al. / Journal of Environmental Management 114 (2013) 446
process evaluation
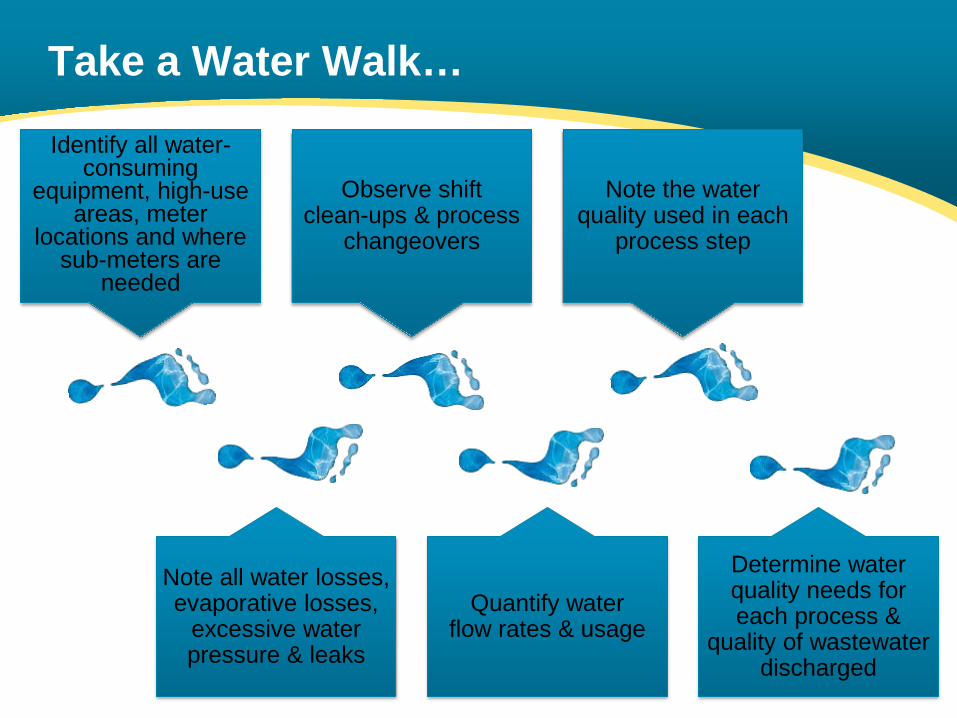
Take a Water Walk…
Identify all water-consuming
equipment, high-use areas, meter
locations and where sub-meters are
needed
Note all water losses, evaporative losses,
excessive water pressure & leaks
Observe shift clean-ups & process
changeovers
Note the water quality used in each
process step
Quantify water flow rates & usage
Determine water quality needs for each process &
quality of wastewater discharged
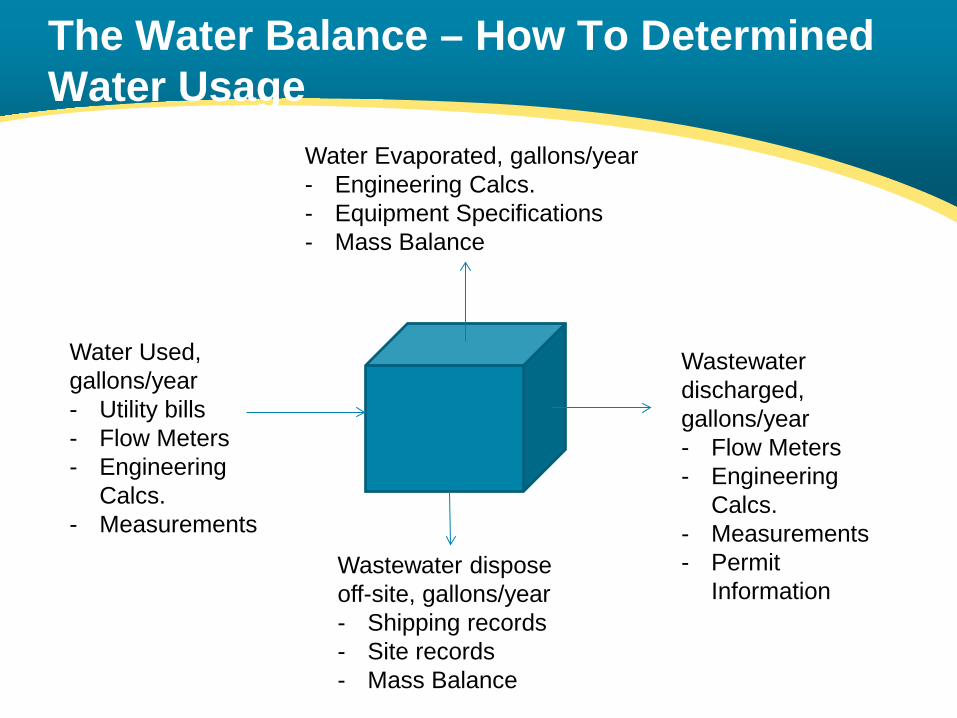
The Water Balance – How To Determined Water Usage
Water Used, gallons/year - Utility bills - Flow Meters - Engineering
Calcs. - Measurements
Wastewater discharged, gallons/year - Flow Meters - Engineering
Calcs. - Measurements - Permit
Information
Water Evaporated, gallons/year - Engineering Calcs. - Equipment Specifications - Mass Balance
Wastewater dispose off-site, gallons/year - Shipping records - Site records - Mass Balance
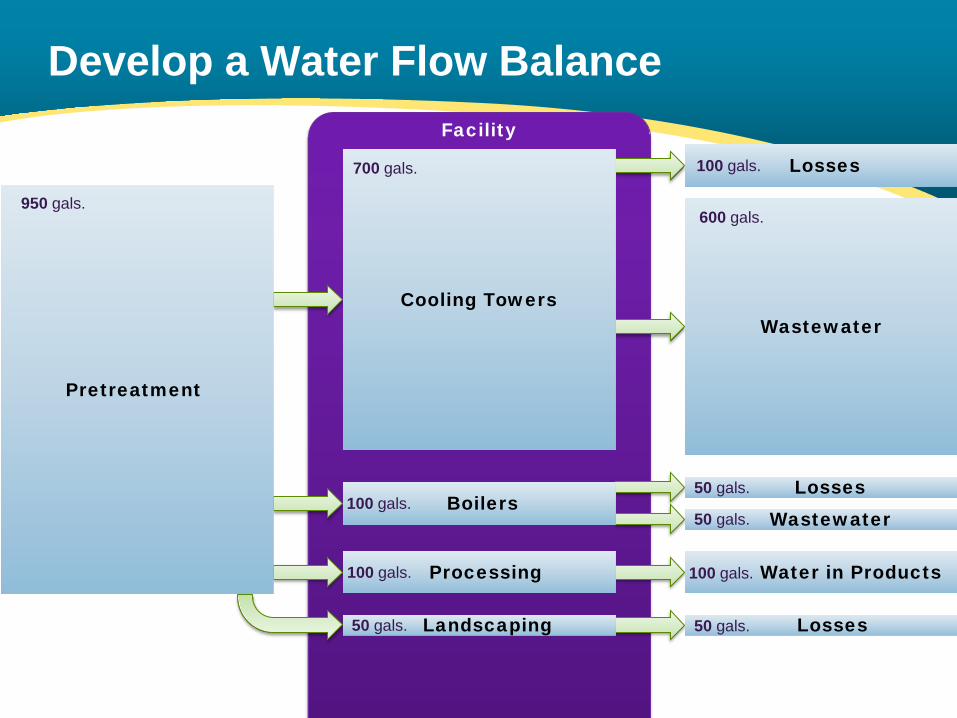
Develop a Water Flow Balance Facility
Pretreatment
Cooling Towers
Boilers
Processing
Landscaping Losses
Water in Products
Wastewater
Losses
Wastewater
Losses
950 gals.
700 gals.
600 gals.
50 gals.
100 gals.
100 gals.
100 gals.
50 gals.
50 gals.
50 gals.
100 gals.
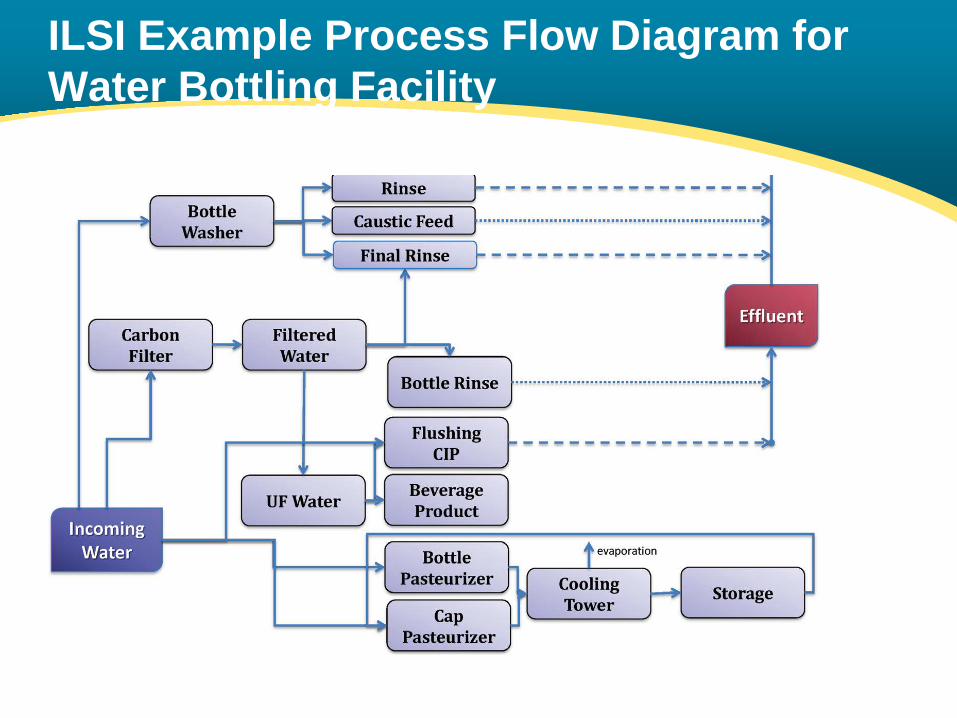
ILSI Example Process Flow Diagram for Water Bottling Facility
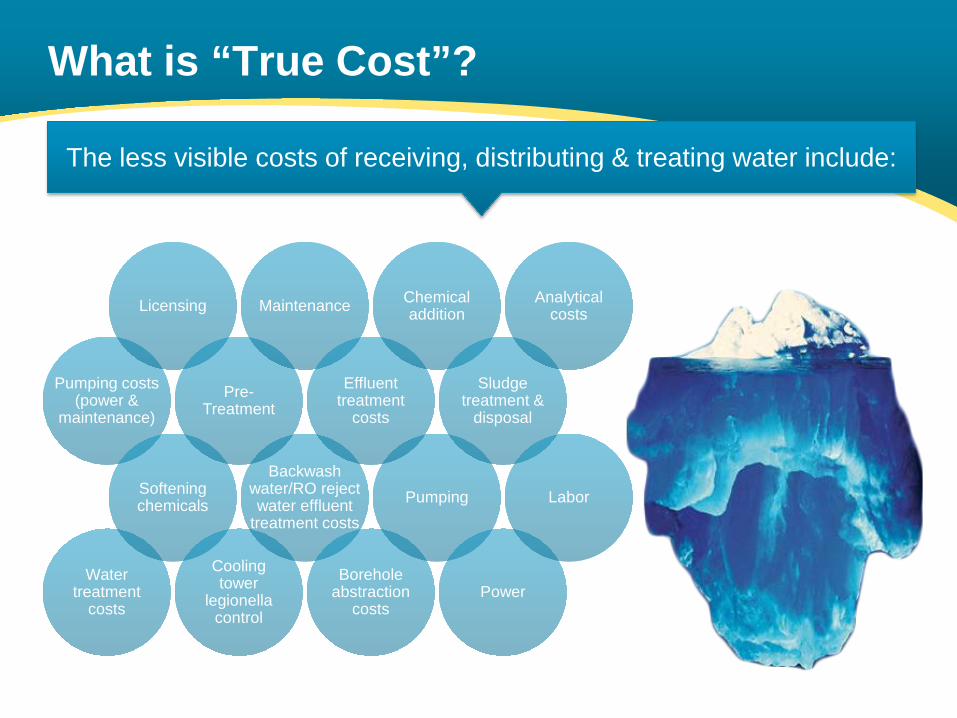
What is “True Cost”?
Pumping costs (power &
maintenance)
Water treatment
costs
Softening chemicals
Cooling tower
legionella control
Backwash water/RO reject water effluent
treatment costs
Borehole abstraction
costs
Pumping
Licensing
Pre-Treatment
Maintenance
Effluent treatment
costs
Chemical addition
Sludge treatment &
disposal
Analytical costs
Power
Labor
Water charges Sewerage charges
Effluent charges
The less visible costs of receiving, distributing & treating water include:
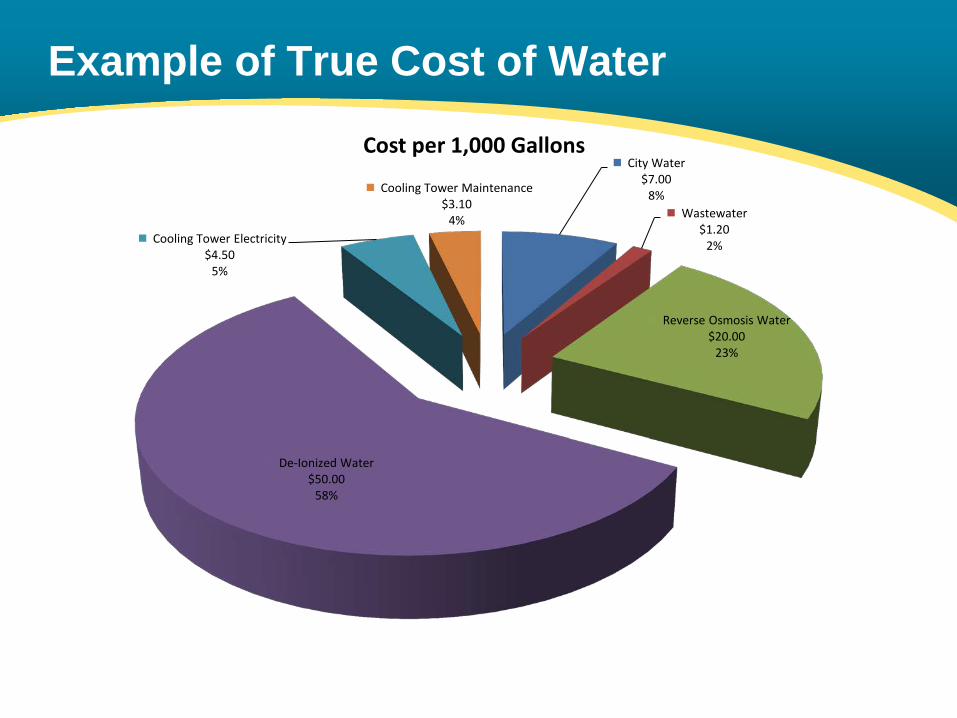
Example of True Cost of Water
City Water $7.00
8% Wastewater
$1.20 2%
Reverse Osmosis Water $20.00
23%
De-Ionized Water $50.00
58%
Cooling Tower Electricity $4.50
5%
Cooling Tower Maintenance $3.10
4%
Cost per 1,000 Gallons
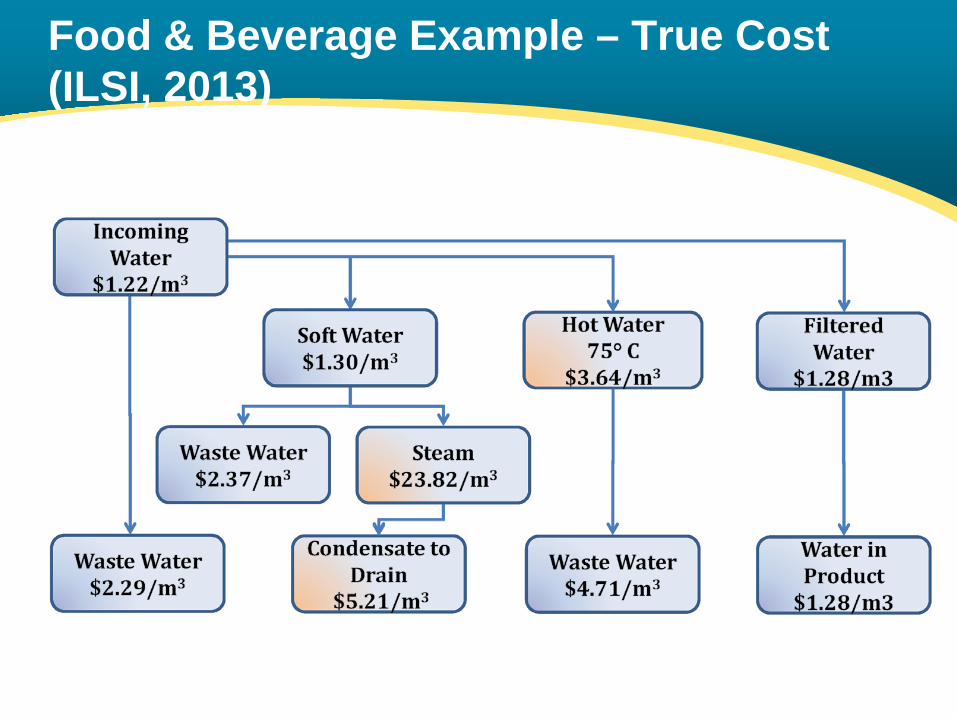
Food & Beverage Example – True Cost (ILSI, 2013)
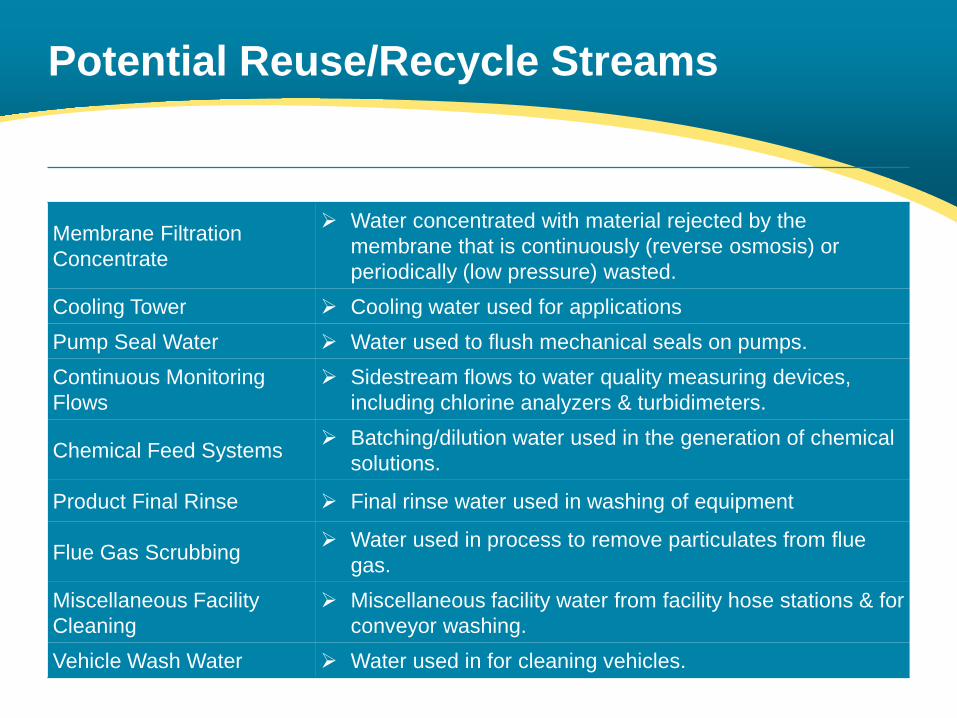
Potential Reuse/Recycle Streams
Streams Description
Membrane Filtration Concentrate
Water concentrated with material rejected by the membrane that is continuously (reverse osmosis) or periodically (low pressure) wasted.
Cooling Tower Cooling water used for applications Pump Seal Water Water used to flush mechanical seals on pumps. Continuous Monitoring Flows
Sidestream flows to water quality measuring devices, including chlorine analyzers & turbidimeters.
Chemical Feed Systems Batching/dilution water used in the generation of chemical solutions.
Product Final Rinse Final rinse water used in washing of equipment
Flue Gas Scrubbing Water used in process to remove particulates from flue gas.
Miscellaneous Facility Cleaning
Miscellaneous facility water from facility hose stations & for conveyor washing.
Vehicle Wash Water Water used in for cleaning vehicles.
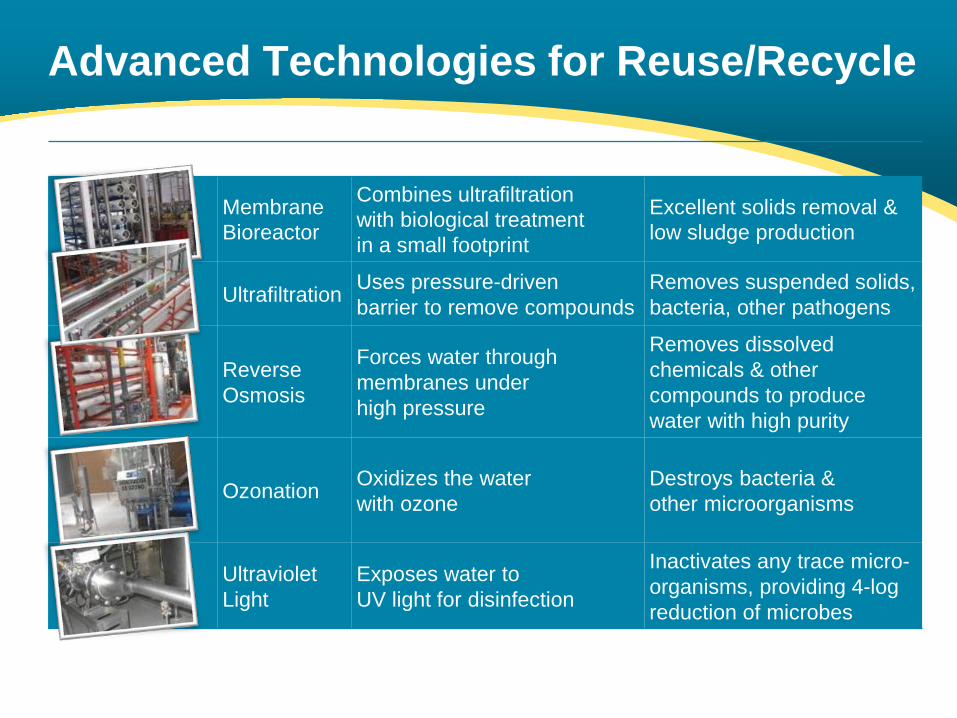
Technology Description Outcome
Membrane Bioreactor
Combines ultrafiltration with biological treatment in a small footprint
Excellent solids removal & low sludge production
Ultrafiltration Uses pressure-driven barrier to remove compounds
Removes suspended solids, bacteria, other pathogens
Reverse Osmosis
Forces water through membranes under high pressure
Removes dissolved chemicals & other compounds to produce water with high purity
Ozonation Oxidizes the water with ozone
Destroys bacteria & other microorganisms
Ultraviolet Light
Exposes water to UV light for disinfection
Inactivates any trace micro- organisms, providing 4-log reduction of microbes
Advanced Technologies for Reuse/Recycle
Potential Direct Reuse Application
Coo
ling
Wat
er fo
r B
ottle
/Con
tain
er F
illin
g
Che
mic
al F
eed
Sys
tem
s
Flue
Gas
Scr
ubbi
ng
San
itary
(Toi
let
Flus
hing
)
Eva
pora
tive
Coo
ling
Tow
er F
eed
Boi
ler P
re-T
reat
men
t
Pro
duct
ion
Pum
p S
eal
Wat
er
Mis
cella
neou
s Fa
cilit
y C
lean
ing
Non
-Con
tact
Coo
ling
Wat
er
WW
TP U
tility
Wat
er
Veh
icle
Was
h W
ater
Land
scap
e Irr
igat
ion
Dire
ct R
euse
Sou
rces
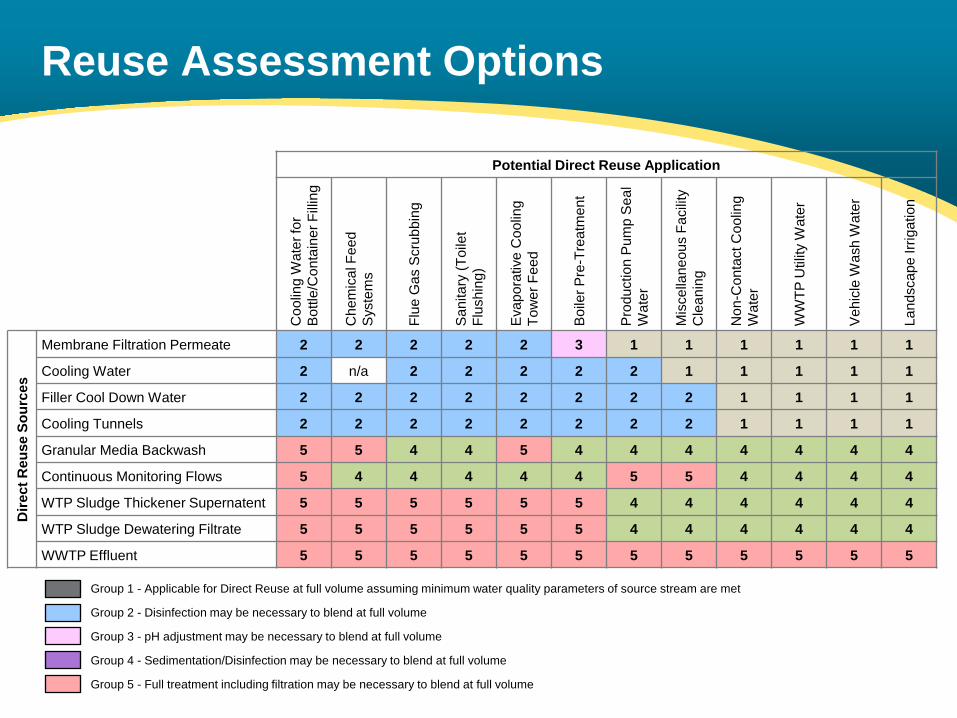
Membrane Filtration Permeate 2 2 2 2 2 3 1 1 1 1 1 1
Cooling Water 2 n/a 2 2 2 2 2 1 1 1 1 1
Filler Cool Down Water 2 2 2 2 2 2 2 2 1 1 1 1
Cooling Tunnels 2 2 2 2 2 2 2 2 1 1 1 1
Granular Media Backwash 5 5 4 4 5 4 4 4 4 4 4 4
Continuous Monitoring Flows 5 4 4 4 4 4 5 5 4 4 4 4
WTP Sludge Thickener Supernatent 5 5 5 5 5 5 4 4 4 4 4 4
WTP Sludge Dewatering Filtrate 5 5 5 5 5 5 4 4 4 4 4 4
WWTP Effluent 5 5 5 5 5 5 5 5 5 5 5 5
Reuse Assessment Options
Group 1 - Applicable for Direct Reuse at full volume assuming minimum water quality parameters of source stream are met
Group 2 - Disinfection may be necessary to blend at full volume
Group 3 - pH adjustment may be necessary to blend at full volume
Group 4 - Sedimentation/Disinfection may be necessary to blend at full volume
Group 5 - Full treatment including filtration may be necessary to blend at full volume
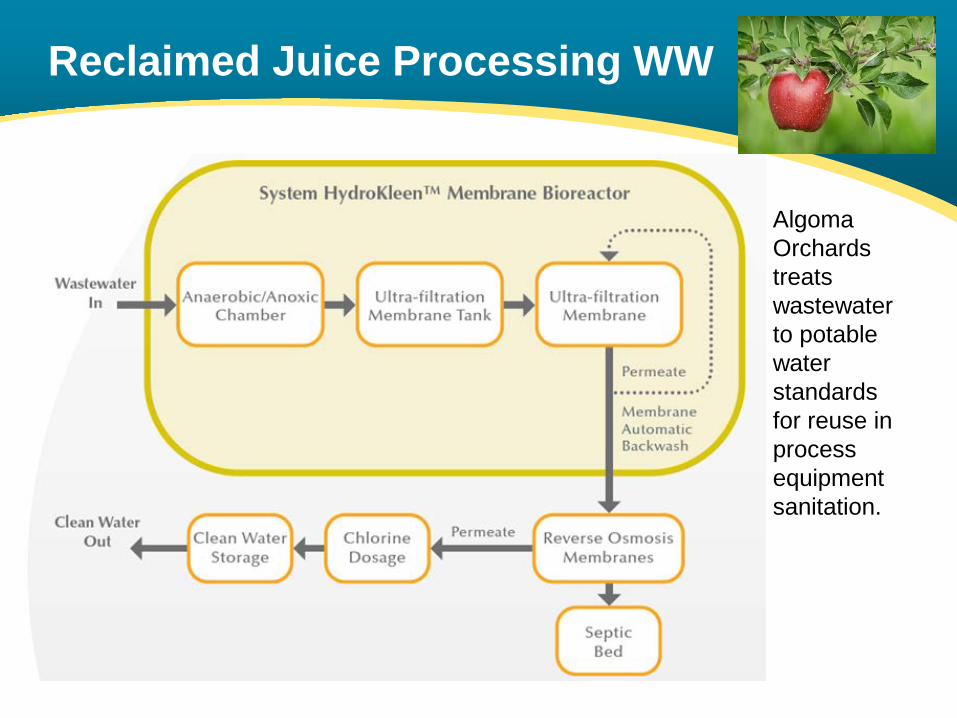
Reclaimed Juice Processing WW
Algoma Orchards treats wastewater to potable water standards for reuse in process equipment sanitation.
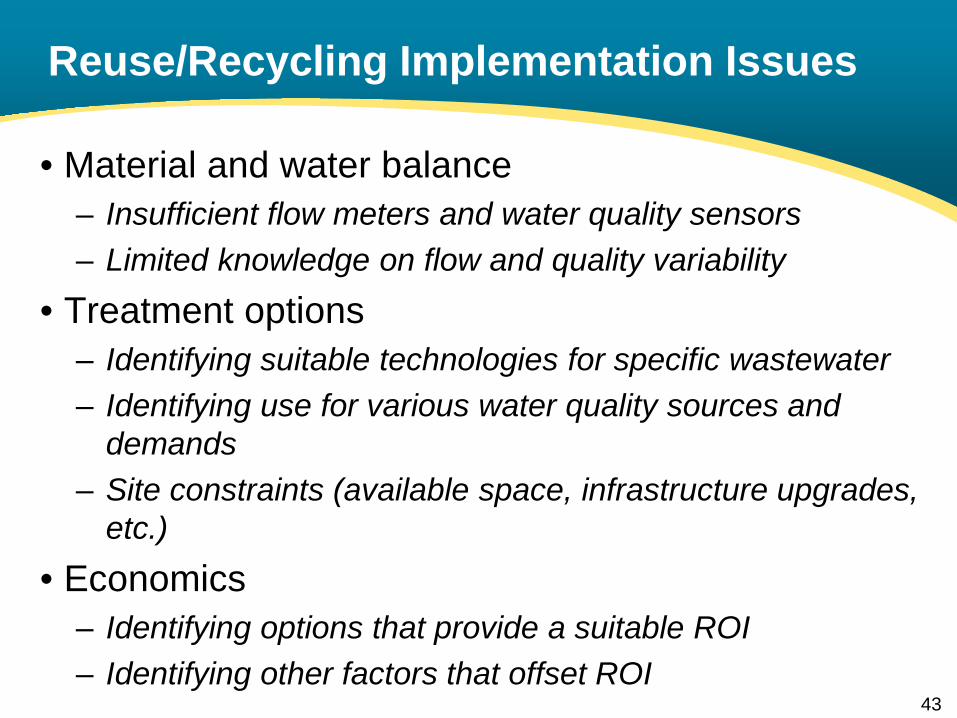
Reuse/Recycling Implementation Issues • Material and water balance
– Insufficient flow meters and water quality sensors – Limited knowledge on flow and quality variability
• Treatment options – Identifying suitable technologies for specific wastewater – Identifying use for various water quality sources and
demands – Site constraints (available space, infrastructure upgrades,
etc.) • Economics
– Identifying options that provide a suitable ROI – Identifying other factors that offset ROI
43
Survey and Workshop Findings
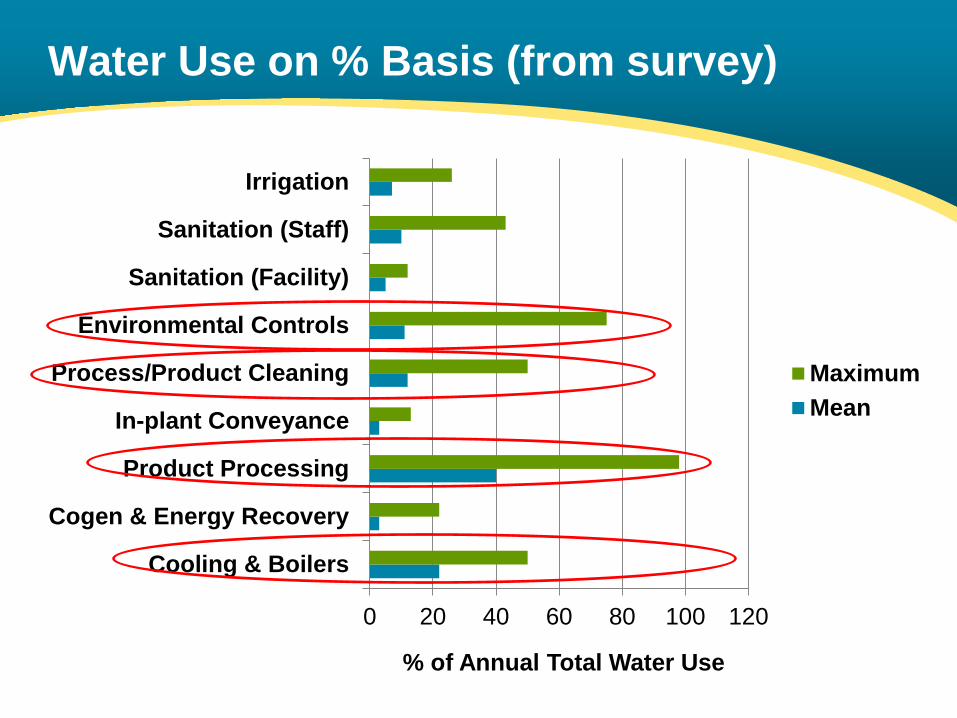
Water Use on % Basis (from survey)
0 20 40 60 80 100 120
Cooling & Boilers
Cogen & Energy Recovery
Product Processing
In-plant Conveyance
Process/Product Cleaning
Environmental Controls
Sanitation (Facility)
Sanitation (Staff)
Irrigation
MaximumMean
% of Annual Total Water Use
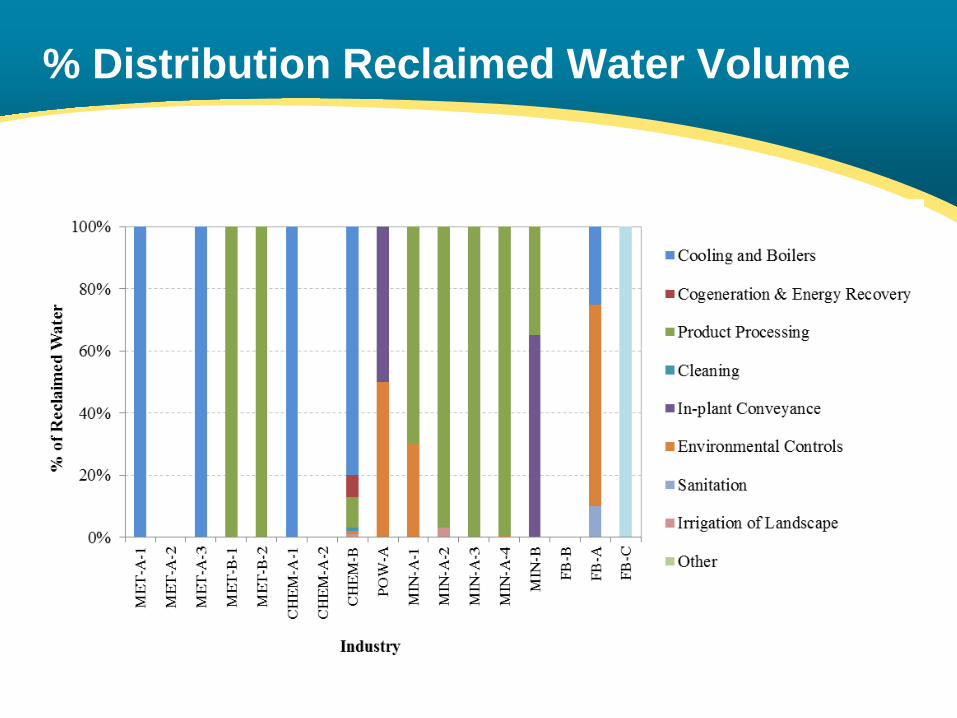
% Distribution Reclaimed Water Volume
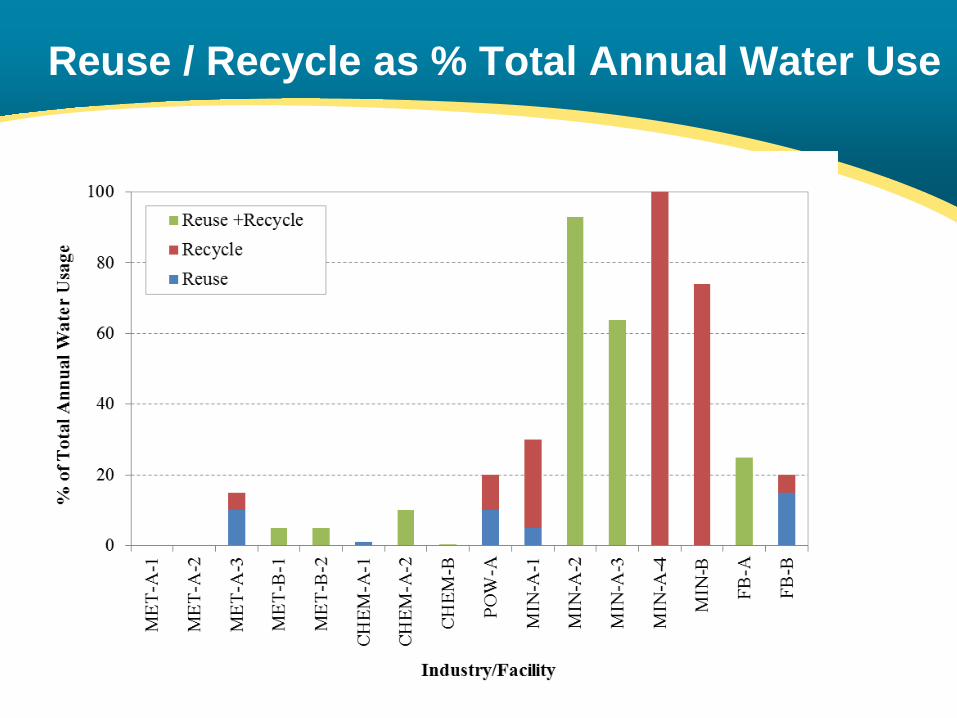
Reuse / Recycle as % Total Annual Water Use
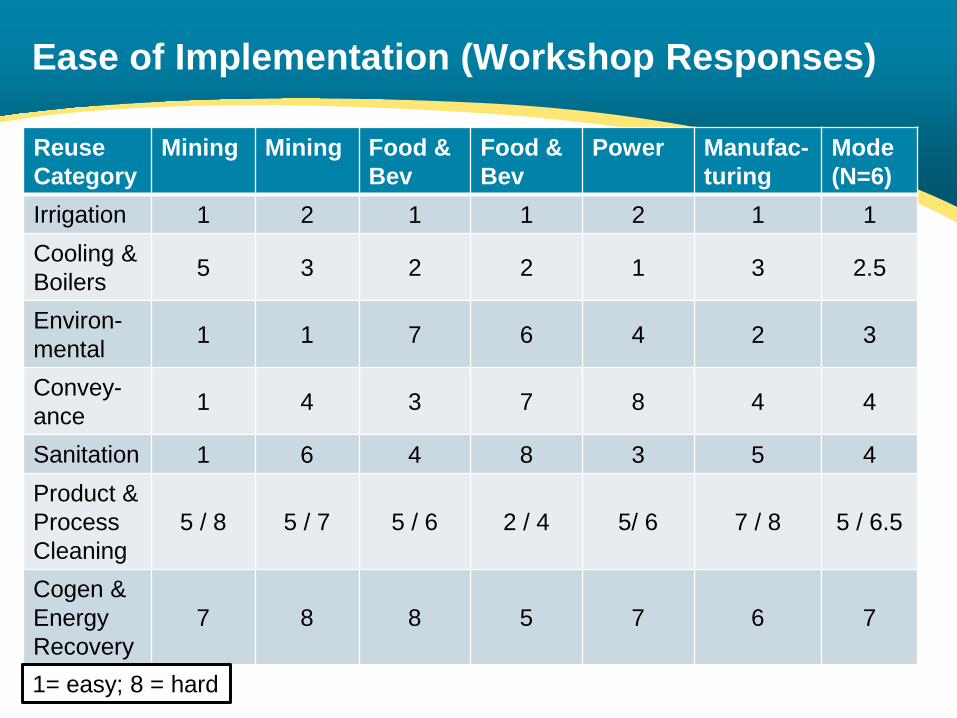
Ease of Implementation (Workshop Responses)
Reuse Category
Mining Mining Food & Bev
Food & Bev
Power Manufac- turing
Mode (N=6)
Irrigation 1 2 1 1 2 1 1 Cooling & Boilers 5 3 2 2 1 3 2.5
Environ-mental 1 1 7 6 4 2 3
Convey-ance 1 4 3 7 8 4 4
Sanitation 1 6 4 8 3 5 4 Product & Process Cleaning
5 / 8 5 / 7 5 / 6 2 / 4 5/ 6 7 / 8 5 / 6.5
Cogen & Energy Recovery
7 8 8 5 7 6 7
1= easy; 8 = hard
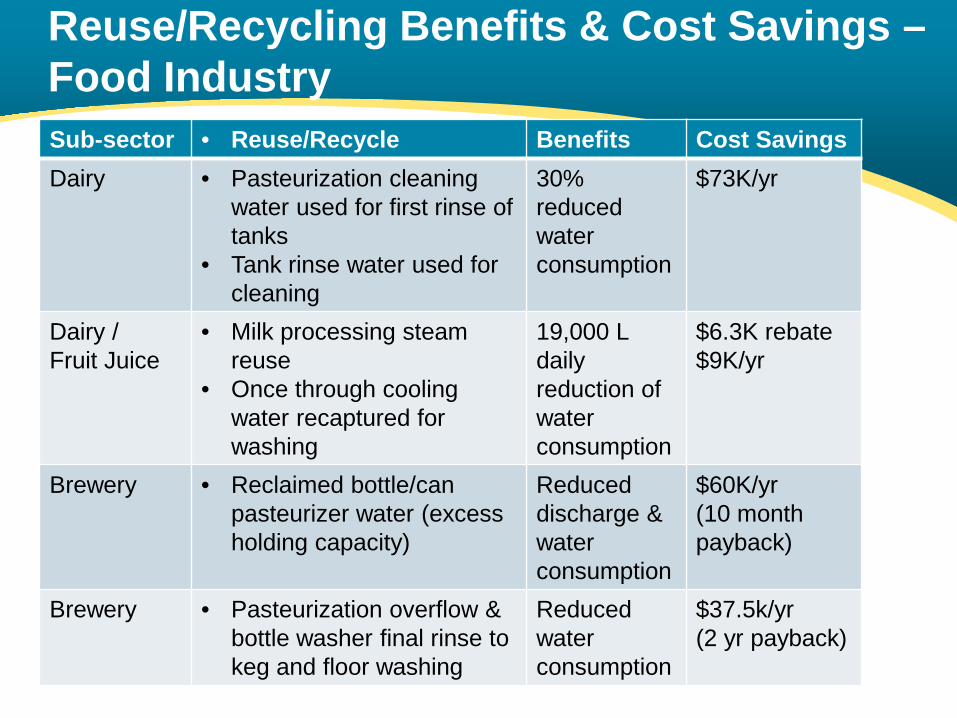
Reuse/Recycling Benefits & Cost Savings – Food Industry Sub-sector • Reuse/Recycle Benefits Cost Savings Dairy • Pasteurization cleaning
water used for first rinse of tanks
• Tank rinse water used for cleaning
30% reduced water consumption
$73K/yr
Dairy / Fruit Juice
• Milk processing steam reuse
• Once through cooling water recaptured for washing
19,000 L daily reduction of water consumption
$6.3K rebate $9K/yr
Brewery • Reclaimed bottle/can pasteurizer water (excess holding capacity)
Reduced discharge & water consumption
$60K/yr (10 month payback)
Brewery • Pasteurization overflow & bottle washer final rinse to keg and floor washing
Reduced water consumption
$37.5k/yr (2 yr payback)
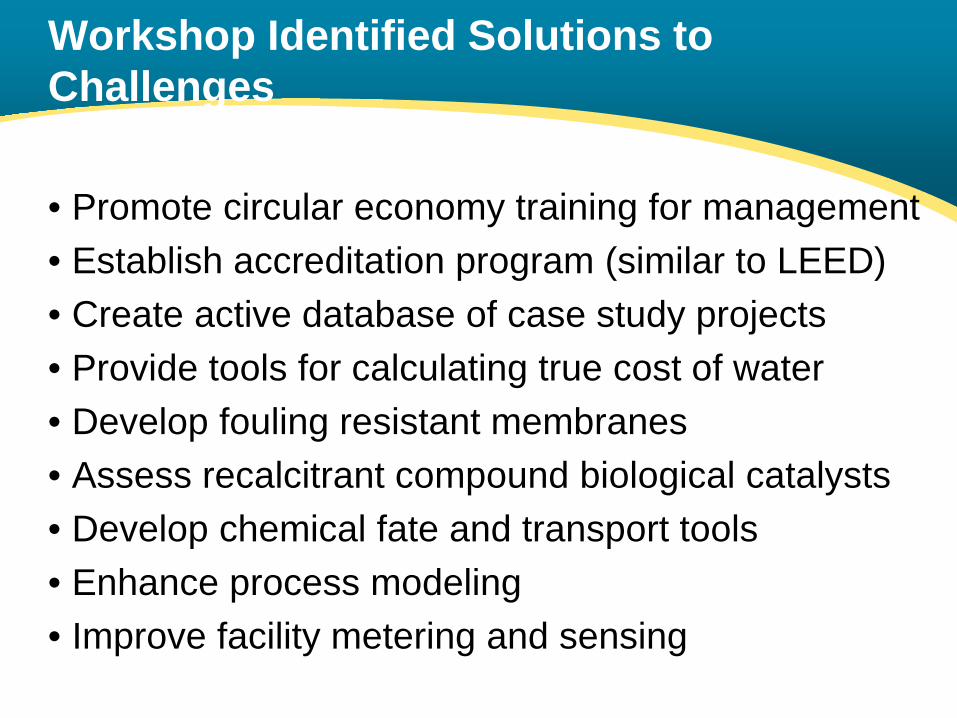
Workshop Identified Solutions to Challenges
• Promote circular economy training for management • Establish accreditation program (similar to LEED) • Create active database of case study projects • Provide tools for calculating true cost of water • Develop fouling resistant membranes • Assess recalcitrant compound biological catalysts • Develop chemical fate and transport tools • Enhance process modeling • Improve facility metering and sensing
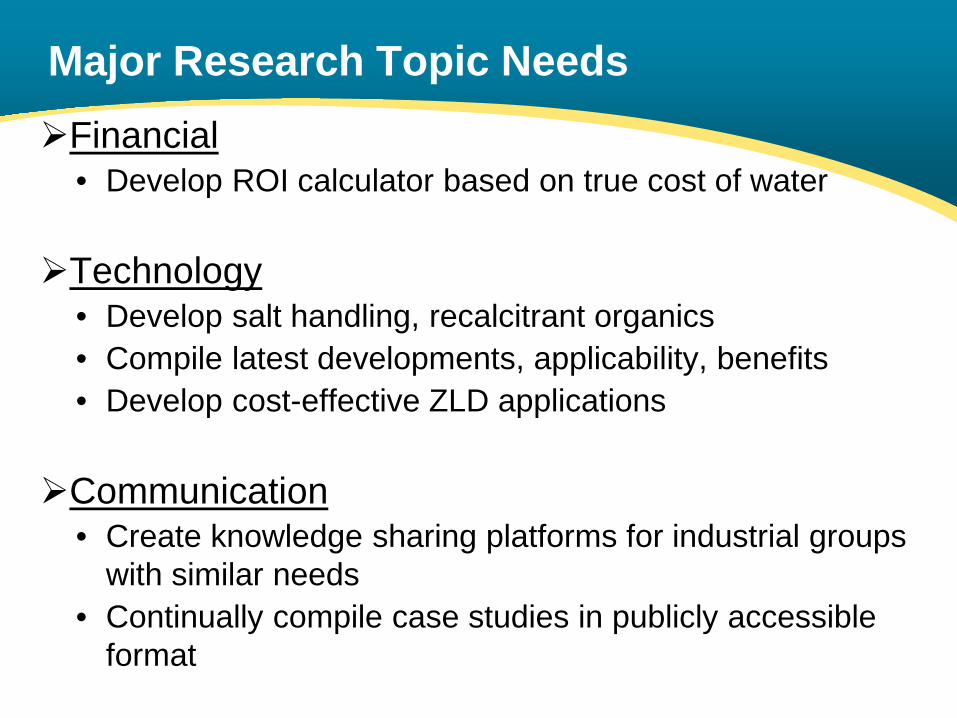
Major Research Topic Needs Financial
• Develop ROI calculator based on true cost of water
Technology • Develop salt handling, recalcitrant organics • Compile latest developments, applicability, benefits • Develop cost-effective ZLD applications
Communication • Create knowledge sharing platforms for industrial groups
with similar needs • Continually compile case studies in publicly accessible
format
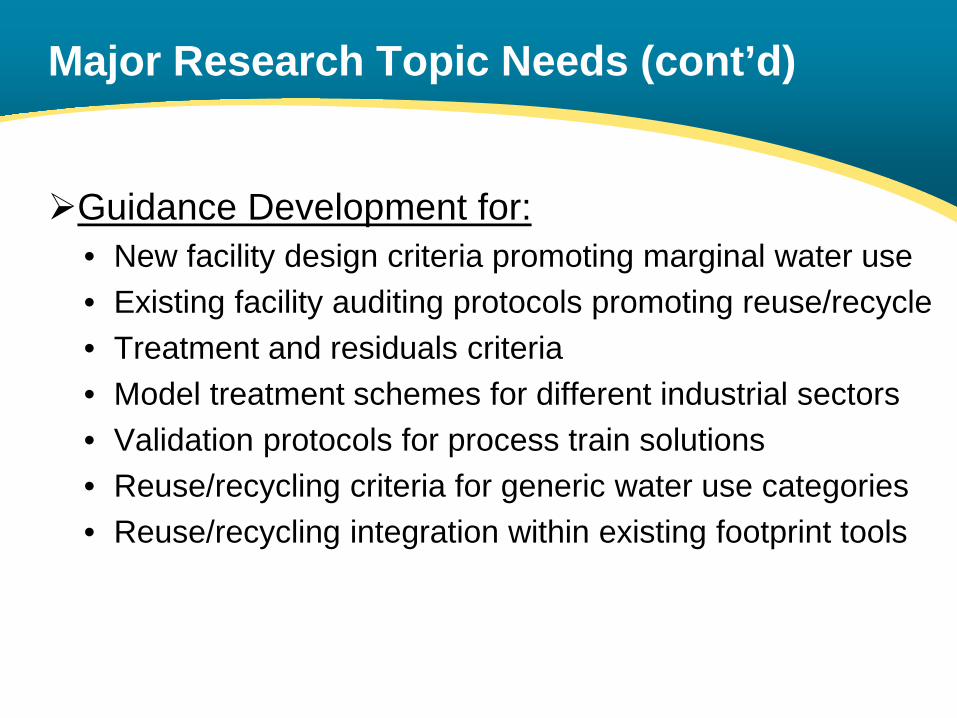
Major Research Topic Needs (cont’d)
Guidance Development for: • New facility design criteria promoting marginal water use • Existing facility auditing protocols promoting reuse/recycle • Treatment and residuals criteria • Model treatment schemes for different industrial sectors • Validation protocols for process train solutions • Reuse/recycling criteria for generic water use categories • Reuse/recycling integration within existing footprint tools
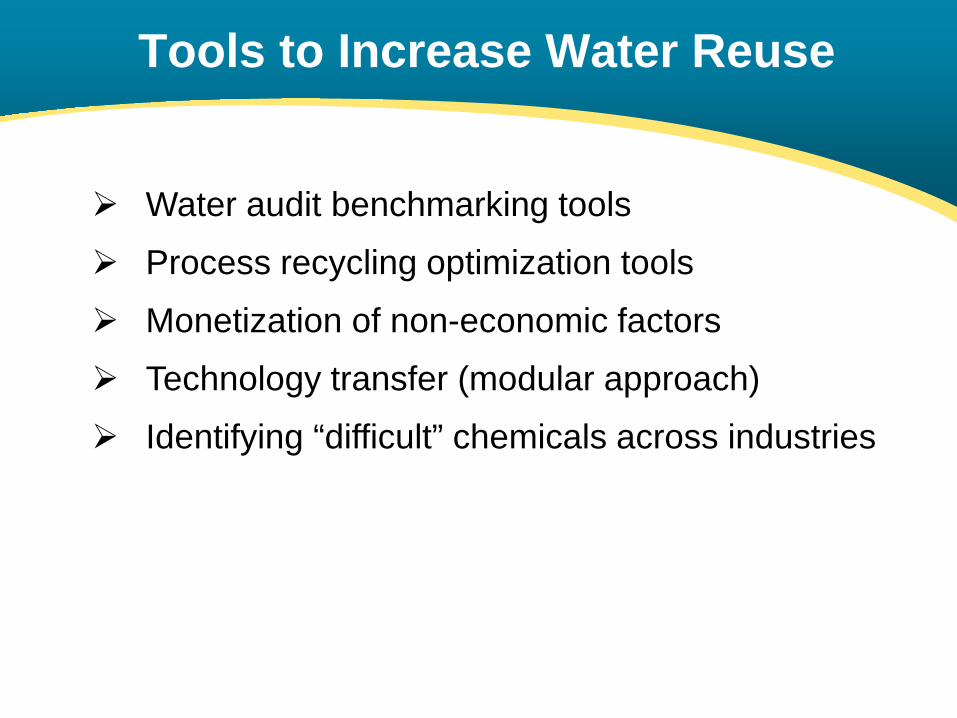
Water audit benchmarking tools
Process recycling optimization tools
Monetization of non-economic factors
Technology transfer (modular approach)
Identifying “difficult” chemicals across industries
Tools to Increase Water Reuse
GLOBAL SUSTAINABILITY COMMITMENTS

3 Kellogg Company Overview
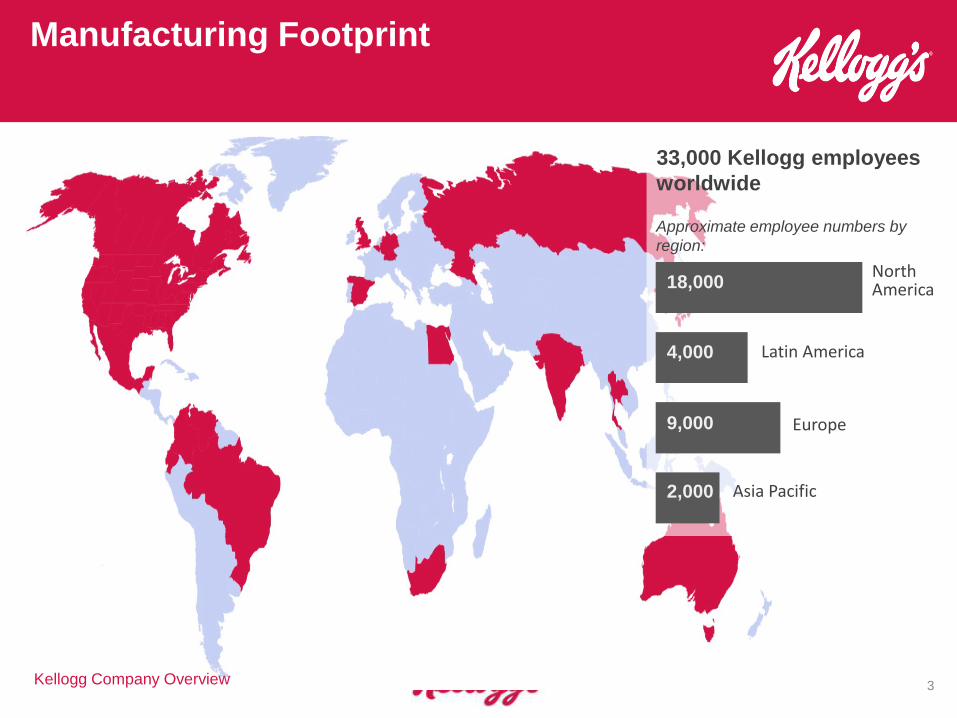
Manufacturing Footprint
33,000 Kellogg employees worldwide
Approximate employee numbers by region:
18,000 North America
4,000 Latin America
9,000 Europe
2,000 Asia Pacific
GLOBAL SUSTAINABILITY COMMITMENTS
Why Sustainability Matters
• Sustainability fits with our core values
• These types of commitments are very important for our consumers, improving the trust in our foods:
• It strengthens the equity (integrity, trust, progress) in our brands
• It drives relevance for our strategic categories
• It builds corporate reputation
• And it supports delivery of business results
GLOBAL SUSTAINABILITY COMMITMENTS
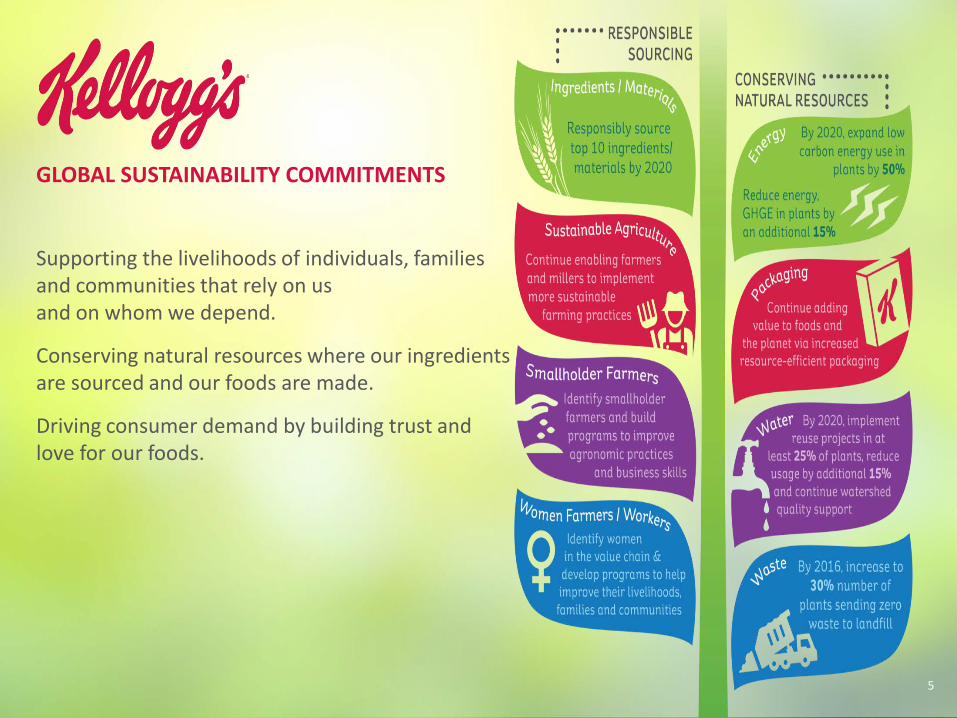
Supporting the livelihoods of individuals, families and communities that rely on us and on whom we depend.
Conserving natural resources where our ingredients are sourced and our foods are made.
Driving consumer demand by building trust and love for our foods.
5
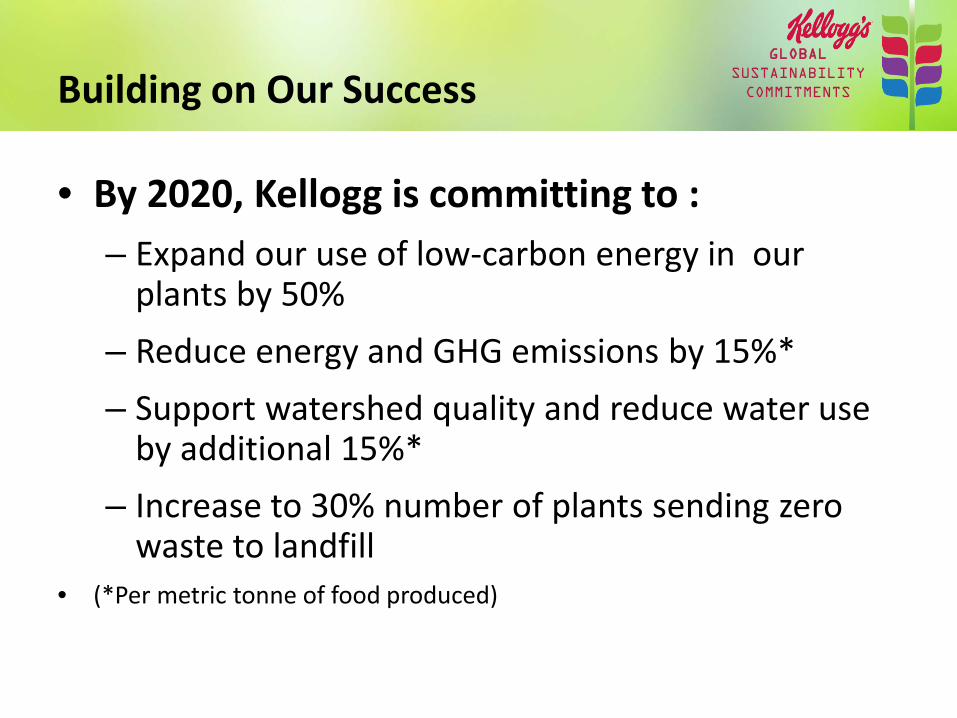
GLOBAL SUSTAINABILITY COMMITMENTS Building on Our Success
• By 2020, Kellogg is committing to : – Expand our use of low-carbon energy in our
plants by 50% – Reduce energy and GHG emissions by 15%* – Support watershed quality and reduce water use
by additional 15%* – Increase to 30% number of plants sending zero
waste to landfill • (*Per metric tonne of food produced)
GLOBAL SUSTAINABILITY COMMITMENTS
Water Reuse Opportunities and Challenges
• Opportunities – Reusing water within the same equipment/system
– Reusing water in nearby non-contact equipment
• Challenges – Food safety is our #1 priority
– Cost of water is low
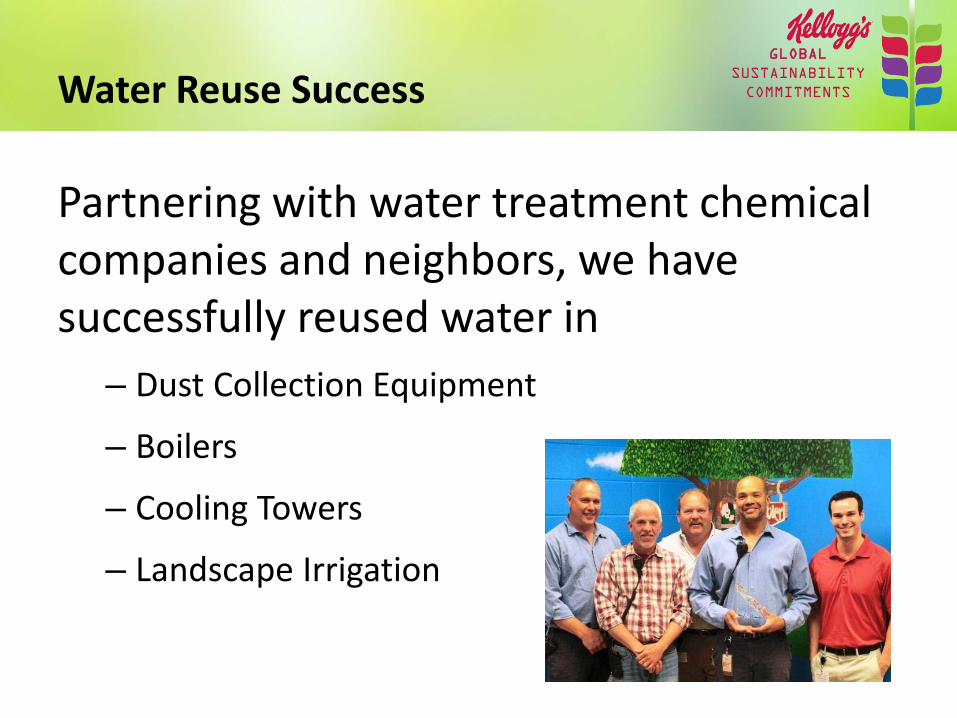
GLOBAL SUSTAINABILITY COMMITMENTS Water Reuse Success
Partnering with water treatment chemical companies and neighbors, we have successfully reused water in
– Dust Collection Equipment
– Boilers
– Cooling Towers
– Landscape Irrigation
Questions?
62
Erin Augustine Kellogg Company
Joan Oppenheimer, BCES MWH Global
Jon Pohl, P.E., LEED AP MWH Global
Submit Your Questions Through the Chat Box
Recommended