Embed Size (px)
Citation preview

DELAWARE’S COVID-19 DATA DASHBOARD
Opportunities and Successes:
How Well Does Delaware’s Data Tool Allow for an
Accurate and Timely Response to the Pandemic?
A COVID-19 SPECIAL REPORT
December 2020 A Special Report by State Auditor Kathleen McGuiness

State of Delaware
Office of Auditor of Accounts
Kathleen K. McGuiness, CFE, RPh
State Auditor
Dear fellow Delawareans,
The coronavirus (COVID-19) pandemic has changed our lives in ways we never
imagined and created much economic uncertainty in its wake.
Government-imposed closures and restrictions necessary to prevent widespread
community transmission of the virus have also wreaked havoc on our economy and will
have a lasting impact on state finances. While the federal government provided more
than a billion dollars in pandemic relief to Delaware, our state, like others, has been
mostly on its own to develop mitigation strategies.
In July 2020, I led a multistate taskforce to develop a consistent tool for fiscal
watchdogs to assess how each state has approached data collection, reporting, and
monitoring of coronavirus cases, both individually and collectively. The intent was to
provide a way for states to determine the quality of the data they use to make policy
decisions, take health actions, and where to invest resources to control virus spread.
The Auditor’s Office is currently working together with the Department of Health and
Human Services (DHSS) to undertake this important engagement.
Since ensuring data quality is vital to successfully mitigating the health and economic impacts of the pandemic, I felt it
necessary to find other ways to assess the performance of Delaware’s pandemic response. This special report provides a
comprehensive review of Delaware’s data dashboard that tracks and analyses coronavirus case data. It compares
Delaware’s dashboard to other states’ dashboards and against 15 indicators that a group led by former CDC Director, Dr.
Thomas Frieden, deemed essential for success. The Association of Schools and Programs of Public Health and the
American Public Health Association have also endorsed these indicators.
My report focuses on the state’s response in the early stages of the pandemic – from the first reported positive case in
March through June 30, 2020. However, we acknowledge that Delaware has made tremendous improvements since this
period. Although we conducted a statewide survey of the long-term care community and engaged with DHSS staff for this
project, our research was mainly limited to data and materials available online.
State officials and health professionals rely on Delaware’s dashboard to make policy decisions. Our hope is that the
findings and recommendations contained in this report help improve ours.
Thank you for the opportunity to serve you.
Sincerely,
Kathy McGuiness, RPh, CFE
401 FEDERAL STREET ● TOWNSEND BUILDING ●3rd Floor● DOVER, DE 19901
Main Office: 302-739-4241
There was no national plan to prepare states for responding to the pandemic. It’s a failure in governance and
leadership from the federal government by all accounts. Delaware is in a unique situation, but its uniqueness
should not be an excuse for not wanting to pull back the curtain to evaluate our state’s performance. The report
is what it is – limited in precision and depth – because my office was directed to go to websites for information.
I acknowledge that Delaware is in the midst of a health and fiscal emergency, but as the state’s fiscal watchdog
it is my duty to ensure quality data drives decision-making and communications are transparent particularly
when it involves the people’s money. This report includes areas my office identified for improvement. I’m
hopeful the necessary controls will be put in place for better data and better decisions, both for state government
and the public. I look forward to DHSS’s response to provide a fuller understanding and to grant us greater
information access to perform our due diligence. Improvement comes only when we know what needs
improving.
Auditor’s Comment

Executive Summary Pg. 1
Abbreviations Pg. 1
Background Pg. 3
Summary of Observations Pg. 9
Best Practice Indicators:
▪ Indictors 3, 4, 10, 11 – Testing Pg. 16
▪ Indicator 1 – Cases Pg. 18
▪ Indicators 2, 12, 13 - Contact Tracing Pg. 20
▪ Indicator 8 - Congregate Facilities Pg. 23
▪ Indicators 6 and 7 – Hospitalizations Pg. 25
▪ Indicator 9 - Outcome Deaths Pg. 27
▪ Indicator 14 - Healthcare Workers Pg. 29
▪ Indicator 15 - Facial Masks Pg. 31
Recommendations Pg. 33
Conclusion Pg. 36
Appendices
▪ Appendix 1 – 15 Best Practice Dashboard Indicators Pg. 37
▪ Appendix 2 – Delaware Dashboard Progression (Graph) Pg. 38
▪ Appendix 3 – Data Dashboard As of June 2020 Pg. 39
▪ Appendix 4 – Data Dashboard As of October 2020 Pg. 39
TABLE OF CONTENTS

Page | 1
The Office of the Auditor of Accounts Office (OAOA) prepared this special report to review Delaware’s public
reporting of COVID-19 data. The objective was to provide a clear and unbiased assessment of the public health
efforts carried out by the Delaware Department of Health and Social Services (DHSS) in the early stages of the
pandemic, March 11, 2020 through June 30, 2020. This includes when the state first made information about
testing and cases publicly available on a data dashboard. We also periodically reviewed the data dashboard
beyond this time period to identify and acknowledge improvements made to it, with our last review on October
15, 2020 before the writing of this report.
The OAOA completed a detailed evaluation of other states’ dashboards to determine if Delaware’s dashboard:
▪ Presented key essential data indicators;
▪ Provided performance and outcome measures;
▪ Represented an accurate assessment of the overall health and status of the community at large;
▪ Included information on data validation controls and oversight; and
▪ Provided usable and clearly presented data.
Additionally, the OAOA evaluated whether the dashboard followed best practices. Our evaluation found that
Delaware’s data dashboard followed some best practices, but also fell short in other areas for the period ending
June 30, 2020. For example, the dashboard contained all pertinent information related to cases of COVID-19 like
illnesses; however, on testing provided only partial information and no information for congregate facilities.
We also found that the data reported during the pandemic was sometimes inconsistent, may have been
incomplete, and a greater level of information was shared much later in the pandemic than shared in earlier
stages. We identified opportunities for improvement related to providing more comprehensive data dashboard
reporting; communicating the linkage between COVID-19 data and the decisions made in response to the
pandemic; and providing more clear and concise preparedness information for the public.
By reviewing the observations and implementing the recommendations herein, we believe that Delaware’s
COVID-19 dashboard would become an effective source of information used to control the spread of COVID-
19 in Delaware going forward.
Abbreviations
CDC Centers for Disease Control and Prevention
CMS Centers for Medicare and Medicaid Services
COVID-19 Coronavirus Disease 2019
DHSS (Delaware) Department of Health and Social Services
DPH Division of Public Health
FDA Food and Drug Administration
FEMA Federal Emergency Management Agency
HHS (Federal) Department of Health and Human Services
NCHS National Center for Health Statistics
EXECUTIVE SUMMARY

Page | 2
NIH National Institutes of Health
NVSS National Vital Statistics System
OSHA Occupational Safety and Health Administration
PPE Personal Protective Equipment
RTSL Resolve to Save Lives
SARS Severe Acute Respiratory Syndrome
SARS-CoV-2 Severe Acute Respiratory Syndrome, Coronavirus 2
WHO World Health Organization

Page | 3
What is Public Health?
Public health is the branch of medicine dealing with the science of protecting and improving the health of
people and their communities1. One aspect of public health focuses on detecting, preventing, and responding
to infectious diseases, including but not limited to epidemics and pandemics. The Delaware Department
of Health and Social Services (DHSS) is the state agency responsible for improving the quality of life for
Delaware citizens and for promoting health and well-being, fostering self-sufficiency, and protecting vulnerable
populations. The Division of Public Health (DPH) focuses on putting the knowledge of the public health field
into practice in Delaware. The Delaware Code Title 16 Chapter 5, titled: “Contagious Diseases Generally” lays
out the framework within which DHSS/DPH and other relevant parties must perform their work related to
infectious diseases.2 Delaware Code provides requirements of what diseases healthcare providers must report,
how they must report them, and provides authority for isolation and quarantine of individuals by public health
authorities at the state and local government levels.
What is COVID-19?
Pandemics have occurred intermittently over
centuries. Although the timing cannot be predicted,
history and science suggest that we will face more
pandemics in the future. On February 11, 2020, the
World Health Organization (WHO) announced
through a press briefing, the official name for the
disease that is responsible for the 2019 novel
coronavirus outbreak, first identified in Wuhan
China. The new name of this disease is coronavirus
disease 2019, abbreviated as COVID-19. In
COVID-19, ‘CO’ stands for ‘corona,’ ‘VI’ for
‘virus,’ and ‘D’ for disease. Formerly, this disease
was referred to as “2019 novel coronavirus” or “2019-nCoV”.3 Severe acute respiratory syndrome coronavirus
2 (SARS-CoV-2), the virus that causes coronavirus disease 2019 (COVID-19), is highly contagious and has
generated a worldwide pandemic.4
1 “What Is Public Health? | CDC Foundation.” Www.Cdcfoundation.org, www.cdcfoundation.org/what-public-
health#:~:text=Public%20health%20is%20the%20science%20of%20protecting%20and. 2 “TITLE 16 - CHAPTER 5. Contagious Diseases Generally - Subchapter I. General Guidelines.” Delcode.Delaware.Gov,
delcode.delaware.gov/title16/c005/sc01/index.shtml. 3 CDC. “Coronavirus Disease 2019 (COVID-19) FAQ” Centers for Disease Control and Prevention, (2020),
https://www.cdc.gov/coronavirus/2019-ncov/faq.html#:~:text=In%20COVID%2D19%2C,%2Drespiratory%20tract%20illnesses. 4 Sharma, Atul et al. “Severe acute respiratory syndrome coronavirus-2 (SARS-CoV-2): a global pandemic and treatment strategies.”
International journal of antimicrobial agents vol. 56,2 (2020): 106054. doi:10.1016/j.ijantimicag.2020.106054
BACKGROUND

Page | 4
What is the COVID-19 Timeline in the United States and Delaware?
COVID-19 has appeared and spread extremely fast, making its way to over 213 countries and territories since its
December 2019 discovery in China5. The WHO declared COVID-19 a public health emergency of international
concern on January 30, 2020 and elevated it to a pandemic on March 11, 20205. The U.S. had its first confirmed
cases of COVID-19 on January 21, 2020 in Washington State from a man who had returned from Wuhan, China6.
The first instance of a person transmitting COVID-19 to another person while in the U.S. was reported in Chicago,
Illinois, on January 30, 20207. The early cases of COVID-19 in the U.S. were limited to individuals who had
traveled from China and those they interacted closely with.8 On February 26, 2020, the Centers for Disease
Control and Prevention (CDC) confirmed a case in California with no reported travel connection to China or
exposure to another person.9
On March 8, 2020, Delaware Governor John Carney launched a universal testing program, to increase COVID-
19 testing for healthcare workers.
Delaware identified its first case on March 11, 2020 in New Castle County and on March 26, 2020 the first person
in Delaware died from COVID-1910. These occurrences launched the subsequent actions and responses taken in
Delaware to address the pandemic. The early response focused on reducing the spread of the virus to prevent our
health system (e.g., hospitals) from becoming overwhelmed or collapsing through the implementation of
unprecedented restrictions and the implementation of testing individuals with COVID-19 symptoms.
On March 12, 2020 Governor Carney declared a State of Emergency in Delaware and on the following day he
directed a two-week closure of Delaware’s public and charter schools.11 The first three modifications to the State
of Emergency declaration were issued on: March 16th, March 18th, and March 21st. In early March, daily updates
on positive and negative COVID-19 cases started to be announced on Delaware’s “Delaware News” webpage. On
March 22, 2020, Governor Carney issued the fourth and fifth modifications to his State of Emergency declaration,
ordering Delawareans to stay home whenever possible and closing all non-essential businesses in the state to help
stop community spread of COVID-19. On March 23, 2020 Delaware began operating standing health facility test
sites where healthcare staff began testing individuals who were evaluated by a medical provider and had symptoms
consistent with COVID-19.
West Virginia became the first state to require universal testing, through an executive order issued April 17, 2020.
On April 19, 2020, DPH announced through the Delaware News webpage that on April 20, 2020 it would begin
providing daily updates on COVID-19 statistics through its dashboard. “This change allowed the state to begin
providing additional data on key demographic information, such as race/ethnicity for positive cases and deaths, as
5 “Timeline: WHO’s COVID-19 Response.” World Health Organization. https://www.who.int/emergencies/diseases/novel-
coronavirus-2019/interactive-timeline#event-42 6 CDCMMWR. “Evidence for Limited Early Spread of COVID-19 Within the United States, January–February 2020.” MMWR.
Morbidity and Mortality Weekly Report, vol. 69, 2020,
www.cdc.gov/mmwr/volumes/69/wr/mm6922e1.htm?s_cid=mm6922e1_w#F1_down, 10.15585/mmwr.mm6922e1. 7 Ghinai, Isaac, et al. “First Known Person-to-Person Transmission of Severe Acute Respiratory Syndrome Coronavirus 2 (SARS-
CoV-2) in the USA.” The Lancet, vol. 395, no. 10230, 4 Apr. 2020, pp. 1137–1144,
www.thelancet.com/journals/lancet/article/PIIS0140-6736(20)30607-3/fulltext, 10.1016/S0140-6736(20)30607-3. 8 Ibid 9 Ibid 10 “Public Health Announces First Presumptive Positive Case of Coronavirus in Delaware Resident.” State of Delaware News, 11 Mar
2020. https://news.delaware.gov/2020/03/11/public-health-announces-first-presumptive-positive-case-of-coronavirus-in-delaware-
resident/ 11 “Governor Carney Closes Delaware Schools Through May 15” State of Delaware News, 23 Mar. 2020,
https://news.delaware.gov/2020/03/23/governor-carney-closes-delaware-schools-through-may-15/

Page | 5
well as age-adjusted incidence rates by zip code.”12 States including New York, Arizona, Texas, New Jersey,
Delaware, West Virginia, Pennsylvania, and South Dakota initiated plans to test residents and workers at long-
term care facilities the week of May 11, 2020. In total, there have been 27 modifications to Delaware’s State of
Emergency during the period from March 1, 2020 through October 31, 2020. As this pandemic has progressed,
Delaware’s elected government officials and public health experts have continued to adjust and refine their virus
mitigation approach as they have learned more about this disease and its treatment protocols.
What are Public Health and Social Measures?
Worldwide, the COVID-19 pandemic has resulted in unprecedented public health and social measures from
border restrictions, air travel restrictions, school closures, mandatory facemask use,
social distancing requirements, and stay at home orders. Delaware instituted a variety
of public health and social measures in different combinations of varying durations
and at different time periods during the pandemic to limit the transmission of
COVID-19. As more knowledge is obtained on the COVID-19 disease and
transmission, elected government officials and public health experts are tasked with
issuing informed and urgently needed recommendations for the easing of certain
restrictions many of which are associated with significant social and economic costs.
The availability of accurate and real-time data to inform decision-making is essential
for COVID-19 infectious disease control and public trust.
12 “MEDIA ADVISORY: Public Health Makes Changes to Daily COVID-19 Reporting Format.” State of Delaware News, 19 Apr.
2020, https://news.delaware.gov/2020/04/19/media-advisory-public-health-makes-changes-to-daily-covid-19-reporting-format/
The availability of
accurate and real-
time data to inform
decision-making is
essential for COVID-
19 infectious disease
control and public
trust.

Page | 6
What is a Data Dashboard?
A data dashboard is a reporting tool that visually monitors, analyzes, and reports key metrics and data points to
track a specific process.13 Data dashboards take vast amounts of raw data and consolidate it in a way that enables
the reader to interpret it for decision-making. For example, in order to track the progression of COVID-19 in
Delaware, the state would have to obtain data from all hospitals and long-term care facilities within each of the
three counties. Since this a large amount of data, the dashboard converts all the data into one format and
compresses it to fit the end-user’s needs. From there, the dashboard displays the information in a way that allows
the end-user to understand complex relationships in the data. This allows the state to track the number of cases,
monitor the progression of COVID-19, and report important COVID-19 data to all Delawareans.
State Government and Data Transparency and Accountability
Government data is expected to be a reliable source of information for the public, as this
data is the basis for government officials’ decisions on public health and social measures.
State governments are here to serve the public truthfully, with integrity, and now more than
ever must be transparent and accountable. Each state in the U.S. made great efforts to
provide the public with timely and transparent COVID-19 data via their websites and data
dashboards. Consequently, there have been many differences in the amount and types of
data that each state presents. A July 2020 review of outbreak data by former CDC Director,
Tom Frieden, revealed that “…no state discloses even half of what health experts consider
essential indicators for managing the disease”.14
These variances can lead to inaccuracies, misleading data, mistakes, and missed data
warnings.
In July 2020, Resolve to Save Lives (RTSL), an initiative of the public health group
Vital Strategies, conducted a review of how the dashboards of each state reported
COVID-19 data. The group developed 15 best practice essential indicators (Appendix
1) that should appear in each state’s dashboard. The group furthered their review by
stating whether states had exact, incomplete, or no information within their
dashboards. They determined that each of these indicators is vital for monitoring
COVID-19 in each state. Consequently, the OAOA chose this benchmark as a basis
for reviewing Delaware’s COVID-19 Dashboard. The Association of Schools and
Programs of Public Health and the American Public Health Association have also
endorsed these indicators.
Data Dashboard and Website
Due to the unexpected rise of the COVID-19 virus, DHSS/DPH began capturing, tracking, and reporting COVID-
19 data metrics/indicators to the public, beginning in March 2020. Delaware responded quickly with a basic
informational COVID-19 website (de.gov/coronavirus.delaware.gov) until they were able to customize a more
comprehensive COVID-19 data dashboard. The initial website provided confirmed COVID-19 cases by zip code.
13 “What is a data dashboard?” Klipfolio, https://www.klipfolio.com/resources/articles/what-is-data-
dashboard#:~:text=A%20data%20dashboard%20is%20an,business%2C%20department%20or%20specific%20process 14 Kaplan, Sarah, et al. “Washington Post- The code: How genetic science helped expose a secret coronavirus outbreak.” The
Washington Post, 24 Sept. 2020, https://www.washingtonpost.com/graphics/2020/national/genetic-science-coronavirus-outbreak-
iowa/
A review of outbreak
data led by former
CDC Director, Tom
Frieden, found no
state discloses even
half of what heath
experts consider
essential indicators for
managing the disease.
State governments
are here to serve
the public
truthfully, with
integrity, and now
more than ever
must be
transparent and
accountable.

Page | 7
In April 2020, DPH rolled out their COVID-19 data dashboard on the “My Healthy Community” webpage
(https://myhealthycommunity.dhss.delaware.gov/locations/state). Per an interview with DHSS, Delaware
expanded its existing environmental public health tracking network to include the COVID-19 data and provide
linkage to the DHSS website. This initiative required resources to customize and build the infrastructure for the
COVID-19 data dashboard and ensure that the website was HIPPA compliant. Since then the state has been
updating and communicating information to the public on the progression of the outbreak and has included
information regarding testing, state reopening plans, community resources, and guidance for medical providers
and other facilities on the DPH website (de.gov/coronavirus). Data available for download includes information
from March 11, 2020 to present and is updated every seven days. Sources of this information include data from
the American Communities 5-year Survey; Delaware Health Information Network (DHIN), and DHSS.
Due to its ability to capture and analyze granular information, the dashboard has become a vital resource to help
understand the virus spread, inform the public, and brief policymakers in order to guide responses to the pandemic.
The timing of Delaware’s creation and implementation of the data dashboard is
equivalent to surrounding states. Pennsylvania, West Virginia, and Ohio each
implemented the use of a COVID-19 data dashboard in March.
Since COVID-19 was a new unknown disease, there were both initial misconceptions
and knowledge gained over time as we learned more about the disease. This may have
been a factor in DHSS/DPH determining what data was to be made public; when it
should be delivered; and how it should be displayed to give context and insight for the
public. Delaware’s COVID-19 Dashboard is still a work in progress. While it contains
basic elements needed to track the spread of the disease, it still lacks information for
specific essential indicators. Figure 1 shows the progression of the dashboard over three
separate periods of time to illustrate how it has evolved.
Figure 1: Dashboard Sections Added Over Time
As of March 31, 2020 As of June 30, 2020 As of October 31, 2020
N/A General Overview General Overview
N/A Testing Testing
Cases Cases Cases
N/A Outcomes Outcomes
N/A Mitigation Contact Tracing
The General Overview section displays key public health information. As of June 30, 2020, this information
covered:
▪ Cumulative number of positive cases;
▪ Positive cases by county;
▪ Current hospitalizations;
▪ Recoveries;
▪ Deaths;
▪ School reopening criteria;
Delaware’s COVID-
19 Dashboard is still
a work in progress.
While it contains
basic elements
needed to track the
spread of the
disease, it still lacks
information for
specific essential
indicators.

Page | 8
▪ Healthcare system status; and
▪ Personal Protective Equipment (PPE) inventory statuses.
This data is explained in detail in other sections of Delaware’s COVID-19 Data Dashboard and stratified for
analysis purposes. To better understand the amount of positive cases, the General Overview section includes an
interactive chart that separates the state by zip code. Once the end-user hovers over a certain area, the graph
displays the amount of positive cases per 10,000 people in that given area. Current hospitalizations, positive cases,
and syndromic surveillance are also displayed in graph form. The end-user has the option to view trends within
this information for 14, 30, and 90-day charts.
The Testing section provides the total amount of persons tested and is stratified by county and race/ethnicity.
While brief, the data includes rates and counts allowing for geographic and demographic comparisons.
The Cases section includes positive cases within the state and is stratified by county, age, sex, and race/ethnicity.
It is further broken down into probable vs. confirmed cases and those cases that belong to residents of long-term
care facilities. This section also contains a map of the state that tracks the amount of new positive cases per 10,000
people. When the end-user clicks on the graph, it becomes shaded with shade variations based on the total amount
of cases. It then displays the progression of positive cases from June 18, 2020 to present.
The Outcome section of the dashboard quantifies the total amount of deaths and the total amount of recoveries.
It is stratified in the same manner as the Cases section, but also includes recent deaths that are updated every
seven days.
Lastly, the Contact Tracing section (formerly the Mitigation section), provided in a separate link, displays the
work that public health staff has done with individuals who have tested positive. This includes information that
is used to understand how positive individuals recall any individuals they were in contact with during the
timeframe they may have been infectious. Contacts are identified by those who have been reached and those
without the necessary contact information to be reached. A mitigation strategies timeline has also been included
to review steps taken by Delaware to control the spread of COVID-19.

Page | 9
National View of Missing Essential Indicators
The U.S. does not have common national data standards for COVID-19. As a result, each state’s public reporting
of data points (data dashboard) on the virus is different, which limits the ability to consistently compare COVID-
19 reporting across state borders. The July 2020 Resolve to Save Lives (RSTL) “Tracking COVID-19 in the
United States” report contained a review of the dashboards for all 50 states, the District of Columbia, and Puerto
Rico. RTSL used it to assess how many of the benchmark 15 essential indicators states were reporting. The RTSL
found:
▪ Only 2% off the exact essential indicators were reported;
▪ 38% of indicators were reported, but had data limitations or were not stratified adequately; and
▪ 60% of the indicators were not reported.
The 15 essential indicators represent 780 critical pieces of information that should be stratified by important
variables such as age, sex, and race/ethnicity. Stratifying the large amount of data into smaller pieces ensures that
patterns and trends can be recognized. These indicators include:
▪ Cases,
▪ Testing,
▪ Test time,
▪ Percent of positive tests,
▪ Syndromic surveillance,
▪ Hospitalization,
▪ Deaths,
▪ Contact Tracing,
▪ Masks,
▪ Healthcare workers, and
▪ Congregate facilities.
The majority of the data missing from state dashboards was related to testing and contact tracing. Out of the 52
dashboards, not a single state reported polymerase chain reaction (PCR) test turnaround time. Of the 156 critical
pieces of information on contact tracing programs, only three states (or 2%) are reported in some way and zero
in the optimal way needed.
State of Delaware View of Partial and Missing Essential Indicators
Overall, we concluded that as of July 2, 2020, Delaware did not have a comprehensive data dashboard that
included all best practice data metrics/indicators and associated goals/thresholds required for full
transparency to the public.
According to the “Tracking COVID-19 in the United States,” Delaware’s dashboard ranked 14th with an assigned
a score of 23% in comparison to other states for the amount and quality of COVID-19 tracking data presented in
SUMMARY OF OBSERVATIONS

Page | 10
the dashboard. The highest and lowest scores assigned by the benchmark group were to Minnesota and Kentucky
that scored 43% and 3% respectively.
The same report also states, “Currently only 18% of states report data on Influenza-like
illness (ILI) as part of their COVID-19 dashboard, and only 37% report data on
COVID-like illness (CLI). Some states report on ILI in a separate location, since this
information was tracked before the COVID-19 pandemic.”15 The report also revealed
that Delaware’s dashboard contained all pertinent information for Syndromic
Surveillance (Indicator 5). Delaware was one of the few states that provided information
on syndromic surveillance indicators. Since COVID-19 symptoms are similar to that of
the flu, tracking this information helps predict the transmission of the disease.
While Delaware’s dashboard contains the one indicator noted above, there are notable
deviations when it comes to the other indicators. Of the fifteen best practice essential
indicators that the group recommended to be immediately reported, Delaware included partial data and/or
unstratified data for five of the indicators, and nine of the indicators were missing entirely from Delaware’s data
dashboard.
The five (5) indicators with partial information are:
1. New confirmed and probable cases and per capita rates by date with 7-day moving
average;
2. New screening (e.g. antigen) and diagnostic (e.g. PCR) testing per capita rates by
date, with threshold, with 7-day moving average;
3. Percentage of screening (e.g. antigen) and diagnostic (e.g. PCR) tests positive by
date, with threshold, with 7-day moving average;
4. COVID-19 daily hospitalization per capita rates and 7-day moving average; and
5. New COVID-19 confirmed and probable deaths and per capita rates with 7-day
moving average
The nine (9) missing indicators are:
1. Percentage of new cases epidemiologically linked to at least one other case, stratified
by whether part of known outbreak or not, with threshold
2. Percentage of licensed beds occupied by suspected and confirmed COVID-19
patients
3. List of long-term care and other congregate facilities, and essential workplace outbreaks with COVID-19
cases and deaths in residents and staff
4. Diagnostic test turnaround time (i.e. specimen collection to test report), by week
5. Time from specimen collection to isolation of cases, by week
6. Percentage of cases interviewed for contact elicitation within 48 hours of case specimen collection,
including all people with positive tests who reside in the jurisdiction, by week
7. Percentage of new cases from among quarantined contacts, by week
8. New infections among healthcare workers not confirmed to have been contracted outside of the workplace,
by week
15 “Tracking COVID-19 in the United States.” Prevent Epidemics, preventepidemics.org/covid19/resources/indicators/.
Delaware was one
of the few states
that provided
information on
syndromic
surveillance
indicators.
Of the 15 best
practice essential
indicators
recommended to
be immediately
reported, five (5)
include partial
data and nine (9)
were missing
completely from
Delaware’s data
dashboard.

Page | 11
9. Percentage of people wearing masks correctly in public indoor settings, based on direct observation or
security camera analysis, by a standard, consistent method, by week
While these indicators were presented with partial information as of June 2020, a current review of Delaware’s
dashboard as of October 2020 reveals that the state has updated the information within these indicators. For
example, new confirmed and probable cases and per capita rates by date with 7-day moving average was not
available on the Delaware dashboard in June.
Because of the disproportionate demographic impact of COVID-19, “information such as age, sex, race, and
ethnicity is required to understand disease spread and adequately target interventions to control it.”16 These
indicators should be reported in accordance with best practices in order to identify patterns in the spread of the
disease. The availability of weekly data versus cumulative data is more informative of the current situation and
better directs response actions.
Data Dashboard Best Practices
According to the July 2020 “Tracking COVID-19 in the United States” report, “data dashboards should follow a
number of best practices, including clearly identifying the intended audience, prioritizing key measures, having
a clear organization and layout, and presenting information to inform on health equity, updating information
daily, and clearly labeling data and graphics. Other best practices include using rates rather than counts, which
allows for geographic and demographic comparisons, and smoothing or averaging data over time to better
accounts for variability in reporting or low numbers.”
Our review of Delaware’s dashboard found that it evolved during the pandemic from March to June to the present
and began including some of these best practices (e.g., labeling data and graphics, providing data download
capability, and presenting information on long-term care facilities). However, we also found that the dashboard
did not address the following:
▪ Intended Audience: The data dashboard did not clearly identify the intended audience (e.g. healthcare
workers, parents with children in school, elderly in long-term care facilities).
▪ Navigation and Presentation: The organization, layout, and usability could be improved now that much
more extensive data has been added so that is it easier for the public to maneuver and locate information
and for them to understand the context of the data provided.
▪ Functionality: The website did not include website chat functionality to help improve public engagement.
▪ Websites Linked: The website did not include links to other key state and county websites in a clear and
conspicuous way.
Communicating and Monitoring COVID-19 in Delaware: Data Use, Quality, Decisions, Methodology, and
Rationale
Delaware had opportunities to improve communications and to provide better information on the
dashboard/website to: enhance understanding of the virus status as it progressed; address the information needs
of all Delawareans; and support greater transparency and understanding of data by the public to help mitigate the
transmission and risk of exposure.
16 “Tracking COVID-19 in the United States.” Prevent Epidemics, preventepidemics.org/covid19/resources/indicators/.

Page | 12
Delaware did not make the following information available or present it in a format that would help support the
best public consumption and framework for the data.
▪ Delaware did not have a color-coded risk alert system to support decision-making and communicate with
the public to help support the necessary behavior change. Other states, cities, and counties have adopted
a color-coded system which included specific information used to make decisions. These states include
Minnesota17, Ohio18, Utah, Texas, and South Carolina.
▪ Delaware did not provide a summary of its designated data metrics/indicators that would explain each
data point. It was unclear if there were goals or specific thresholds assigned to metrics/indicators at
different points during the pandemic. These should be clearly documented and correlated to a risk alert
system as a tool to better communicate to the public.
▪ Delaware did not define each metric/indicator as either leading (syndromic) or lagging (hospitalizations
and deaths).
▪ Delaware did not link decisions and actions (restrictions) to the data metrics/indicators/science-based
information.
▪ Delaware did not provide on their COVID-19 website a written report to present the data, insights and
trends to better assist the public’s understanding or other helpful resources like other states (i.e., data term
definition document, data transparency COVID-19 checklist, unified response scoreboard, etc.).
▪ Delaware did provide more guidance as the pandemic progressed, but there were opportunities to provide
information earlier in the pandemic, such as in July 2020.
Internal Controls
Delaware did not disclose information on its internal controls for COVID-19 data on its website. Internal control
standards for information and communication specify that government agencies should obtain and maintain
quality data from reliable sources and communicate quality information to external stakeholders, such as the
public. Delaware did not provide the needed transparency to meet these standards, as follows:19
▪ Delaware did not provide any information on what it was doing to support data governance and data
integrity for publicly reported data metrics, including internal control activities, monitoring, and
oversight efforts over the data lifecycle (i.e., collect/create, process, review, report, and
retention/retrieval).
▪ Delaware did not disclose evidence supporting its decisions or policies implemented to mitigate the
pandemic, such as its reasoning, rationale or methodology and authorized decision-makers.
17 “Minnesota Department of Health Weekly COVID-19 Report: updated 11/5/2020” (2020) Minnesota Department of Health.,
https://www.health.state.mn.us/diseases/coronavirus/stats/covidweekly45.pdf 18 “Summary of Alert Indicators” (2020) Ohio Department of Health., https://coronavirus.ohio.gov/static/OPHASM/Summary-Alert-
Indicators.pdf 19 “Standards for Internal Control in the Federal Government” (2014) U.S. Government Accountability Office.,
https://www.gao.gov/products/gao-14-704G

Page | 13
Dashboard Observations as of June 30, 2020
Indicator 1: New confirmed
and probable cases and per
capita rates by date with 7-day
moving average.
1. The dashboard did not contain per capita rates by date with a 7-day moving
average.
2. Delaware has not provided information to help the public understand what the
case data says about the pandemic, the virus progression, and response.
Indicator 2: Percent of new
cases epidemiologically linked
to at least one other case by
date stratified, with threshold.
Information was not provided in the dashboard for this indicator. A review of the
dashboard to date shows that the metric exists, but is not stratified, with threshold.
Indicator 3: New screening
and diagnostic testing per-
capita rates by date, with
threshold, and with 7-day
moving average.
1. The dashboard contained testing information; however, it did not contain new
screening and diagnostic testing per-capita rates by date, with threshold, and
with 7-day moving average.
2. To date, the dashboard has included testing results for positive and negative
cases but does not detail the test type administered. Further, it has not relayed
any information on test turnaround, isolation after testing, or cases interviewed
for contact elicitation.
Indicator 4: Percent of
screening and diagnostic tests
positive by date, with threshold,
and 7-day moving average.
The dashboard contained testing information but excluded the percent of screening
and diagnostic tests positive by date, with threshold, and 7-day moving average.
Indicator 6: COVID
hospitalization per-capita rates
by date, with 7-day moving
average.
1. The dashboard does not report on several of the other recommended
hospitalization-related metrics including 1) COVID-19 hospitalizations per-
capita rates by date and 7-day moving average; 2) percentage of licensed beds
occupied by suspected and confirmed COVID-19 patients by date and 3) new
infections among healthcare workers not confirmed to have been contracted
outside of the workplace by week.
2. The dashboard does not include a percentage of licensed beds occupied by
suspected and confirmed patients by date.
Indicator 7: Percentage of
licensed beds occupied by
suspected and confirmed
COVID-19 patients by date.
The dashboard reports ICU bed availability as “Stable,” “Occupied,” and “Critical”.
It does not contain the percentage of licensed beds occupied by suspected and
confirmed COVID-19 patients by date.
Indicator 8: List of long-term
care and other congregate
facility outbreaks with COVID-
19 cases and deaths in residents
and staff.
1. The dashboard quantifies the Total Number of Positive Cases in long-term care
facilities but does not break it out into patient and staff or stratify it.
2. The dashboard does not include a list of facilities with outbreaks along with the
number of deaths each facility has in total. Therefore, the public does not know
if cases were specific to a limited number of facilities; if staff cases or deaths
were from multiple disciplines; if there were any visitor cases or deaths; or what
those percentages are. The public also does not know if the deaths were of those
over 70 or 80 years old and if those with a case or death had underlying
conditions or co-morbidities and were transferred to a hospital for acute care.
3. A review of Delaware’s COVID-19 website shows that there is no specific
guidance for prisons on testing, reporting, data collection, handling positive
Page | 14
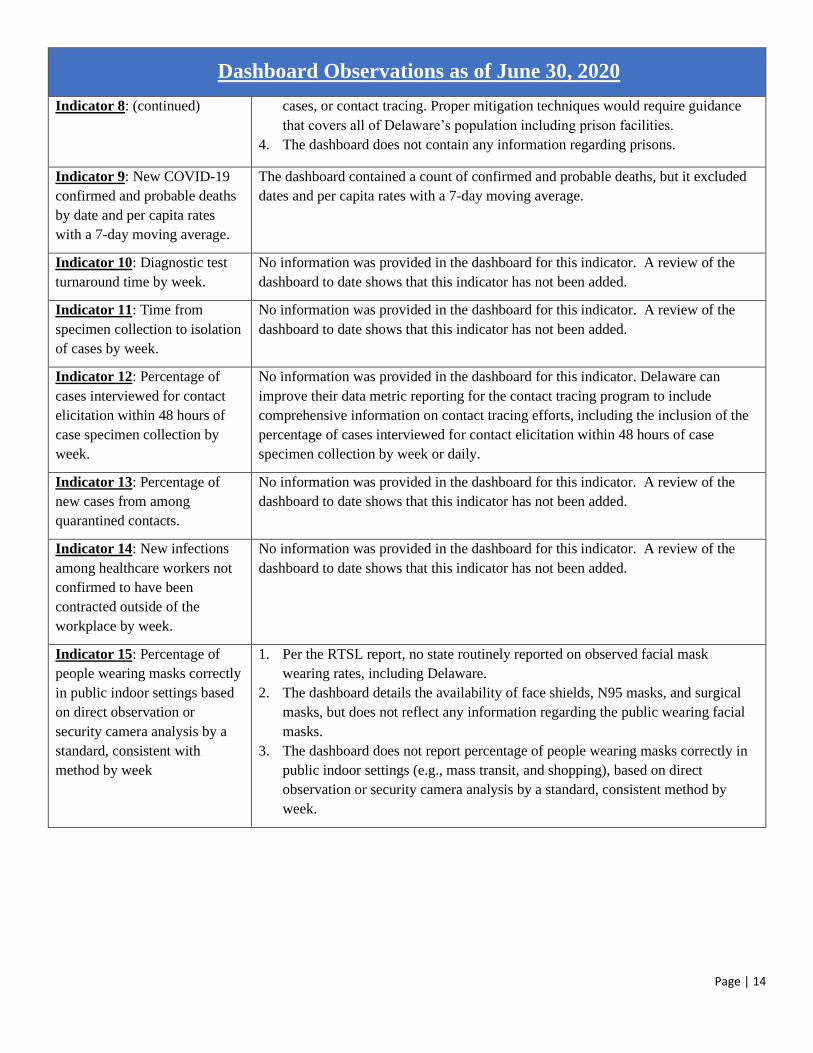
Dashboard Observations as of June 30, 2020
Indicator 8: (continued) cases, or contact tracing. Proper mitigation techniques would require guidance
that covers all of Delaware’s population including prison facilities.
4. The dashboard does not contain any information regarding prisons.
Indicator 9: New COVID-19
confirmed and probable deaths
by date and per capita rates
with a 7-day moving average.
The dashboard contained a count of confirmed and probable deaths, but it excluded
dates and per capita rates with a 7-day moving average.
Indicator 10: Diagnostic test
turnaround time by week.
No information was provided in the dashboard for this indicator. A review of the
dashboard to date shows that this indicator has not been added.
Indicator 11: Time from
specimen collection to isolation
of cases by week.
No information was provided in the dashboard for this indicator. A review of the
dashboard to date shows that this indicator has not been added.
Indicator 12: Percentage of
cases interviewed for contact
elicitation within 48 hours of
case specimen collection by
week.
No information was provided in the dashboard for this indicator. Delaware can
improve their data metric reporting for the contact tracing program to include
comprehensive information on contact tracing efforts, including the inclusion of the
percentage of cases interviewed for contact elicitation within 48 hours of case
specimen collection by week or daily.
Indicator 13: Percentage of
new cases from among
quarantined contacts.
No information was provided in the dashboard for this indicator. A review of the
dashboard to date shows that this indicator has not been added.
Indicator 14: New infections
among healthcare workers not
confirmed to have been
contracted outside of the
workplace by week.
No information was provided in the dashboard for this indicator. A review of the
dashboard to date shows that this indicator has not been added.
Indicator 15: Percentage of
people wearing masks correctly
in public indoor settings based
on direct observation or
security camera analysis by a
standard, consistent with
method by week
1. Per the RTSL report, no state routinely reported on observed facial mask
wearing rates, including Delaware.
2. The dashboard details the availability of face shields, N95 masks, and surgical
masks, but does not reflect any information regarding the public wearing facial
masks.
3. The dashboard does not report percentage of people wearing masks correctly in
public indoor settings (e.g., mass transit, and shopping), based on direct
observation or security camera analysis by a standard, consistent method by
week.

Page | 15
Chart 1: Delaware vs. Top 10 Indicator Reporting States as of June 202020
Chart 2: Delaware vs. Regional States as of June 202021
20 “Tracking COVID-19 in the United States.” Prevent Epidemics, preventepidemics.org/covid19/resources/indicators/. 21 “Tracking COVID-19 in the United States.” Prevent Epidemics, preventepidemics.org/covid19/resources/indicators/.
*Delaware was ranked 14th nationally among states for indicator reporting.

Page | 16
Data on COVID-19 testing is needed to assess and improve our response to the virus. According to the July 2020
“Tracking COVID-19 in the United States” report, the majority of data missing from state dashboards was related
to testing.
Since the start of the pandemic, testing has been criticized due to supply shortages, lab capacity and turnaround,
and for its reliability and accuracy. These issues interfered with states’ abilities to contain the disease.
Throughout this pandemic, the goal for Delaware like other states has been to increase the number of tests
conducted and the testing supply capacity. Delaware has continually updated its testing plan as the pandemic
progressed in line with this goal.
The OAOA reviewed the Delaware COVID-19 website and data dashboard to determine the extent of information
on the testing indicators including whether that information changed or evolved during the period from March
31, 2020 to June 30, 2020 to present. As of March 31, 2020, the state reported positive and negative testing results
but not what type of testing was administered. As of the June 30, 2020 dashboard, Delaware reported positive
and negative test results, total persons tested, testing by race, ethnicity and county, and rate of persons tested by
race, ethnicity, and county. As of October 15, 2020, Delaware reported positive and negative test results; total
persons tested; total tests administered; testing by race, ethnicity and county; and rate of persons tested by race,
ethnicity, and county. Delaware has not yet reported any information on test turnaround or isolation after testing.
Delaware’s DHSS22 coordinated with Delaware Healthcare Association, (DPH), and each of the healthcare
systems in the state to create a plan that streamlines the testing process and ensures the safety of patients and
22 “Governor Carney, DHSS Announce Statewide COVID-19 Testing Plan in Coordination with Delaware Health Care Systems.”
State of Delaware News, 20 Mar. 2020, news.delaware.gov/2020/03/20/governor-carney-dhss-announce-statewide-covid-19-testing-
plan-in-coordination-with-delaware-health-care-systems/.
Indicators 3, 4, 10, and 11 - Testing
Page | 17
facility workers. Through this plan, Delaware health systems operated seven standing health facility test sites
where healthcare staff tested individuals who had been evaluated by a medical provider and had symptoms
consistent with COVID-19. On April 22, 2020,23 Governor Carney announced an expansion of testing in Sussex
County to include a partnership with local employers to provide community testing sites. These sites offered free
rapid testing for workers and their families of the poultry industry. On May 5, 2020,24 DPH created a plan to test
Delaware’s most vulnerable population for COVID-19. Long-term care facilities were to be provided tests, testing
supplies, and training for the testing program. A significant expansion to the original plan was made on May 8,
202025 to increase the number of tests administered to 80,000 people per month. The state purchased 200,000
saliva-based tests from Curative, a Los Angeles-based testing company to increase testing capacity and provide
easy access to testing.
23 “Governor Carney Partners with Health Providers and Sussex Employers on Community Testing Sites, Outreach, Education.” State
of Delaware News, 22 Apr. 2020, news.delaware.gov/2020/04/22/governor-carney-partners-with-health-providers-and-sussex-
employers-on-community-testing-sites-outreach-education/. 24 “Governor Carney Announces Interim Steps Allowing Small Businesses; Universal Testing in Nursing Homes.” State of Delaware
News, 5 May 2020, news.delaware.gov/2020/05/05/governor-carney-announces-interim-steps-allowing-small-businesses-universal-
testing-in-nursing-homes/. 25 “Governor Carney Announces Significant Expansion of Statewide Testing Program for COVID-19.” State of Delaware News, 8
May 2020, news.delaware.gov/2020/05/08/governor-carney-announces-significant-expansion-of-statewide-testing-program-for-covid-
19/.

Page | 18
Case counts are the earliest indicator of virus progression. There are different types of cases in reported case
counts, including probable, not yet lab confirmed, confirmed, and recovered, as well as variations in how reported
cases are assigned a date (from date of specimen collection, which is preferred to date of illness onset, for the date
reported).
Delaware needs to provide information to help the public understand what the case data can and cannot tell them
about the pandemic and its progression and the mitigation efforts in Delaware.
Per the July 2020 “Tracking COVID-19 in the United States” report, case reporting was
inconsistent across state dashboards. The epidemic curve is considered the best graphic
illustration of disease progression per the report. Some states, required a user to download
a separate file to see information, while others showed only cumulative cases by date,
requiring users to calculate new cases themselves.26 The report indicated at a minimum that
a state should report new and confirmed cases and per-capita rates by date with a 7-day
moving average and include demographic stratification: age, sex, race, ethnicity, and zip
code as well as community outbreaks to understand how COVID-19 disease has spread so
that interventions can be adequately targeted.
Congregate facility-specific data is also important for understanding the community risk
and the congregate facilities risk. It is recommended that all
states report a list of long-term care and other congregate
facilities and essential workplaces cases. Other recommended
information was reporting of the percentage of new cases epidemiologically linked
to at least one other case, stratified by whether part of known outbreak or not, with
threshold. Further, the data should be reported weekly, not just cumulatively, so that
recent patterns can be identified. The report suggests a target of decreasing cases
over 14 days or at a low level and >80% for linked cases as good metric to use.
26 “Tracking COVID-19 in the United States.” Prevent Epidemics, preventepidemics.org/covid19/resources/indicators/.
Indicator 1 - Cases
Delaware needs to
provide information to
help the public
understand what the
case can and cannot tell
them about the
pandemic and its
progression and the
mitigation efforts in
Delaware.
The epidemic curve is
considered the best
graphic illustration of
disease progression per
the report.

Page | 19
In Delaware, positive cases peaked in May 2020 at 9,721. As of October 15, 2020, there were 22,738 positive
cases. However, the number of cases is only meaningful when reviewed and interpreted against how much testing
is occurring. We did not see any specific guidance on the Delaware website specific to the topic of cases.
Chart 3: Cumulative Number of Positive Cases27
As of March 31, 2020, Delaware reported case information was limited to announcements of positive and negative
test results in the Delaware.gov website newsroom section. The June 30, 2020 dashboard was expanded to include
new positive cases; cumulative number of positive cases; confirmed and probable cases; positive cases in
comparable locations (by county); and a demographic breakdown of cases. As of the October 15, 2020, Delaware
is now reporting significantly more case data on the data dashboard than it did in the early stages of the pandemic.
Delaware now includes the following on the data dashboard:
▪ Total positive cases,
▪ Cases per capita,
▪ Confirmed cases,
▪ Probable cases,
▪ Residents of long-term care facilities cases,
▪ Cases by county,
▪ Positive case trends,
▪ Cases by visited venues,
▪ Cases by population by age group,
▪ Rate of cases by age, and
▪ Rate of cases by age and county,
▪ Rate of cases by sex, rate of cases by sex and county,
▪ Rate of cases by race/ethnicity, and
▪ Rate of case by race/ethnicity and county.
27 “– My Healthy Community – State of Delaware.” Myhealthycommunity.Dhss.Delaware.Gov,
https://myhealthycommunity.dhss.delaware.gov/locations/state/days_to_show/236/primary_trend_type/bar#trends_dashboard

Page | 20
Incompleteness of Case Data
Accuracy of case data has also been an issue across the country. Many states are seeing
case data being temporarily inflated or understated due to technical issues. For example,
Florida recently dropped its partnership with Quest Diagnostics when the company
issued a backlog of approximately 75,000 tests.28 Backlogging can temporarily inflate
the amount of cases in a specific time period, thus rendering the reliability of the data
inaccurate for reopening decisions.
Technical glitches have also reached states on the West Coast. California saw
significant issues with their data collection systems that left approximately 250,000-300,000 test results
unprocessed.29 California Health and Human Services Secretary Dr. Mark Ghaly stated that the glitches could be
attributed to the high volume of COVID-19 case data exceeding the limits of the state’s data collection system.30
Because of this mishap, health officials say that their statistics, case rates and percent increase estimates have
been impacted negatively.
On September 6, 2020, the accuracy of Delaware’s case data was questioned in a September 6, 2020 Delaware
State News article:
“According to data from the Division of Public Health, there have been 18,043, an increase of 151 from
the day before. However, DPH cautioned those cases did not all originate this weekend. ‘The Division of
Public Health identified a technical issue that caused approximately 175-200 positive cases to be omitted
from the state’s cumulative positive case count,” the agency said. ‘All of these cases were processed
through the state’s contact tracing program; however, they were not captured in the state’s statistical
reporting here. The technical issue was resolved, and as DPH works to add these cases to the state’s
tallies, you may notice an increase in the cumulative number of positive cases displayed over the coming
days.”31
Delawareans rely on accurate case data to track the spread of COVID-19 and any future possible technical glitch
occurrences could affect pandemic planning and decision making. DHSS did confirm with OAOA that quality
control check verifications and other reviews are in place for all data elements to help prevent data errors or delays
in public reporting.
28 Freeman, Marc. “Florida Dumps Quest Lab for Huge Backlog of COVID-19 Test Results.” Sun-Sentinel.Com, 1 Sept. 2020,
www.sun-sentinel.com/coronavirus/fl-ne-florida-coronavirus-deaths-cases-tuesday-september-1-20200901-
kg6d66ixqfagvk2usmpadaloka-story.html. 29 Martichoux, Alix. “COVID Data Glitch Resulted in 300,000 Unprocessed Records, California Health Secretary Says.” ABC7 Los
Angeles, 7 Aug. 2020, abc7.com/california-coronavirus-cases-misreported-covid-19-numbers-central-valley-newsom-press-
conference-today-live/6360234/. 30 McGough, Michael, et al. “California Undercounting COVID-19 Cases Due to ‘Serious’ Technical Issue, Counties Say.” Sacbee,
The Sacramento Bee, 4 Aug. 2020, www.sacbee.com/news/coronavirus/article244717192.html. 31 “Increase in COVID Cases Attributed to Reporting Issue.” Delaware State News, 7 Sept. 2020,
delawarestatenews.net/coronavirus/increase-in-covid-cases-attributed-to-reporting-issue/.
Indicators 2, 12 and 13 - Contact Tracing
Many states are
seeing case data
being temporarily
inflated or
understated due to
technical issues.

Page | 21
When no effective medication or vaccine exists during a pandemic, the timely isolation of positive cases and
individuals in contact with those who test positive is imperative to the control of an outbreak. Data collected from
contact tracing programs illustrates the effectiveness of disease control efforts. The information from these
programs should be readily available to the public to hold government accountable for their effectiveness or lack
thereof.
Case investigation and contact tracing are public health tools/control measures
employed by health departments to combat infectious diseases and have been used
for decades. Case investigation is the identification and investigation of patients
with confirmed and probable diagnoses of COVID-19. Contact tracing is the
subsequent identification, monitoring, and support of patient contacts who have
been exposed to, and possibly infected with, the virus. Prompt identification,
voluntary quarantine, and monitoring of these COVID-19 contacts can effectively
break the chain of disease transmission and prevent further spread of the virus in the
community (decrease transmission). Case investigation and contact tracing are most
effective when part of a multifaceted response to an outbreak per the CDC.32
Tracing the origin of exposure is important to both the public and the government
because infections from unknown sources demonstrate previously undetected
transmission within a community. This signals a higher risk to the community than if
the source is known. Contact tracing therefore relies upon accurate, reliable, and
quick identification of individuals with the disease, followed by accurate, reliable, and quick sharing of that
information with the caseworkers, who will conduct contact tracing. The CDC provides guidance on Case
Investigation and Contact Tracing.33 The CDC recommends prioritization be based on vulnerability, congregate
settings/workplaces, and healthcare facilities, including long-term care facilities, and confined spaces (e.g.,
prisons). Further, the CDC indicates that broad community engagement is needed to foster an understanding of
local case investigations and contact tracing efforts within the community.
According to the July 2020 “Tracking COVID-19 in the United States” report, only eight states reported data on
the source of exposure for positive cases. Delaware was not one of them. Further, no state gives data on the
percentage of cases arising from individuals quarantined. This information is critical in assessing the effectiveness
of a state’s response.
OAOA reviewed the state’s COVID-19 website and data dashboard to determine if essential indicators for contact
tracing were included and if and how the state modified its contact tracing apparatus to address the challenges
posed by the pandemic during the period from March 31, 2020 to June 30, 2020 to present. Our review included
searching for guidance provided by DPH in this area. We found Delaware did not initially have a specific area
for contract tracing; did not include source of exposure for positive cases; or information related to quarantined
Delawareans. We noted that DPH did implement formal contract tracing control measures on May 12, 2020.34
Governor John Carney announced on May 12, 2020 that Delaware and NORC (National Opinion Research
Center) at the University of Chicago would work together to build Delaware’s statewide contact tracing program,
32 CDC. “Coronavirus Disease 2019 (COVID-19).” Centers for Disease Control and Prevention, 11 Feb. 2020,
www.cdc.gov/coronavirus/2019-ncov/php/principles-contact-tracing.html. 33 Ibid 34 “Governor Carney Announces Statewide Contact Tracing Plan for COVID-19.” State of Delaware News, 12 May 2020,
news.delaware.gov/2020/05/12/governor-carney-announces-statewide-contact-tracing-plan-for-covid-19/.
When no effective
medication or vaccine
exists during a
pandemic, the timely
isolation of positive
cases and those in
contact with those
who test positive is
imperative to the
control of an
outbreak.

Page | 22
adding as many as 200 contact tracers. In the interim, members of the Delaware National Guard were trained and
used to supplement the work being done by DPH. We understand that DPH used both telephone and field
contact tracers and that DPH employees started going out into the community in June 2020 for those without
a phone number.
We observed that as of August 11, 2020, the data dashboard included a contact tracing area. However, as of the
date of this report, the state was not including the weekly percentage of cases interviewed for contact elicitation
within 48 hours of case specimen collection. Delaware should take steps to provide comprehensive contact tracing
data to the public. When many cases are originating from unknown sources, the risk in the community is much
higher than when known outbreaks are the primary source of new cases.

Page | 23
On September 15, 2020, Delaware launched “COVID Alert DE,” a mobile app that helps track COVID-19 spread
in Delaware. Created in partnership with software developer NearForm, COVID Alert DE allows “for
interoperability and exposure notifications across state lines in states that also have exposure notification apps
and use the same Bluetooth technology developed by Apple and Google.”35 Once the app has been downloaded
it uses Bluetooth to recognize other users that have the app. It then sends the end-user exposure notifications if
they are in proximity of another user that is COVID positive. Users who are positive or come into proximity of a
positive user may receive outreach from the DPH’s contact tracing team.
There have been numerous
articles and discussions on
congregate facilities and the
impact the pandemic has had on
them. For example, it was
reported by news station
WDAM7 36 on September 24,
2020 that one Louisiana nursing
home experienced the loss of
nearly the same number of
residents to COVID-19 as it has
beds. Additionally, the CMS
reported more than five times as
many COVID-19 deaths as the
state has in one Indiana nursing
home. Delaware has also had
several outbreaks in congregate
facilities, including long-term
care facilities (e.g., nursing
homes and assisted living facilities, etc.), poultry and other manufacturing businesses, and the state’s corrections
system. Delaware has unfortunately had some spikes of deaths in some facilities, which is why comprehensive,
complete, accurate, and transparent data and guidance is crucial during this pandemic.
Long-term Care Facility Guidelines (Guidance)
Infections among residents of the congregate facilities, especially long-term care facilities, have always been a
serious concern. The population served by these facilities is older and more likely to have a preexisting condition
35 “State of Delaware Launches COVID Alert DE Mobile App” State of Delaware News, 15 Sept 2020,
https://news.delaware.gov/2020/09/15/state-of-delaware-launches-covid-alert-de-mobile-
app/#:~:text=WILMINGTON%2C%20Del.,community%20spread%20of%20COVID%2D19. 36 Zurik, Jill Riepenhoff, Lee. “Misreported Deaths: Government Count of Nursing Home COVID-19 Cases Still Inaccurate despite
Criticism.” Https://Www.Wdam.Com, 24 Sept. 2020, www.wdam.com/2020/09/24/misreported-deaths-government-count-nursing-
home-covid-cases-still-inaccurate-despite-criticism/.
Indicator 8 - Congregate Facilities

Page | 24
making them highly susceptible to COVID-19 outbreaks. Due to the population’s vulnerability, it is critical that
proper guidance for these facilities exists, be widely communicated, and be put into place to reduce the spread of
COVID-19 to residents and staff.
The OAOA reviewed the COVID-19 website for specific guidance to these facilities on testing of COVID-19,
monitoring of data, and the management of COVID-19 positive residents and staff. DPH did communicate
guidelines and/or guidance to long-term care facilities during the pandemic, including updates as the experts
learned more about this disease and as other conditions were changing (e.g., hotspots and death spikes). As the
pandemic progressed, DPH continued to add additional guidance to their COVID-19 website, as a resource for
the long-term care facilities. Per a discussion with DHSS, they have not removed any of the guidance they have
provided, since the start of the pandemic to ensure the greatest level of transparency.
On April 15, 2020, Governor Carney issued an 11th amendment to his State of Emergency requiring stricter
guidelines to prevent COVID-19 infections in long-term care facilities. This amendment required that DPH
evaluate guidance daily to ensure compliance with current guidance and updates to policies, procedures, and
protocols as appropriate.
On May 5, 2020 Governor Carney and DPH announced a plan to test all residents and staff of Delaware long-
term care facilities. Long-term care facilities were offered nasopharyngeal, oropharyngeal, anterior nares test
kits, and specimen processing at DPH’s laboratory, for their residents. To use these resources, facilities had to
develop a monthly testing plan, abide by that schedule, and fulfill specimen delivery. On July 8, 2020, DPH
provided guidance to long-term care facilities through its website on monthly on-site testing of residents within
these facilities.37 DPH also required weekly mandatory testing for all employees, contactors, and volunteers. Any
staff that tested positive would be exempt from work and proper exposure protocols would be implemented.
Through this plan, DPH has provided facilities with tests, testing supplies, staff training, and support for the
universal testing program. This plan also established recommendations to protect residents and staff based on
results, including transmission-based precautions, isolation, and patient and staff management strategies. DPH
has taken vital steps in protecting residents of long-term care and certain other congregate facilities. Through
testing of residents and staff, daily monitoring of COVID-19 data, and adherence to state and federal guidance,
long-term care facilities have been working to slow the spread of COVID-19 in the community settings.
37 Note: Guidance included measures to ensure early recognition of infections; mandatory testing of staff to identify and exclude
symptomatic staff members; management of staff and residents with suspected COVID-19 exposure, as well as guidance on which
tests should be administered and how to track test results.

Page | 25
Long-term Care Facility Data
The OAOA reviewed the Delaware COVID-19 website and data dashboard to determine the extent of information
on congregate facility indicators (e.g., long-term care facilities), including whether that information changed or
evolved during the period from March 31, 2020 to June 30, 2020 to present.
As of March 31, 2020, the state did not report any long-term care facility data on its dashboard. As of the June
30, 2020 dashboard, Delaware’s dashboard quantifies the Total Number of Positive Cases in long-term care
facilities. As of October 15, 2020, Delaware reported positive cases in long-term care facilities, deaths in long-
term care facilities; however, that information is not broken out into patient and staff, nor is it stratified. Also, the
dashboard has not included a list of facilities with outbreaks along with the number of deaths each facility has in
total.
Therefore, the public does not know if cases were specific to a limited number of facilities, if staff cases or deaths
were from multiple disciplines, if there were any visitor cases or deaths, or what those percentages are. The public
also does not know if the deaths were of those over 70 or 80 years old and if those with a case or death had
underlying conditions or comorbidities such as hypertension, cardiac disease, renal disease, diabetes, or a
pulmonary disease and were transferred to a hospital for acute care.
The OAOA sent a survey in September 2020 to Delaware long-term care facilities. The survey found that most
facility representatives were satisfied with COVID-19 testing and data reporting guidance and processes provided
by the state. However, differences in responses were noted on testing information guidance that the state requested
facilities to include when collecting and reporting test results. For example, while some facilities reported that
they were instructed to include only the patient’s symptoms, others stated they were told to include age and sex
of the individual tested, and still others stated they were asked to include race and ethnicity in their reported data
collection. This inconsistency makes it difficult to accurately and adequately report the progress of COVID-19 in
these facilities. Without the necessary information to study the progress of the disease, it is difficult to identify
trends in its progress and develop strategies to combat virus spread.
Other Congregation Facilities Public Data Reporting
The OAOA reviewed the Delaware COVID-19 website and data dashboard to determine the extent of information
on congregate facility indicators (correctional facilities), including whether that information changed or evolved
during the period from March 31 to June 30 to present. As of March 31, 2020, June 30, 2020, and October 15,
2020 the Delaware dashboard and website showed a lack of data on correctional facilities as well as other
congregate facilities (such as the manufacturing facilities), which have had spikes in cases in Sussex County,
Delaware. This calls into question whether the number of positive cases has been understated or if the public
information is as transparent as it could be. If prison data was included in the dashboard, it should be separate and
stratified for tracing purposes.
This included whether the numbers were preliminary or final, what data validation occurs to prevent over or
undercounting, and any audits performed by DHSS/DPH.
Indicators 6 and 7 - Hospitalizations

Page | 26
The number of individuals admitted to Delaware hospitals with COVID-19 is an indicator of the burden of illness
in the community. Overall, Intensive Care Unit (ICU) occupancy shows how much ICU space is available for
new COVID-19 patients as well as others needing care (e.g., heart attacks, car accidents, etc.).
The July 2020 “Tracking COVID-19 in the United States” report indicated over 80% of the state’s report on
COVID-19 specific hospitalizations (e.g., some reporting cumulative data, some daily new hospitalizations and
others reporting both). The report found less than half of the states reported data on the ICU bed admissions with
the data varying in frequency and presentation (e.g. some reporting it weekly, some reporting cumulative data,
and others reporting from a subset of counties within their state). For example, Florida had detailed COVID-19
hospitalization data available on another state agency website, but not on or linked to their COVID-19 data
dashboard. However, the report notes that there is no one indicator that fully captures the impact on hospitals
from this disease.
The OAOA reviewed the
Delaware COVID-19
website and data
dashboard to determine
the extent of information
on the hospitalization
indicators including
whether that information
changed or evolved
during the period from
March 31, 2020 to June
30 to present. As of March 31, 2020, the state reported current hospitalizations and suspected and confirmed new
hospital admissions. We found the state does not report on several of the other recommended hospitalization-
related metrics, including
1) COVID-19 hospitalizations per-capita rates by date and 7-day moving average;
2) Percentage of licensed beds occupied by suspected and confirmed COVID-19 patients by date; and
3) New infections among healthcare workers not confirmed to have been contracted outside of the workplace
by week.
As of the June 30, 2020 dashboard, Delaware reported ICU Bed Availability as “Stable” (75% or less occupied).
While this piece of data is important, the dashboard should also include a percentage of licensed beds occupied
by suspected and confirmed patients by date.
As of October 15, 2020, the state reported, current hospitalizations, current critical hospitalizations, suspected
and confirmed new hospital admissions, and average daily hospitalizations. We also observed that the CDC
currently reports estimated hospital utilization data for states and territories, and state representative estimates for
hospital bed occupancy that are reported. DHSS did communicate to OAOA that they referred to CDC guidance
and information during this pandemic for all aspects of this disease.
DHSS did communicate that hospital ventilators and PPE equipment availability were not reported on the state
data dashboard, because they were deemed a security threat by DEMA.

Page | 27
Many public health and infectious disease experts have speculated that death tallies are underestimated, while
others have suggested death tallies are being deliberately inflated (i.e., including by counting those with gun shots
or alcohol poisoning). Further, there are also deaths indirectly related to COVID-19 and the extent of their
reporting is unclear.
States handle the reporting of deaths differently due to lack of clear, consistently used definitions. DHSS/DPH
communicated that they use the CDC definition for deaths, as also referenced on their dashboard. We found the
CDC calculates deaths assigned to a specific cause through the Death-to-case ratio,38 which can be defined as the
number of deaths attributed to a particular disease during a specified time period divided by the number of new
cases of that disease identified during the same time period.39 Applying this formula to Delaware’s reported cases,
as of October 15, 2020 Delaware had 590 confirmed (90 probable) deaths and 21,697 confirmed positive cases40
resulting in a case fatality rate of 2.72%. In other words, in Delaware, COVID-19 kills approximately 1 in every
37 confirmed cases.
Per the July 2020 “Tracking COVID-19 in the United States” report, daily deaths (i.e., new or running total) in
confirmed cases was the only indicator reported by every state, with some states reporting additional information
on their probable deaths. The report recommended reporting of the new confirmed and probable deaths by date
and per-capita rates with a 7-day moving average. The report also indicates that state data on excess deaths (i.e.,
deaths in excess of historical averages in the same period) may give a complete picture of the overall impact of
the pandemic but was not reported on state COVID-19 dashboards. Georgia was the only state that had all
essential information regarding deaths. Other states, including Delaware had only partial information on deaths.
The OAOA reviewed how this information changed or evolved during the period from March 31, 2020 to June
30, 2020 to present, including during the period that deaths spiked in April 2020. As of March 31, 2020, Delaware
reported no death information. As of June 30, 2020, Delaware was reporting total, confirmed, and probable deaths;
and a breakdown of deaths by age, county, sex, race, and ethnicity. As of the October 15, 2020, Delaware is
reporting significantly more death information daily and in graphical form. This includes total deaths, per capita
deaths, confirmed deaths, probable deaths, and deaths of residents in long-term care facilities, and deaths by
county.
38 CDC. “Principles of Epidemiology in Public Health Practice – Lesson 3” Centers for Disease Control and Prevention, (2020),
https://www.cdc.gov/csels/dsepd/ss1978/lesson3/section3.html Note: The crude mortality ratio is the number of reported deaths divided by the reported cases. 39 WHO. “Estimating mortality from COVID-19”. (2020). World Health Organization. https://www.who.int/news-room/commentaries/detail/estimating-mortality-from-covid-19 40 State of Delaware. “Coronavirus (COVID-19) Data Dashboard.” (2020). Delaware Environmental Public Health Tracking Network. https://myhealthycommunity.dhss.delaware.gov/locations/state#outcomes
Indicator 9 - Outcome Deaths

Page | 28
Delaware is also reporting:
▪ Most recent deaths
▪ Age range
▪ Individuals having underlying health conditions
▪ Residents of long-term care facilities
▪ Deaths by age and county
▪ Total deaths by sex
▪ Total deaths by sex and county
▪ Total deaths by race/ethnicity
▪ Total deaths by race/ethnicity and county
▪ Trends on recoveries and deaths.
By including this information in the dashboard, all pertinent information is now reflected for this indicator.
Chart 4: Cumulative Delaware COVID-19 Deaths (including probable) as of October 13, 202041
41 “My Healthy Community, State of Delaware.” Myhealthycommunity.Dhss.Delaware.Gov,
myhealthycommunity.dhss.delaware.gov/locations/state.

Page | 29
Hospitalization metrics are useful to informing response. Currently, per the July 2020 “Tracking Covid-19 in the
United States” report, there are many states, including Delaware, that do not report on new infections among
healthcare workers not confirmed to have been contacted outside of the workplace by week. Further, data in this
area is very limited. This is best practice information that should be reported and further stratified by age, sex,
race, and ethnicity.
The current data and science indicate that person-to-person transmission most often occurs during close contact
with an individual infected with the virus. Healthcare workers are not only at higher risk of the infection but can
also amplify outbreaks within healthcare facilities if they become ill. Identifying and managing healthcare
workers who have been exposed to a patient with COVID-19 is of great importance in preventing healthcare
transmission and protecting staff and vulnerable patients in healthcare settings.
According to a research study by The Lancelot Public Health42, from March 24, 2020 (UK) and March 29, 2020
(USA) to April 23,2020, front-line healthcare workers were more than three times as likely to report a positive
COVID-19 test during the first weeks of the pandemic. According to the study, front-line healthcare workers who
reported having inadequate personal protective equipment (PPE) were 1.3 times more likely to have COVID-19
than those with adequate PPE.43 Healthcare workers who reused PPE were almost 1.5 times more likely to have
COVID-19, and healthcare workers caring for patients with COVID-19 without adequate PPE were almost six
times more likely to test positive, the researchers said.44 After accounting for pre-existing medical conditions,
healthcare workers from Black, Asian, and minority ethnic backgrounds were almost five times more likely to
report a positive COVID-19 result than somebody from the public, the researchers said.45
The July 2020 “Tracking COVID-19 in the Unites States” report indicates other metrics are useful to inform the
response to COVID-19. Per the report, there are many states, including Delaware, that do not report on new
infections among healthcare workers not confirmed to have been contacted outside of the workplace by week.
Further, the report indicates data in this area is very limited.
42 Nguyen, Long, et al. Articles Risk of COVID-19 among Front-Line Health-Care Workers and the General Community: A
Prospective Cohort Study. 2020. 43 Ibid. 44 Ibid. 45 Ibid.
Indicator 14 - Healthcare Workers

Page | 30
Our review determined the extent of information on healthcare worker infections, including whether information
changed or evolved during the period from March 31, 2020 to June 30, 2020 to present. Delaware was not
providing public reporting of data in this area as of June 30, 2020 and October 15, 2020. This is best practice
information that should be reported and further stratified by age, sex, race, and ethnicity.
We did find the state provided guidance on their COVID-19 website for “… for Management of Persons with
Suspected COVID-19 Exposure, Discontinuation of Home Isolation and Return to Work,” which details isolating
and monitoring practices and return to work procedures as of July 27, 2020. We also found the CDC website,
which we understand that DPH used as a reference during the pandemic, provides healthcare worker guidance.

Page | 31
Adherence to public health and social measures, including wearing facial mask coverings is another essential
indicator. The CDC updated their recommendations on facial masks, recommending the public start wearing cloth
face coverings in public settings on April 24, 2020. The CDC stated that the public should not wear surgical
masks or respirators (N95 masks) as they are in short supply and should be reserved for healthcare workers. Cloth
masks “help prevent respiratory droplets from traveling into the air and onto other people when the person
wearing the mask coughs, sneezes, talks, or raises their voice.46” Surgical masks, on the other hand, only filter
out large particles, while N95 masks releases unfiltered air when the wearer exhales. Because of this, they are
deemed ineffective in the prevention of spreading the virus.47 The CDC currently continues to recommend a
mandatory mask intervention for the general public. As of this report, medical experts recommend avoiding
crowed indoor spaces and wearing masks are some of the most effective preventative actions individuals can take.
Delaware and other states followed the CDC guidance and mandated the use of facial mask coverings in specific
settings, with Governor Carney implementing a mandatory face mask covering on April 25, 2020. The July 2020
“Tracking COVID-19 in the Unites States” report indicates that wearing facial masks is a useful intervention and
has been shown to be associated with a lower COVID-19 transmission. The report found that no states are
routinely reporting on observed facial mask wearing rates.
The OAOA reviewed the extent of information Delaware provided on facial mask covering and whether that
information changed or evolved during the period from March 31, 2020 to June 30, 2020 to present. Delaware
does not have any reporting on the number of facial masks. We did find that the dashboard details the availability
of face shields, N95 masks, and surgical masks as of June 30, 2020, but does not reflect any information regarding
the public wearing facial masks. We observed that DHSS did provide guidance for the use of facial mask
coverings including requirements, considerations, and mask maintenance on their website.
46 CDC. “Coronavirus Disease 2019 (COVID-19).” Centers for Disease Control and Prevention, 7 Aug. 2020,
www.cdc.gov/coronavirus/2019-ncov/prevent-getting-sick/cloth-face-cover-guidance.html. 47 Mayo Clinic Staff. “Can Face Masks Protect against the Coronavirus?” Mayo Clinic, 20 Aug. 2020, www.mayoclinic.org/diseases-
conditions/coronavirus/in-depth/coronavirus-mask/art-20485449.
Indicator 15 - Facial Masks

Page | 32
Delaware should consider reporting data on the percentage of people wearing masks correctly in public indoor
settings (e.g., mass transit, shopping), based on direct observation or security camera analysis, by a standard,
consistent method, by week. There have been many news articles that indicate that many people with the COVID-
19 infection are asymptomatic or pre-symptomatic. We understand that these people may be highly contagious
and account for a percentage of all transmissions. Universal masking helps to prevent such people from spreading
virus-laden secretions, whether they recognize that they are infected or not per infectious diseases specialists.

Page | 33
Our recommendations acknowledge the unprecedented nature of this pandemic. In a pandemic, appropriate data
and information is critical for decision-makers, health professionals, and the public to understand the disease’s
progression, and if Delaware is controlling the virus’ spread. Transparency of state government’s rationale for
decisions and methodology should be shared. We believe Delaware is a work in progress and that opportunities
exist to provide more comprehensive data dashboard reporting to better communicate how information leads to
decisions and actions, and to provide educational and preparedness information for the public.
1. Expand Data Dashboard: The state paid for the development of a customized COVID-19 dashboard that
would accumulate, track, visualize, and report on a variety of health and other pandemic related data. We
recommend DHSS/DPH expand the publicly reported COVID-19 data and continue to build a more
comprehensive data dashboard for reporting to the public. This project would require expansion of the
current COVID-19 data to include all current best practices metrics, indictors, goals, demographic,
geographic, and other data information (e.g., workplace etc.). Stratification of data highlighted in this
special report should be included as well, along with indicators/metrics that continue to evolve as more is
learned about this disease or that help monitor the impact of mitigation measures. For example,
DHHS/DPH could address some of the following metrics:
▪ Trigger for activation and deactivation of pandemic emergency response;
▪ Indicator(s) on cross-state communications, information exchange, and coordination;
▪ Indicator(s) for reviews (e.g., number of in action reviews of indicators) to support a systematic
approach to lessons learned;
▪ Indicator for respiratory protection equipment consumption;
▪ Indictor(s) for vaccine monitoring (e.g., deployment of the vaccine) including coverage, safety,
effectiveness, and acceptance;
▪ Indicator on number of quarantined individuals arriving from other high-risk countries;
▪ Indicator on interventions related to teleworking to reduce the level of contact in the workplace;
▪ Indicator on Delaware’s mobile app that supports contract tracing coverage; and
▪ Indicator on the number of visits to primary care doctors.
2. Expand and Improve Communications on Website: We recommend DHSS/DPH improve pandemic
communications by addressing the following areas to improve public understanding:
▪ Summary of Data Indicators and Alert Levels: DHSS/DPH should consider developing a one
to two-page summary of data indicators and alert levels. This document would list each indicator
and explain what it is and what it tells us. The document would also provide alert levels for the
state or level of the public emergency and would be correlated/linked to what indicators are met
or not met. This should be available on the public website as a .PDF document download.
RECOMMENDATIONS

Page | 34
▪ Weekly COVID-19 Report: DHSS/DPH should consider developing a weekly COVID-19
Report. This report would present data in an easy to interpret way and enhance the information on
the data dashboard by providing trends over time, and any situational or other insights that would
assist the public. This report would include an overview and summary of each dashboard indicator
and its trends and insights.
▪ Link and Document Data Reporting To Decisions and Actions on Website: The decisions and
actions (e.g. school planning, events, and business restrictions) taken by DHSS, DPH, and the
Governor during this pandemic should be clearly linked to the COVID-19 data reported to the
public, added to the website, and made available as a downloadable PDF.
▪ Document Pandemic Decisions and Rationale/Methodology on Website: The rationale and
methodology for all decisions and actions should be documented and added to the website. This
would include how DHSS/DPH determined what data to provide publicly (i.e., excluded protected
health information etc.), in what format (i.e., number, percentage, different methods of calculations
of data etc.), and when (i.e., timing) to report and what was the basis for those decisions (i.e.,
scientific evidence, knowledge gained, change in transmission risk etc.).
▪ Document Information on Data Governance and Data Integrity on Website: DHSS/DPH
should provide information on data governance and data integrity. This would include how they
maintained data quality, privacy, and security over the COVID-19 data reported, including
information on internal controls, monitoring, and auditing activities in place and their frequency
(e.g., quality control checks etc.). This would also include steps they took to address data errors
(e.g., duplicate data), technical glitches, security breaches, and any other problems that occurred.
In addition, DHSS/DPH should provide additional clarity to the public on when the data is
provisional and when the data is expected to be reported as final.
▪ Expand Pandemic Education and Public Outreach Materials on Website: DHSS/DPH should
provide additional education and outreach information on the website. This would include
pandemic education and preparedness, which the state did not have enough emphasis on prior to
the pandemic. Additionally, COVID-19 educational information for community outreach should
be included, especially for more vulnerable Delawareans. For example, DHSS/DPH should
consider developing and adding the following information:
o A mechanism to capture supply chain information: How has Delaware addressed the
supply chain issues that existed during the pandemic?;
o A mechanism to capture, assess, and report on public perceptions and concerns as well as
information on misinformation, disinformation, and rumors to help raise awareness and
cooperation with mitigation strategies; and
o A mechanism to add targeted messaging and information for high risk/targeted specific
populations ,such as the various sectors of the Hispanic community members (i.e., Haiti,
etc.), variety of manufacturing industry environments (i.e., smaller manufacturers may
need more help), tourists, elderly, and workers in settings with elevated risk of exposure,
etc.

Page | 35
▪ Link to Current/Available Testing Sites on Dashboard: DHSS/DPH should provide a list of
testing sites on the website. The facilities on this list should be grouped by county and include
facility contact information as well as operation hours.
3. Website Usability: DHSS/DPH should improve the usability of the data dashboard and website to make
it easier for the public to maneuver and locate information. As members of the public, we sometimes
struggled with locating information and maneuvering through the website.
▪ Website “Chat” Functionality: DHSS/DPH should improve public engagement by adding an
online chat function to the website,

Page | 36
To respond effectively to the pandemic, federal, and state governments must provide transparent, accurate,
and timely COVID-19 data to the public. In the context of the current COVID-19 health crisis, knowledge,
and data sharing are crucial to understand and help to mitigate the pandemic. We found Delaware’s data
dashboard to be useful if the end-user understands the caveats. In our reviews of the public data featured on
the dashboard, we found that although the data dashboard continued to evolve and improve over the course
of this pandemic, the data reported was sometimes inconsistent and incomplete. Further, we observed a lack
of alignment among state dashboards on what is being measured and compared that we believe is also
contributing to public uncertainty and inconsistency amid this pandemic and compounding mistrust and fear.
Those who are using data to understand situations and make informed decisions should understand that not
all data is created equal.48 Inaccurate data is everywhere.
As the July 2020 “Tracking COVID-19 in the United States” report stated,
“Particularly in the absence of a clear national vision, strategy, leadership, or organization, it is
crucial to establish standardized, timely, accurate, interlinked, comparable, and informative
dashboards for every state and county in the U.S. This is required to improving our control of the
virus and maximizing our chance to get our children to school in the fall, ourselves back to work, our
economy restarted, and to prevent tens of thousands of deaths .”49
48 Bleed, Evelyn. “Align Business and IT Drivers through Data Quality Best Practices.” Search Data Management, 4 Oct. 2019,
searchdatamanagement.techtarget.com/feature/Align-business-and-IT-drivers-through-data-quality-best-practices. 49 “Tracking COVID-19 in the United States.” Prevent Epidemics, preventepidemics.org/covid19/resources/indicators/.
CONCLUSION

Page | 37
15 Best Practice Dashboard Indicators50
50 “Tracking COVID-19 in the United States.” Prevent Epidemics, preventepidemics.org/covid19/resources/indicators/.
Appendix 1
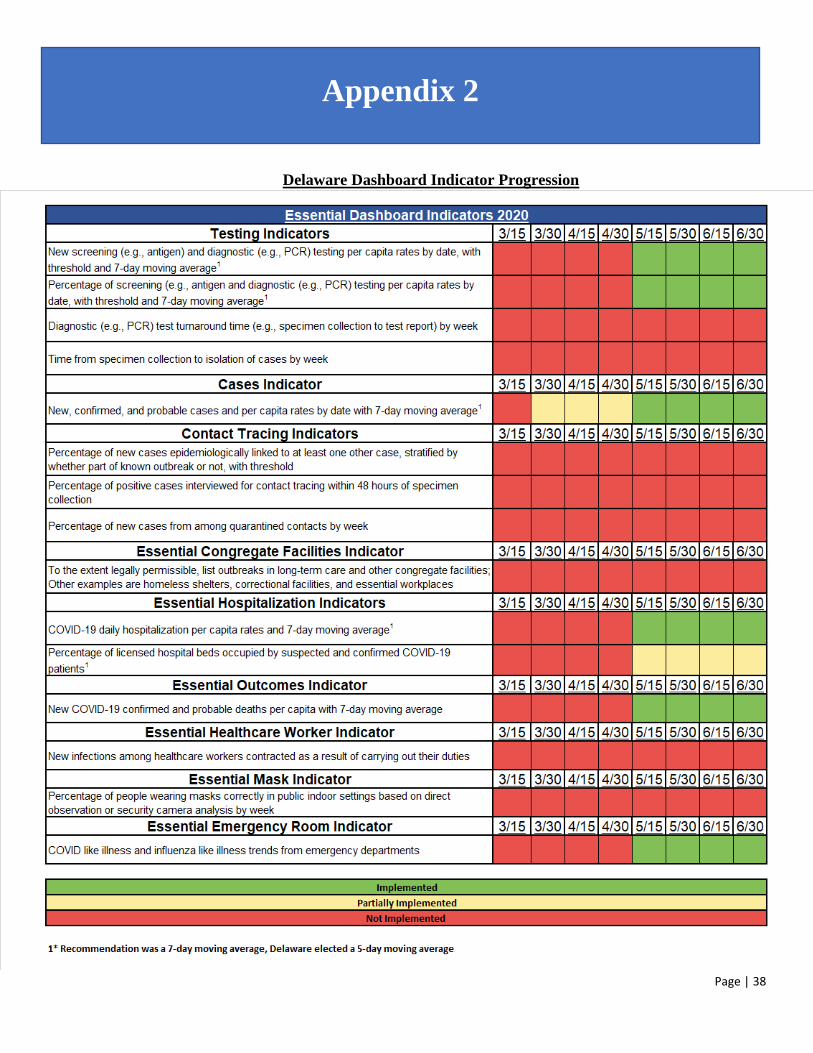
Page | 38
Delaware Dashboard Indicator Progression
Appendix 2

Page | 39
For Appendix 3 see:
https://web.archive.org/web/20201031190342/https://myhealthycommunity.dhss.delaware.gov/locations/st
ate
For Appendix 4 see:
https://web.archive.org/web/20201031190342/https://myhealthycommunity.dhss.delaware.gov/locations/st
ate
Appendices 3 and 4