Allentown, PA – Clinton, NJ – Greensboro, GA – Knoxville, TN – Farmington Hills, MI – San Diego, CA Cortland, NY – St. Charles, IL – Sarasota, FL – Houston, TX – Windsor, CT – Waltham, MA
200 Day Hill Road Suite 200
Windsor, CT 06095 (860) 298-0541
(860) 298-0561 FAX
February 10, 2010 Mr. Joseph F. LeMay Remedial Project Manager US EPA – New England 5 Post Office Square, Suite 100 Mail Code: OSSR07-4 Boston, MA 02109- 3912 Subject: Industri-plex Operable Unit 2 Superfund Site Woburn, Massachusetts Baseflow Surface Water Monitoring Report Dear Mr. LeMay: Pursuant to Paragraph 34 of the Consent Decree (CD)(Civil Action No.1:08-cv-10325) and Section V.A.5 of the Remedial Design / Remedial Action (RD/RA) Statement of Work (SOW) for the above referenced site, enclosed please find the Baseflow Surface Water Monitoring Report No. 10. This report covers the period from January 1 - 31, 2010, and is submitted on behalf of the Settling Defendants. Please contact me if you have any questions. Sincerely,
Bruce Thompson Project Coordinator Enclosure cc: Jen McWeeney - MassDEP Settling Defendants Larry McTiernan – Roux Associates
de maximis, inc.

DRAFT
Baseflow Surface Water Monitoring Monthly Report No. 10
(January 2010)
Industri-plex Superfund Site Operable Unit 2
Woburn, Massachusetts
ROUX ASSOCIATES, INC. IPS1194.0001M007.157/RCv

DRAFT
Disclaimer – This document is a DRAFT document prepared by the Settling Defendants
under a government Consent Decree. This document has not undergone formal review by
the U.S. Environmental Protection Agency (EPA) and the Massachusetts Department of
Environmental Protection (MassDEP). The opinions, findings, and conclusions expressed
are those of the author and not those of the EPA or the MassDEP.
ROUX ASSOCIATES, INC. -1- H:\Projects\Industri-Plex\119401M07\157\1194.0001M007.157.R.doc

DRAFT In accordance with the Surface Water Monitoring Plan (SWMP), this monthly Baseflow
Surface Water Monitoring Report has been prepared to summarize the surface water
monitoring and maintenance activities performed and the data developed for baseflow
conditions during the reporting period (January 1 through January 31, 2010) and to provide a
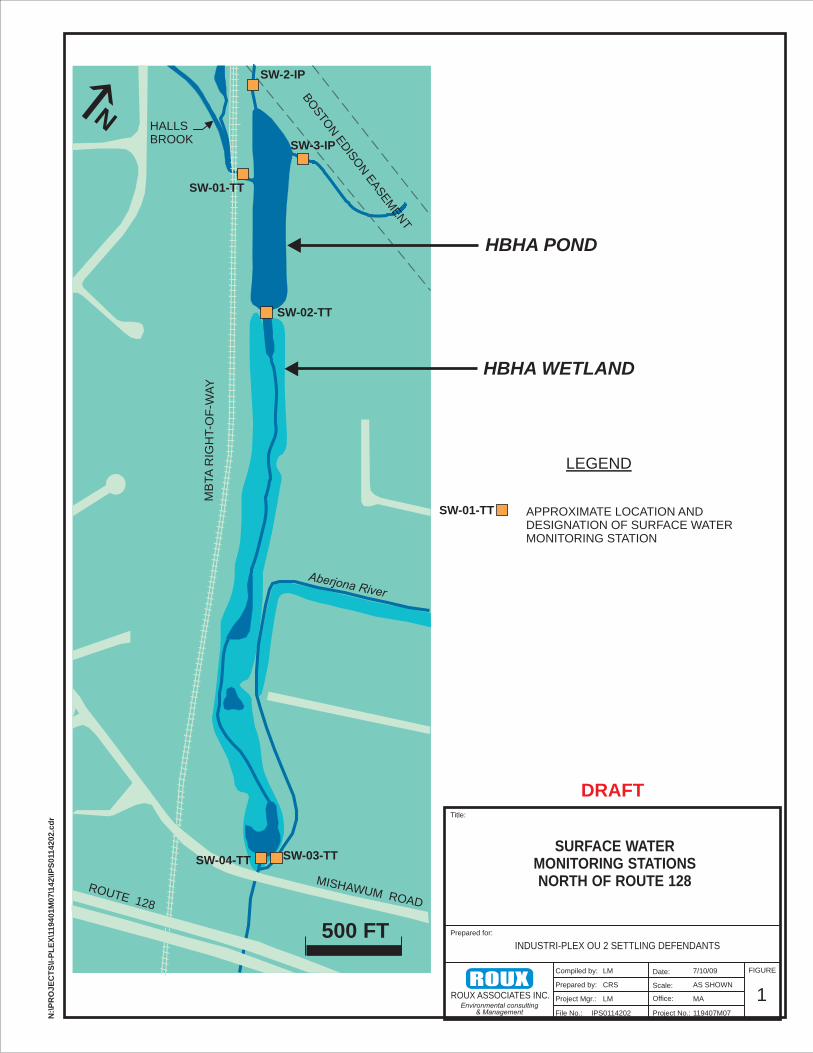
brief discussion of the data. Surface water monitoring stations are shown in Figures 1 and 2.
Monitoring and Maintenance Activities Performed During the Reporting Period 1. Continuous monitoring of stream flow was conducted at all ten monitoring stations
during the reporting period. As indicated in the previous Baseflow Surface Water
Monitoring Report, all In-Situ® MP Troll® 9500 water quality meters (“Trolls”) were
removed from the monitoring stations in December due to persistent icing conditions.
During the reporting period, water quality parameters were subsequently measured
using a non-dedicated Troll on a weekly basis (January 7, 14, and 21, 2010). In
anticipation of a storm event, however, the dedicated Trolls were redeployed at all ten
monitoring stations on January 24, 2010, and continuous water quality measurements
were made through January 29, 2010. On that day, the Trolls were removed again from
all ten monitoring stations due to icing conditions. The dedicated Trolls will be
redeployed when weather conditions allow.
2. Regular weekly O&M activities were performed at the surface water monitoring stations
on January 7, 14, 21, 28, and 29, 2010, and included the following:
• Inspected instrumentation and tubing and adjusted as needed.
• Cleared debris around station instrumentation.
• Cleaned sample intake and staff gauge.
• Cleaned the Isco 750 area-velocity module sensor.
• Collected manual stage measurements.
• Checked station power levels.
• Inspected rain gauges and cleaned as needed.
• Downloaded flow data stored in the Isco units.
ROUX ASSOCIATES, INC. -2- H:\Projects\Industri-Plex\119401M07\157\1194.0001M007.157.R.doc

DRAFT
• Verified the telemetry cable connection.
3. Monthly O&M activities were performed on January 28 and January 29, 2010 (in
conjunction with weekly O&M activities) and included the following:
• Collected manual velocity measurements.
• Cleaned solar panels.
4. The SWMP monthly baseflow sampling event was conducted on January 6, 2010 and
included the following:
• Collected baseflow surface water samples at all ten SWMP monitoring stations.
• Measured groundwater and surface water elevations at eight of the ten SWMP monitoring stations.1,2
• Conducted manual gauging of stream flow at the Montvale Avenue monitoring
station (SW-06-TT).3
Data Generated During the Reporting Period
1. Water quality parameters recorded at the time of baseflow sampling on
January 6, 2010 are provided in Tables 1a through 1j,4 along with the water quality
measurements made during all previous SWMP and (where performed) “Early Action”
baseflow sampling events.
2. Analytical results for the baseflow samples collected during the reporting period5 are
provided in Tables 2a through 2j along with validated analytical laboratory results for
baseflow samples collected during previous SWMP sampling events and (where
performed) Early Action and other previous sampling programs at the site (i.e., the 1 There is no piezometer at the Mishawum Road monitoring station (SW-04-TT). 2 Multiple attempts were made during January 2010 to gauge the piezometer at the Swanton Street
monitoring station (SW-07-TT); however, water within the piezometer was frozen on all occasions and, therefore, gauging data were not obtained.
3 Gauging was not conducted at any other stations as adequate low-flow data now exist for evaluating existing (TTNUS) rating curves.
4 Stations are listed in order from “upstream to downstream” (SW-2-IP, SW-3-IP, SW-01-TT, SW-02-TT, SW-04-TT, SW-03-TT, SW-05-TT, SW-06-TT, SW-07-TT, SW-08-TT) as requested by USEPA.
5 These results have not yet been validated.
ROUX ASSOCIATES, INC. -3- H:\Projects\Industri-Plex\119401M07\157\1194.0001M007.157.R.doc

DRAFT
ROUX ASSOCIATES, INC. -4- H:\Projects\Industri-Plex\119401M07\157\1194.0001M007.157.R.doc
Groundwater and Surface Water Investigation Plan [GSIP] and the Multiple Source
Groundwater Response Plan [MSGRP]).
3. Groundwater and surface water elevation data are provided in Table 3.
Data Analysis Data trends – Benzene, total arsenic, dissolved arsenic, and ammonia concentrations
detected in baseflow samples collected during the SWMP and previous sampling programs
(GSIP, MSGRP, and Early Action) are summarized in box-whisker plots in Appendix A.
The most recent SWMP results are shown as solid circles (unless the analyte was not
detected), while the previous SWMP results and all results from previous sampling programs
are plotted as “boxes” and “whiskers” whenever possible.6 The boxes indicate the range
within which the central fifty percent of the results fall (the box edges mark the first and third
quartiles and the line dividing the box in two marks the median value), while the whiskers
show the full range of values reported.7
6 Since at least two values are required to construct a “box,” previous results are shown as individual
diamonds in those cases where the analyte was detected in only one sample during a particular sampling program.
7 Any statistical outliers have not been determined or identified.
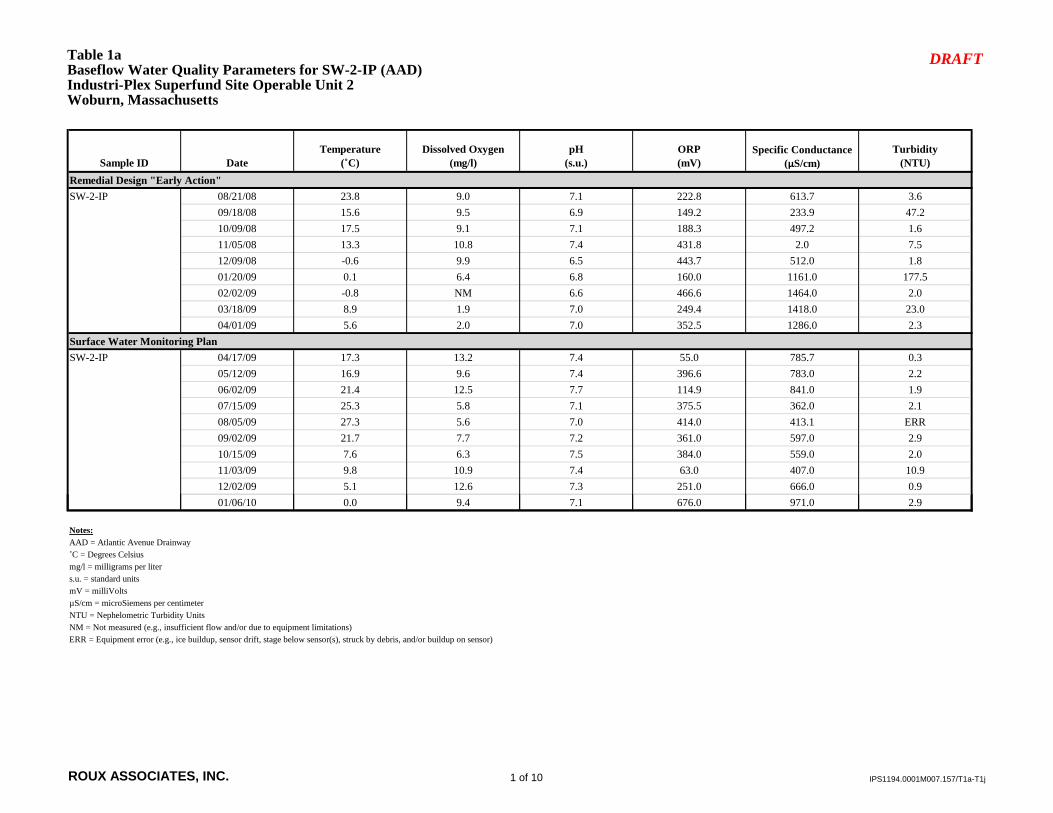
Table 1aBaseflow Water Quality Parameters for SW-2-IP (AAD)Industri-Plex Superfund Site Operable Unit 2Woburn, Massachusetts
DRAFT
Sample ID DateTemperature
(˚C)Dissolved Oxygen
(mg/l)pH
(s.u.)ORP(mV)
Specific Conductance(µS/cm)
Turbidity(NTU)
Remedial Design "Early Action"SW-2-IP 08/21/08 23.8 9.0 7.1 222.8 613.7 3.6
09/18/08 15.6 9.5 6.9 149.2 233.9 47.210/09/08 17.5 9.1 7.1 188.3 497.2 1.611/05/08 13.3 10.8 7.4 431.8 2.0 7.512/09/08 -0.6 9.9 6.5 443.7 512.0 1.801/20/09 0.1 6.4 6.8 160.0 1161.0 177.502/02/09 -0.8 NM 6.6 466.6 1464.0 2.003/18/09 8.9 1.9 7.0 249.4 1418.0 23.004/01/09 5.6 2.0 7.0 352.5 1286.0 2.3
Surface Water Monitoring PlanSW-2-IP 04/17/09 17.3 13.2 7.4 55.0 785.7 0.3
05/12/09 16.9 9.6 7.4 396.6 783.0 2.206/02/09 21.4 12.5 7.7 114.9 841.0 1.907/15/09 25.3 5.8 7.1 375.5 362.0 2.108/05/09 27.3 5.6 7.0 414.0 413.1 ERR09/02/09 21.7 7.7 7.2 361.0 597.0 2.910/15/09 7.6 6.3 7.5 384.0 559.0 2.011/03/09 9.8 10.9 7.4 63.0 407.0 10.912/02/09 5.1 12.6 7.3 251.0 666.0 0.901/06/10 0.0 9.4 7.1 676.0 971.0 2.9
Notes:AAD = Atlantic Avenue Drainway˚C = Degrees Celsiusmg/l = milligrams per liters.u. = standard unitsmV = milliVoltsµS/cm = microSiemens per centimeterNTU = Nephelometric Turbidity UnitsNM = Not measured (e.g., insufficient flow and/or due to equipment limitations)ERR = Equipment error (e.g., ice buildup, sensor drift, stage below sensor(s), struck by debris, and/or buildup on sensor)
ROUX ASSOCIATES, INC. IPS1194.0001M007.157/T1a-T1j1 of 10

Table 1bBaseflow Laboratory Analytical Results for SW-3-IP (Boston Edison Co. ROW)Industri-Plex Superfund Site Operable Unit 2Woburn, Massachusetts
DRAFT
Sample ID DateTemperature
(˚C)Dissolved Oxygen
(mg/l)pH
(s.u.)ORP(mV)
Specific Conductance(µS/cm)
Turbidity(NTU)
Remedial Design "Early Action"SW-3-IP 08/21/08 19.7 9.6 7.5 210.4 906.2 5.2
09/18/08 NS NS NS NS NS NS10/09/08 17.4 5.9 7.1 179.4 697.0 4.211/05/08 NS NS NS NS NS NS12/09/08 NS NS NS NS NS NS01/20/09 NS NS NS NS NS NS02/02/09 5.2 9.0 6.8 -17.0 800.7 1.403/18/09 10.5 3.7 7.1 162.4 193.0 58.204/01/09 4.1 2.3 6.8 110.2 ERR 21.3
Surface Water Monitoring PlanSW-3-IP 04/17/09 16.4 11.7 6.8 -70.0 908.3 4.7
05/12/09 13.5 7.3 7.3 370.7 3.0 24.306/02/09 NM NM NM NM NM NM07/15/09* 14.7 0.0 11.8 7.5 22.0 344.808/05/09* 14.6 0.0 4.0 7.6 26.0 ERR09/02/09 NM NM NM NM NM NM10/15/09 NM NM NM NM NM NM11/03/09 10.9 5.6 6.7 25.0 533.0 5.412/02/09 NM NM NM NM NM NM01/06/10 3.4 6.2 7.1 572.0 1637.0 114.5
Notes:BECO ROW = Boston Edison Company right-of-way˚C = Degrees Celsiusmg/l = milligrams per liters.u. = standard unitsmV = milliVoltsµS/cm = microSiemens per centimeterNTU = Nephelometric Turbidity UnitsNS = Not SampledNM = Not measured (eg. insufficient flow and/or due to equipment limitations)ERR = Equipment error (eg. ice buildup, sensor drift, stage below sensor(s), struck by debris, and/or buildup on sensor)* = Barely discernible flow and limited flushing of water was observed; therefore, water quality parameters are not likely representative of baseflow conditions
ROUX ASSOCIATES, INC. IPS1194.0001M007.157/T1a-T1j2 of 10

Table 1cBaseflow Laboratory Analytical Results for SW-01-TT (Halls Brook)Industri-Plex Superfund Site Operable Unit 2Woburn, Massachusetts
DRAFT
Sample ID DateTemperature
(˚C)Dissolved Oxygen
(mg/l)pH
(s.u.)ORP(mV)
Specific Conductance(µS/cm)
Turbidity(NTU)
Remedial Design "Early Action"SW-01-TT 08/21/08 17.3 8.3 7.1 250.2 832.3 9.1
09/18/08 14.3 8.6 7.1 176.7 755.9 6.310/09/08 15.1 7.5 6.9 169.7 899.5 15.611/05/08 9.7 7.1 6.8 508.3 2774.0 27.512/09/08 2.2 9.0 6.8 483.9 3056.0 47.301/20/09 0.4 12.4 7.0 81.0 1362.0 24.702/02/09 1.7 7.8 6.9 -287.4 1184.0 8.103/18/09 7.1 ERR ERR 10.3 ERR 44.504/01/09 7.1 ERR ERR 6.7 ERR 388.4
Surface Water Monitoring PlanSW-01-TT 04/17/09 13.0 15.7 6.9 34.0 965.5 3.7
05/12/09 15.7 8.0 7.2 499.7 662.0 18.706/02/09 16.2 8.7 7.7 93.7 923.0 49.807/15/09 18.8 3.9 6.9 518.3 743.0 133.808/05/09 20.9 ERR 6.7 470.9 800.0 ERR09/02/09 15.7 ERR 5.1 544.9 753.0 119.310/15/09 7.5 5.6 7.3 390.0 793.0 5.111/03/09 9.8 8.5 7.0 64.0 566.0 18.612/02/09 6.3 12.3 7.1 254.0 747.0 3.601/06/10 1.7 10.0 7.0 643.0 1177.0 7.3
Notes:˚C = Degrees Celsiusmg/l = milligrams per liters.u. = standard unitsmV = milliVoltsµS/cm = microSiemens per centimeterNTU = Nephelometric Turbidity UnitsERR = Equipment error (e.g., ice buildup, sensor drift, stage below sensor(s), struck by debris, and/or buildup on sensor)
ROUX ASSOCIATES, INC. IPS1194.0001M007.157/T1a-T1j3 of 10

Table 1dBaseflow Laboratory Analytical Results for SW-02-TT (HBHA Pond Outlet)Industri-Plex Superfund Site Operable Unit 2Woburn, Massachusetts
DRAFT
Sample ID DateTemperature
(˚C)Dissolved Oxygen
(mg/l)pH
(s.u.)ORP(mV)
Specific Conductance(µS/cm)
Turbidity(NTU)
Remedial Design "Early Action"SW-02-TT 08/21/08 23.7 7.4 6.8 264.5 880.3 6.2
09/18/08 17.4 6.3 6.8 178.9 728.0 5.710/09/08 16.5 7.9 6.8 192.2 888.2 5.411/05/08 8.6 7.1 6.7 466.9 854.0 30.212/09/08 1.7 10.3 6.5 504.2 780.0 13.501/20/09 0.9 13.9 6.8 139.0 11.8 9.202/02/09 1.2 NM 6.4 336.6 1176.0 14.803/18/09 7.1 11.3 6.5 451.4 11.7 24.204/01/09 7.1 10.0 6.5 479.3 948.0 16.8
Surface Water Monitoring PlanSW-02-TT 04/17/09 12.5 10.4 6.8 74.0 959.5 22.5
05/12/09 14.8 7.6 6.7 480.8 800.0 30.106/02/09 18.1 14.8 7.3 139.2 974.0 24.907/15/09 21.1 4.4 6.3 489.0 781.0 62.408/05/09 22.2 3.7 6.5 432.2 754.0 ERR09/02/09 19.8 5.3 6.5 505.6 672.0 123.510/15/09 9.5 6.0 7.2 383.0 841.0 9.711/03/09 12.5 7.0 6.7 54.0 579.0 31.312/02/09 5.5 10.6 6.9 223.0 739.0 4.201/06/10 1.9 7.4 6.8 522.0 1349.0 54.4
Notes:HBHA = Halls Brook Holding Area˚C = Degrees Celsiusmg/l = milligrams per liters.u. = standard unitsmV = milliVoltsµS/cm = microSiemens per centimeterNTU = Nephelometric Turbidity UnitsNM = Not measured (e.g., insufficient flow and/or due to equipment limitations)ERR = Equipment error (eg. ice buildup, sensor drift, stage below sensor(s), struck by debris, and/or buildup on sensor)
ROUX ASSOCIATES, INC. IPS1194.0001M007.157/T1a-T1j4 of 10

Table 1eBaseflow Laboratory Analytical Results for SW-04-TT (HBHA Wetland Outlet)Industri-Plex Superfund Site Operable Unit 2Woburn, Massachusetts
DRAFT
Sample ID DateTemperature
(˚C)Dissolved Oxygen
(mg/l)pH
(s.u.)ORP(mV)
Specific Conductance(µS/cm)
Turbidity(NTU)
Remedial Design "Early Action"SW-04-TT 08/21/08 20.2 9.8 6.8 224.0 883.1 8.4
09/18/08 16.8 7.0 6.8 81.7 727.8 9.610/09/08 18.0 8.0 6.8 138.4 920.0 8.111/05/08 8.7 2.7 6.7 243.7 916.0 0.012/09/08 1.4 8.8 6.0 350.9 778.0 0.001/20/09 0.2 4.6 6.0 NM 1172.0 0.002/02/09 0.8 4.5 8.0 335.5 1394.0 0.003/18/09 10.6 14.2 7.8 222.8 1063.0 0.204/01/09 6.8 10.7 7.8 226.0 844.0 0.0
Surface Water Monitoring PlanSW-04-TT 04/17/09 11.9 10.7 6.9 -10.0 1289.0 3.3
05/12/09 19.4 11.7 6.8 286.0 570.0 7.506/02/09 19.0 14.1 7.5 83.6 978.0 9.607/15/09 23.2 7.6 6.9 387.2 781.0 21.408/05/09 ERR ERR ERR ERR ERR ERR09/02/09 6.9 ERR ERR 19.4 18.0 472.710/15/09 9.1 5.6 7.1 383.0 821.0 21.411/03/09 12.2 8.6 6.8 64.0 572.0 5.312/02/09 6.8 10.3 6.9 190.0 734.0 3.201/06/10 2.2 9.1 6.8 493.0 1371.0 5.7
Notes:HBHA = Halls Brook Holding Area˚C = Degrees Celsiusmg/l = milligrams per liters.u. = standard unitsmV = milliVoltsµS/cm = microSiemens per centimeterNTU = Nephelometric Turbidity UnitsNM = Not measured (eg. insufficient flow and/or due to equipment liminitations)ERR = Equipment error (eg. Ice buildup, sensor drift, stage below sensor(s), struck by debris, and/or buildup pn sensor)
ROUX ASSOCIATES, INC. IPS1194.0001M007.157/T1a-T1j5 of 10

Table 1fBaseflow Laboratory Analytical Results for SW-03-TT (Aberjona)Industri-Plex Superfund Site Operable Unit 2Woburn, Massachusetts
DRAFT
Sample ID DateTemperature
(˚C)Dissolved Oxygen
(mg/l)pH
(s.u.)ORP(mV)
Specific Conductance(µS/cm)
Turbidity(NTU)
Surface Water Monitoring PlanSW-03-TT 04/17/09 13.5 11.1 6.6 36.0 967.8 7.8
05/12/09 18.7 5.2 6.9 79.6 733.0 67.906/02/09 16.9 5.8 7.5 31.8 1261.0 1257.007/15/09 20.4 5.0 6.6 493.1 826.0 22.708/05/09 22.1 3.0 6.7 494.8 708.0 ERR09/02/09 17.3 2.5 6.6 440.9 832.0 75.410/15/09 8.4 4.8 7.1 383.0 944.0 2.911/03/09 10.7 5.7 6.5 59.0 678.0 4.312/02/09 7.0 9.0 6.9 184.0 873.0 2.301/06/10 2.2 9.3 7.0 437.0 1329.0 3.1
Notes:˚C = Degrees Celsiusmg/l = milligrams per liters.u. = standard unitsmV = milliVoltsµS/cm = microSiemens per centimeterNTU = Nephelometric Turbidity UnitsERR = Equipment error (eg. ice buildup, sensor drift, stage below sensor(s), struck by debris, and/or buildup on sensor)
ROUX ASSOCIATES, INC. IPS1194.0001M007.157/T1a-T1j6 of 10

Table 1gBaseflow Laboratory Analytical Results for SW-05-TT (Salem Street)Industri-Plex Superfund Site Operable Unit 2Woburn, Massachusetts
DRAFT
Sample ID DateTemperature
(˚C)Dissolved Oxygen
(mg/l)pH
(s.u.)ORP(mV)
Specific Conductance(µS/cm)
Turbidity(NTU)
Surface Water Monitoring PlanSW-05-TT 04/17/09 10.7 10.7 7.0 54.0 1154.0 5.1
05/12/09 17.9 3.1 7.1 319.8 929.0 41.706/02/09 18.9 12.3 7.6 135.1 1121.0 12.907/15/09 20.5 9.2 6.8 429.6 1086.0 20.708/05/09 22.7 0.4 6.7 472.2 936.0 ERR09/02/09 6.8 ERR ERR 17.6 5.0 480.910/15/09 8.4 5.5 7.2 3.7 927.0 5.711/03/09 10.4 8.5 6.8 73.0 633.0 0.312/02/09 6.3 10.2 6.8 237.0 838.0 3.001/06/10 1.6 9.0 6.8 613.0 1432.0 9.3
Notes:˚C = Degrees Celsiusmg/l = milligrams per liters.u. = standard unitsmV = milliVoltsµS/cm = microSiemens per centimeterNTU = Nephelometric Turbidity UnitsERR = Equipment error (eg. Ice buildup, sensor drift, stage below sensor(s), struck by debris, and/or buildup pn sensor)
ROUX ASSOCIATES, INC. IPS1194.0001M007.157/T1a-T1j7 of 10

Table 1hBaseflow Laboratory Analytical Results for SW-06-TT (Montvale Avenue)Industri-Plex Superfund Site Operable Unit 2Woburn, Massachusetts
DRAFT
Sample ID DateTemperature
(˚C)Dissolved Oxygen
(mg/l)pH
(s.u.)ORP(mV)
Specific Conductance(µS/cm)
Turbidity(NTU)
Surface Water Monitoring PlanSW-06-TT 04/17/09 8.7 10.5 7.0 145.0 1212.0 3.3
05/12/09 14.6 14.3 6.8 420.4 723.2 17.206/02/09 16.6 6.7 7.5 96.9 1120.0 32.607/15/09 17.4 7.0 7.0 425.0 780.0 6.908/05/09 25.1 7.6 7.0 382.5 824.0 0.009/02/09 15.9 7.0 6.9 464.5 825.0 70.610/15/09 7.1 5.7 7.3 372.0 924.0 3.611/03/09 8.8 8.8 6.8 51.0 635.0 3.512/02/09 5.3 12.9 6.8 258.0 875.0 3.301/06/10 1.0 10.1 7.0 595.0 1411.0 5.6
Notes:˚C = Degrees Celsiusmg/l = milligrams per liters.u. = standard unitsmV = milliVoltsµS/cm = microSiemens per centimeterNTU = Nephelometric Turbidity Units
ROUX ASSOCIATES, INC. IPS1194.0001M007.157/T1a-T1j8 of 10
Table 1iBaseflow Laboratory Analytical Results for SW-07-TT (Swanton Street)Industri-Plex Superfund Site Operable Unit 2Woburn, Massachusetts
DRAFT
Sample ID DateTemperature
(˚C)Dissolved Oxygen
(mg/l)pH
(s.u.)ORP(mV)
Specific Conductance(µS/cm)
Turbidity(NTU)
Surface Water Monitoring PlanSW-07-TT 04/17/09 9.3 11.2 6.9 60.0 1145.0 2.6
05/12/09 14.6 8.4 6.9 464.2 920.0 13.706/02/09 16.8 7.5 7.9 54.8 1042.0 1.507/15/09 17.8 6.5 6.9 466.6 1028.0 2.908/05/09 21.5 4.8 7.0 522.7 908.0 ERR09/02/09 17.5 7.6 7.0 443.8 767.0 7.310/15/09 7.8 5.5 7.1 372.0 891.0 3.211/03/09 9.2 8.5 6.8 86.0 614.0 2.312/02/09 5.4 11.7 6.9 338.0 844.0 1.801/06/10 1.5 10.2 6.9 589.0 1198.0 5.1
Notes:˚C = Degrees Celsiusmg/l = milligrams per liters.u. = standard unitsmV = milliVoltsµS/cm = microSiemens per centimeterNTU = Nephelometric Turbidity UnitsERR = Equipment error (eg. ice buildup, sensor drift, stage below sensor(s), struck by debris, and/or buildup on sensor)
The specific conductance value recorded during the January 2010 baseflow sampling event was rejected following internal QA review; value shown was measured on January 14, 2010.
ROUX ASSOCIATES, INC. IPS1194.0001M007.157/T1a-T1j9 of 10

Table 1jBaseflow Laboratory Analytical Results for SW-08-TT (USGS / Mystic Avenue)Industri-Plex Superfund Site Operable Unit 2Woburn, Massachusetts
DRAFT
Sample ID DateTemperature
(˚C)Dissolved Oxygen
(mg/l)pH
(s.u.)ORP(mV)
Specific Conductance(µS/cm)
Turbidity(NTU)
Surface Water Monitoring PlanSW-08-TT 04/17/09 9.9 10.9 6.9 177.0 1074.0 5.2
05/12/09 15.0 7.1 6.9 498.0 878.0 46.306/02/09 16.6 9.3 8.4 63.4 970.0 33.307/15/09 19.4 6.8 7.3 432.7 987.0 3.308/05/09 23.0 6.2 7.1 436.4 902.0 ERR09/02/09 17.0 7.4 7.1 360.5 765.0 3.410/15/09 8.6 5.7 7.0 370.0 834.0 3.311/03/09 9.8 8.3 6.8 96.0 578.0 8.812/02/09 5.9 12.0 6.9 352.0 799.0 1.501/06/10 1.7 11.3 6.9 593.0 997.0 5.0
Notes:USGS = United States Geological Survey˚C = Degrees Celsiusmg/l = milligrams per liters.u. = standard unitsmV = milliVoltsµS/cm = microSiemens per centimeterNTU = Nephelometric Turbidity UnitsERR = Equipment error (eg. ice buildup, sensor drift, stage below sensor(s), struck by debris, and/or buildup on sensor)
ROUX ASSOCIATES, INC. 10 of 10 IPS1194.0001M007.157/T1a-T1j

Table 2aBaseflow Laboratory Analytical Results for SW-2-IP (Atlantic Avenue Drainway)Industri-Plex Superfund Site Operable Unit 2Woburn, Massachusetts
DRAFT
Sample ID DateFlow(cfs)
Benzene(µg/l)
Total Arsenic(mg/l)
Dissolved Arsenic(mg/l)
Total Iron(mg/l)
Dissolved Iron(mg/l)
TSS(mg/l)
Ammonia(mg/l)
Nitrite(mg/l)
Nitrate(mg/l)
TKN(mg/l)
Total Organic Nitrogen
(mg/l)Groundwater & Surface Water Investigation PlanSW-2 08/29/00 NM NS NS NS NS NS NS NS NS NS NS NS
10/05/00 NM NS NS NS NS NS NS NS NS NS NS NS04/05/01 NC -- 0.0098B 0.0068B -- -- 10.8 -- -- -- -- --
Remedial Design "Early Action"SW-2-IP 08/21/08 NM 0.5U 0.007 0.005U -- -- 5U 0.088 0.05J 0.24 0.4 0.31
09/18/08 NM 0.5U 0.005U 0.005U -- -- 5U 0.075J 0.05U 0.15 0.47 0.4710/09/08 NM 0.5U 0.005U 0.005U -- -- 5U 0.0618J 0.034J 0.32 0.35 0.3511/05/08 0.02 0.5U 0.0028J 0.005U -- -- 5U 0.0623J 0.05U 0.4 0.86 0.8612/09/08 0.79 0.5U 0.003U 0.003U -- -- 5U 0.402 0.02U 0.52 0.71 0.3101/20/09 NM 0.5U 0.003U 0.003U -- -- 5U 1.74 0.05U 0.57 2 0.3U02/02/09 NM 0.5U 0.003U 0.003U -- -- 5U 1.13 0.044J 0.62 1.9 0.7703/18/09 1.57 0.5U 0.003U 0.003U -- -- 5U 0.328 0.05U 1.1 0.8 0.4704/01/09 0.24 0.5U 0.003U 0.003U -- -- 5U 0.403 0.05U 0.89 0.87 0.47
Surface Water Monitoring PlanSW-2-IP 04/17/09 1.34 0.5U 0.003U 0.003U 0.23 0.08 5U 0.0468J 0.05U 0.87 0.46U 0.46
05/12/09 1.47 0.5U 0.003U 0.003U 0.59 0.037J 5U 0.103 0.05U 0.21 0.9U 0.8 06/02/09 NM 0.5U 0.0023J 0.0025J 1.2 0.4 5U 0.088 0.05U 0.46 0.58 0.4907/15/09 0.45 0.5U 0.0023J 0.003 0.74 0.35 5U 0.091 0.14 0.32 0.44 0.3508/05/09 1.18 0.5U 0.003U 0.003U 1 0.46 5U 0.107 0.05U 0.25 0.47 0.3609/02/09 0.83 0.5U 0.0024J 0.0024J 0.54 0.19 5U 0.145 0.036J 0.14 0.43U 0.3U10/15/09 0.61 0.5U 0.003U 0.003U 0.32 0.15 5U 0.15U 0.05U 0.15 0.44 0.3U11/03/09* 5.91 0.5U 0.003U 0.003U 0.37 0.16 5U 0.156 0.05U 0.3 0.45 0.3U12/02/09 6.19 0.5U 0.0022J 0.003U 0.49 0.16 5U 0.62 0.05U 0.55 0.73 0.3U01/06/10* 5.02 0.5U 0.003U 0.003U 1.2 0.18 5U 0.578 0.05U 0.73 0.84 0.26J
Notes:
AAD = Atlantic Avenue Drainwaycfs = cubic feet per secondµg/l = micrograms per litermg/l = milligrams per literTSS = Total Suspended SolidsTKN = Total Kjeldahl Nitrogen
• For Stations SW-01-TT, SW-2-IP, SW-02-TT, SW-04-TT, and SW-08-TT, flows shown are based on the rating curves reported in the Quarterly Storm Flow Surface Water Monitoring Report No. 2.
ROUX ASSOCIATES, INC. IPS1194.0001M007.157/T2a-T2j1 of 10
TKN = Total Kjeldahl NitrogenNS = Not sampled-- = Sample not analyzed for this compoundNC = Not CalculatedB = The reported result is attributed to laboratory contamination due to the presence of the chemical in the associated laboratory blanU = Compound or sample not detected; value shown is reporting limJ = Analyte concentration is below quantitation limit, but greater than or equal to 1/2 the laboratory detection limit. Value is estimateNM = Not measured (e.g., insufficient flow and/or due to equipment limitation* = Not yet validated
ROUX ASSOCIATES, INC. IPS1194.0001M007.157/T2a-T2j1 of 10

Table 2bBaseflow Laboratory Analytical Results for SW-3-IP (Boston Edison Co. ROW)Industri-Plex Superfund Site Operable Unit 2Woburn, Massachusetts
DRAFT
Sample ID DateFlow(cfs)
Benzene(µg/l)
Total Arsenic(mg/l)
Dissolved Arsenic(mg/l)
Total Iron(mg/l)
Dissolved Iron(mg/l)
TSS(mg/l)
Ammonia(mg/l)
Nitrite(mg/l)
Nitrate(mg/l)
TKN(mg/l)
Total Organic Nitrogen
(mg/l)Groundwater & Surface Water Investigation PlanSW-3 08/29/00 NM NS NS NS NS NS NS NS NS NS NS NS
10/05/00 NM NS NS NS NS NS NS NS NS NS NS NS04/05/01 NM NS NS NS NS NS NS NS NS NS NS NS
Remedial Design "Early Action"SW-3-IP 08/21/08 NM -- -- -- -- -- -- 23.5 -- -- -- --
09/18/08 NM NS NS NS NS NS NS NS NS NS NS NS10/09/08 NM 0.5U 0.0028J 0.0047J -- -- 84 12.3 0.15 1.1 13 0.711/05/08 NM NS NS NS NS NS NS NS NS NS NS NS12/09/08 NM NS NS NS NS NS NS NS NS NS NS NS01/20/09 NM NS NS NS NS NS NS NS NS NS NS NS02/02/09 NM 0.43J 0.22 0.029 -- -- 650 15.7 0.11 1.2 16 0.303/18/09 0.15 3.5 0.144 0.029 -- -- 93 22.6 0.036J 1.3 24 1.404/01/09 0.02 3.2 0.087 0.055 -- -- 35 25.5 0.034J 1.1 26 0.5
Surface Water Monitoring PlanSW-3-IP 04/17/09 0.09 1.3 0.419 0.037 39 2.6 1100 20.1 0.08 1.8 22 1.9
05/12/09 0.05 0.5U 0.028 0.004 1.7 0.08 140 11.5 0.13 1.5 12 0.5 06/02/09 NM NS NS NS NS NS NS NS NS NS NS NS07/15/09 0.06 0.5U 0.01 0.006 0.42 0.05 5U 14.3 0.22 1.1 14 0.3U08/05/09 0.04 0.5U 0.032 0.009 1.1 0.028J 5U 17.3 0.1 0.55 18 0.709/02/09 NM NS NS NS NS NS NS NS NS NS NS NS10/15/09 NM NS NS NS NS NS NS NS NS NS NS NS11/03/09* NM 0.5U 0.014 0.012 1.3 0.98 5U 11.9 0.049J 0.83 12 0.3U12/02/09 NM NS NS NS NS NS NS NS NS NS NS NS01/06/10* 0.09 2.8 0.094 0.079 6.3 6.2 10 29.5 0.044J 1.7 32 2.5
Notes:
BECO ROW = Boston Edison Company right-of-waycfs = cubic feet per secondµg/l = micrograms per litermg/l = milligrams per literTSS = Total Suspended SolidsTKN = Total Kjeldahl NitrogenNS = Not Sampled-- = Sample not analyzed for this compoundU = Compound or sample not detected; value shown is reporting limit
• Flows shown for station SW-3-IP are estimated based on level and velocity.
ROUX ASSOCIATES, INC. IPS1194.0001M007.157/T2a-T2j2 of 10
U = Compound or sample not detected; value shown is reporting limitJ = Analyte concentration is below quantitation limit, but greater than or equal to 1/2 the laboratory detection limit. Value is estimated.NM = Not measured (e.g., insufficient flow and/or due to equipment limitations)* = Not yet validated
ROUX ASSOCIATES, INC. IPS1194.0001M007.157/T2a-T2j2 of 10
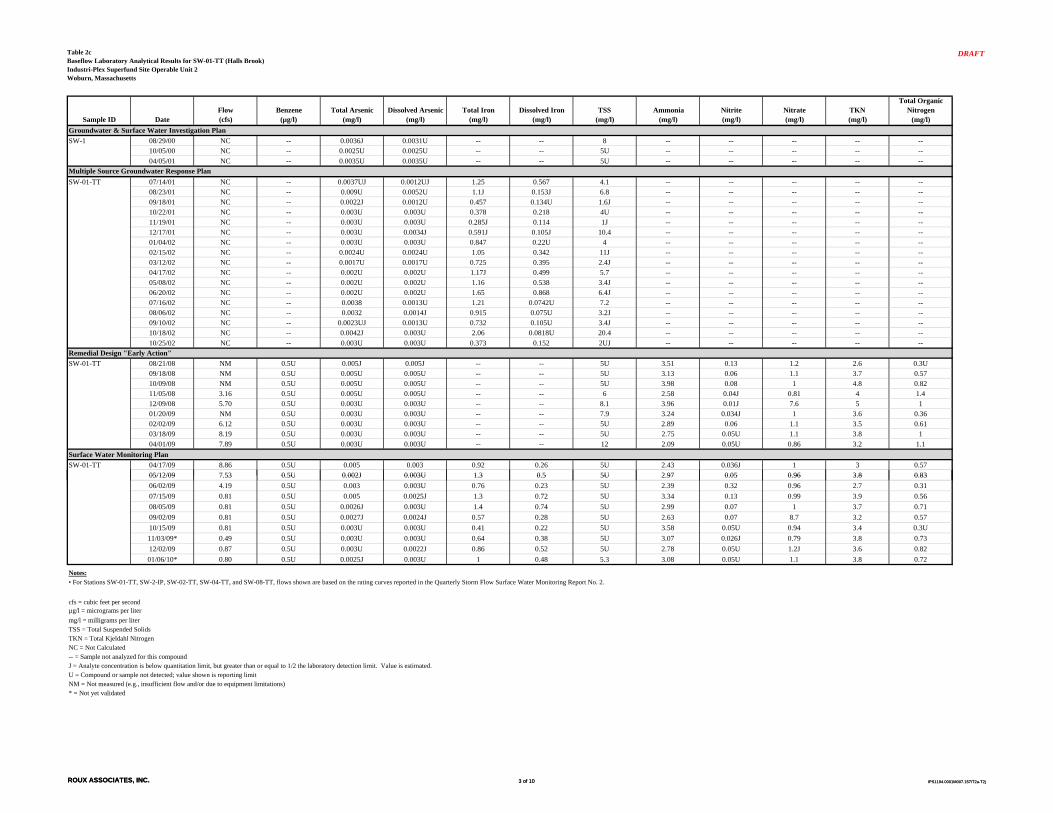
Table 2cBaseflow Laboratory Analytical Results for SW-01-TT (Halls Brook)Industri-Plex Superfund Site Operable Unit 2Woburn, Massachusetts
DRAFT
Sample ID DateFlow(cfs)
Benzene(µg/l)
Total Arsenic(mg/l)
Dissolved Arsenic(mg/l)
Total Iron(mg/l)
Dissolved Iron(mg/l)
TSS(mg/l)
Ammonia(mg/l)
Nitrite(mg/l)
Nitrate(mg/l)
TKN(mg/l)
Total Organic Nitrogen
(mg/l)Groundwater & Surface Water Investigation PlanSW-1 08/29/00 NC -- 0.0036J 0.0031U -- -- 8 -- -- -- -- --
10/05/00 NC -- 0.0025U 0.0025U -- -- 5U -- -- -- -- --04/05/01 NC -- 0.0035U 0.0035U -- -- 5U -- -- -- -- --
Multiple Source Groundwater Response PlanSW-01-TT 07/14/01 NC -- 0.0037UJ 0.0012UJ 1.25 0.567 4.1 -- -- -- -- --
08/23/01 NC -- 0.009U 0.0052U 1.1J 0.153J 6.8 -- -- -- -- --09/18/01 NC -- 0.0022J 0.0012U 0.457 0.134U 1.6J -- -- -- -- --10/22/01 NC -- 0.003U 0.003U 0.378 0.218 4U -- -- -- -- --11/19/01 NC -- 0.003U 0.003U 0.285J 0.114 1J -- -- -- -- --12/17/01 NC -- 0.003U 0.0034J 0.591J 0.105J 10.4 -- -- -- -- --01/04/02 NC -- 0.003U 0.003U 0.847 0.22U 4 -- -- -- -- --02/15/02 NC -- 0.0024U 0.0024U 1.05 0.342 11J -- -- -- -- --03/12/02 NC -- 0.0017U 0.0017U 0.725 0.395 2.4J -- -- -- -- --04/17/02 NC -- 0.002U 0.002U 1.17J 0.499 5.7 -- -- -- -- --05/08/02 NC -- 0.002U 0.002U 1.16 0.538 3.4J -- -- -- -- --06/20/02 NC -- 0.002U 0.002U 1.65 0.868 6.4J -- -- -- -- --07/16/02 NC -- 0.0038 0.0013U 1.21 0.0742U 7.2 -- -- -- -- --08/06/02 NC -- 0.0032 0.0014J 0.915 0.075U 3.2J -- -- -- -- --09/10/02 NC -- 0.0023UJ 0.0013U 0.732 0.105U 3.4J -- -- -- -- --10/18/02 NC -- 0.0042J 0.003U 2.06 0.0818U 20.4 -- -- -- -- --10/25/02 NC -- 0.003U 0.003U 0.373 0.152 2UJ -- -- -- -- --
Remedial Design "Early Action"SW-01-TT 08/21/08 NM 0.5U 0.005J 0.005J -- -- 5U 3.51 0.13 1.2 2.6 0.3U
09/18/08 NM 0.5U 0.005U 0.005U -- -- 5U 3.13 0.06 1.1 3.7 0.5710/09/08 NM 0.5U 0.005U 0.005U -- -- 5U 3.98 0.08 1 4.8 0.8211/05/08 3.16 0.5U 0.005U 0.005U -- -- 6 2.58 0.04J 0.81 4 1.412/09/08 5.70 0.5U 0.003U 0.003U -- -- 8.1 3.96 0.01J 7.6 5 101/20/09 NM 0.5U 0.003U 0.003U -- -- 7.9 3.24 0.034J 1 3.6 0.3602/02/09 6.12 0.5U 0.003U 0.003U -- -- 5U 2.89 0.06 1.1 3.5 0.6103/18/09 8.19 0.5U 0.003U 0.003U -- -- 5U 2.75 0.05U 1.1 3.8 104/01/09 7.89 0.5U 0.003U 0.003U -- -- 12 2.09 0.05U 0.86 3.2 1.1
Surface Water Monitoring PlanSW-01-TT 04/17/09 8.86 0.5U 0.005 0.003 0.92 0.26 5U 2.43 0.036J 1 3 0.57
05/12/09 7 53 0 5U 0 002J 0 003U 1 3 0 5 5U 2 97 0 05 0 96 3 8 0 83
ROUX ASSOCIATES, INC. IPS1194.0001M007.157/T2a-T2j3 of 10
05/12/09 7.53 0.5U 0.002J 0.003U 1.3 0.5 5U 2.97 0.05 0.96 3.8 0.83 06/02/09 4.19 0.5U 0.003 0.003U 0.76 0.23 5U 2.39 0.32 0.96 2.7 0.3107/15/09 0.81 0.5U 0.005 0.0025J 1.3 0.72 5U 3.34 0.13 0.99 3.9 0.5608/05/09 0.81 0.5U 0.0026J 0.003U 1.4 0.74 5U 2.99 0.07 1 3.7 0.7109/02/09 0.81 0.5U 0.0027J 0.0024J 0.57 0.28 5U 2.63 0.07 8.7 3.2 0.5710/15/09 0.81 0.5U 0.003U 0.003U 0.41 0.22 5U 3.58 0.05U 0.94 3.4 0.3U11/03/09* 0.49 0.5U 0.003U 0.003U 0.64 0.38 5U 3.07 0.026J 0.79 3.8 0.7312/02/09 0.87 0.5U 0.003U 0.0022J 0.86 0.52 5U 2.78 0.05U 1.2J 3.6 0.8201/06/10* 0.80 0.5U 0.0025J 0.003U 1 0.48 5.3 3.08 0.05U 1.1 3.8 0.72
Notes:
cfs = cubic feet per secondµg/l = micrograms per litermg/l = milligrams per literTSS = Total Suspended SolidsTKN = Total Kjeldahl NitrogenNC = Not Calculated-- = Sample not analyzed for this compoundJ = Analyte concentration is below quantitation limit, but greater than or equal to 1/2 the laboratory detection limit. Value is estimated.U = Compound or sample not detected; value shown is reporting limitNM = Not measured (e.g., insufficient flow and/or due to equipment limitations)* = Not yet validated
• For Stations SW-01-TT, SW-2-IP, SW-02-TT, SW-04-TT, and SW-08-TT, flows shown are based on the rating curves reported in the Quarterly Storm Flow Surface Water Monitoring Report No. 2.
ROUX ASSOCIATES, INC. IPS1194.0001M007.157/T2a-T2j3 of 10

Table 2dBaseflow Laboratory Analytical Results for SW-02-TT (HBHA Pond Outlet)Industri-Plex Superfund Site Operable Unit 2Woburn, Massachusetts
DRAFT
Sample ID DateFlow(cfs)
Benzene(µg/l)
Total Arsenic(mg/l)
Dissolved Arsenic(mg/l)
Total Iron(mg/l)
Dissolved Iron(mg/l)
TSS(mg/l)
Ammonia(mg/l)
Nitrite(mg/l)
Nitrate(mg/l)
TKN(mg/l)
Total Organic Nitrogen
(mg/l)Groundwater & Surface Water Investigation PlanSW-4 08/29/00 NC -- 0.0211 0.0031U 1.15 -- 5U -- -- -- -- --
10/05/00 NC -- 0.0131 0.0025U 0.966 -- 5U -- -- -- -- --04/05/01 NC -- 0.0069J 0.0112J 1.05 -- 5U -- -- -- -- --
Multiple Source Groundwater Response PlanSW-02-TT 07/14/01 NC -- 0.0217 0.0096J 2.28 1.12 4.3 -- -- -- -- --
08/23/01 NC -- 0.0209 0.0058U 1.6J 0.349 4.6 -- -- -- -- --09/18/01 NC -- 0.0173 0.0045 1.1 0.114U 5.6J -- -- -- -- --10/22/01 NC -- 0.0312 0.0032J 2.23 0.159 5.6 -- -- -- -- --11/19/01 NC -- 0.0431 0.004J 3.51J 0.0472 12.8J -- -- -- -- --12/17/01 NC -- 0.0235 0.0045J 2.82J 0.0992J 9.6 -- -- -- -- --01/04/02 NC -- 0.0118 0.0055J 1.53 0.193U 1.6 -- -- -- -- --02/15/02 NC -- 0.0119 0.005 1.79 0.309 4J -- -- -- -- --03/12/02 NC -- 0.0205 0.0079 2.21 0.548 5.8J -- -- -- -- --04/17/02 NC -- 0.0113 0.0061 1.41J 0.706 3.2 -- -- -- -- --05/08/02 NC -- 0.0122 0.008 1.66 0.952 3J -- -- -- -- --06/20/02 NC -- 0.0136U 0.0065U 1.85 0.676 4.4J -- -- -- -- --07/16/02 NC -- 0.0232 0.0031 1.84 0.042U 4.4 -- -- -- -- --08/06/02 NC -- 0.0281 0.0044 1.91 0.0509U 6.6J -- -- -- -- --09/10/02 NC -- 0.0168 0.0024UJ 1.36 0.0407U 2.8J -- -- -- -- --10/18/02 NC -- 0.0774 0.0083 6.52 0.297 23.6 -- -- -- -- --10/25/02 NC -- 0.0236 0.0054J 1.82 0.351 4UJ -- -- -- -- --
Remedial Design "Early Action"SW-02-TT 08/21/08 NM 0.5U 0.029 0.006 -- -- 5U 7.73 0.1 0.76 8.2 0.47
09/18/08 NM 0.5U 0.021 0.005U -- -- 5U 6.01 0.08 0.82 6.8 0.7910/09/08 NM 0.5U 0.019 0.0048J -- -- 5U 5.39 0.07 0.81 6.2 0.8111/05/08 8.44 0.5U 0.02 0.005 -- -- 5U 5.52J 0.05U 0.57 6.3 0.7812/09/08 5.49 0.34J 0.017 0.009 -- -- 5U 5.51 0.01J 0.88 6 0.4901/20/09 NM 0.5U 0.009 0.004 -- -- 5U 4.11 0.027J 0.99 4.6 0.4902/02/09 ~5 0.28J 0.015 0.011 -- -- 5U 3.93 0.07 0.98 4.4 0.4703/18/09 NM 0.9 0.015 0.01 -- -- 5U 4.6 0.05U 0.96 5.6 104/01/09 ~6 0.7 0.014 0.007 -- -- 5U 3.51 0.05U 0.79 4.7 1.2
Surface Water Monitoring PlanSW-02-TT 04/17/09 8.62 0.46J 0.015 0.006 1.4 0.2 5U 4.12 0.05U 1 5.9 1.8
05/12/09 4.27 0.27J 0.017 0.006 1.9 0.33 5U 4.93 0.043J 0.7 5.6 0.67
ROUX ASSOCIATES, INC. IPS1194.0001M007.157/T2a-T2j4 of 10
05/12/09 4.27 0.27J 0.017 0.006 1.9 0.33 5U 4.93 0.043J 0.7 5.6 0.67 06/02/09 0.90 0.5U 0.018 0.008 1.4 0.06 5U 5.87 0.14 0.78 6.6 0.7307/15/09 2.10 0.5U 0.014 0.01 1.6 0.97 5U 3.69 0.07 0.82 4.6 0.9108/05/09 2.44 0.5U 0.009 0.007 1.7 0.84 5U 3.03 0.07 0.82 3.7 0.6709/02/09 0.91 0.5U 0.016 0.006 1.3 0.43 5U 4.94 0.05 0.49 5.4 0.4610/15/09 1.35 0.5U 0.016 0.006 1.2 0.28 5U 6.55 0.03J 0.62 7.4 0.8511/03/09* 13.54 0.5U 0.018 0.01 1.4 0.63 5.7 5.03 0.05U 0.8 5.6 0.5712/02/09 4.28 0.41J 0.014 0.01 1.3 0.69 5U 3.65 0.05U 0.71 4.3 0.6501/06/10* 5.19 0.5U 0.01 0.005 1.2 0.48 5U 3.35 0.05U 0.98 3.9 0.55
Notes:
HBHA = Halls Brook Holding Areacfs = cubic feet per secondµg/l = micrograms per litermg/l = milligrams per literTSS = Total Suspended SolidsTKN = Total Kjeldahl NitrogenNC = Not Calculated-- = Sample not analyzed for this compoundU = Compound or sample not detected; value shown is reporting limitJ = Analyte concentration is below quantitation limit, but greater than or equal to 1/2 the laboratory detection limit. Value is estimated.NM = Not measured (e.g., insufficient flow and/or due to equipment limitations)* = Not yet validated
• For Stations SW-01-TT, SW-2-IP, SW-02-TT, SW-04-TT, and SW-08-TT, flows shown are based on the rating curves reported in the Quarterly Storm Flow Surface Water Monitoring Report No. 2.
ROUX ASSOCIATES, INC. IPS1194.0001M007.157/T2a-T2j4 of 10

Table 2eBaseflow Laboratory Analytical Results for SW-04-TT (HBHA Wetland Outlet)Industri-Plex Superfund Site Operable Unit 2Woburn, Massachusetts
DRAFT
Sample ID DateFlow(cfs)
Benzene(µg/l)
Total Arsenic(mg/l)
Dissolved Arsenic(mg/l)
Total Iron(mg/l)
Dissolved Iron(mg/l)
TSS(mg/l)
Ammonia(mg/l)
Nitrite(mg/l)
Nitrate(mg/l)
TKN(mg/l)
Total Organic Nitrogen
(mg/l)Groundwater & Surface Water Investigation PlanSW-9 08/29/00 NC -- 0.0235 0.0031U 2.77 -- 8.5 -- -- -- -- --
10/05/00 NC -- 0.0126 0.0123 1.54 -- 5U -- -- -- -- --04/05/01 NC -- 0.0035U 0.0038J 0.883 -- 5U -- -- -- -- --
Multiple Source Groundwater Response PlanSW-04-TT 07/14/01 NC -- 0.023 0.0101J 3.09 1.6 4.5 -- -- -- -- --
08/23/01 NC -- 0.0501 0.014 6.14J 0.616 20.4 -- -- -- -- --09/18/01 NC -- 0.0246 0.005 3.3 0.14U 54.4J -- -- -- -- --10/22/01 NC -- 0.0193 0.0031J 2.72 0.121 6.4 -- -- -- -- --11/19/01 NC -- 0.0649 0.005J 9.66J 0.0666 109J -- -- -- -- --12/17/01 NC -- 0.171 0.0049J 27.9J 0.109J 85 -- -- -- -- --01/04/02 NC -- 0.0242 0.0044J 3.84 0.361 9 -- -- -- -- --02/15/02 NC -- 0.0251 0.0037J 3.9 0.409 8.2J -- -- -- -- --03/12/02 NC -- 0.0166 0.006 2.1 0.626 4.8J -- -- -- -- --04/17/02 NC -- 0.0135 0.0077U 1.88J 0.741 5.2 -- -- -- -- --05/08/02 NC -- 0.0086 0.0082 1.28 1.2 5.3J -- -- -- -- --06/20/02 NC -- 0.0238 0.0093U 3.73 1.34 4J -- -- -- -- --07/16/02 NC -- 0.0396 0.0062 4.52 0.0484U 12.6 -- -- -- -- --08/06/02 NC -- 0.0368 0.009 3.8 0.0791U 13.6J -- -- -- -- --09/10/02 NC -- 0.0314 0.0052U 3.64 0.0356U 9.2J -- -- -- -- --10/18/02 NC -- 0.0478 0.0141 4.6 1.14 15.6 -- -- -- -- --10/25/02 NC -- 0.0207 0.0045J 2.76 0.447 8.6J -- -- -- -- --
Remedial Design "Early Action"SW-04-TT 08/21/08 NM 0.5U 0.025 0.007 -- -- 5U 6.92 0.12 0.8 7.3 0.38
09/18/08 NM 0.5U 0.022 0.005J -- -- 5U 5.29 0.09 0.8 5.7 0.4110/09/08 NM 0.5U 0.02 0.003J -- -- 5U 5.18 0.09 0.95 5.7 0.5211/05/08 NM 0.5U 0.018 0.006 -- -- 5U 6.22J 0.047J 0.65 7.2 0.9812/09/08 5.80 0.5U 0.023 0.007 -- -- 5U 5.36 0.01J 0.8 6 0.6401/20/09 6.41 0.5U 0.02 0.008 -- -- 5.3 4.44 0.05U 0.94 5.1 0.6602/02/09 6.63 0.5U 0.013 0.008 -- -- 5U 3.71 0.029J 0.92 4.4 0.6903/18/09 6.02 0.5U 0.012 0.005 -- -- 5U 4.08 0.05U 0.95 5 0.9204/01/09 6.17 0.46J 0.012 0.006 -- -- 5U 3.72 0.05U 0.74 4.5 0.78
Surface Water Monitoring PlanSW-04-TT 04/17/09 5.56 0.5U 0.016 0.006 -- -- 5U 3.83 0.05U 0.96 4.6 0.77
05/12/09 4.13 0.5U 0.018 0.004 -- -- 5U 3.87 0.06 0.75 4.7 0.83
ROUX ASSOCIATES, INC. IPS1194.0001M007.157/T2a-T2j5 of 10
05/12/09 4.13 0.5U 0.018 0.004 5U 3.87 0.06 0.75 4.7 0.83 06/02/09 3.42 0.5U 0.018 0.009 -- -- 5U 5.12 0.049J 0.9 6 0.8807/15/09 4.37 0.5UJ 0.021 0.005 -- -- 6 2.67 0.15 0.76 3.3 0.6308/05/09 4.47 0.5U 0.017 0.012 -- -- 5U 2.27 0.22 1 2.8 0.5309/02/09 3.36 0.5U 0.012 0.007 -- -- 5U 3.7 0.13 0.76 4 0.310/15/09 3.06 0.5U 0.013 0.004 -- -- 5U 6.06 0.027J 0.96 6.6 0.5411/03/09* 2.78 0.5U 0.013 0.008 -- -- 5U 4.23 0.026J 0.66 4.8 0.5712/02/09 3.76 0.26J 0.013 0.008 -- -- 5U 3.83 0.05U 0.71 4.1 0.3U01/06/10* 6.23 0.5U 0.023 0.007 -- -- 5U 3.41 0.05U 0.95 4 0.59
Notes:
HBHA = Halls Brook Holding Areacfs = cubic feet per secondµg/l = micrograms per litermg/l = milligrams per literTSS = Total Suspended SolidsTKN = Total Kjeldahl NitrogenNC = Not Calculated-- = Sample not analyzed for this compoundU = Compound or sample not detected; value shown is reporting limitJ = Analyte concentration is below quantitation limit, but greater than or equal to 1/2 the laboratory detection limit. Value is estimated.NM = Not measured (e.g., Insufficient flow and/or due to equipment limitations)* = Not yet validated
• For Stations SW-01-TT, SW-2-IP, SW-02-TT, SW-04-TT, and SW-08-TT, flows shown are based on the rating curves reported in the Quarterly Storm Flow Surface Water Monitoring Report No. 2.
ROUX ASSOCIATES, INC. IPS1194.0001M007.157/T2a-T2j5 of 10

Table 2fBaseflow Laboratory Analytical Results for SW-03-TT (Aberjona)Industri-Plex Superfund Site Operable Unit 2Woburn, Massachusetts
DRAFT
Sample ID DateFlow(cfs)
Benzene(µg/l)
Total Arsenic(mg/l)
Dissolved Arsenic(mg/l)
Total Iron(mg/l)
Dissolved Iron(mg/l)
TSS(mg/l)
Ammonia(mg/l)
Nitrite(mg/l)
Nitrate(mg/l)
TKN(mg/l)
Total Organic Nitrogen
(mg/l)Multiple Source Groundwater Response PlanSW-03-TT 07/14/01 NC -- 0.0129 0.0096J 1.94 1.12 3.6 -- -- -- -- --
08/23/01 NC -- 0.0184 0.0104U 1.83J 0.568 3.6 -- -- -- -- --09/18/01 NC -- 0.0281 0.0179 3.13 1.46 6.4J -- -- -- -- --10/22/01 NC -- 0.018 0.0136 2.13 0.985 4.8 -- -- -- -- --11/19/01 NC -- 0.032 0.0242 3.53J 2.43 10.4J -- -- -- -- --12/17/01 NC -- 0.029 0.0224 3.32J 1.97 6 -- -- -- -- --01/04/02 NC -- 0.0278 0.019 3.42 2.11 10.6 -- -- -- -- --02/15/02 NC -- 0.0128 0.0118 1.63 1.14 1.4J -- -- -- -- --03/12/02 NC -- 0.0066 0.0076 1.04 0.935 1.4J -- -- -- -- --04/17/02 NC -- 0.0071U 0.0058U 1.16J 0.78 2.1 -- -- -- -- --05/08/02 NC -- 0.0135 0.0065 2.57 0.773 2J -- -- -- -- --06/20/02 NC -- 0.0111U 0.0057U 1.82 0.778 4UJ -- -- -- -- --07/16/02 NC -- 0.0246 0.0134 3.07 1.11 5.2 -- -- -- -- --08/06/02 NC -- 0.0325 0.0147 3.16 0.682 7J -- -- -- -- --08/31/02 NC -- 0.0195 0.0037UJ 1.73 0.14U 8.8J -- -- -- -- --09/10/02 NC -- 0.0348 0.0161 3.57 1.31 5.4J -- -- -- -- --10/18/02 NC -- 0.0284 0.003U 3.14 0.0721U 17.2 -- -- -- -- --10/25/02 NC -- 0.0072 0.006 1.15 0.683 3J -- -- -- -- --
Surface Water Monitoring PlanSW-03-TT 04/17/09 8.58 0.5U 0.006 0.004 -- -- 5U 0.778 0.06 1.6 1.2 0.42
05/12/09 8.15 0.5U 0.006 0.004 -- -- 5U 0.905 0.13 1.3 1.6 0.7 06/02/09 3.82 0.5U 0.008 0.006 -- -- 5U 1.72 0.43 1.5 2.2 0.4807/15/09 0.85 0.5UJ 0.007 0.011 -- -- 5U 0.837 0.38 2 0.83 0.3U08/05/09 3.63 0.5U 0.007 0.006 -- -- 5U 0.572 0.24 2.3 1.2 0.6309/02/09 0.23 0.5U 0.006 0.005 -- -- 5U 0.532 0.14 2 0.92U 0.3910/15/09 0.25 0.5U 0.005 0.006 -- -- 5U 0.724 0.06 2.4 1.1 0.3811/03/09* 0.23 0.5U 0.007 0.005 -- -- 5U 0.804 0.097 2.5 1.3 0.512/02/09 0.30 0.5U 0.006 0.005 -- -- 5U 0.65 0.048J 8.9 1.4 0.7501/06/10* 10.21 0.5U 0.007 0.006 -- -- 5U 2.31 0.038J 1.3 2.7 0.39
Notes:
• The flow value shown was estimated based on stage recorded during the January 2010 baseflow sampling event.
cfs = cubic feet per second
• For Stations SW-03-TT, and SW-05-TT through SW-07-TT, flows shown are based on the rating curves reported by TTNUS in the MSGRP RI Report. New rating curves are being developed which may change the flow estimates for these stations.
ROUX ASSOCIATES, INC. IPS1194.0001M007.157/T2a-T2j6 of 10
cfs = cubic feet per secondµg/l = micrograms per litermg/l = milligrams per literTSS = Total Suspended SolidsTKN = Total Kjeldahl NitrogenNC = Not Calculated-- = Sample not analyzed for this compoundJ = Analyte concentration is below quantitation limit, but greater than or equal to 1/2 the laboratory detection limit. Value is estimated.U = Compound or sample not detected; value shown is reporting limit* = Not yet validated
ROUX ASSOCIATES, INC. IPS1194.0001M007.157/T2a-T2j6 of 10
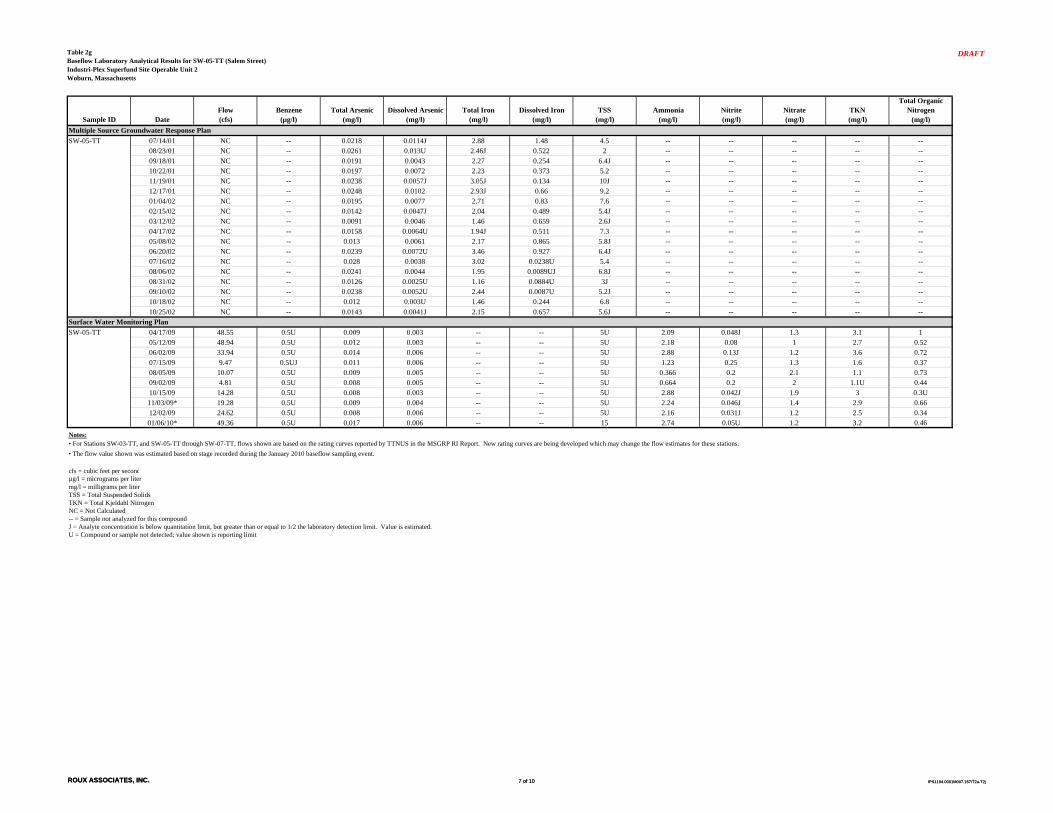
Table 2gBaseflow Laboratory Analytical Results for SW-05-TT (Salem Street)Industri-Plex Superfund Site Operable Unit 2Woburn, Massachusetts
DRAFT
Sample ID DateFlow(cfs)
Benzene(µg/l)
Total Arsenic(mg/l)
Dissolved Arsenic(mg/l)
Total Iron(mg/l)
Dissolved Iron(mg/l)
TSS(mg/l)
Ammonia(mg/l)
Nitrite(mg/l)
Nitrate(mg/l)
TKN(mg/l)
Total Organic Nitrogen
(mg/l)Multiple Source Groundwater Response PlanSW-05-TT 07/14/01 NC -- 0.0218 0.0114J 2.88 1.48 4.5 -- -- -- -- --
08/23/01 NC -- 0.0261 0.013U 2.46J 0.522 2 -- -- -- -- --09/18/01 NC -- 0.0191 0.0043 2.27 0.254 6.4J -- -- -- -- --10/22/01 NC -- 0.0197 0.0072 2.23 0.373 5.2 -- -- -- -- --11/19/01 NC -- 0.0238 0.0057J 3.05J 0.134 10J -- -- -- -- --12/17/01 NC -- 0.0248 0.0102 2.93J 0.66 9.2 -- -- -- -- --01/04/02 NC -- 0.0195 0.0077 2.71 0.83 7.6 -- -- -- -- --02/15/02 NC -- 0.0142 0.0047J 2.04 0.489 5.4J -- -- -- -- --03/12/02 NC -- 0.0091 0.0046 1.46 0.659 2.6J -- -- -- -- --04/17/02 NC -- 0.0158 0.0064U 1.94J 0.511 7.3 -- -- -- -- --05/08/02 NC -- 0.013 0.0061 2.17 0.865 5.8J -- -- -- -- --06/20/02 NC -- 0.0239 0.0072U 3.46 0.927 6.4J -- -- -- -- --07/16/02 NC -- 0.028 0.0038 3.02 0.0238U 5.4 -- -- -- -- --08/06/02 NC -- 0.0241 0.0044 1.95 0.0089UJ 6.8J -- -- -- -- --08/31/02 NC -- 0.0126 0.0025U 1.16 0.0884U 3J -- -- -- -- --09/10/02 NC -- 0.0238 0.0052U 2.44 0.0087U 5.2J -- -- -- -- --10/18/02 NC -- 0.012 0.003U 1.46 0.244 6.8 -- -- -- -- --10/25/02 NC -- 0.0143 0.0041J 2.15 0.657 5.6J -- -- -- -- --
Surface Water Monitoring PlanSW-05-TT 04/17/09 48.55 0.5U 0.009 0.003 -- -- 5U 2.09 0.048J 1.3 3.1 1
05/12/09 48.94 0.5U 0.012 0.003 -- -- 5U 2.18 0.08 1 2.7 0.52 06/02/09 33.94 0.5U 0.014 0.006 -- -- 5U 2.88 0.13J 1.2 3.6 0.7207/15/09 9.47 0.5UJ 0.011 0.006 -- -- 5U 1.23 0.25 1.3 1.6 0.3708/05/09 10.07 0.5U 0.009 0.005 -- -- 5U 0.366 0.2 2.1 1.1 0.7309/02/09 4.81 0.5U 0.008 0.005 -- -- 5U 0.664 0.2 2 1.1U 0.4410/15/09 14.28 0.5U 0.008 0.003 -- -- 5U 2.88 0.042J 1.9 3 0.3U11/03/09* 19.28 0.5U 0.009 0.004 -- -- 5U 2.24 0.046J 1.4 2.9 0.6612/02/09 24.62 0.5U 0.008 0.006 -- -- 5U 2.16 0.031J 1.2 2.5 0.3401/06/10* 49.36 0.5U 0.017 0.006 -- -- 15 2.74 0.05U 1.2 3.2 0.46
Notes:
• The flow value shown was estimated based on stage recorded during the January 2010 baseflow sampling event.
cfs = cubic feet per second/l i li
• For Stations SW-03-TT, and SW-05-TT through SW-07-TT, flows shown are based on the rating curves reported by TTNUS in the MSGRP RI Report. New rating curves are being developed which may change the flow estimates for these stations.
ROUX ASSOCIATES, INC. IPS1194.0001M007.157/T2a-T2j7 of 10
µg/l = micrograms per litermg/l = milligrams per literTSS = Total Suspended SolidsTKN = Total Kjeldahl NitrogenNC = Not Calculated-- = Sample not analyzed for this compoundJ = Analyte concentration is below quantitation limit, but greater than or equal to 1/2 the laboratory detection limit. Value is estimated.U = Compound or sample not detected; value shown is reporting limit
ROUX ASSOCIATES, INC. IPS1194.0001M007.157/T2a-T2j7 of 10
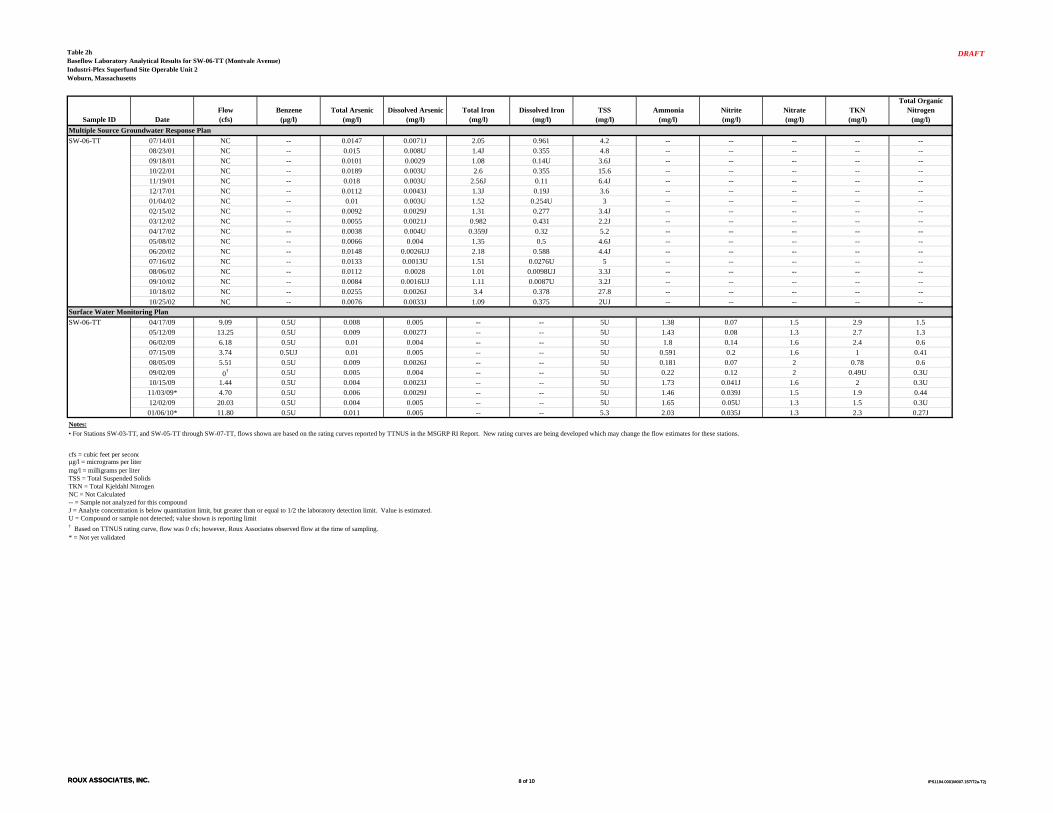
Table 2hBaseflow Laboratory Analytical Results for SW-06-TT (Montvale Avenue)Industri-Plex Superfund Site Operable Unit 2Woburn, Massachusetts
DRAFT
Sample ID DateFlow(cfs)
Benzene(µg/l)
Total Arsenic(mg/l)
Dissolved Arsenic(mg/l)
Total Iron(mg/l)
Dissolved Iron(mg/l)
TSS(mg/l)
Ammonia(mg/l)
Nitrite(mg/l)
Nitrate(mg/l)
TKN(mg/l)
Total Organic Nitrogen
(mg/l)Multiple Source Groundwater Response PlanSW-06-TT 07/14/01 NC -- 0.0147 0.0071J 2.05 0.961 4.2 -- -- -- -- --
08/23/01 NC -- 0.015 0.008U 1.4J 0.355 4.8 -- -- -- -- --09/18/01 NC -- 0.0101 0.0029 1.08 0.14U 3.6J -- -- -- -- --10/22/01 NC -- 0.0189 0.003U 2.6 0.355 15.6 -- -- -- -- --11/19/01 NC -- 0.018 0.003U 2.56J 0.11 6.4J -- -- -- -- --12/17/01 NC -- 0.0112 0.0043J 1.3J 0.19J 3.6 -- -- -- -- --01/04/02 NC -- 0.01 0.003U 1.52 0.254U 3 -- -- -- -- --02/15/02 NC -- 0.0092 0.0029J 1.31 0.277 3.4J -- -- -- -- --03/12/02 NC -- 0.0055 0.0021J 0.982 0.431 2.2J -- -- -- -- --04/17/02 NC -- 0.0038 0.004U 0.359J 0.32 5.2 -- -- -- -- --05/08/02 NC -- 0.0066 0.004 1.35 0.5 4.6J -- -- -- -- --06/20/02 NC -- 0.0148 0.0026UJ 2.18 0.588 4.4J -- -- -- -- --07/16/02 NC -- 0.0133 0.0013U 1.51 0.0276U 5 -- -- -- -- --08/06/02 NC -- 0.0112 0.0028 1.01 0.0098UJ 3.3J -- -- -- -- --09/10/02 NC -- 0.0084 0.0016UJ 1.11 0.0087U 3.2J -- -- -- -- --10/18/02 NC -- 0.0255 0.0026J 3.4 0.378 27.8 -- -- -- -- --10/25/02 NC -- 0.0076 0.0033J 1.09 0.375 2UJ -- -- -- -- --
Surface Water Monitoring PlanSW-06-TT 04/17/09 9.09 0.5U 0.008 0.005 -- -- 5U 1.38 0.07 1.5 2.9 1.5
05/12/09 13.25 0.5U 0.009 0.0027J -- -- 5U 1.43 0.08 1.3 2.7 1.3 06/02/09 6.18 0.5U 0.01 0.004 -- -- 5U 1.8 0.14 1.6 2.4 0.607/15/09 3.74 0.5UJ 0.01 0.005 -- -- 5U 0.591 0.2 1.6 1 0.4108/05/09 5.51 0.5U 0.009 0.0026J -- -- 5U 0.181 0.07 2 0.78 0.609/02/09 0† 0.5U 0.005 0.004 -- -- 5U 0.22 0.12 2 0.49U 0.3U10/15/09 1.44 0.5U 0.004 0.0023J -- -- 5U 1.73 0.041J 1.6 2 0.3U11/03/09* 4.70 0.5U 0.006 0.0029J -- -- 5U 1.46 0.039J 1.5 1.9 0.4412/02/09 20.03 0.5U 0.004 0.005 -- -- 5U 1.65 0.05U 1.3 1.5 0.3U01/06/10* 11.80 0.5U 0.011 0.005 -- -- 5.3 2.03 0.035J 1.3 2.3 0.27J
Notes:
cfs = cubic feet per secondµg/l = micrograms per litermg/l = milligrams per literTSS T t l S d d S lid
• For Stations SW-03-TT, and SW-05-TT through SW-07-TT, flows shown are based on the rating curves reported by TTNUS in the MSGRP RI Report. New rating curves are being developed which may change the flow estimates for these stations.
ROUX ASSOCIATES, INC. IPS1194.0001M007.157/T2a-T2j8 of 10
TSS = Total Suspended SolidsTKN = Total Kjeldahl NitrogenNC = Not Calculated-- = Sample not analyzed for this compoundJ = Analyte concentration is below quantitation limit, but greater than or equal to 1/2 the laboratory detection limit. Value is estimated.U = Compound or sample not detected; value shown is reporting limit† Based on TTNUS rating curve, flow was 0 cfs; however, Roux Associates observed flow at the time of sampling.* = Not yet validated
ROUX ASSOCIATES, INC. IPS1194.0001M007.157/T2a-T2j8 of 10

Table 2iBaseflow Laboratory Analytical Results for SW-07-TT (Swanton Street)Industri-Plex Superfund Site Operable Unit 2Woburn, Massachusetts
DRAFT
Sample ID DateFlow(cfs)
Benzene(µg/l)
Total Arsenic(mg/l)
Dissolved Arsenic(mg/l)
Total Iron(mg/l)
Dissolved Iron(mg/l)
TSS(mg/l)
Ammonia(mg/l)
Nitrite(mg/l)
Nitrate(mg/l)
TKN(mg/l)
Total Organic Nitrogen
(mg/l)Multiple Source Groundwater Response PlanSW-07-TT 07/14/01 NC -- 0.0094UJ 0.0045J 1.46 0.699 50 -- -- -- -- --
08/23/01 NC -- 0.0109U 0.0047U 1.01J 0.254J 4.6 -- -- -- -- --09/18/01 NC -- 0.0063 0.0015J 1.02 0.139U 2.8J -- -- -- -- --10/22/01 NC -- 0.0056J 0.003U 0.951 0.243 4U -- -- -- -- --11/19/01 NC -- 0.0047J 0.003U 0.779J 0.143 1.2J -- -- -- -- --12/17/01 NC -- 0.0053J 0.003U 1.06J 0.316J 3 -- -- -- -- --01/04/02 NC -- 0.0057J 0.003U 1.08 0.163U 2.4 -- -- -- -- --02/15/02 NC -- 0.0066 0.0024J 1.2 0.249 7.6J -- -- -- -- --03/12/02 NC -- 0.0041 0.0017U 0.887 0.331 8.4J -- -- -- -- --04/17/02 NC -- 0.0075 0.0037 1.21J 0.371 5.2 -- -- -- -- --05/08/02 NC -- 0.0061 0.0023J 1.24 0.394 7J -- -- -- -- --06/20/02 NC -- 0.0105U 0.0034UJ 1.8 0.396 10J -- -- -- -- --07/16/02 NC -- 0.0065 0.0013U 1.13 0.0229U 4 -- -- -- -- --08/06/02 NC -- 0.0083 0.0033 1.18 0.018U 3.5J -- -- -- -- --08/31/02 NC -- 0.0048J 0.0025U 0.777 0.0495U 6J -- -- -- -- --09/10/02 NC -- 0.0079U 0.0035U 1.05 0.0156UJ 2.2J -- -- -- -- --10/18/02 NC -- 0.0112 0.0036J 1.66 0.224 5.4 -- -- -- -- --10/25/02 NC -- 0.0048J 0.003U 0.978 0.373 5.2J -- -- -- -- --
Surface Water Monitoring PlanSW-07-TT 04/17/09 90.86 0.5U 0.005 0.002J -- -- 5U 0.787 0.05 1.7 1.2 0.41
05/12/09 84.97 0.5U 0.008 0.0026J -- -- 5U 0.706 0.1 1.5 1.5 0.7906/02/09 73.67 0.5U 0.008 0.005 -- -- 8 0.638 0.22 2 1.2 0.5607/15/09 29.81 0.5UJ 0.007 0.004 -- -- 5U 0.263 0.13 1.8 0.81 0.5508/05/09 29.92 0.5U 0.005 0.004 -- -- 5U 0.234 0.036J 2 1.2 0.9709/02/09 29.21 0.5U 0.004 0.003 -- -- 5U 0.209 0.07 2 0.62U 0.4110/15/09 28.47 0.5U 0.003 0.003U -- -- 5U 1.03 0.09 1.9 1.3 0.3U11/03/09* 30.32 0.5U 0.002J 0.003U -- -- 5U 0.863 0.06 1.8 1.4 0.5412/02/09 22.07 0.5U 0.004 0.003 -- -- 5U 1.11 0.032J 1.6 1.6 0.4901/06/10* 27.49 0.5U 0.006 0.0028J -- -- 5U 1.52 0.05U 1.5 1.7 0.18J
Notes:
• The flow value shown was estimated based on stage recorded during the January 2010 baseflow sampling event.
cfs = cubic feet per second
• For Stations SW-03-TT, and SW-05-TT through SW-07-TT, flows shown are based on the rating curves reported by TTNUS in the MSGRP RI Report. New rating curves are being developed which may change the flow estimates for these stations.
ROUX ASSOCIATES, INC. IPS1194.0001M007.157/T2a-T2j9 of 10
cfs = cubic feet per secondµg/l = micrograms per litermg/l = milligrams per literTSS = Total Suspended SolidsTKN = Total Kjeldahl NitrogenNC = Not Calculated-- = Sample not analyzed for this compoundU = Compound or sample not detected; value shown is reporting limitJ = Analyte concentration is below quantitation limit, but greater than or equal to 1/2 the laboratory detection limit. Value is estimated.* = Not yet validated
ROUX ASSOCIATES, INC. IPS1194.0001M007.157/T2a-T2j9 of 10

Table 2jBaseflow Laboratory Analytical Results for SW-08-TT (USGS / Mystic Avenue)Industri-Plex Superfund Site Operable Unit 2Woburn, Massachusetts
DRAFT
Sample ID DateFlow(cfs)
Benzene(µg/l)
Total Arsenic(mg/l)
Dissolved Arsenic(mg/l)
Total Iron(mg/l)
Dissolved Iron(mg/l)
TSS(mg/l)
Ammonia(mg/l)
Nitrite(mg/l)
Nitrate(mg/l)
TKN(mg/l)
Total Organic Nitrogen
(mg/l)Multiple Source Groundwater Response PlanSW-08-TT 07/14/01 NC -- 0.006UJ 0.0022J 1.36 0.558 6.1 -- -- -- -- --
08/23/01 NC -- 0.0059U 0.005U 1J 0.258J 4.8 -- -- -- -- --09/18/01 NC -- 0.0047 0.0018J 0.696 0.234 3.8J -- -- -- -- --10/22/01 NC -- 0.0026J 0.003U 0.758 0.256 4U -- -- -- -- --11/19/01 NC -- 0.0054J 0.003U 1.57J 0.186 2.4J -- -- -- -- --12/17/01 NC -- 0.0066J 0.003J 0.77J 0.19J 2J -- -- -- -- --01/04/02 NC -- 0.0056J 0.003U 1.06 0.104U 9 -- -- -- -- --02/15/02 NC -- 0.0053J 0.0024U 0.95 0.209 3.1J -- -- -- -- --03/12/02 NC -- 0.0025J 0.0017U 0.76 0.227 7J -- -- -- -- --04/17/02 NC -- 0.0057 0.0032 1.02J 0.378 5.1 -- -- -- -- --05/08/02 NC -- 0.0034J 0.0016J 1.15 0.312 7.7J -- -- -- -- --06/20/02 NC -- 0.0048U 0.0021UJ 1.19 0.272 4J -- -- -- -- --07/16/02 NC -- 0.0052 0.0013U 1.06 0.0216U 3.3 -- -- -- -- --08/06/02 NC -- 0.0064 0.0021J 0.596 0.0206U 3.4J -- -- -- -- --09/10/02 NC -- 0.003U 0.0013U 0.896 0.0087U 2.6J -- -- -- -- --10/18/02 NC -- 0.003U 0.003U 1.52 0.469 179 -- -- -- -- --10/25/02 NC -- 0.003U 0.003U 0.868 0.34 2.5J -- -- -- -- --
Surface Water Monitoring PlanSW-08-TT 04/17/09 206.90 0.5U 0.005 0.003U -- -- 6.5 0.48 0.05 1.4 0.96 0.48
05/12/09 126.00 0.5U 0.005 0.003U -- -- 5U 0.42 0.09 1.3 1 0.58 06/02/09 108.51 0.5U 0.007 0.0026J -- -- 5U 0.528 0.14 1.7 1.1 0.5707/15/09 143.70 0.5UJ 0.005 0.003 -- -- 5U 0.186U 0.1 1.2 0.99 0.808/05/09 142.17 0.5U 0.003 0.0023J -- -- 5U 0.203 .033J 1.3 0.77 0.5709/02/09 6.39 0.5U 0.005 0.003 -- -- 5U 0.258 0.08 1.6 0.66U 0.410/15/09 8.73 0.5U 0.0028J 0.003U -- -- 5U 0.743 0.07 1.5 1.3 0.5611/03/09* 10.06 0.5U 0.0024J 0.003U -- -- 5U 0.8 0.048J 1.4 0.92 0.3U12/02/09 19.97 0.5U 0.005 0.003U -- -- 5U 0.869 0.033J 1.2 1.4 0.5301/06/10* 44.51 0.5U 0.003 0.003U -- -- 5U 0.78 0.05U 0.98 0.8 0.3U
Notes:
USGS = United States Geologic Surveycfs = cubic feet per secondµg/l = micrograms per liter
• For Stations SW-01-TT, SW-2-IP, SW-02-TT, SW-04-TT, and SW-08-TT, flows shown are based on the rating curves reported in the Quarterly Storm Flow Surface Water Monitoring Report No. 2.
ROUX ASSOCIATES, INC. 10 of 10 IPS1194.0001M007.157/T2a-T2j
mg/l = milligrams per literTSS = Total Suspended SolidsTKN = Total Kjeldahl NitrogenNC = Not Calculated-- = Sample not analyzed for this compoundU = Compound or sample not detected; value shown is reporting limitJ = Analyte concentration is below quantitation limit, but greater than or equal to 1/2 the laboratory detection limit. Value is estimated.* = Not yet validated
ROUX ASSOCIATES, INC. 10 of 10 IPS1194.0001M007.157/T2a-T2j

Table 3Relative Surface Water and Groundwater Elevations at Time of Baseflow SamplingIndustri-Plex Superfund Site Operable Unit 2Woburn, Massachusetts
DRAFT
Measuring Point1
(ft)
Staff Gage Reading
(ft)
Surface Water Elevation2
(ft)
Measuring Point3
(ft)
Depth to Water
(ft)
Groundwater Elevation2
(ft)SW-2-IP AAD 01/06/10 92.34 0.60 92.94 95.16 3.61 91.55 DownSW-3-IP BECO ROW 01/06/10 93.66 0.22 93.88 97.76 2.45 95.31 UpSW-01-TT Halls Brook 01/06/10 92.98 1.21 94.19 96.87 5.55 91.32 DownSW-02-TT HBHA Pond Outlet 01/06/10 97.77 1.37 99.14 103.88 4.59 99.29 UpSW-03-TT Aberjona 01/06/10 93.46 0.70 94.16 97.41 3.07 94.34 UpSW-05-TT Salem Street 01/06/10 93.98 1.69 95.67 98.23 1.70 96.53 UpSW-06-TT Montvale Avenue 01/21/10 92.27 2.48 94.75 98.48 3.57 94.91 UpSW-07-TT Swanton Street 01/06/10 90.11 1.14 91.25 93.87 NM NA NASW-08-TT USGS / Mystic Avenue 01/06/10 81.29 11.13 92.42 95.28 3.16 92.12 Down
Notes: 1 Reference point is base of gauge (0.00 feet)2 All elevations are relative to station-specific benchmarks and, therefore, are not comparable between stations.3 Reference point is top of casing
AAD = Atlantic Avenue DrainwayBECO ROW = Boston Edison Company right-of-wayHBHA H ll B k H ldi A
Station ID Gradient
Surface Water Groundwater
DateStation Description
ROUX ASSOCIATES, INC. IPS1194.0001M007.157/T31 of 1
HBHA = Halls Brook Holding AreaUSGS = United States Geological SurveyNA = Not applicableNM = Not measured (water frozen in piezometer)
ROUX ASSOCIATES, INC. IPS1194.0001M007.157/T31 of 1
N
SW-01-TT
SW-01-TT
SW-02-TT
SW-04-TT
ROUTE 128
MISHAWUM ROAD
MB
TA
RIG
HT-O
F-W
AY
Aberjona River
BO
STO
NED
ISO
NEASEM
EN
T
HBHA POND
HBHA WETLAND
APPROXIMATE LOCATION AND
DESIGNATION OF SURFACE WATER
MONITORING STATION
LEGEND
500 FT
Title:
Prepared for:
Compiled by: LM 7/10/09
Prepared by: CRS AS SHOWN
Project Mgr.: LM MA
File No.: IPS0114202 119407M07Project No.:
Scale:
Office:
Date: FIGURE
ROUX ASSOCIATES INC.
INDUSTRI-PLEX OU 2 SETTLING DEFENDANTS
SURFACE WATER
MONITORING STATIONS
NORTH OF ROUTE 128
SITE NAME
CITY, STATE
Environmental consulting& Management
HALLS
BROOK
N:\
PR
OJE
CT
S\I-P
LE
X\1
19401M
07\1
42\IP
S0114202.c
dr
SW-03-TT
1
SW-3-IP
SW-2-IP
DRAFT

!(
!(
!(
!(
SW-05-TT
SW-07-TT
SW-06-TT
SW-08-TT
0 2,0001,000Feet
QUADRANGLE LOCATION
³SOURCE:USGS, 1987.Reading (Massachusetts) Quadrangle1:25,000-scale Topographic Map
2LM
CRS
LM
IPS0114201
7/10/09
AS SHOWN
MA
119401M
INDUSTRI−PLEX OU 2 SETTLING DEFENDANTS
SURFACE WATER MONITORINGSTATIONS SOUTH OF ROUTE 128
ROUXROUX ASSOCIATES, INC.Environmental Consulting
& Management
FIGURE
Title:
Prepared For:
Compiled By:
Prepared By:
Project Mgr.:
File No.:
Date:
Scale:
Office:
Project: T:\GIS\I-PLEX\IPS0114201.mxd
DRAFT
DRAFT
APPENDIX A
Baseflow Sampling Box-Whisker Plots
ROUX ASSOCIATES, INC IPS1194.0001M007.157/Ap-Cv

0.004
0.006
0.008
0.01
0.012mg/L
LEGEND
Diamond indicates concentration of compound when detected in only one sample during a sampling program. Circle indicates
concentration of compound when detected in the most recent sample collected.
Line indicates concentration of compound when detected at the same concentration
25th percentile
75th percentile
50th percentile (median)
Maximum detected concentration
Range of detected concentrations
0
0.002
0.004
0.006
0.008
0.01
0.012
GSIP MSGRP Early Action SWMP
mg/L
LEGEND
Diamond indicates concentration of compound when detected in only one sample during a sampling program. Circle indicates
concentration of compound when detected in the most recent sample collected.
Line indicates concentration of compound when detected at the same concentration in two or more samples, BUT not in any other samples.
Minimum detected concentration
25th percentile
75th percentile
50th percentile (median)
Maximum detected concentration
Range of detected concentrations
ROUX ASSOCIATES, INC.

SW-2-IP DRAFT
0
0.002
0.004
0.006
0.008
GSIP MSGRP Early Action SWMP
mg/L
Dissolved Arsenic
Note: Arsenic (dissolved) was reported at 0.0068 mg/L in the only baseflow sample collected from this station during the GSIP sampling event and was not detected in any Early Action baseflow samples from this station. Samples were not collected from this station during the MSGRP sampling events.
0
0.2
0.4
0.6
0.8
1
1.2
1.4
1.6
1.8
2
GSIP MSGRP Early Action SWMP
mg/L
Nitrogen, Ammonia
Note: Samples were not analyzed for ammonia during the GSIP baseflow sampling events, and were not collected from this station during the MSGRP baseflow sampling events.
0.012
Total Arsenic Benzene
0
0.002
0.004
0.006
0.008
GSIP MSGRP Early Action SWMP
mg/L
Dissolved Arsenic
Note: Arsenic (dissolved) was reported at 0.0068 mg/L in the only baseflow sample collected from this station during the GSIP sampling event and was not detected in any Early Action baseflow samples from this station. Samples were not collected from this station during the MSGRP sampling events.
0
0.2
0.4
0.6
0.8
1
1.2
1.4
1.6
1.8
2
GSIP MSGRP Early Action SWMP
mg/L
Nitrogen, Ammonia
Note: Samples were not analyzed for ammonia during the GSIP baseflow sampling events, and were not collected from this station during the MSGRP baseflow sampling events.
0
0.002
0.004
0.006
0.008
0.01
0.012
GSIP MSGRP Early Action SWMP
mg/L
Total Arsenic
Note: Arsenic (total) was reported at 0.0098 mg/L in the only baseflow sample collected from this station during the GSIP sampling event. Samples were not collected from this station during the MSGRP sampling events.
Benzene
Note: Samples were not analyzed for benzene during the GSIP baseflow sampling events, and were not collected from this station during the MSGRP baseflow sampling events. Benzene was not detected in any Early Action or SWMP baseflow samples from this station.
ROUX ASSOCIATES, INC.

SW-3-IP DRAFT
0
0.01
0.02
0.03
0.04
0.05
0.06
0.07
0.08
0.09
GSIP MSGRP Early Action SWMP
mg/L
Dissolved Arsenic
Note: Baseflow samples were not collected from this station during the GSIP and MSGRP sampling events.
0
5
10
15
20
25
30
35
GSIP MSGRP Early Action SWMP
mg/L
Nitrogen, Ammonia
Note: Baseflow samples were not collected from this station during the GSIP and MSGRP sampling events.
0.45
Total Arsenic
4
Benzene
0
0.01
0.02
0.03
0.04
0.05
0.06
0.07
0.08
0.09
GSIP MSGRP Early Action SWMP
mg/L
Dissolved Arsenic
Note: Baseflow samples were not collected from this station during the GSIP and MSGRP sampling events.
0
5
10
15
20
25
30
35
GSIP MSGRP Early Action SWMP
mg/L
Nitrogen, Ammonia
Note: Baseflow samples were not collected from this station during the GSIP and MSGRP sampling events.
0
0.05
0.1
0.15
0.2
0.25
0.3
0.35
0.4
0.45
GSIP MSGRP Early Action SWMP
mg/L
Total Arsenic
Note: Baseflow samples were not collected from this station during the GSIP and MSGRP sampling events.
0
0.5
1
1.5
2
2.5
3
3.5
4
GSIP MSGRP Early Action SWMP
µg/L
Benzene
Note: Baseflow samples were not collected from this station during the GSIP and MSGRP sampling events. Benzene was detected at 1.3 µg/L in one SWMP baseflow sample from this station.
ROUX ASSOCIATES, INC.

SW-01-TT DRAFT
0
0.001
0.002
0.003
0.004
0.005
0.006
0.007
0.008
GSIP MSGRP Early Action SWMP
mg/L
Dissolved Arsenic
Note: Arsenic (dissolved) was not detected in any GSIP baseflow samples from this station. Arsenic (dissolved) was detected at 0.005 mg/L in one Early Action baseflow sample from this station.
0
1
2
3
4
5
6
GSIP MSGRP Early Action SWMP
mg/L
Nitrogen, Ammonia
Note: Samples were not analyzed for ammonia during the GSIP and MSGRP sampling events.
0.006
Total ArsenicNote: Arsenic (total) was detected at 0.0036 mg/L in one GSIP baseflow sample
Benzene
0
0.001
0.002
0.003
0.004
0.005
0.006
0.007
0.008
GSIP MSGRP Early Action SWMP
mg/L
Dissolved Arsenic
Note: Arsenic (dissolved) was not detected in any GSIP baseflow samples from this station. Arsenic (dissolved) was detected at 0.005 mg/L in one Early Action baseflow sample from this station.
0
1
2
3
4
5
6
GSIP MSGRP Early Action SWMP
mg/L
Nitrogen, Ammonia
Note: Samples were not analyzed for ammonia during the GSIP and MSGRP sampling events.
0
0.001
0.002
0.003
0.004
0.005
0.006
GSIP MSGRP Early Action SWMP
mg/L
Total ArsenicNote: Arsenic (total) was detected at 0.0036 mg/L in one GSIP baseflow sample from this station, and at 0.005 mg/L in one Early Action baseflow sample from this station.
Benzene
Note: Samples were not analyzed for benzene during the GSIP and MSGRP sampling events, and benzene was not detected in any Early Action or SWMP baseflow samples from this station.
ROUX ASSOCIATES, INC.

SW-02-TT (GSIP SW-4) DRAFT
0
0.002
0.004
0.006
0.008
0.01
0.012
GSIP MSGRP Early Action SWMP
mg/L
Dissolved Arsenic
Note: Arsenic (dissolved) was detected at 0.0112mg/L in one GSIP baseflow sample collected from this station.
0
2
4
6
8
10
GSIP MSGRP Early Action SWMP
mg/L
Nitrogen, Ammonia
Note: Samples were not analyzed for ammonia during the GSIP and MSGRP sampling events.
0.05
Total Arsenic
1
Benzene
Note: Samples were not
0
0.002
0.004
0.006
0.008
0.01
0.012
GSIP MSGRP Early Action SWMP
mg/L
Dissolved Arsenic
Note: Arsenic (dissolved) was detected at 0.0112mg/L in one GSIP baseflow sample collected from this station.
0
2
4
6
8
10
GSIP MSGRP Early Action SWMP
mg/L
Nitrogen, Ammonia
Note: Samples were not analyzed for ammonia during the GSIP and MSGRP sampling events.
0
0.005
0.01
0.015
0.02
0.025
0.03
0.035
0.04
0.045
0.05
GSIP MSGRP Early Action SWMP
mg/L
Total Arsenic
0
0.1
0.2
0.3
0.4
0.5
0.6
0.7
0.8
0.9
1
GSIP MSGRP Early Action SWMP
µg/L
Benzene
Note: Samples were not analyzed for benzene during the GSIP and MSGRP sampling events.
ROUX ASSOCIATES, INC.

SW-04-TT (GSIP SW-9) DRAFT
0
0.002
0.004
0.006
0.008
0.01
0.012
0.014
0.016
GSIP MSGRP Early Action SWMP
mg/L
Dissolved Arsenic
0
2
4
6
8
10
GSIP MSGRP Early Action SWMP
mg/L
Nitrogen, Ammonia
Note: Samples were not analyzed for ammonia during the GSIP and MSGRP sampling events.
0.18
Total Arsenic
0.5
Benzene
0
0.002
0.004
0.006
0.008
0.01
0.012
0.014
0.016
GSIP MSGRP Early Action SWMP
mg/L
Dissolved Arsenic
0
2
4
6
8
10
GSIP MSGRP Early Action SWMP
mg/L
Nitrogen, Ammonia
Note: Samples were not analyzed for ammonia during the GSIP and MSGRP sampling events.
0
0.02
0.04
0.06
0.08
0.1
0.12
0.14
0.16
0.18
GSIP MSGRP Early Action SWMP
mg/L
Total Arsenic
0
0.05
0.1
0.15
0.2
0.25
0.3
0.35
0.4
0.45
0.5
GSIP MSGRP Early Action SWMP
µg/L
Benzene
Note: Samples were not analyzed for benzene during the GSIP and MSGRP sampling events. Benzene was detected at 0.46 µg/L in one Early Action baseflow sample from this station.
ROUX ASSOCIATES, INC.

SW-03-TT DRAFT
0
0.005
0.01
0.015
0.02
0.025
0.03
GSIP MSGRP Early Action SWMP
mg/L
Dissolved Arsenic
Note: Samples were not collected from this station during the GSIP and Early Action sampling events.
0
0.5
1
1.5
2
2.5
3
GSIP MSGRP Early Action SWMP
mg/L
Nitrogen, Ammonia
Note: Samples were not collected from this station during the GSIP and Early Action sampling events, and were not analyzed for ammonia during the MSGRP sampling events.
0.04
Total Arsenic
Note: Samples were not collected from thi t ti d i th GSIP d E l
0
0.005
0.01
0.015
0.02
0.025
0.03
GSIP MSGRP Early Action SWMP
mg/L
Dissolved Arsenic
Note: Samples were not collected from this station during the GSIP and Early Action sampling events.
0
0.5
1
1.5
2
2.5
3
GSIP MSGRP Early Action SWMP
mg/L
Nitrogen, Ammonia
Note: Samples were not collected from this station during the GSIP and Early Action sampling events, and were not analyzed for ammonia during the MSGRP sampling events.
0
0.005
0.01
0.015
0.02
0.025
0.03
0.035
0.04
GSIP MSGRP Early Action SWMP
mg/L
Total Arsenic
Note: Samples were not collected from this station during the GSIP and Early Action sampling events.
Note: Samples were not collected from this station during the GSIP and Early Action sampling events, and were not analyzed for benzene during the MSGRP sampling events. Benzene was not detected in any SWMP baseflow samples collected from this station.
ROUX ASSOCIATES, INC.

SW-05-TT DRAFT
0
0.002
0.004
0.006
0.008
0.01
0.012
GSIP MSGRP Early Action SWMP
mg/L
Dissolved Arsenic
Note: Samples were not collected from this station during the GSIP and Early Action sampling events.
0
0.5
1
1.5
2
2.5
3
3.5
GSIP MSGRP Early Action SWMP
mg/L
Nitrogen, Ammonia
Note: Samples were not collected from this station during the GSIP and Early Action sampling events, and were not analyzed for ammonia during the MSGRP sampling events.
0.03
Total Arsenic
Note: Samples were not collected
0
0.002
0.004
0.006
0.008
0.01
0.012
GSIP MSGRP Early Action SWMP
mg/L
Dissolved Arsenic
Note: Samples were not collected from this station during the GSIP and Early Action sampling events.
0
0.5
1
1.5
2
2.5
3
3.5
GSIP MSGRP Early Action SWMP
mg/L
Nitrogen, Ammonia
Note: Samples were not collected from this station during the GSIP and Early Action sampling events, and were not analyzed for ammonia during the MSGRP sampling events.
0
0.005
0.01
0.015
0.02
0.025
0.03
GSIP MSGRP Early Action SWMP
mg/L
Total Arsenic
Note: Samples were not collected from this station during the GSIP and Early Action sampling events.
Note: Samples were not collected from this station during the GSIP and Early Action sampling events, and were not analyzed for benzene during the MSGRP sampling events. Benzene was not detected in any SWMP baseflow samples from this station.
ROUX ASSOCIATES, INC.

SW-06-TT DRAFT
0
0.001
0.002
0.003
0.004
0.005
0.006
0.007
0.008
GSIP MSGRP Early Action SWMP
mg/L
Dissolved Arsenic
Note: Samples were not collected from this station during the GSIP and Early Action sampling events.
0
0.5
1
1.5
2
2.5
GSIP MSGRP Early Action SWMP
mg/L
Nitrogen, Ammonia
Note: Samples were not collected from this station during the GSIP and Early Action sampling events, and were not analyzed for ammonia during the MSGRP sampling events.
0.02
Total Arsenic
Note: Samples were not collected f thi t ti d i th GSIP d
0
0.001
0.002
0.003
0.004
0.005
0.006
0.007
0.008
GSIP MSGRP Early Action SWMP
mg/L
Dissolved Arsenic
Note: Samples were not collected from this station during the GSIP and Early Action sampling events.
0
0.5
1
1.5
2
2.5
GSIP MSGRP Early Action SWMP
mg/L
Nitrogen, Ammonia
Note: Samples were not collected from this station during the GSIP and Early Action sampling events, and were not analyzed for ammonia during the MSGRP sampling events.
0
0.002
0.004
0.006
0.008
0.01
0.012
0.014
0.016
0.018
0.02
GSIP MSGRP Early Action SWMP
mg/L
Total Arsenic
Note: Samples were not collected from this station during the GSIP and Early Action sampling events.
Note: Samples were not collected from this station during the GSIP and Early Action sampling events, and were not analyzed for benzene during the MSGRP sampling events. Benzene was not detected in any SWMP baseflow samples from this station.
ROUX ASSOCIATES, INC.

SW-07-TT DRAFT
0
0.001
0.002
0.003
0.004
0.005
0.006
GSIP MSGRP Early Action SWMP
mg/L
Dissolved Arsenic
Note: Samples were not collected from this station during the GSIP and Early Action sampling events.
0
0.2
0.4
0.6
0.8
1
1.2
1.4
1.6
GSIP MSGRP Early Action SWMP
mg/L
Nitrogen, Ammonia
Note: Samples were not collected from this station during the GSIP and Early Action sampling events, and were not analyzed for ammonia during the MSGRP sampling events.
0.009
Total Arsenic
0
0.001
0.002
0.003
0.004
0.005
0.006
GSIP MSGRP Early Action SWMP
mg/L
Dissolved Arsenic
Note: Samples were not collected from this station during the GSIP and Early Action sampling events.
0
0.2
0.4
0.6
0.8
1
1.2
1.4
1.6
GSIP MSGRP Early Action SWMP
mg/L
Nitrogen, Ammonia
Note: Samples were not collected from this station during the GSIP and Early Action sampling events, and were not analyzed for ammonia during the MSGRP sampling events.
0
0.001
0.002
0.003
0.004
0.005
0.006
0.007
0.008
0.009
GSIP MSGRP Early Action SWMP
mg/L
Total Arsenic
Note: Samples were not collected from this station during the GSIP and Early Action sampling events.
Note: Samples were not collected from this station during the GSIP and Early Action sampling events. Samples were not analyzed for benzene during the MSGRP sampling events. Benzene was not detected in any SWMP baseflow samples from this station.
ROUX ASSOCIATES, INC.
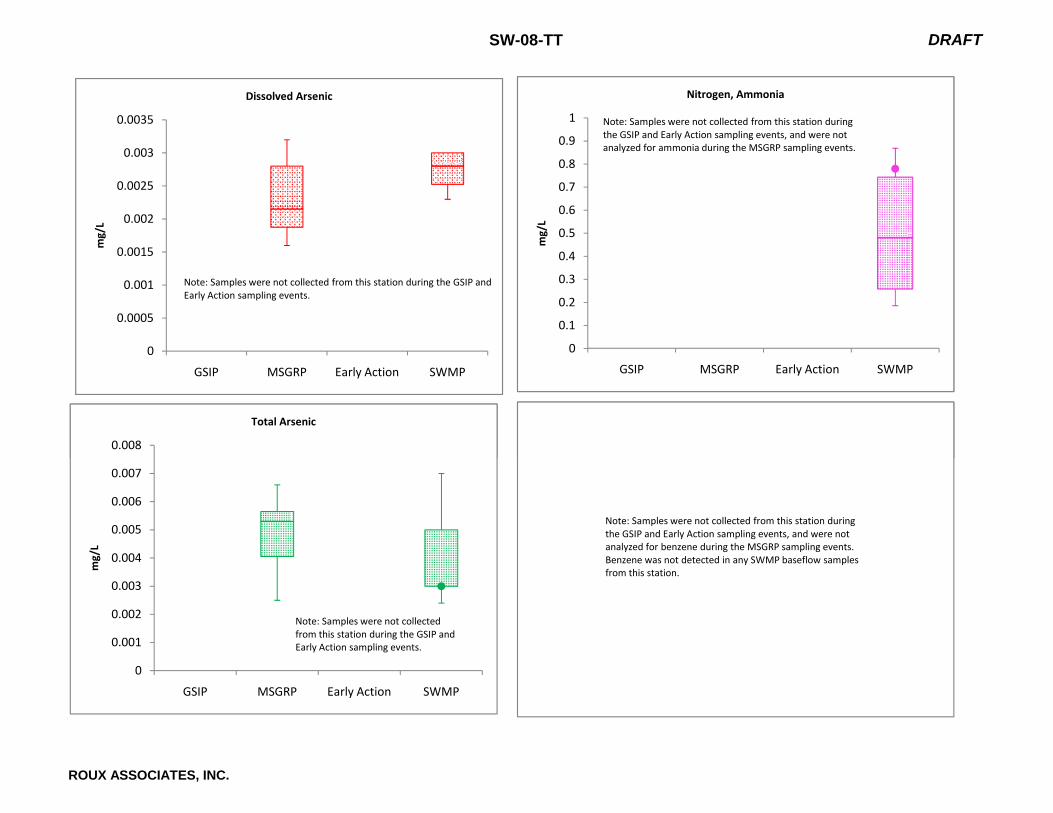
SW-08-TT DRAFT
0
0.0005
0.001
0.0015
0.002
0.0025
0.003
0.0035
GSIP MSGRP Early Action SWMP
mg/L
Dissolved Arsenic
Note: Samples were not collected from this station during the GSIP and Early Action sampling events.
0
0.1
0.2
0.3
0.4
0.5
0.6
0.7
0.8
0.9
1
GSIP MSGRP Early Action SWMP
mg/L
Nitrogen, Ammonia
Note: Samples were not collected from this station during the GSIP and Early Action sampling events, and were not analyzed for ammonia during the MSGRP sampling events.
0.008
Total Arsenic
0
0.0005
0.001
0.0015
0.002
0.0025
0.003
0.0035
GSIP MSGRP Early Action SWMP
mg/L
Dissolved Arsenic
Note: Samples were not collected from this station during the GSIP and Early Action sampling events.
0
0.1
0.2
0.3
0.4
0.5
0.6
0.7
0.8
0.9
1
GSIP MSGRP Early Action SWMP
mg/L
Nitrogen, Ammonia
Note: Samples were not collected from this station during the GSIP and Early Action sampling events, and were not analyzed for ammonia during the MSGRP sampling events.
0
0.001
0.002
0.003
0.004
0.005
0.006
0.007
0.008
GSIP MSGRP Early Action SWMP
mg/L
Total Arsenic
Note: Samples were not collected from this station during the GSIP and Early Action sampling events.
Note: Samples were not collected from this station during the GSIP and Early Action sampling events, and were not analyzed for benzene during the MSGRP sampling events. Benzene was not detected in any SWMP baseflow samples from this station.
ROUX ASSOCIATES, INC.
Recommended