www.elsevier.com/locate/ijresmar
Intern. J. of Research in Marketing 20 (2003) 153–175
Customer satisfaction and loyalty in online and
offline environments
Venkatesh Shankara,*, Amy K. Smithb,1, Arvind Rangaswamyc,2
aRobert H. Smith School of Business, University of Maryland, College Park, MD 20742, USAbGeorge Washington University, School of Business and Public Management, Washington, DC 20052, USA
cThe Smeal College of Business, Penn State University, University Park, PA 16802, USA
Received 14 November 2000; received in revised form 8 November 2002; accepted 14 November 2002
Abstract
We address the following questions that are becoming increasingly important to managers in service industries: Are the
levels of customer satisfaction and loyalty for the same service different when customers choose the service online versus
offline? If yes, what factors might explain these differences? How is the relationship between customer satisfaction and loyalty
in the online environment different from that in the offline environment? We propose a conceptual framework and develop
hypotheses about the effects of the online medium on customer satisfaction and loyalty and on the relationships between
satisfaction and loyalty. We test the hypotheses through a simultaneous equation model using two data sets of online and offline
customers of the lodging industry. The results are somewhat counterintuitive in that they show that whereas the levels of
customer satisfaction for a service chosen online is the same as when it is chosen offline, loyalty to the service provider is higher
when the service is chosen online than offline. We also find that loyalty and satisfaction have a reciprocal relationship such that
each positively reinforces the other, and this relationship between overall satisfaction and loyalty is further strengthened online.
D 2003 Elsevier Science B.V. All rights reserved.
Keywords: Online markets; Satisfaction; Loyalty; Services, Internet; E-Commerce
1. Introduction the levels of satisfaction and loyalty in the online
The rapid growth of online transactions in service
industries raises important research questions about
0167-8116/03/$ - see front matter D 2003 Elsevier Science B.V. All right
doi:10.1016/S0167-8116(03)00016-8
* Corresponding author. Tel.: +1-301-405-2175; fax: +1-301-
405-0146.
E-mail addresses: [email protected] (V. Shankar),
[email protected] (A.K. Smith), [email protected]
(A. Rangaswamy).1 Assistant Professor of Marketing. Tel.: +1-202-994-0903; fax:
+1-202-994-8999.2 Jonas H. Anchel Professor of Marketing. Tel.: +1-814-865-
1907; fax: +1-814-865-3015.
environment, and the relationship between satisfaction
and loyalty online relative to offline. Compared to the
offline environment, the online environment offers
more opportunities for interactive and personalized
marketing (Wind and Rangaswamy, 2001). These
opportunities may influence customer satisfaction
and loyalty differently in the online environment
vis-a-vis the offline environment.
Managers are concerned about how the online
medium influences satisfaction and loyalty and the
relationship between satisfaction and loyalty. Typi-
cally, online customers can more easily compare
s reserved.

V. Shankar et al. / Intern. J. of Research in Marketing 20 (2003) 153–175154
alternatives than offline customers, especially for
functional products and services. A competing offer
is just a few clicks away on the Internet. Because of
these properties of the Web, many managers fear that
the online medium may induce lower customer sat-
isfaction and loyalty compared to the offline medium,
and that increased satisfaction with a service may not
lead to higher loyalty when that service is chosen
online.
Some recent studies show that there may be sys-
tematic differences in customer attitudes and behavior
for products and services chosen online versus off-
line. For example, price sensitivity may actually be
lower online than offline (e.g., Degeratu, Rangasw-
amy, & Wu, 2000; Lynch & Ariely, 2000; Shankar,
Rangaswamy, & Pusateri, 2001). Brand names (brand
equity) could also have higher impact online than
offline (Degeratu et al., 2000). Collectively, these
studies suggest that a priori, customer satisfaction
and loyalty for services may be different online
(compared to offline), and not necessarily lower
online. However, we do not know of any academic
research that has carefully explored whether the
online medium positively or negatively impacts cus-
tomer satisfaction and loyalty (other things equal) and
why.
Satisfaction and loyalty are not surrogates for each
other (Bloemer & Kasper, 1995; Oliver, 1999). It is
possible for a customer to be loyal without being
highly satisfied (e.g., when there are few other
choices) and to be highly satisfied and yet not be
loyal (e.g., when many alternatives are available).
Firms need to gain a better understanding of the
relationship between satisfaction and loyalty in the
online environment to allocate their online marketing
efforts between satisfaction initiatives and loyalty
programs. If, for example, the firm finds that loyalty
is associated with increased satisfaction, it could
directly focus on enhancing its loyalty programs.
In this paper, we address the following questions:
(1) For a given service, other things equal, are the
levels of customer satisfaction and loyalty different
when the service is chosen online as compared to
offline? If yes, what factors might explain these
differences? (2) Is the relationship between satisfac-
tion and loyalty stronger or weaker online compared
to the offline environment? To answer these questions,
we develop a set of hypotheses based on a conceptual
framework. To test the hypotheses, we formulate
simultaneous equation models and estimate them
using data from two sets of online and offline samples
in the lodging sector of the travel industry. An
important characteristic of industries such as online
travel, entertainment (e.g., movie, theater, and concert
tickets), and restaurant is that regardless of whether
customers choose the service provider online or off-
line, the actual service is experienced by the customer
offline. This characteristic enables us to isolate the
effects of the medium on satisfaction, separate from
the effects of service attributes.
Prior research studies on satisfaction and loyalty
have primarily been conducted in the offline environ-
ment. We extend previous research in many ways.
First, to our knowledge, ours is the first empirical
study to compare the effects of the medium (online
versus offline) on customer satisfaction, loyalty, and
the relationship between satisfaction and loyalty. Sec-
ond, we study the reciprocal relationship between
customer satisfaction and loyalty that offers the poten-
tial for deeper insights into the nature of the relation-
ship between these constructs. We also empirically
test this reciprocal relationship. Much prior research
has focused on the impact of customer satisfaction on
loyalty, but not vice-versa. Third, unlike previous
studies that have generally focused on action/behav-
ioral loyalty, we focus explicitly on attitudinal loyalty
to the service provider. Attitudinal loyalty is similar to
affective/conative loyalty proposed by Oliver (1999)
and represents a higher-order, or long-term, commit-
ment of a customer to the organization, which cannot
be inferred by merely observing customer repeat
purchase behavior. Customer retention can occur
without attitudinal loyalty, if for example, the custom-
ers are indifferent, or there are no other viable choices
in the market.
2. Conceptual framework and research hypotheses
Consistent with Oliver (1999), we define satisfac-
tion as the perception of pleasurable fulfillment of a
service, and loyalty as deep commitment to the
service provider. We focus on attitudinal loyalty,
rather than on behavioral loyalty (Day, 1969; Dick
& Basu, 1994) for the following reasons. A behav-
iorally loyal customer may be spuriously loyal, that is,

V. Shankar et al. / Intern. J. of Research in Marketing 20 (2003) 153–175 155
stay with an organization or service provider until he/
she can find some better alternative in the marketplace
(Dick & Basu, 1994). An attitudinally loyal customer,
on the other hand, has some attachment or commit-
ment to the organization and is not easily swayed by a
slightly more attractive alternative. Attitudinal loyalty
not only indicates higher repurchase intent, but also
resistance to counter-persuasion, resistance to adverse
expert opinion, willingness to pay a price premium,
and willingness to recommend the service provider to
others.
We selected the travel industry as the context for
our study for three reasons: (1) Although people can
make travel choices (reservations) online, they still
have to experience the service offline. Therefore, the
actual service encounter itself is no different if the
same service provider and service options are chosen
online or offline. (2) The travel industry is one of the
largest industries online and has had a relatively long
history of online presence. Thus, many people are
comfortable making travel choices online. (3) People
make travel choices both online and offline, as com-
pared to a pure online service provider like Yahoo,
which has no direct offline equivalent. This allows us
Fig. 1. Conceptual model of the online medium and the re
to compare online satisfaction and loyalty with offline
satisfaction and loyalty for the same service.
We develop hypotheses about the effects of con-
structs focal to our research, namely, the direct effect
of the online medium on service encounter satisfac-
tion, overall satisfaction, and loyalty. We also develop
hypotheses about the relationship between satisfac-
tion and loyalty and the differential effects of various
factors such as ease of obtaining information and
frequency of use, online relative to offline. In devel-
oping the hypotheses, we primarily draw upon behav-
ioral decision theory that examines tradeoffs between
cognitive effort deployed and the quality or accuracy
of the decisions (choices) that consumers make
(Johnson & Payne, 1985; Johnson, Bellman, &
Lohse, 2002). We also predict the effects of control
variables such as website factors, service attributes,
and prior experience with the service, on satisfaction
and loyalty.
Fig. 1 summarizes the conceptual model of how
the online medium influences customer satisfaction
and loyalty. The figure includes the focal constructs as
well as control variables. Our main thesis is that
satisfaction, loyalty and their relationship differ online
lationship between customer satisfaction and loyalty.

Table 1
Selected empirical research on determinants of customer satisfaction
(offline)
Independent variable Key references Context
Ease of obtaining
information
Oliva et al. (1992) General electric
supply
Frequency of use Bolton and
Lemon (1999)
Television
entertainment and
cellular phone
service
Vredenburg and
Wee (1986)
Autos
Attribute-level
performance
Bearden and
Teel (1983)
Auto repair service
Bolton and
Drew (1991)
Telephone service
Mittal et al. (1998) Health care and
automobiles
Oliva et al. (1992) General electric
supply
Oliver (1993) Autos and academic
course
Spreng et al. (1996) Camcorders
Meuter et al. (2000) Self-service
technologies
Prior experience Bolton and
Drew (1991)
Telephone service
Cadotte, Woodruff,
and Jenkins (1987)
Restaurant dining
Vredenburg and
Wee (1986)
Autos
V. Shankar et al. / Intern. J. of Research in Marketing 20 (2003) 153–175156
from offline because the same customers could make
different choices online versus offline in the same
decision situation. We now describe each of the
constructs used in the study.
2.1. Drivers of customer satisfaction
We examine two types of customer satisfaction,
namely, service encounter satisfaction and overall
customer satisfaction. Service encounter satisfaction
is transaction-specific, whereas overall customer sat-
isfaction is relationship-specific, that is, overall sat-
isfaction is the cumulative effect of a set of discrete
service encounters or transactions with the service
provider over a period of time (Bitner & Hubbert,
1994; Oliver, 1997; Rust & Oliver, 1994). Although
these two types of satisfaction are related, it is
important to recognize them as distinct constructs
because some of the factors influencing them may
be different. For example, service encounter satisfac-
tion is more likely to depend on performance on
specific attributes of the service encounter (e.g., Was
the price consistent with expectation?), whereas over-
all satisfaction is more likely to depend on factors that
occur across transactions (e.g., Is it easy to shop for
this service?).
Table 1 summarizes several previous studies of the
determinants of customer satisfaction. Based on these
studies, we expect that customer satisfaction may be
influenced by service provider performance on vari-
ous service attributes (e.g., location of a hotel and its
reputation), customers’ prior experience with the
service, their frequency of service use, disconfirma-
tion of time spent choosing a service (e.g., whether it
took longer or shorter than expected to make a
choice), and ease of obtaining information about the
service. We also argue, for reasons discussed below,
that loyalty to the service provider also impacts
customer satisfaction. These factors should apply to
both online and offline environments. Below, we
elaborate on each of the factors affecting customer
satisfaction.
2.1.1. Focal constructs
2.1.1.1. Direct (main) effect of the online medium
(+). The online medium has several distinctive fea-
tures that may directly impact both service encounter
satisfaction and overall satisfaction. There are several
reasons why the online medium influences customer
satisfaction in a different way than the offline medium.. Similar to other self-service technologies (SST),
the online medium could improve the shopping proc-
ess by enabling customers to sort (e.g., sort hotel
rooms by price, miles from nearest airport, etc.) and
group information (e.g., categorize hotels by quality
rating), by increasing the number of options available
(e.g., number of different hotels available near a given
location), and by enabling customers to access peer
opinions and ratings (Meuter, Ostrom, Roundtree, &
Bitner, 2000). Thus it is likely that, for the same
customer, online and offline decisions take place
under different sets of information. Potentially, there
is more information available online. With more
available information, customers are likely to devote
more cognitive effort to their decision processes be-
cause they can see the potential for realizing addi-

V. Shankar et al. / Intern. J. of Research in Marketing 20 (2003) 153–175 157
tional benefits (e.g., more informed or improved
choices; lower prices) through additional effort (John-
son & Payne, 1985). Additional information (possibly
in conjunction with more effort) will improve the
quality of the choices that customers make, which in
turn, is likely to result in a service experience that
delivers higher satisfaction when the choices are made
online than offline.. The online shopping experience could also alter
customer expectations about the services—if they
have more information (including visual information)
beforehand, they know what type of service they will
get and are less likely to be surprised or angry at the
service received, than when they make a choice off-
line. This suggests less disconfirmation with expect-
ations (i.e., lower positive or negative disconfirma-
tion), which should also result in greater satisfaction
than when the choice is made offline.. It is also possible that the online environment
could decrease satisfaction because of the perceived
lack of privacy and financial security, perceived lack
of human contact, failure of technology, and poor
design of interface (Meuter et al., 2000).
The direct effect of the online medium on customer
satisfaction would depend on the net effect of these
sources of satisfaction and dissatisfaction and is an
empirical issue. However, we offer the following
hypotheses a priori as our best judgments of the
directionality of the combined effects of the medium
on satisfaction.
H1a: Customers who choose a service online are more
likely to have a higher level of service encounter sa-
tisfaction than those who choose offline.
H1b: Customers who choose a service online are more
likely to have a higher level of overall satisfaction
than those who choose offline.
2.1.1.2. Loyalty (+). A loyal customer is more likely
to find the service encounter and the overall experi-
ence with a service provider more satisfying than a
nonloyal customer. Although previous research has
not viewed loyalty as an explanatory variable of
satisfaction, prospect theory (Kahneman & Tversky,
1979) offers a rationale for why loyal customers may
be more satisfied than nonloyal customers (see also,
Mittal, Ross, & Baldasare, 1998). According to this
theory, losses loom larger than gains. In the context of
the relationship between loyalty and satisfaction, this
theory suggests that if loyal customers have a negative
experience and become dissatisfied with a service
provider, then they might gain by switching to a
new provider. However, by switching they will incur
loss in the form of loyalty benefits (e.g., emotional
loss, rewards program) or face a potentially unfamiliar
service encounter. Compared to nonloyal customers,
loyal customers may perceive the loss to be larger
than the short-term gain of moving to a new service
provider. Research reported by Ahluwalia, Unnava,
and Burnkrant (1999) provides further support for the
loyalty–satisfaction relationship. They find that loyal
customers are much less susceptible to negative infor-
mation about a product than are nonloyal customers.
With respect to online customers, they recognize
that they have chosen their favored service provider
even when confronted with a large number of other
options that were just a click away. Thus, they may
feel partly responsible if the chosen service does not
fully live up to their expectations, thereby mitigating
the impact of dissatisfying experiences. Finally, some
website features (e.g., information on related services,
better use of rewards, and personalization) allow loyal
online shoppers to derive greater utility and be more
satisfied, as compared to shopping through the offline
medium which offers limited pre-consumption inter-
actions with the service provider. Taken together,
these arguments lead to the following hypotheses.
H2a: The positive effect of loyalty on service
encounter satisfaction with that service provider is
greater for customers who choose online than it is for
those who choose offline.
H2b: The positive effect of loyalty on overall
satisfaction with that service provider is greater for
customers who choose online than it is for those who
choose offline.
2.1.1.3. Ease of obtaining information (+). Overall
customer satisfaction may also depend on the ease
with which information relevant to a particular cus-
tomer can be obtained while choosing the service
provider (Oliva, Oliver, & MacMillan, 1992). With
more relevant information, customers make better
decisions leading to higher satisfaction. Easier access
to information also typically increases customer sat-
isfaction with the shopping process (unless there is
V. Shankar et al. / Intern. J. of Research in Marketing 20 (2003) 153–175158
information overload), which could increase overall
customer satisfaction with the service—i.e., there
could be some carryover of (dis)satisfaction with the
shopping process to (dis)satisfaction with the service
provider.
The online medium could further enhance the
positive effect of information access on overall sat-
isfaction by making the information obtained more
actionable in influencing choice (for example, the
information could contain direct links to specific hotel
properties), thus involving less cognitive effort online
than offline. Also, for such services as hotels, which
have a large number of search attributes (e.g., location,
price, type of bed), it is easier to obtain information
online than offline. For comparable levels of informa-
tion access and use, the lower effort deployed online is
likely to lead to greater satisfaction online than offline
(Johnson & Payne, 1985; Meuter et al., 2000). These
arguments suggest the following hypothesis.
H3: The positive effect of ease of obtaining in-
formation on overall customer satisfaction for a
service provider is higher for customers who choose
the service online than it is for those who choose
offline.
2.1.1.4. Frequency of service use (+/�). Usage
frequency may impact both service encounter satis-
faction and overall satisfaction (Bolton & Lemon,
1999; Vredenburg & Wee, 1986). Arguments can be
made for both a positive and a negative relationship
between usage frequency and satisfaction. Supporting
a positive relationship is the argument that if custom-
ers use a service often, the repeated exposure to
favorable service encounters may continually lead to
higher satisfaction. Supporting a negative relationship
is the concept of expectation-performance. When
customers use a service often, they start to treat the
benefits of the service as a given and expect additional
benefits from the service provider overall, and in each
service encounter. The raised expectations may lead to
lower satisfaction. Prior studies have more commonly
reported negative effects than positive effects.
The online medium could dampen this negative
effect of usage frequency on overall satisfaction.
Because the online medium generates expectations
that are more consistent with the actual service levels
(e.g., the availability of room views and other relevant
information while choosing a hotel), it mitigates
problems associated with frequent users having higher
expectations, and therefore, being potentially less
satisfied with the service provider. These consistent
expectations also lower the mental costs of online
choices, improving both utility and satisfaction (John-
son & Payne, 1985). These arguments lead to the
following hypothesis.
H4: The negative effect of frequency of use on overall
customer satisfaction for a service provider is lower
for customers who choose the service online than it is
for those who choose offline.
2.1.2. Control variables
2.1.2.1. Service attribute performance (+/�). The
actual performance on various service attributes that a
customer experiences during a service encounter
influences customer satisfaction with that service
(Bearden & Teel, 1983; Bolton & Drew, 1991; Mittal
et al., 1998; Oliva et al., 1992; Oliver, 1993; Spreng,
MacKenzie, & Olshavsky, 1996). Because the actual
service levels may vary from one service encounter to
another, we do not expect transaction-specific service
attribute ratings to directly influence overall customer
satisfaction, but we expect them to have an indirect
effect on overall satisfaction through service encoun-
ter satisfaction. Attribute-level performance can influ-
ence satisfaction either positively or negatively. For
example, the better the room amenities relative to
customers’ expectations the higher their satisfaction,
whereas the higher the price relative to customers’
expectations the lower their satisfaction.
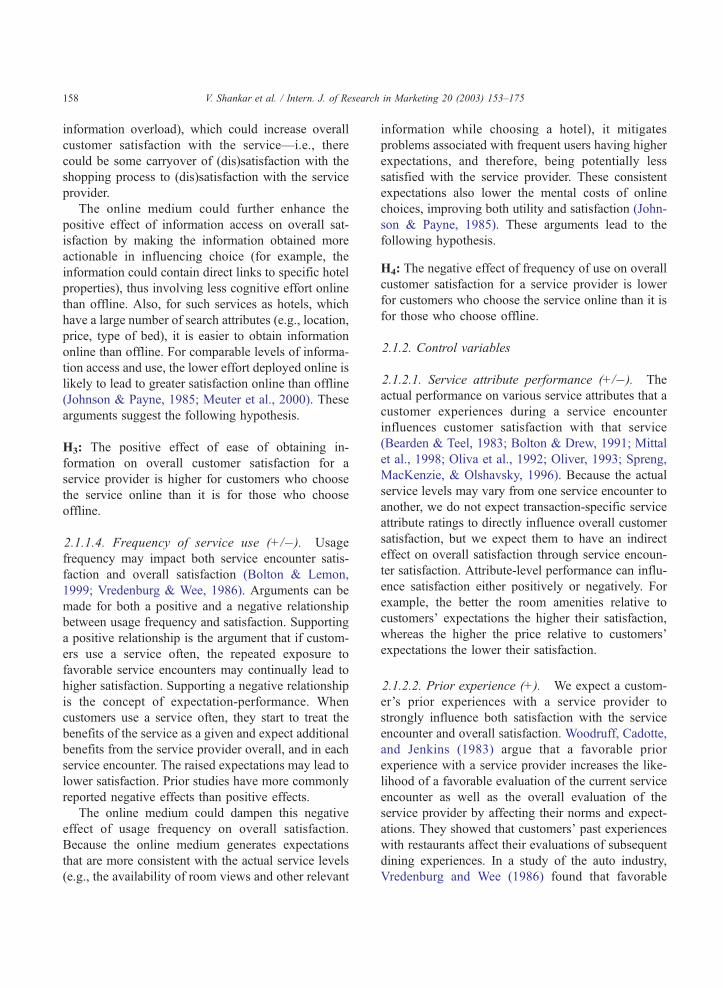
2.1.2.2. Prior experience (+). We expect a custom-
er’s prior experiences with a service provider to
strongly influence both satisfaction with the service
encounter and overall satisfaction. Woodruff, Cadotte,
and Jenkins (1983) argue that a favorable prior
experience with a service provider increases the like-
lihood of a favorable evaluation of the current service
encounter as well as the overall evaluation of the
service provider by affecting their norms and expect-
ations. They showed that customers’ past experiences
with restaurants affect their evaluations of subsequent
dining experiences. In a study of the auto industry,
Vredenburg and Wee (1986) found that favorable

V. Shankar et al. / Intern. J. of Research in Marketing 20 (2003) 153–175 159
prior experience resulted in higher satisfaction levels.
Bolton and Drew (1991) showed that customers’ prior
attitudes influenced their current attitudes toward a
telephone service. Thus, overall, the more favorable
the prior experience the higher the satisfaction. Unlike
Frequency of service use, which refers to the quantity
of prior use of a service, Prior experience refers to the
quality of previous experiences with the service pro-
vider.
2.1.2.3. Organizational constraint on choice
(�). Service encounter satisfaction is likely to
depend on whether the choice of the service on a
particular occasion was restricted by organizational
constraints. For example, customer satisfaction during
a service encounter would be more positive if he/she
chose the service provider than if his/her organization
chose it.
2.1.2.4. Role of intermediary in choice (?). If an
individual chooses a service after going through an
intermediary such as a travel agent, he/she is likely to
have different expectations about that service than if
he/she chooses without that intermediary for that
service encounter. The expectations could be higher
or lower depending upon the influence of the inter-
mediary. The different expectations will likely lead to
a different assessment of satisfaction for the service
encounter.
2.1.2.5. Service package (?). An individual’s serv-
ice encounter satisfaction with a service provider (e.g.,
hotel) may depend on whether the choice of the
service was part of a package or bundle of services
(e.g., travel package). Expectations of the service
could be different if the choice was part of a package
of services—e.g., part of the service experience could
be attributed to the package.
2.1.2.6. Disconfirmation of search time in choosing
the service (+). Disconfirmation theory suggests
that overall satisfaction is likely to be lower when
customers generally put in more effort than they
expected to expend in choosing the service (Anderson
& Sullivan, 1993; Oliver, 1980). If they actually do
spend less time relative to their expectations, then we
should see a higher level of overall satisfaction.
However, if customers spend more time in choosing
a service than they expected to (regardless of the
medium), they will be less satisfied because their
outcome was worse than expected.
In addition to the focal constructs and control
variables that we have identified above, specific
characteristics of a website may further modify the
effect of the online environment on service encounter
satisfaction. In particular, we consider two factors: (1)
interactivity of website, and (2) depth of information
at the website.
2.1.2.7. Interactivity of website (+). Interactivity
refers to the ability of websites to dynamically gen-
erate outputs based on customer queries and searches.
A static website is likely to increase search effort for
online shoppers, thereby decreasing their satisfaction.
On the other hand, a well designed interactive website
could generate higher satisfaction by providing greater
control to customers to personalize the information
search. Greater customer control of the shopping
experience increases the pleasure and convenience of
shopping, an important component of customer sat-
isfaction (Marmorstein, Grewal, & Fisher, 1992).
These arguments suggest that the customer’s service
encounter satisfaction is positively related to the
degree of interactivity of the website from which the
customers choose.
2.1.2.8. Depth of information at the website
(+). Websites can offer more information at the
point of choice, thereby helping customers make
better choices. Some websites have multiple layers
of web pages with detailed information. If the infor-
mation is multi-layered and rich, customers will tend
to value the service encounter more than when the
information is very superficial (Glazer, 1991). Thus, a
customer’s service encounter satisfaction is positively
related to the depth of information available at the
website (in our study, the service provider’s site) from
which the service is chosen.
Among the control variables that influence service
encounter satisfaction, only prior experience impacts
overall satisfaction. The remaining variables are spe-
cific to a service encounter. Therefore, we do not
include them as potential drivers of overall satisfac-
tion. Finally, note that we predict a positive effect of
service encounter satisfaction on overall satisfaction
because overall satisfaction is driven by satisfaction

V. Shankar et al. / Intern. J. of Research in Marketing 20 (2003) 153–175160
from a series of service encounters (Bitner & Hubbert,
1994; Oliver, 1997; Rust & Oliver, 1994).
2.2. Drivers of loyalty
In Fig. 1, we have summarized the drivers of
loyalty in a service industry, namely, the medium,
overall customer satisfaction, ease of obtaining infor-
mation, frequency of use, prior experience with serv-
ice provider, membership in frequency program, and
income. These factors are particularly applicable to
the travel industry (Pritchard & Howard, 1997). We
discuss the effects of each of these factors below.
2.2.1. Focal constructs
2.2.1.1. Direct (main) effect of the online medium
(+). As suggested earlier, other things being equal,
when customers make a service choice online, the
resulting service is more likely to meet their expect-
ations. Because the Web facilitates information
search, we expect the customer to be better informed
about the service levels to expect, and is less likely to
be surprised (positively or negatively) by the services
received when choosing online than offline. As a
result, the customer’s confidence in the service pro-
vider increases, which builds ‘‘fortitude’’ that prevents
encroachment by competitive brands (Oliver, 1999).
Further, customers may bookmark the URL of service
providers when they have increased confidence in a
service provider (i.e., reduce the consideration set),
which makes it easier to find the same provider during
future purchase occasions. The online medium also
allows the customer to inspect more fully the available
choices (e.g., pictures of hotels) than the offline
medium. This makes it easier for a customer to learn
about available options faster online than offline,
which could result in ‘‘cognitive lock-in’’ to the
selected service provider by making it easier for the
customer to deal with that service provider than with
other providers (Johnson et al., 2002). Finally, the
ability to choose service providers on a 24/7 basis
lowers the probability that the customer would go to
another service provider simply because of limited
access to his or her preferred service provider.
On the other hand, one could also argue that the
online medium facilitates easier comparison of alter-
natives and allows faster propagation of any negative
word-of-mouth than the offline medium. These factors
could increase the consideration sets of customers,
thereby increasing the chances that customers gain
more information/positive attitude toward competing
services, and loss of loyalty to the focal service.
However, since service failures typically constitute a
small proportion of all service encounters, we expect
the positive influences of these factors to dominate the
negative influences. Indeed, a significant majority of
customers prefer to reduce the number of items they
consider online even when there are a large number of
alternatives (Wu & Rangaswamy, in press). In sum,
we expect the online medium to directly enhance
customer loyalty, which we state in the form of the
following hypothesis.
H5: Other things equal, loyalty to the service provider
is higher when the service is chosen online than
offline.
2.2.1.2. Overall customer satisfaction (+). Custom-
ers’ loyalty to a service provider is influenced by their
overall satisfaction with that provider. Most prior
research has found qualified support for a positive
satisfaction–customer retention relationship (Rust &
Zahorik, 1993). Bolton (1998) found that the duration
of a relationship between a customer and a service
provider is longer when the customer is satisfied.
Crosby and Stephens (1987) found that prior satisfac-
tion increases the likelihood of a customer renewing
her insurance policy. Rust, Zeithaml, and Lemon
(2000) propose that the relationship between satisfac-
tion and loyalty is positive, i.e., the more satisfied
customers are with a service provider the more loyal
they are to the service provider. Reicheld (1996),
however, suggests that satisfaction is significantly
related to loyalty only at very high levels of satisfac-
tion. Therefore, the exact nature of the relationship
between overall satisfaction and loyalty is an empiri-
cal issue.
At the same time, we expect overall customer
satisfaction to have stronger effect on loyalty online
than offline. One reason for this differential effect is
that when customers are satisfied with a service pro-
vider online, they could more readily bookmark the
website, make the choice 24�7, and even store or place
a future order with the service provider. Thus, they have
to spend less effort online for making a choice decision
V. Shankar et al. / Intern. J. of Research in Marketing 20 (2003) 153–175 161
of roughly the same quality as their previous choices.
Thus, the online medium intensifies the relationship
between satisfaction and loyalty (Johnson & Payne,
1985). A further reason for the online medium to
reinforce the relationship between satisfaction and
loyalty is that a satisfied customer could more easily
locate the same service even in an unfamiliar context
(e.g., a favorite hotel chain in a new city). These
arguments lead to the following hypothesis.
H6: The positive effect of overall satisfaction on
loyalty to a service provider is greater for customers
who choose the service online than it is for those who
choose offline.
2.2.1.3. Ease of obtaining information (+). Like
overall customer satisfaction, loyalty may also depend
on the ease with which relevant information can be
obtained while choosing the service provider. Easier
access to information typically reinforces the tendency
to go back to a preferred service provider (Oliver,
1999). As we suggested earlier, for products such as
hotels that have a large number of search attributes, it
is easier to obtain information online than offline.
Ease of obtaining information also increases customer
learning and may lead to greater cognitive lock-in to
the service online than offline (Johnson et al., 2002).
Thus, we expect higher loyalty online due to this
factor. This reasoning leads to H7.
H7: The positive effect of ease of obtaining
information on loyalty for a service provider is higher
for customers who choose the service online than it is
for those who choose offline.
2.2.2. Control variables
2.2.2.1. Prior experience (+). A customer who has a
favorable prior experience with a service provider will
likely be loyal to that service provider (Reicheld,
1996). This effect is likely to be higher in the online
environment because it is more convenient and faster
to choose the same service online than offline (e.g.,
through the use of bookmarks).
2.2.2.2. Frequency of service use (?). Both positive
and negative relationships between frequency of use
and loyalty are possible (Rust et al., 2000). It is not
clear either whether the effect of frequency of use on
loyalty in the online environment will be any different
from that in the offline environment.
2.2.2.3. Membership in frequency program (+). If a
person is a member of a service provider’s frequency
program, he/she typically benefits more by choosing
the service provider than if he/she is not a member.
This aspect is likely to be associated with greater
loyalty to the service provider.
2.2.2.4. Income (+). An individual’s income level
may influence his/her loyalty to a service provider.
Customers with lower discretionary incomes would be
willing to do more price-comparisons and be less
loyal to a service provider than those with higher
incomes. Also, higher-income individuals typically
have more time constraints and are more likely to
stick to the same service provider.
3. Data
3.1. Data collection procedure
To test our hypotheses, we collected two sets of
data in the lodging sector of the travel services
industry, which comprises about 35% of online con-
sumer sales (Comscore Report, 2002). These data sets
are: (1) a sample of customers who used both an
online (i.e., a website) and an offline medium (e.g., a
travel agent or hotel reservation desk) for making two
different hotel reservations (Data set 1), and (2)
separate samples of customers of a single hotel chain
(Data set 2), one sample of customers who made
reservations online and another sample which made
reservations offline.
Our use of the two different data sets in the same
study is similar to developing multiple models (e.g.,
Silk & Urban, 1978) and conducting multiple experi-
ments in consumer behavior research to assess con-
vergence in results and insights. Data set 1 is akin to a
within-subjects design, whereas Data set 2 is akin to a
between-subjects design in an experimental study. In
Data set 1, we have the advantage of focusing on the
effect of the online medium relative to the offline
medium for the same customer, thereby eliminating
the variance due to differences in the online and
V. Shankar et al. / Intern. J. of Research in Marketing 20 (2003) 153–175162
offline populations. In Data set 2, we have the
advantage of having an identical service provider for
both the online and offline samples, which reduces
variance due to services delivered.3 Although we used
identical questionnaires in both data sets, the ques-
tions in Data set 1 were applicable to any hotel chosen
by the respondent, whereas the questions in Data set 2
were specific to Marriott hotels.4 Further, in Data set
1, the respondent answered the set of questions twice,
once with respect to his/her most recent online reser-
vation and once with respect to his/her most recent
offline reservation.5 All respondents were provided
identical incentives to participate, in the form of 500
frequent reward points for a member hotel of HSMAI
and for Marriott hotel in Data sets 1 and 2, respec-
tively.
3.1.1. Data set 1
We collected primary data by surveying a random
sample of hotel customers using a list provided by the
Hospitality Sales and Marketing Association Interna-
tional. Customers in this sample were representative
of customers who chose hotels in both the online and
offline media. We received 144 usable responses from
a sample of 1000 customers who were randomly
selected from the list and mailed questionnaires (a
response rate of 14.4%). This sample contained only
those who had chosen a hotel both online and offline.
The same respondents provided data for their most
recent offline and online reservations.
The online and offline questionnaires included
items on shopping behavior, choices, attitudes, meas-
ures of the hypothesized factors, and demographics.
The questions relating to factors common to both the
online and offline reservations were identical in the
3 Note that for all customers in our study, part of the service
encounter occurs during the choice/reservation process but the
primary service experience occurs at the hotel.4 In Data set 1, to control for order bias in answering online and
offline questions, we randomly chose one half of the sample to
answer online questions first, while the other half of the sample
were asked to answer offline questions first.5 To ensure that differences in the recency of responses
between online and offline respondents do not bias the results, we
take into account in our analyses, the differences in the frequency of
shopping between the samples. Even so, we analyzed the time lag
between the date of response and that of the most recent purchase
(hotel stay). It is not significantly different across the online and
offline samples in Data sets 1 and 2.
two questionnaires. In addition, the online question-
naire included items on website factors. Most of the
questions related to the most recent service encounter.
This way, we were able to elicit attitudes with respect
to a specific experience. To ensure that the informa-
tion search undertaken by the respondent is done
within a single medium (online or offline), we in-
cluded a screening question regarding the medium
from which the respondent obtained information.
3.1.2. Data set 2
We obtained primary data from both online and
offline customers of Marriott International. The online
respondents chose a Marriott hotel on the Internet and
the offline respondents chose a Marriott hotel using
conventional offline methods (e.g., travel agents or
toll-free telephone number). We screened the offline
customers, and none of them had any prior online
reservation experience. By having two separate sam-
ples, we are able to compare the attitudes and behav-
iors of populations that differ primarily in the medium
they use to make hotel reservations.
The offline sample consisted of respondents from
a random sample of 2000, generated from the pop-
ulation of 12 million customers of Marriott Interna-
tional’s customer database, who were mailed the
questionnaire. For the online sample, we posted the
survey at Marriott’s website with a ‘‘New’’ tag and
requested that the online visitors fill out the survey.
Note that it is extremely difficult to achieve random
sampling on the Internet because of the lack of a
sampling frame—there is no list of all Internet users
or even a list of potential visitors to a site, nor is there
an online equivalent to random digit dialing. However,
it is worth noting that online surveys typically elicit
responses from a reasonably representative sample of
the universe of online shoppers of a given product.
This is because those who are likely to shop online for
a product also tend to be the ones who respond to
online surveys on the product (Intelliquest, 1997).
We collected 190 usable responses from the online
survey and 403 usable responses from the offline
survey, which represented a response rate of about
20.2%. As is well recognized, the online population is
younger, on average, than the general population. Of
the responses we obtained from the offline surveys,
we selected the first 272 that allowed us to closely
match the online sample in demographics. This sam-
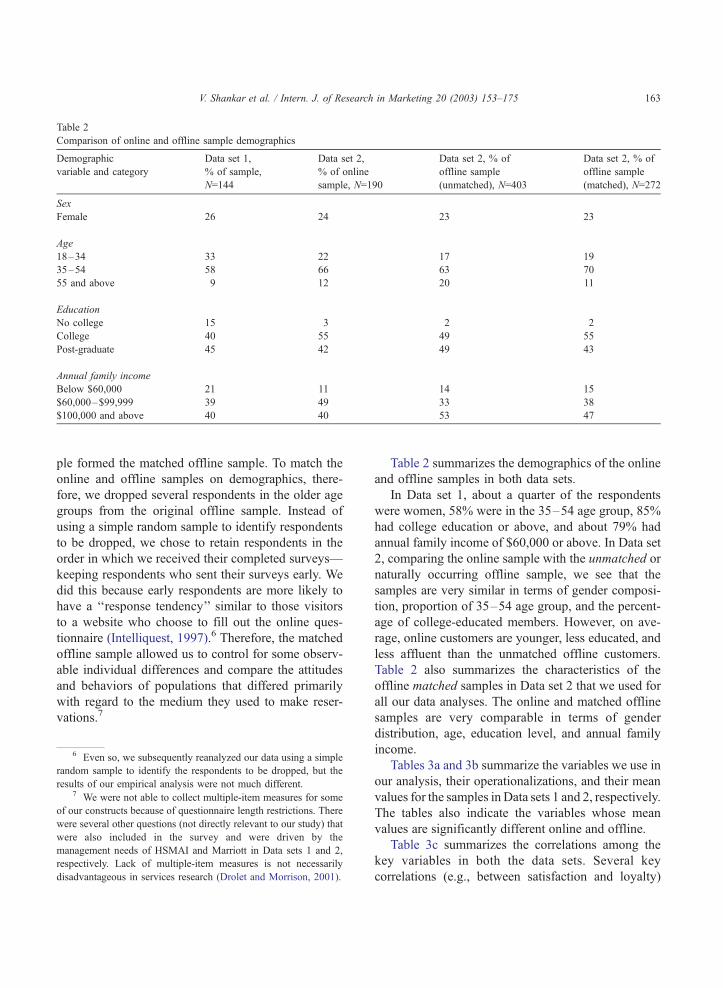
Table 2
Comparison of online and offline sample demographics
Demographic
variable and category
Data set 1,
% of sample,
N=144
Data set 2,
% of online
sample, N=190
Data set 2, % of
offline sample
(unmatched), N=403
Data set 2, % of
offline sample
(matched), N=272
Sex
Female 26 24 23 23
Age
18–34 33 22 17 19
35–54 58 66 63 70
55 and above 9 12 20 11
Education
No college 15 3 2 2
College 40 55 49 55
Post-graduate 45 42 49 43
Annual family income
Below $60,000 21 11 14 15
$60,000–$99,999 39 49 33 38
$100,000 and above 40 40 53 47
V. Shankar et al. / Intern. J. of Research in Marketing 20 (2003) 153–175 163
ple formed the matched offline sample. To match the
online and offline samples on demographics, there-
fore, we dropped several respondents in the older age
groups from the original offline sample. Instead of
using a simple random sample to identify respondents
to be dropped, we chose to retain respondents in the
order in which we received their completed surveys—
keeping respondents who sent their surveys early. We
did this because early respondents are more likely to
have a ‘‘response tendency’’ similar to those visitors
to a website who choose to fill out the online ques-
tionnaire (Intelliquest, 1997).6 Therefore, the matched
offline sample allowed us to control for some observ-
able individual differences and compare the attitudes
and behaviors of populations that differed primarily
with regard to the medium they used to make reser-
vations.7
6 Even so, we subsequently reanalyzed our data using a simple
random sample to identify the respondents to be dropped, but the
results of our empirical analysis were not much different.7 We were not able to collect multiple-item measures for some
of our constructs because of questionnaire length restrictions. There
were several other questions (not directly relevant to our study) that
were also included in the survey and were driven by the
management needs of HSMAI and Marriott in Data sets 1 and 2,
respectively. Lack of multiple-item measures is not necessarily
disadvantageous in services research (Drolet and Morrison, 2001).
Table 2 summarizes the demographics of the online
and offline samples in both data sets.
In Data set 1, about a quarter of the respondents
were women, 58% were in the 35–54 age group, 85%
had college education or above, and about 79% had
annual family income of $60,000 or above. In Data set
2, comparing the online sample with the unmatched or
naturally occurring offline sample, we see that the
samples are very similar in terms of gender composi-
tion, proportion of 35–54 age group, and the percent-
age of college-educated members. However, on ave-
rage, online customers are younger, less educated, and
less affluent than the unmatched offline customers.
Table 2 also summarizes the characteristics of the
offline matched samples in Data set 2 that we used for
all our data analyses. The online and matched offline
samples are very comparable in terms of gender
distribution, age, education level, and annual family
income.
Tables 3a and 3b summarize the variables we use in
our analysis, their operationalizations, and their mean
values for the samples in Data sets 1 and 2, respectively.
The tables also indicate the variables whose mean
values are significantly different online and offline.
Table 3c summarizes the correlations among the
key variables in both the data sets. Several key
correlations (e.g., between satisfaction and loyalty)
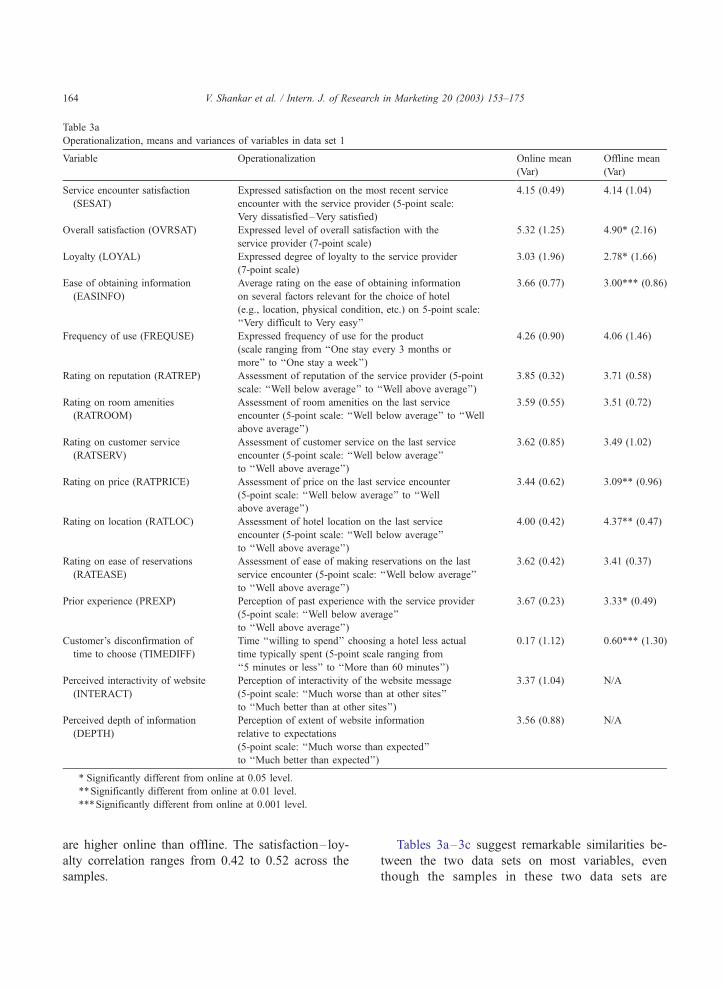
Table 3a
Operationalization, means and variances of variables in data set 1
Variable Operationalization Online mean
(Var)
Offline mean
(Var)
Service encounter satisfaction
(SESAT)
Expressed satisfaction on the most recent service
encounter with the service provider (5-point scale:
Very dissatisfied–Very satisfied)
4.15 (0.49) 4.14 (1.04)
Overall satisfaction (OVRSAT) Expressed level of overall satisfaction with the
service provider (7-point scale)
5.32 (1.25) 4.90* (2.16)
Loyalty (LOYAL) Expressed degree of loyalty to the service provider
(7-point scale)
3.03 (1.96) 2.78* (1.66)
Ease of obtaining information
(EASINFO)
Average rating on the ease of obtaining information
on several factors relevant for the choice of hotel
(e.g., location, physical condition, etc.) on 5-point scale:
‘‘Very difficult to Very easy’’
3.66 (0.77) 3.00*** (0.86)
Frequency of use (FREQUSE) Expressed frequency of use for the product
(scale ranging from ‘‘One stay every 3 months or
more’’ to ‘‘One stay a week’’)
4.26 (0.90) 4.06 (1.46)
Rating on reputation (RATREP) Assessment of reputation of the service provider (5-point
scale: ‘‘Well below average’’ to ‘‘Well above average’’)
3.85 (0.32) 3.71 (0.58)
Rating on room amenities
(RATROOM)
Assessment of room amenities on the last service
encounter (5-point scale: ‘‘Well below average’’ to ‘‘Well
above average’’)
3.59 (0.55) 3.51 (0.72)
Rating on customer service
(RATSERV)
Assessment of customer service on the last service
encounter (5-point scale: ‘‘Well below average’’
to ‘‘Well above average’’)
3.62 (0.85) 3.49 (1.02)
Rating on price (RATPRICE) Assessment of price on the last service encounter
(5-point scale: ‘‘Well below average’’ to ‘‘Well
above average’’)
3.44 (0.62) 3.09** (0.96)
Rating on location (RATLOC) Assessment of hotel location on the last service
encounter (5-point scale: ‘‘Well below average’’
to ‘‘Well above average’’)
4.00 (0.42) 4.37** (0.47)
Rating on ease of reservations
(RATEASE)
Assessment of ease of making reservations on the last
service encounter (5-point scale: ‘‘Well below average’’
to ‘‘Well above average’’)
3.62 (0.42) 3.41 (0.37)
Prior experience (PREXP) Perception of past experience with the service provider
(5-point scale: ‘‘Well below average’’
to ‘‘Well above average’’)
3.67 (0.23) 3.33* (0.49)
Customer’s disconfirmation of
time to choose (TIMEDIFF)
Time ‘‘willing to spend’’ choosing a hotel less actual
time typically spent (5-point scale ranging from
‘‘5 minutes or less’’ to ‘‘More than 60 minutes’’)
0.17 (1.12) 0.60*** (1.30)
Perceived interactivity of website
(INTERACT)
Perception of interactivity of the website message
(5-point scale: ‘‘Much worse than at other sites’’
to ‘‘Much better than at other sites’’)
3.37 (1.04) N/A
Perceived depth of information
(DEPTH)
Perception of extent of website information
relative to expectations
(5-point scale: ‘‘Much worse than expected’’
to ‘‘Much better than expected’’)
3.56 (0.88) N/A
* Significantly different from online at 0.05 level.
**Significantly different from online at 0.01 level.
***Significantly different from online at 0.001 level.
V. Shankar et al. / Intern. J. of Research in Marketing 20 (2003) 153–175164
are higher online than offline. The satisfaction–loy-
alty correlation ranges from 0.42 to 0.52 across the
samples.
Tables 3a–3c suggest remarkable similarities be-
tween the two data sets on most variables, even
though the samples in these two data sets are
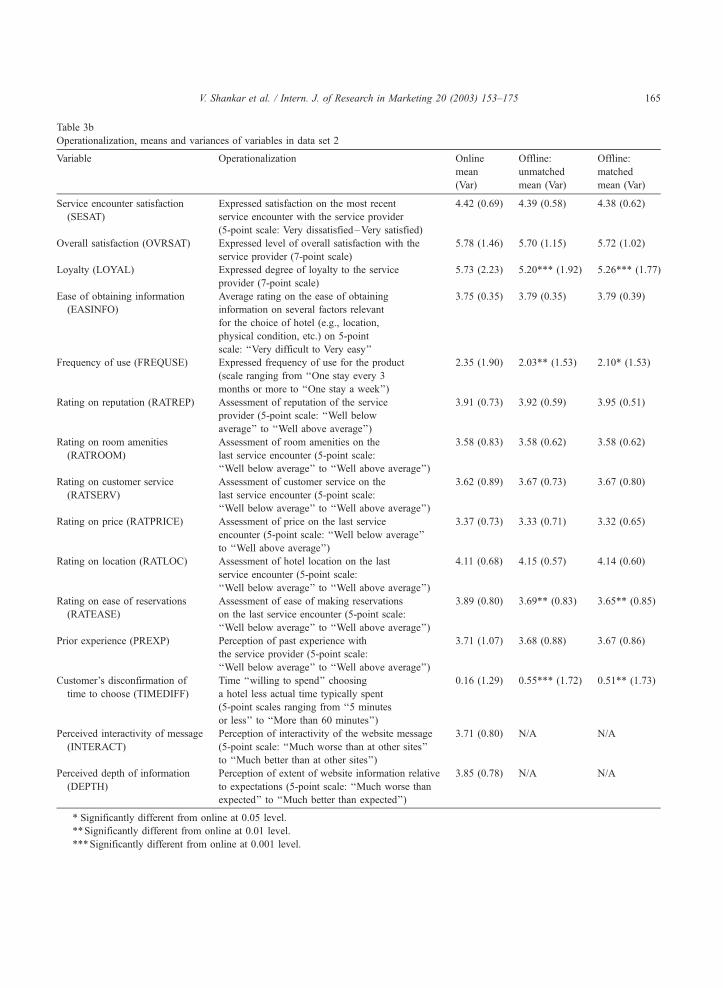
Table 3b
Operationalization, means and variances of variables in data set 2
Variable Operationalization Online
mean
(Var)
Offline:
unmatched
mean (Var)
Offline:
matched
mean (Var)
Service encounter satisfaction
(SESAT)
Expressed satisfaction on the most recent
service encounter with the service provider
(5-point scale: Very dissatisfied–Very satisfied)
4.42 (0.69) 4.39 (0.58) 4.38 (0.62)
Overall satisfaction (OVRSAT) Expressed level of overall satisfaction with the
service provider (7-point scale)
5.78 (1.46) 5.70 (1.15) 5.72 (1.02)
Loyalty (LOYAL) Expressed degree of loyalty to the service
provider (7-point scale)
5.73 (2.23) 5.20*** (1.92) 5.26*** (1.77)
Ease of obtaining information
(EASINFO)
Average rating on the ease of obtaining
information on several factors relevant
for the choice of hotel (e.g., location,
physical condition, etc.) on 5-point
scale: ‘‘Very difficult to Very easy’’
3.75 (0.35) 3.79 (0.35) 3.79 (0.39)
Frequency of use (FREQUSE) Expressed frequency of use for the product
(scale ranging from ‘‘One stay every 3
months or more to ‘‘One stay a week’’)
2.35 (1.90) 2.03** (1.53) 2.10* (1.53)
Rating on reputation (RATREP) Assessment of reputation of the service
provider (5-point scale: ‘‘Well below
average’’ to ‘‘Well above average’’)
3.91 (0.73) 3.92 (0.59) 3.95 (0.51)
Rating on room amenities
(RATROOM)
Assessment of room amenities on the
last service encounter (5-point scale:
‘‘Well below average’’ to ‘‘Well above average’’)
3.58 (0.83) 3.58 (0.62) 3.58 (0.62)
Rating on customer service
(RATSERV)
Assessment of customer service on the
last service encounter (5-point scale:
‘‘Well below average’’ to ‘‘Well above average’’)
3.62 (0.89) 3.67 (0.73) 3.67 (0.80)
Rating on price (RATPRICE) Assessment of price on the last service
encounter (5-point scale: ‘‘Well below average’’
to ‘‘Well above average’’)
3.37 (0.73) 3.33 (0.71) 3.32 (0.65)
Rating on location (RATLOC) Assessment of hotel location on the last
service encounter (5-point scale:
‘‘Well below average’’ to ‘‘Well above average’’)
4.11 (0.68) 4.15 (0.57) 4.14 (0.60)
Rating on ease of reservations
(RATEASE)
Assessment of ease of making reservations
on the last service encounter (5-point scale:
‘‘Well below average’’ to ‘‘Well above average’’)
3.89 (0.80) 3.69** (0.83) 3.65** (0.85)
Prior experience (PREXP) Perception of past experience with
the service provider (5-point scale:
‘‘Well below average’’ to ‘‘Well above average’’)
3.71 (1.07) 3.68 (0.88) 3.67 (0.86)
Customer’s disconfirmation of
time to choose (TIMEDIFF)
Time ‘‘willing to spend’’ choosing
a hotel less actual time typically spent
(5-point scales ranging from ‘‘5 minutes
or less’’ to ‘‘More than 60 minutes’’)
0.16 (1.29) 0.55*** (1.72) 0.51** (1.73)
Perceived interactivity of message
(INTERACT)
Perception of interactivity of the website message
(5-point scale: ‘‘Much worse than at other sites’’
to ‘‘Much better than at other sites’’)
3.71 (0.80) N/A N/A
Perceived depth of information
(DEPTH)
Perception of extent of website information relative
to expectations (5-point scale: ‘‘Much worse than
expected’’ to ‘‘Much better than expected’’)
3.85 (0.78) N/A N/A
* Significantly different from online at 0.05 level.
**Significantly different from online at 0.01 level.
***Significantly different from online at 0.001 level.
V. Shankar et al. / Intern. J. of Research in Marketing 20 (2003) 153–175 165

Table 3c
Correlations among key variables in the data sets
Data set 1 Data set 2
Online Offline Online Offline
SESAT and OVSAT 0.61 0.40 0.59 0.43
SESAT and LOYAL 0.22 0.08 0.19 0.11
OVSAT and LOYAL 0.52 0.46 0.48 0.42
LOYAL and FREQUSE 0.24 0.20 0.21 0.17
V. Shankar et al. / Intern. J. of Research166
completely different. There are, however, a few
notable differences in means between Data sets 1
and 2. For example, the frequency of use data
suggests that the sample in Data set 2 consists of
less frequent travelers. Although such differences in
means between the two data sets are potentially
interesting, our focus is primarily in exploring the
relationship between customer satisfaction and loy-
alty, i.e., we focus on explaining why and how
loyalty is higher online than offline and how it is
related to customer satisfaction.
8 One factor often used in understanding price sensitivity in the
travel industry is the purpose of travel, business, or leisure.
However, there are no strong theoretical reasons why purpose of
travel might influence customer satisfaction or loyalty. Even so, a
subsequent empirical analysis that included the purpose of travel did
not show it to be a significant factor influencing customer
satisfaction or loyalty.
4. Models
To test our hypotheses, we develop three different
sets of models.
� A simultaneous equation model in which satisfac-
tion and loyalty are interrelated, such that each can
be the driver of the other. This model is separate for
online and offline samples and provides the base
model for the next model, which we use to test the
hypotheses.� To formally test the effect of the online medium and
the different hypotheses, we develop pooled models
for the simultaneous equation and the recursive-
system of equations, in which the medium is used
as an additional (dummy) variable. This model is
central to our analysis.� A recursive system of three equations in which
service encounter satisfaction influences overall
satisfaction, which, in turn, influences loyalty. This
model is separate for online and offline samples
and forms the alternative model.
We describe each of these models below.
4.1. Simultaneous equation model of satisfaction and
loyalty
According to our hypotheses, service encounter
satisfaction, overall customer satisfaction and loy-
alty may be interrelated in that they drive one
another. Such complex relationships can be cap-
tured by a simultaneous system of equations. We
define the model for service encounter satisfaction
as follows.8
SESATi ¼ a0 þ a1LOYALi þ a2RATREPiþ a3RATROOMi þ a4RATSERVi
þ a5RATPRICEi þ a6RATLOCi
þ a7RATEASEi þ a8FREQUSEi
þ a9PREXPi þ a10CONSTi þ a11INTMi
þ a12PACKi þ a13Di * INTERACTi
þ a14Di *DEPTHi þ ei ð1Þ
where i is customer, SESAT is service encounter
satisfaction, LOYAL is the loyalty to the service
provider, RATREP is the customer rating on hotel
reputation, RATROOM is the rating on room
amenities, RATSERV is the rating on customer
service, RATPRICE is the rating on price paid,
RATLOC is the rating on location, RATEASE is
the rating on ease of making a reservation, FRE-
QUSE is the frequency of staying at hotels, PREXP
is the rating on prior experience with the hotel,
CONST is a dummy variable denoting whether
traveler i’s hotel choice was driven by organiza-
tional constraints (1 if the choice was constrained, 0
otherwise), INTM is a dummy variable denoting if
the traveler went through a travel website or a
travel agent or intermediary before coming to the
site of the hotel (1 if travel intermediary was
involved, 0 otherwise), PACK is a dummy variable
in Marketing 20 (2003) 153–175
9 We do not include CONST, the variable indicating whether
the hotel was chosen under organizational constraints, because it is a
service encounter-specific variable and our dependent variable is
overall loyalty. Even so, to test if this variable significantly drives
loyalty, we estimated another model by including it. Its effect was
insignificant, so we do not include it in our analysis.10 To test for a possible nonlinear effect of overall satisfaction
on loyalty as suggested by Reicheld (1996), we tried to use an
additional quadratic term in overall satisfaction. This term, however,
is highly correlated with overall satisfaction in our data, precluding
the testing of a possible nonlinear effect in our analysis.
V. Shankar et al. / Intern. J. of Research in Marketing 20 (2003) 153–175 167
indicating whether the hotel choice was part of a
travel package (1 if the choice was part of a travel
package, 0 otherwise), INTERACT is the perceived
interactivity of the website, DEPTH is the perceived
depth of information on the website, D is a dummy
variable =1 if the sample is online and =0 if the
sample is offline, and e is an error term assumed to
be normally distributed with a mean of zero. This
model captures the fact that satisfaction in a partic-
ular encounter may be driven by loyalty to the
service provider.
Next, we propose the following model of overall
satisfaction.
OVRSATi ¼ b0 þ b1SESATi þ b2LOYALi
þ b3EASINFOi þ b4FREQUSEi
þ b5PREXPi þ b6TIMEDIFFi þ ni
ð2Þ
where OVRSAT is the overall satisfaction with the
service provider, EASINFO is the general or overall
ease of obtaining information on the alternatives,
TIMEDIFF is the disconfirmation of search time in
choosing the service (i.e., difference between the
time generally spent in choosing a hotel and the
time willing to spend in choosing a hotel), n is an
error term assumed to be normally distributed with a
mean of zero, and the other terms are as defined
earlier. In this model, both service encounter satis-
faction and loyalty determine overall customer sat-
isfaction.
Finally, we present the following model of cus-
tomer loyalty.
LOYALi ¼ k0 þ k1OVRSATi þ k2EASINFOi
þ k3FREQUSEi þ k4PREXPi
þ k5FPROGi þ k6INCOMEi þ fi ð3Þ
where FPROG is a dummy variable capturing
whether traveler i is a member of frequency program
of the chosen hotel (1 if member, 0 otherwise),
INCOME is the average annual income of the trav-
eler, f is an error term assumed to be normally
distributed with a mean of zero, and the other terms
are as defined earlier.9 In this model, we allow overall
satisfaction to influence loyalty.10
4.2. Pooled simultaneous equation models customer
satisfaction and loyalty
To formally test the effect of the online medium on
the relationships, we propose pooled models of serv-
ice encounter satisfaction, overall satisfaction, and
loyalty. We make the parameters ak, ke{0, 1,. . .12}in Eq. (1), bl, le{0, 1,. . .6} in Eq. (2), and km, me{0,1,. . .6} in Eq. (3) a function of the medium (online or
offline) as follows. For /ke{ak, bk, kk}
/k ¼ /Fk þ /N
k Di ð4Þ
where Di=1, when the data is for the online sample,
and 0 otherwise.
Substituting Eq. (4) into each of Eqs. (1)–(3)
produces the system of pooled models for our analy-
sis.
4.3. Alternative model: recursive model of customer
satisfaction and loyalty
To examine the incremental value of analyzing the
relationship between customer satisfaction and loyalty
as a system, we compared the results from the
simultaneous equation system with those of an alter-
native model, i.e., a recursive model in which the
LOYAL variable is absent in the equations for SESAT
and OVRSAT. When these variables are absent, the
model becomes recursive and the three equations in
such a model can be estimated independently by OLS
(Dhrymes, 1974).

Table 4
Results of the pooled model of service encounter satisfaction for
online and offline customers
Variable Data set 1 Data set 2
(parameter)Pooled model:
(S.E.)
Beta
weight
Pooled model:
matched
(S.E.)
Beta
weight
Intercept (a0F) 1.34
(0.42)***
1.50
(0.61)***
Focal variables
Online medium
(a0N)
NS NS
Loyalty—
incremental
online (a1N)
NS NS
Control and other variables
Reputation (a2F) 0.09
(0.03)**
0.12 0.13
(0.08)*
0.13
Room amenities
(a3F)
0.21
(0.07)***
0.20 0.20
(0.07)***
0.21
Service (a4F) 0.23
(0.12)*
0.25 0.25
(0.06)***
0.29
earch in Marketing 20 (2003) 153–175
4.4. Model estimation
We estimate the set of pooled model equations
using the three-stage least squares (3SLS) method. We
also estimate Eqs. (1)–(3) as a simultaneous system of
equations for each sample, namely, the online sample
and offline sample in Data set 1 and the online
sample, unmatched offline sample, and matched off-
line sample in Data set 2.
We tested all models for heteroscedasticity using
the Glesjer (1969) test. The tests did not indicate the
presence of heteroscedasticity in any of the models.
Also, because the same respondent chose both online
and offline in Data set 1, there is a possibility that his/
her responses are correlated across the media. To
account for this possibility, we allowed for errors
from the online and offline samples to be correlated
in the estimation. Before pooling, we tested for
homogeneity of slopes and intercepts using the Chow
(1960) test. The null hypothesis of homogeneity of
parameters was rejected ( p<0.001).
V. Shankar et al. / Intern. J. of Res168
Location (a6F) 0.03
(0.01)**
0.02 NS
Depth of
information
at the website
(a14)
0.15
(0.05)***
0.26 0.13
(0.06)**
0.31
Sample size 144 462
System wide
R squared
0.39 0.50
System wide
RMSE
0.53 1.32
NS—not significant.
For expositional clarity, the control and other variables associated
with nonsignificant results and the beta weights of nonsignificant
variables are not shown.
* pV0.10.
**pV0.05.
***pV0.01.
5. Results and discussion
The results are summarized in Tables 4–6. The
system of equations has good fit for cross-sectional
data as indicated by the system-wide R2 of 0.39 and
0.50 in the two data sets. The cross-residual correla-
tions across the three equations are reasonably high
(ranging from 0.43 to 0.73), indicating the appropri-
ateness of the use of a simultaneous equation model
for both data sets. The relative importance of a
variable is indicated by its beta weight in each model.
The results of the simultaneous system of equations
separately for the online and offline samples for both
data sets are consistent, overall, with those of the
pooled simultaneous system of equations.11
5.1. Drivers of service encounter satisfaction and
overall satisfaction
In both the data sets, service encounter satisfaction
is not statistically different online versus offline. In
Data set 1, however, overall satisfaction is higher
11 These results are not presented due to space limitations.
They can be obtained by writing to the first author.
when a hotel is chosen online than when selected
offline ( p<0.05).
5.1.1. Direct effect of the online medium
After controlling for the effects of the service
attributes, prior experience, frequency of service use,
organizational constraints, and package choice, the
online medium has no significant main effect on
service encounter satisfaction in either data set. The
online medium has no significant main effect on
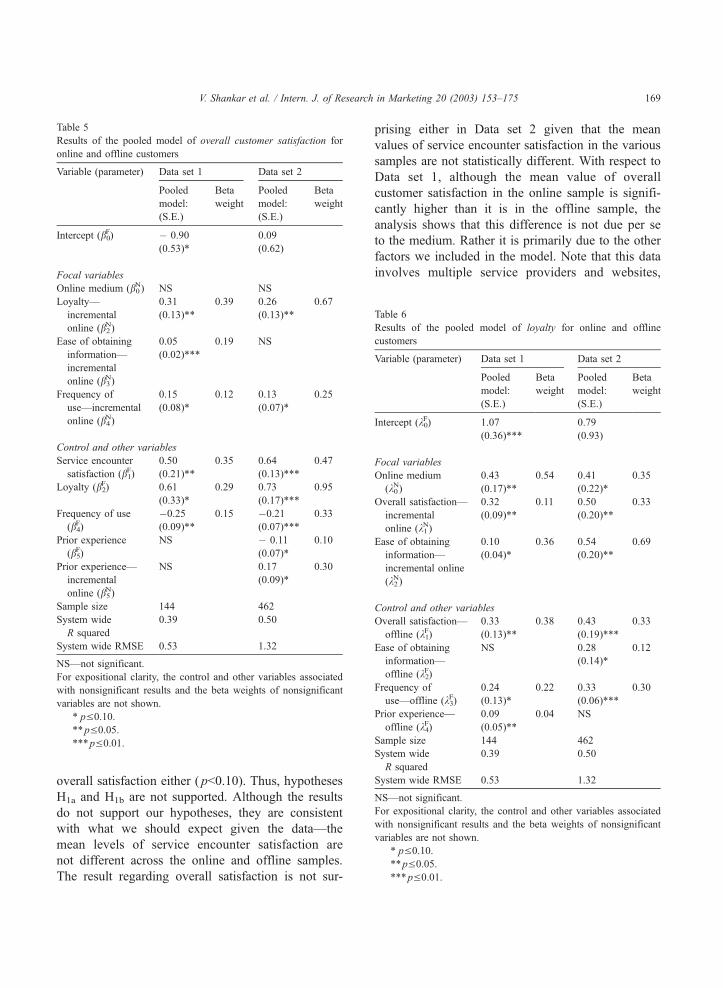
Table 5
Results of the pooled model of overall customer satisfaction for
online and offline customers
Variable (parameter) Data set 1 Data set 2
Pooled
model:
(S.E.)
Beta
weight
Pooled
model:
(S.E.)
Beta
weight
Intercept (b0F) � 0.90
(0.53)*
0.09
(0.62)
Focal variables
Online medium (b0N) NS NS
Loyalty—
incremental
online (b2N)
0.31
(0.13)**
0.39 0.26
(0.13)**
0.67
Ease of obtaining
information—
incremental
online (b3N)
0.05
(0.02)***
0.19 NS
Frequency of
use—incremental
online (b4N)
0.15
(0.08)*
0.12 0.13
(0.07)*
0.25
Control and other variables
Service encounter
satisfaction (b1F)
0.50
(0.21)**
0.35 0.64
(0.13)***
0.47
Loyalty (b2F) 0.61
(0.33)*
0.29 0.73
(0.17)***
0.95
Frequency of use
(b4F)
�0.25
(0.09)**
0.15 �0.21
(0.07)***
0.33
Prior experience
(b5F)
NS � 0.11
(0.07)*
0.10
Prior experience—
incremental
online (b5N)
NS 0.17
(0.09)*
0.30
Sample size 144 462
System wide
R squared
0.39 0.50
System wide RMSE 0.53 1.32
NS—not significant.
For expositional clarity, the control and other variables associated
with nonsignificant results and the beta weights of nonsignificant
variables are not shown.
* pV0.10.
**pV0.05.
***pV0.01.
Table 6
Results of the pooled model of loyalty for online and offline
customers
Variable (parameter) Data set 1 Data set 2
Pooled
model:
(S.E.)
Beta
weight
Pooled
model:
(S.E.)
Beta
weight
Intercept (k0F) 1.07
(0.36)***
0.79
(0.93)
Focal variables
Online medium
(k0N)
0.43
(0.17)**
0.54 0.41
(0.22)*
0.35
Overall satisfaction—
incremental
online (k1N)
0.32
(0.09)**
0.11 0.50
(0.20)**
0.33
Ease of obtaining
information—
incremental online
(k2N)
0.10
(0.04)*
0.36 0.54
(0.20)**
0.69
Control and other variables
Overall satisfaction—
offline (k1F)
0.33
(0.13)**
0.38 0.43
(0.19)***
0.33
Ease of obtaining
information—
offline (k2F)
NS 0.28
(0.14)*
0.12
Frequency of
use—offline (k3F)
0.24
(0.13)*
0.22 0.33
(0.06)***
0.30
Prior experience—
offline (k4F)
0.09
(0.05)**
0.04 NS
Sample size 144 462
System wide
R squared
0.39 0.50
System wide RMSE 0.53 1.32
NS—not significant.
For expositional clarity, the control and other variables associated
with nonsignificant results and the beta weights of nonsignificant
variables are not shown.
* pV0.10.
**pV0.05.
***pV0.01.
V. Shankar et al. / Intern. J. of Research in Marketing 20 (2003) 153–175 169
overall satisfaction either ( p<0.10). Thus, hypotheses
H1a and H1b are not supported. Although the results
do not support our hypotheses, they are consistent
with what we should expect given the data—the
mean levels of service encounter satisfaction are
not different across the online and offline samples.
The result regarding overall satisfaction is not sur-
prising either in Data set 2 given that the mean
values of service encounter satisfaction in the various
samples are not statistically different. With respect to
Data set 1, although the mean value of overall
customer satisfaction in the online sample is signifi-
cantly higher than it is in the offline sample, the
analysis shows that this difference is not due per se
to the medium. Rather it is primarily due to the other
factors we included in the model. Note that this data
involves multiple service providers and websites,
V. Shankar et al. / Intern. J. of Research170
which may introduce idiosyncratic concerns regard-
ing security, privacy, technology failure, and the like.
These effects may have offset the favorable effects of
the online medium on satisfaction, leading to a
finding of no differences between online and offline
customer satisfaction. As we indicated earlier, the
actual main effects of the online medium can only be
determined empirically.
5.1.2. Loyalty
Loyalty is significantly higher online than offline
( p<0.05) in both data sets. Loyalty has no significant
effect on service encounter satisfaction in both the data
sets ( p<0.10), therefore, H2a is not supported. A
specific service encounter may be treated as transac-
tional, not relationship-oriented, so that both loyal and
nonloyal customers may have similar reactions to
similar service levels during a single service encounter.
However, the positive impact of loyalty on overall
customer satisfaction is incrementally higher in the
online sample in both Data sets 1 and 2 (b2N= 0.31,
p<0.05 in Data set 1; b2N=0.26, p<0.05 in Data set 2),
supporting H2b. This is an important result from our
study. It suggests that attitudinal loyalty to the service
provider is also a major factor in creating enduring
satisfaction across service encounters, particularly in
the online environment.12 Our result is consistent with
Oliver (1999) who suggests that loyalty fortifies sat-
isfaction toward the service provider, and other studies
that have found loyal customers to have a lower decay
rate of overall satisfaction, and to be more forgiving of
less satisfactory services (Rust et al., 1999; Zeithaml,
Berry, & Parasuraman, 1993). Our results also help
explain the findings by Bain and Company which
shows that the returns to loyalty-building initiatives
are in the double-digits (Baveja, Rastogi, Zook, Han-
cock, & Chu, 2000), and lend further support to the
results reported by Rust et al. (2000) who show that
under certain conditions, it may be better to focus
directly on loyalty-building initiatives (e.g., frequent-
user programs), rather than work on satisfaction-
enhancing efforts (e.g., total quality management).
12 Although our data do not allow us to make precise
determination of the direction of causality, the simultaneous
equation approach reduces the possibility that this is simply a
correlation between loyalty and overall satisfaction.
5.1.3. Ease of obtaining information
The ease of obtaining information is higher online
than offline in Data set 1 ( p<0.001), as expected, but
there is no difference in Data set 2. The effects of ease
of obtaining information are consistent—the easier it
is to obtain information the higher the overall satis-
faction, consistent with the results of Oliva et al.
(1992). Ease of obtaining information has a greater
positive impact on overall customer satisfaction when
the service is chosen online than offline (b5N=0.05,
p<0.01 in Data set 1), supporting H3. This is consis-
tent with Johnson and Payne (1985) in that the online
medium has lower cognitive costs than the offline
medium, leading to greater customer utility and sat-
isfaction.
5.1.4. Frequency of use
Frequency of use is not significantly different
between online and offline shoppers in Data set 1
but is higher online than offline in Data set 2 ( p<
0.05). Frequency of use is negatively related to overall
satisfaction in both data sets. These results support
prior findings (Bolton & Lemon, 1999; Vredenburg &
Wee, 1986). More frequent users have higher expect-
ations. Thus, they are less likely to be satisfied than
infrequent users.13 The online medium, however,
seems to mitigate this negative relationship—its incre-
mental effects are positive in both data sets (b4N=0.15,
p<0.05 in Data set 1; b4N=0.13, p<0.05 in Data set 2),
consistent with H4.
5.2. Drivers of loyalty
5.2.1. Direct effect of the online medium
Loyalty is significantly higher online than offline
( p<0.05) in both data sets. A key result of our analysis
is that the online medium has a positive impact on
loyalty of the types of people in our two data sets,
even after accounting for other factors that influence
loyalty (k0N=0.43; p<0.05 in Data set 1 and k0
N=0.41;
p<0.10 in Data set 2), supporting H5. In Data set 2, in
particular, there are almost no differences between the
online and offline samples on product attributes (this
in Marketing 20 (2003) 153–175
13 Respondents in Data set 1 had higher average frequency of
use and lower satisfaction levels (on service encounter satisfaction
and overall satisfaction) than respondents in Data set 2 (Tables 3a
and 3b).
V. Shankar et al. / Intern. J. of Research in Marketing 20 (2003) 153–175 171
is expected given that both samples booked the same
hotel, namely, Marriott) and yet, there is an incremen-
tal effect of the online medium on loyalty. Perhaps the
online medium increases loyalty by making it easier
for satisfied customers to choose the same hotel again
(e.g., through bookmarks).
5.2.2. Overall satisfaction
Overall satisfaction enhances loyalty in both the
samples in Data sets 1 and 2 (k1F=0.33, p<0.05 in Data
set 1; k1F=0.43, p<0.01 in Data set 2). This finding
supports similar findings (e.g., Bolton, 1998; Rust &
Zahorik, 1993) regarding the effects of satisfaction on
behavioral loyalty (or customer retention) and extends
those results to attitudinal loyalty. More interestingly,
the positive relationship between satisfaction and
loyalty is stronger online than offline in both data
sets (k1N= 0.32, p<0.05 in Data set 1; k1
N=0.50, p<0.05
in Data set 2), thereby supporting hypothesis H6.
Therefore, it appears that satisfied customers are better
able to express their loyalty online than offline,
perhaps through the use of bookmarks, search fea-
tures, and hot links associated with the content pre-
sented at the website.
5.2.3. Ease of obtaining information
Ease of obtaining information has a greater positive
impact on loyalty when the service is chosen online
than offline (b2N=0.10, p<0.05 in Data set 1; b2
N=0.54,
p<0.01 in Data set 2), supporting H7. This is consis-
tent with Oliver (1999) who suggests that ease of
information search and retrieval generally increases
the customer’s likelihood of returning to the same
service. The greater impact online relative to offline
may be due to the learning that occurs when informa-
tion search is easier, resulting in greater cognitive
lock-in to the service provider in the online environ-
ment (Johnson et al., 2002). This result, together with
the condition that search costs are typically lower
online than offline, suggests that website content and
the ability to access them at the time of decision-
making favorably impact loyalty online.
5.3. Effects of other variables, including control
variables
Among the control variables, customer perceptions
of the attributes of the service encounter such as
reputation, room amenities, customer service, and
ease of reservations are not statistically different
online versus offline. Customers perceived that they
got a more favorable price online than offline (Data
set 1), their location choices were better offline than
online (Data set 1), that it was easier to make
reservations online than offline (Data set 2), and that
those who had made the hotel choices online had
better prior experience with the service provider (Data
set 1) and were willing to spend more time online
than offline when choosing hotels (both data sets).
The actual time spent choosing a hotel online was
significantly higher at 2.97 versus 2.19 offline ( p<
0.001) on a 6-point scale, where 1 was anchored at
less than 5 min and 6 was anchored at more than 60
min (this data is not included in Tables 3a–3c
because we do not use this variable in our models).
This result was also replicated in Data set 2 (2.71
online versus 1.84 offline; p<0.01). Depth of infor-
mation at the website has a positive impact on service
encounter satisfaction ( p<0.05), but interactivity of
the website is not significant in either data set.
Apparently, content is more important than interac-
tivity in influencing customer satisfaction when cus-
tomers make choices online, a finding consistent with
what several Web gurus proclaim: ‘‘Ultimately, users
visit your website for its content. Everything else is
just the backdrop. The design is there to allow people
access to the content.’’ (Nielsen, 2000). Also, at the
time of this study, major hotel websites did not have
rich interactivity features, such as personalization.
Perhaps with increasing personalization features,
website interactivity could have a stronger influence
on service encounter satisfaction.
As expected, the service attributes have significant
effects in the expected direction on service encounter
satisfaction (Table 4). The fact that location has little
or no influence on service encounter satisfaction in
Data set 2 suggests that even if location is the most
important attribute influencing a customer’s choice of
a hotel, it does not determine satisfaction with the
service provider. Several control variables (e.g., prior
experience) have a statistically significant effect on
overall satisfaction and loyalty, consistent with Bolton
and Lemon (1999), Oliva et al. (1992), and Woodruff
et al. (1983). Generally, these variables have a slightly
larger impact on overall satisfaction and loyalty in
Data set 2 than in Data set 1.
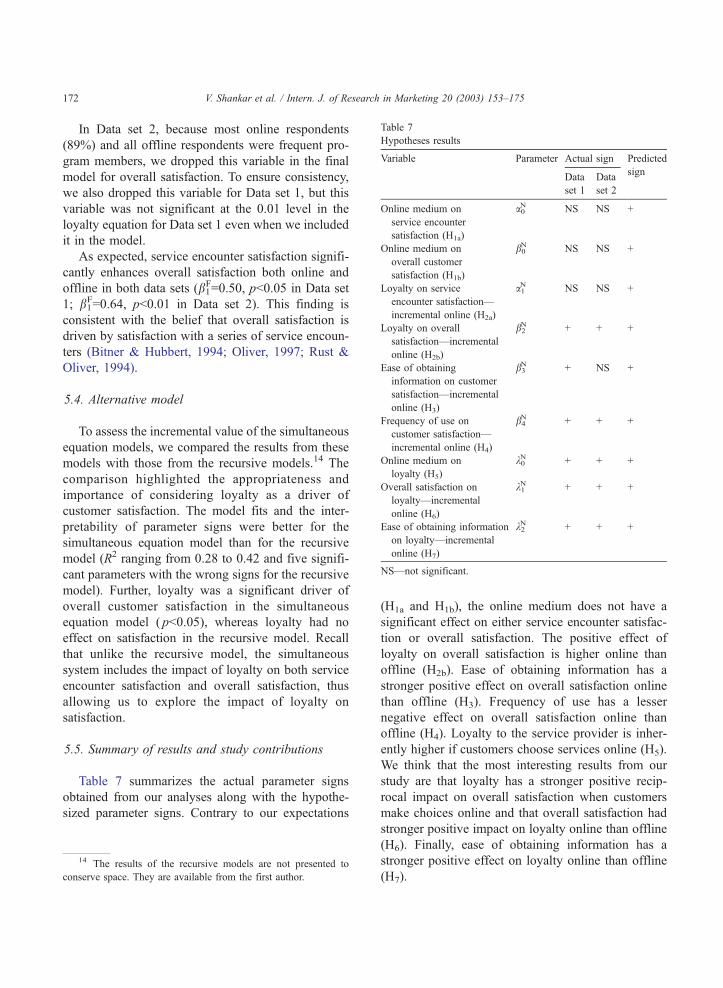
Table 7
Hypotheses results
Variable Parameter Actual sign Predicted
Data
set 1
Data
set 2
sign
Online medium on
service encounter
satisfaction (H1a)
a0N NS NS +
Online medium on
overall customer
satisfaction (H1b)
b0N NS NS +
Loyalty on service
encounter satisfaction—
incremental online (H2a)
a1N NS NS +
Loyalty on overall
satisfaction—incremental
online (H2b)
b2N + + +
Ease of obtaining
information on customer
satisfaction—incremental
online (H3)
b3N + NS +
Frequency of use on
customer satisfaction—
incremental online (H4)
b4N + + +
Online medium on
loyalty (H5)
k0N + + +
Overall satisfaction on
loyalty—incremental
online (H6)
k1N + + +
Ease of obtaining information
on loyalty—incremental
online (H7)
k2N + + +
NS—not significant.
V. Shankar et al. / Intern. J. of Research in Marketing 20 (2003) 153–175172
In Data set 2, because most online respondents
(89%) and all offline respondents were frequent pro-
gram members, we dropped this variable in the final
model for overall satisfaction. To ensure consistency,
we also dropped this variable for Data set 1, but this
variable was not significant at the 0.01 level in the
loyalty equation for Data set 1 even when we included
it in the model.
As expected, service encounter satisfaction signifi-
cantly enhances overall satisfaction both online and
offline in both data sets (b1F=0.50, p<0.05 in Data set
1; b1F=0.64, p<0.01 in Data set 2). This finding is
consistent with the belief that overall satisfaction is
driven by satisfaction with a series of service encoun-
ters (Bitner & Hubbert, 1994; Oliver, 1997; Rust &
Oliver, 1994).
5.4. Alternative model
To assess the incremental value of the simultaneous
equation models, we compared the results from these
models with those from the recursive models.14 The
comparison highlighted the appropriateness and
importance of considering loyalty as a driver of
customer satisfaction. The model fits and the inter-
pretability of parameter signs were better for the
simultaneous equation model than for the recursive
model (R2 ranging from 0.28 to 0.42 and five signifi-
cant parameters with the wrong signs for the recursive
model). Further, loyalty was a significant driver of
overall customer satisfaction in the simultaneous
equation model ( p<0.05), whereas loyalty had no
effect on satisfaction in the recursive model. Recall
that unlike the recursive model, the simultaneous
system includes the impact of loyalty on both service
encounter satisfaction and overall satisfaction, thus
allowing us to explore the impact of loyalty on
satisfaction.
5.5. Summary of results and study contributions
Table 7 summarizes the actual parameter signs
obtained from our analyses along with the hypothe-
sized parameter signs. Contrary to our expectations
14 The results of the recursive models are not presented to
conserve space. They are available from the first author.
(H1a and H1b), the online medium does not have a
significant effect on either service encounter satisfac-
tion or overall satisfaction. The positive effect of
loyalty on overall satisfaction is higher online than
offline (H2b). Ease of obtaining information has a
stronger positive effect on overall satisfaction online
than offline (H3). Frequency of use has a lesser
negative effect on overall satisfaction online than
offline (H4). Loyalty to the service provider is inher-
ently higher if customers choose services online (H5).
We think that the most interesting results from our
study are that loyalty has a stronger positive recip-
rocal impact on overall satisfaction when customers
make choices online and that overall satisfaction had
stronger positive impact on loyalty online than offline
(H6). Finally, ease of obtaining information has a
stronger positive effect on loyalty online than offline
(H7).
15 Although we have tried to get equivalent groups of online
and offline customers in Data set 2, the population of online users
could be systematically different from the population of offline
consumers, so our results apply mainly to the sampling frames used
in the study. Our results do not imply, for example, that service
providers seeking to improve customer loyalty would necessarily
benefit from a forceful conversion of offline customers to the online
medium. In fact, forceful conversion of those customers who prefer
to transact offline may likely diminish their loyalty.
V. Shankar et al. / Intern. J. of Research in Marketing 20 (2003) 153–175 173
Taken together, these results offer the following
answers to the questions that motivated our research.
We had hypothesized that the shopping medium
(online or offline) should affect both the efficiency
(effort, cost) and effectiveness (the actual hotel
chosen) of shopping, and therefore, we should expect
satisfaction with a service to be different when chosen
online versus offline. Surprisingly, our results did not
support this view, at least for the types of services that
we studied. This suggests that people care more about
the actual service received, which apparently is no
different whether the service is chosen online or
offline, i.e., customers make satisfaction-equivalent
choices, on average, regardless of whether they chose
the service provider (hotel) online or offline.
At the same time, customers exhibit greater loyalty
when they choose a hotel online, and the relationship
between overall satisfaction and loyalty is also higher
when the service is chosen online. This suggests that
either loyal customers shop online, or customers are
better able to express their loyalty online. The first
explanation is unlikely given that we find loyalty to be
higher online even in Data set 1, and also because
loyalty is not highly correlated with frequency of stay.
There is also a stronger reinforcing relationship
between loyalty and overall satisfaction in the online
environment. Together, overall satisfaction has a
stronger effect on loyalty online, and in turn, loyalty
has a stronger effect on overall satisfaction. Finally,
the online medium offers more information and makes
it easy for customers to access and use that informa-
tion, which also fosters loyalty to the service provider.
Our results have extended prior research in two
important ways. First, to our knowledge, this is the
first study to compare satisfaction and loyalty across
online and offline environments. Although there are
substantial similarities online and offline among the
determinants of satisfaction and loyalty and their
relationship (e.g., the effects of service attributes, the
determinants of service encounter satisfaction), the
study has identified some incremental effects (e.g.,
effects of the ease of obtaining information) and some
unique effects (e.g., depth of information at a website)
of the online medium. Second, our study has uncov-
ered a more complex relationship between satisfaction
and loyalty—these two variables have a reciprocal
relationship between them, an issue that has not been
explored in previous research.
6. Managerial implications, limitations, and
extensions
6.1. Managerial implications
Based on our study, we recommend the following
strategies and tactics for service providers.
6.1.1. Use the online medium to reinforce loyalty
Satisfaction builds loyalty, which reinforces satis-
faction, a phenomenon which is stronger online than
offline. Service marketers should consider developing
special loyalty-enhancing initiatives for their online
customers to reinforce overall satisfaction.15 For
example, a hotel offering rewards based on number
of hotel stays could (1) provide additional reward
points for booking online, (2) prominently feature
these rewards at its website, (3) enable customers to
keep track of their reward positions, and (4) proac-
tively remind or encourage customers to act when
they get close to their reward milestones. While some
companies have implemented the first three initia-
tives, not many are doing the fourth initiative.
6.1.2. Enhance the information content of the website
Our results show that the depth of information at
the website increases service encounter satisfaction,
which increases overall satisfaction, which, in turn,
has a mutually reinforcing relationship with loyalty.
Hotel marketers can enhance the depth of information
at their websites by including such content as local
weather, nearby attractions and restaurants, maps,
events that will be taking place in a locality in the
near future, a detailed list of amenities, pictures of
rooms, etc. Yet another promising way to enhance
content is for the service provider to partner with other
service providers in related markets (e.g., a nearby car
rental agency or nearby restaurants).

earch in Marketing 20 (2003) 153–175
6.1.3. Make information access as easy as possible on
the website
The finding that ease of obtaining information has a
stronger effect on both overall satisfaction and loyalty
online than offline has important implications. First, a
service provider should determine the appropriate
information needs of its customers. Second, it should
design a website so that the customer can access not
only all the relevant information but also access them
only when he/she needs it. Third, the company should
invest in technologies that search for the right informa-
tion and retrieve the information as quickly as possible.
Fourth, the company may want to focus on creating the
right user-interfaces that allow customers to access
information in the way that is most convenient for
them (e.g., on wireless device, without visuals, etc.).
6.1.4. Provide greater value to frequent online users
More frequent users seem to have greater overall
satisfaction when they choose the service provider
online than offline. This finding implies that compa-
nies should focus on increasing the frequency of use
by online customers. These could be provided in the
form of online promotions and incentives that offer
more hotel stays or free hotel stays for increased use
of the service.
6.2. Limitations and extensions
Our research has some limitations that should be
addressed by future research. First, a major limitation
is that we could not use multiple-item measures for
most of our constructs due to data collection restric-
tions imposed by the study sponsors. It might be
useful to replicate our study, perhaps in other service
industries, using multi-item measures. Second, to
enhance the generalizability of the findings, the study
should be extended to other industries with a different
set of contextual and competitive characteristics. For
example, it would be interesting to study industries in
which the entire service encounter including delivery
is either online or offline (e.g., financial services).
Third, it would be useful to explore whether loyalty to
service provider extends to brand loyalty, an issue that
would be particularly relevant for service providers
with multiple brands. Fourth, an analysis of the impact
of the medium on switching behavior would be a
worthwhile complement to the analysis of loyalty and
V. Shankar et al. / Intern. J. of Res174
customer satisfaction. This analysis is typically done
using longitudinal data. Finally, future research should
explicate the customer decision processes by which
alternative forms of loyalty, especially ultimate loyalty
(Oliver, 1999), are formed and maintained both online
and offline.
Acknowledgements
We thank Marriott International and HSMAI
Foundation for providing the data. We also thank
Hubert Gatignon, Ruth Bolton, Roland Rust, Richard
Oliver, three anonymous reviewers, the participants at
the 1999 INFORMS Marketing Science conference in
Syracuse, New York, and the participants at the 2000
Marketing Camp at the University of Texas at Austin
for their valuable comments.
References
Ahluwalia, R. H., Unnava, R., & Burnkrant, R. E. (1999). Towards
understanding the value of a loyal customer: an information-
processing perspective (Report No. 99–116). Cambridge, MA:
Marketing Science Institute.
Anderson, E. W., & Sullivan, M. W. (1993, Spring). The antecedents
and consequences of customer satisfaction for firms. Marketing
Science, 12, 125–143.
Baveja, S. S., Rastogi, S., Zook, C., Hancock, R. S., & Chu, J.
(2000). The value of online customer loyalty and how you can
capture it. Bain Consulting, eStrategy Brief, April 1, http://
www.bain.com/bainweb/publications/Written_By_Bain_detail.
asp?article_id=888.
Bearden, W. O., & Teel, J. E. (1983, February). Selected determi-
nants of consumer satisfaction and complaint reports. Journal of
Marketing Research, 20, 21–28.
Bitner, M. J., & Hubbert, A. R. (1994). Encounter satisfaction versus
overall satisfaction versus quality. In R. T. Rust, & R. L. Oliver
(Eds.), Service quality: new directions in theory and practice
( pp. 72–94). Thousand Oaks, CA: Sage Publications.
Bloemer, J. M. M., & Kasper, H. D. P. (1995). The complex relation-
ship between consumer satisfaction and brand loyalty. Journal of
Economic Psychology, 16, 311–329.
Bolton, R. N. (1998). A dynamic model of the duration of the
customer’s relationship with a continuous service provider: the
role of satisfaction. Marketing Science, 17(1), 45–65.
Bolton, R. N., & Drew, J. H. (1991, March). A multistage model of
customers’ assessments of service quality and value. Journal of
Consumer Research, 17, 375–384.
Bolton, R. N., & Lemon, K. N. (1999, May). A dynamic model of
customers’ usage of services: usage as an antecedent and con-
sequence of satisfaction. Journal of Marketing Research, 36,
171–186.
V. Shankar et al. / Intern. J. of Research in Marketing 20 (2003) 153–175 175
Cadotte, E. R., Woodruff, R. B., & Jenkins, R. L. (1987, August).
Expectations and norms in models of consumer satisfaction.
Journal of Marketing Research, 24, 305–314.
Chow, G. C. (1960). Tests of equality between sets of coefficients in
two linear regressions. Econometrica, 28, 591–605.
Comscore Online Spending Report (2002). Available at: http://
www.comscore.com/news/ecommerce_2001_review.htm.
Crosby, L. A., & Stephens, N. (1987, November). The effects of
relationship marketing on satisfaction, retention, and prices in
the life insurance industry. Journal of Marketing Research, 24,
404–411.
Day, G. S. (1969). A two-dimensional concept of brand loyalty.
Journal of Advertising Research, 9(3), 29–35.
Degeratu, A., Rangaswamy, A., & Wu, J. (2000). Consumer choice
behavior in online and traditional supermarkets: the effects of
brand name, price, and other search attributes. International
Journal of Research in Marketing, 17(1), 55–78.
Dhrymes, P. J. (1974). Econometrics: statistical foundations and
applications. New York: Springer.
Dick, A. S., & Basu, K. (1994). Customer loyalty: an integrated
conceptual framework. Journal of Academy of Marketing
Science, 22(2), 99–113.
Drolet, A. L., & Morrison, D. G. (2001). Do we really need multi-
ple-item measures in service research? Journal of Service Re-
search, 3(3), 196–204.
Glazer, R. (1991, October). Marketing in an information-intensive
environment: strategic implications of knowledge as an asset.
Journal of Marketing, 55, 1–19.
Glesjer, H. (1969). A new test for heteroscedasticity. Journal of the
American Statistical Association, 64, 316–323.
Intelliquest (1997). Worldwide internet/online tracking study.
Available at: www.intelliquest.com.
Johnson, E. J., Bellman, S., & Lohse, G. L. (2002). Cognitive lock-
in and the power law of practice (Working Paper). New York:
Columbia University.
Johnson, E. J., & Payne, J. W. (1985). Effort and accuracy in choice.
Management Science, 31(4), 395–414.
Kahneman, D., & Tversky, A. (1979, March). Prospect theory:
an analysis of decisions under risk. Econometrica, 47,
263–291.
Lynch Jr., J., & Ariely, D. (2000). Wine online: search costs affect
competition on price, quality and distribution. Marketing Sci-
ence, 19(1), 83–104.
Marmorstein, H., Grewal, D., & Fisher, R. P. H. (1992). The value
of time spent in price-comparison shopping: survey and exper-
imental evidence. Journal of Consumer, 52–61.
Meuter, M. L., Ostrom, A. L., Roundtree, R. I., & Bitner, M. J.
(2000, July). Self-service technologies: understanding customer
satisfaction with technology-based service encounters. Journal
of Marketing, 64, 50–64.
Mittal, V., Ross Jr., W. T., & Baldasare, P. M. (1998, January). The
asymmetric impact of negative and positive attribute-level per-
formance on overall satisfaction and repurchase intentions.
Journal of Marketing, 62, 33–47.
Nielsen, J. (2000). Designing web usability: the practice of sim-
plicity. Indianapolis, IN: New Riders Publishing.
Oliva, T. A., Oliver, R. L., & MacMillan, I. C. (1992, July). A
catastrophe model for developing service satisfaction strategies.
Journal of Marketing, 56, 83–95.
Oliver, R. L. (1980, November). A cognitive model of the antece-
dents and consequences of satisfaction decisions. Journal of
Marketing Research, 17, 460–469.
Oliver, R. L. (1993, December). Cognitive, affective and attribute
bases of the satisfaction response. Journal of Consumer Re-
search, 20, 418–430.
Oliver, R. L. (1997). Satisfaction: a behavioral perspective on the
consumer. New York: Irwin/McGraw-Hill.
Oliver, R. L. (1999). Whence consumer loyalty? Journal of Market-
ing, 63, 33–44 (Special Issue).
Pritchard, M. P., & Howard, D. R. (1997, Spring). The loyal trav-
eler: examining a typology of service patronage. Journal of
Travel Research, 35, 2–10.
Reicheld, F. F. (1996, March–April). Learning from customer de-
fections. Harvard Business Review, 56–69.
Rust, R., Inman, J. J., Jia, J., & Zahorik, A. (1999). What you don’t
know about customer-perceived quality: the role of customer
expectation distributions. Marketing Science, 18(1), 77–92.
Rust, R., & Oliver, R. L. (1994). Service quality: new directions in
theory and practice (pp. 72–94). Thousand Oaks, CA: Sage
Publications.
Rust, R., & Zahorik, A. (1993). Customer satisfaction, customer
retention, and market share. Journal of Retailing, 69(2),
193–216.
Rust, R., Zeithaml, V., & Lemon, K. (2000). Driving customer
equity. Boston, MA: Free Press.
Shankar, V., Rangaswamy, A., & Pusateri, M. (2001). The online
medium and price sensitivity (Working Paper). College Park,
MD: University of Maryland.
Silk, A. J., & Urban, G. L. (1978, May). Pre-test market evaluation
of new packaged goods: a model and measurement methodol-
ogy. Journal of Marketing Research, 15, 171–191.
Spreng, R. A., MacKenzie, S. B., & Olshavsky, R. W. (1996, July).
A reexamination of the determinants of consumer satisfaction.
Journal of Marketing, 60(3), 15–32.
Vredenburg, H., & Wee, C. H. (1986). The role of customer service
in determining customer satisfaction. Journal of the Academy of
Marketing Science, 14(2), 17–26.
Wind, J., & Rangaswamy, A. (2001). Customerization: the next
revolution in mass customization. Journal of Interactive Market-
ing, 15(1), 13–32.
Woodruff, R. B., Cadotte, E. R., & Jenkins, R. L. (1983, August).
Modeling consumer satisfaction processes using experience-
based norms. Journal of Marketing Research, 20, 296–304.
Wu, J., & Rangaswamy, A. (2003). A fuzzy set model of consid-
eration set formation calibrated on data from an online super-
market. Marketing Science (in press).
Zeithaml, V. A., Berry, L., & Parasuraman, A. (1993, Winter). The
nature and determinants of customer expectations of service.
Journal of the Academy of Marketing Science, 21(1), 1–12.
Recommended