Optimal Design For A Mass Spectrometer Vacuum-pump Cover that Reduces Pump Noise and Facilitates Oil Changes
Robert D. Ricker, Bernard J. Permar II, Lindy Miller, Jerome Szczepaniak, Viet Nguyen, and Patricia Castelli
Agilent Technologies, 2850 Centerville Rd., Life Science/Chemical Analysis, Wilmington, DE 19808, USA
Pittcon 2006
Orlando, FL, USASAUHPLC of Polyphenols in WineJudy Berry, John W. Henderson Jr., William Long Agilent Technologies 2850 Centerville Rd. Wilmington Del. USA 19808 Pittsburgh Conference , Orlando, Florida, USA 2010
References
Method Parameters
Abstract Identification of Polyphenols in Red Wine with an RRHD SB-C18 2.1 x 150mm 1.8 μm Column
Introduction
Peak Capacity
Enhanced Resolution with Longer Column Lengths
Increase in Peak Capacity with
Column Length
Optimum Wavelength Increases
S/N for Resveratrol
Conclusion
Generating high peak capacity is necessary for the analysis
of complex samples in order to reduce the number of
overlapping peaks. Greater peak capacity and resolution can
be easily obtained for gradient analysis of complex samples
such as wine, by using the higher efficiency of sub-2 micron
particles in longer column lengths. This was confirmed by a
43% increase in peak capacity for the analysis of 19
polyphenol standards when the column length of a narrow
bore Agilent ZORBAX Rapid Resolution High Definition
(RRHD) StableBond SB-C18 column was increased from
100mm to 200mm. An additional 15% improvement in peak
capacity was achieved by increasing the column length an
extra 100mm to 300mm. The data show that higher quality
separations can be achieved using longer column lengths
and is demonstrated by the analysis of polyphenols in wine.
The Agilent 1290 Infinity LC system was used because the
increased column length resulted not only in a significant
improvement in resolution, but also system pressures in the600-1000 bar range.
Red wine is a very complex mixture and a rich source of
polyphenols, a class of compounds that has gained
considerable interest due to research suggesting their many
health-related benefits. In addition, polyphenols are quality
attributes of wine and contribute to color and sensory
properties such as flavor and astringency. Given the
importance of polyphenols and the complexity of wine
samples, a method of analysis is required that gives the
necessary peak capacity so that accurate identification and
quantitation are achieved. This work shows the influence of
column length on peak capacity for gradient analysis of
complex samples.
A noticeable increase in resolution and peak detail is observed for the 4 – 11
minute segment of the red wine chromatogram to the left for the 150mm
column as compared to the 100mm column. The red-circled areas are just
three examples of several where resolution has improved with the 150mm
SB-C18 column. The above chromatograms show significant increases in
resolution and peak capacity with column length for three polyphenols.
The method for the 100mm column length is easily transferred to
longer column lengths by increasing the gradient times
proportionally with column length.
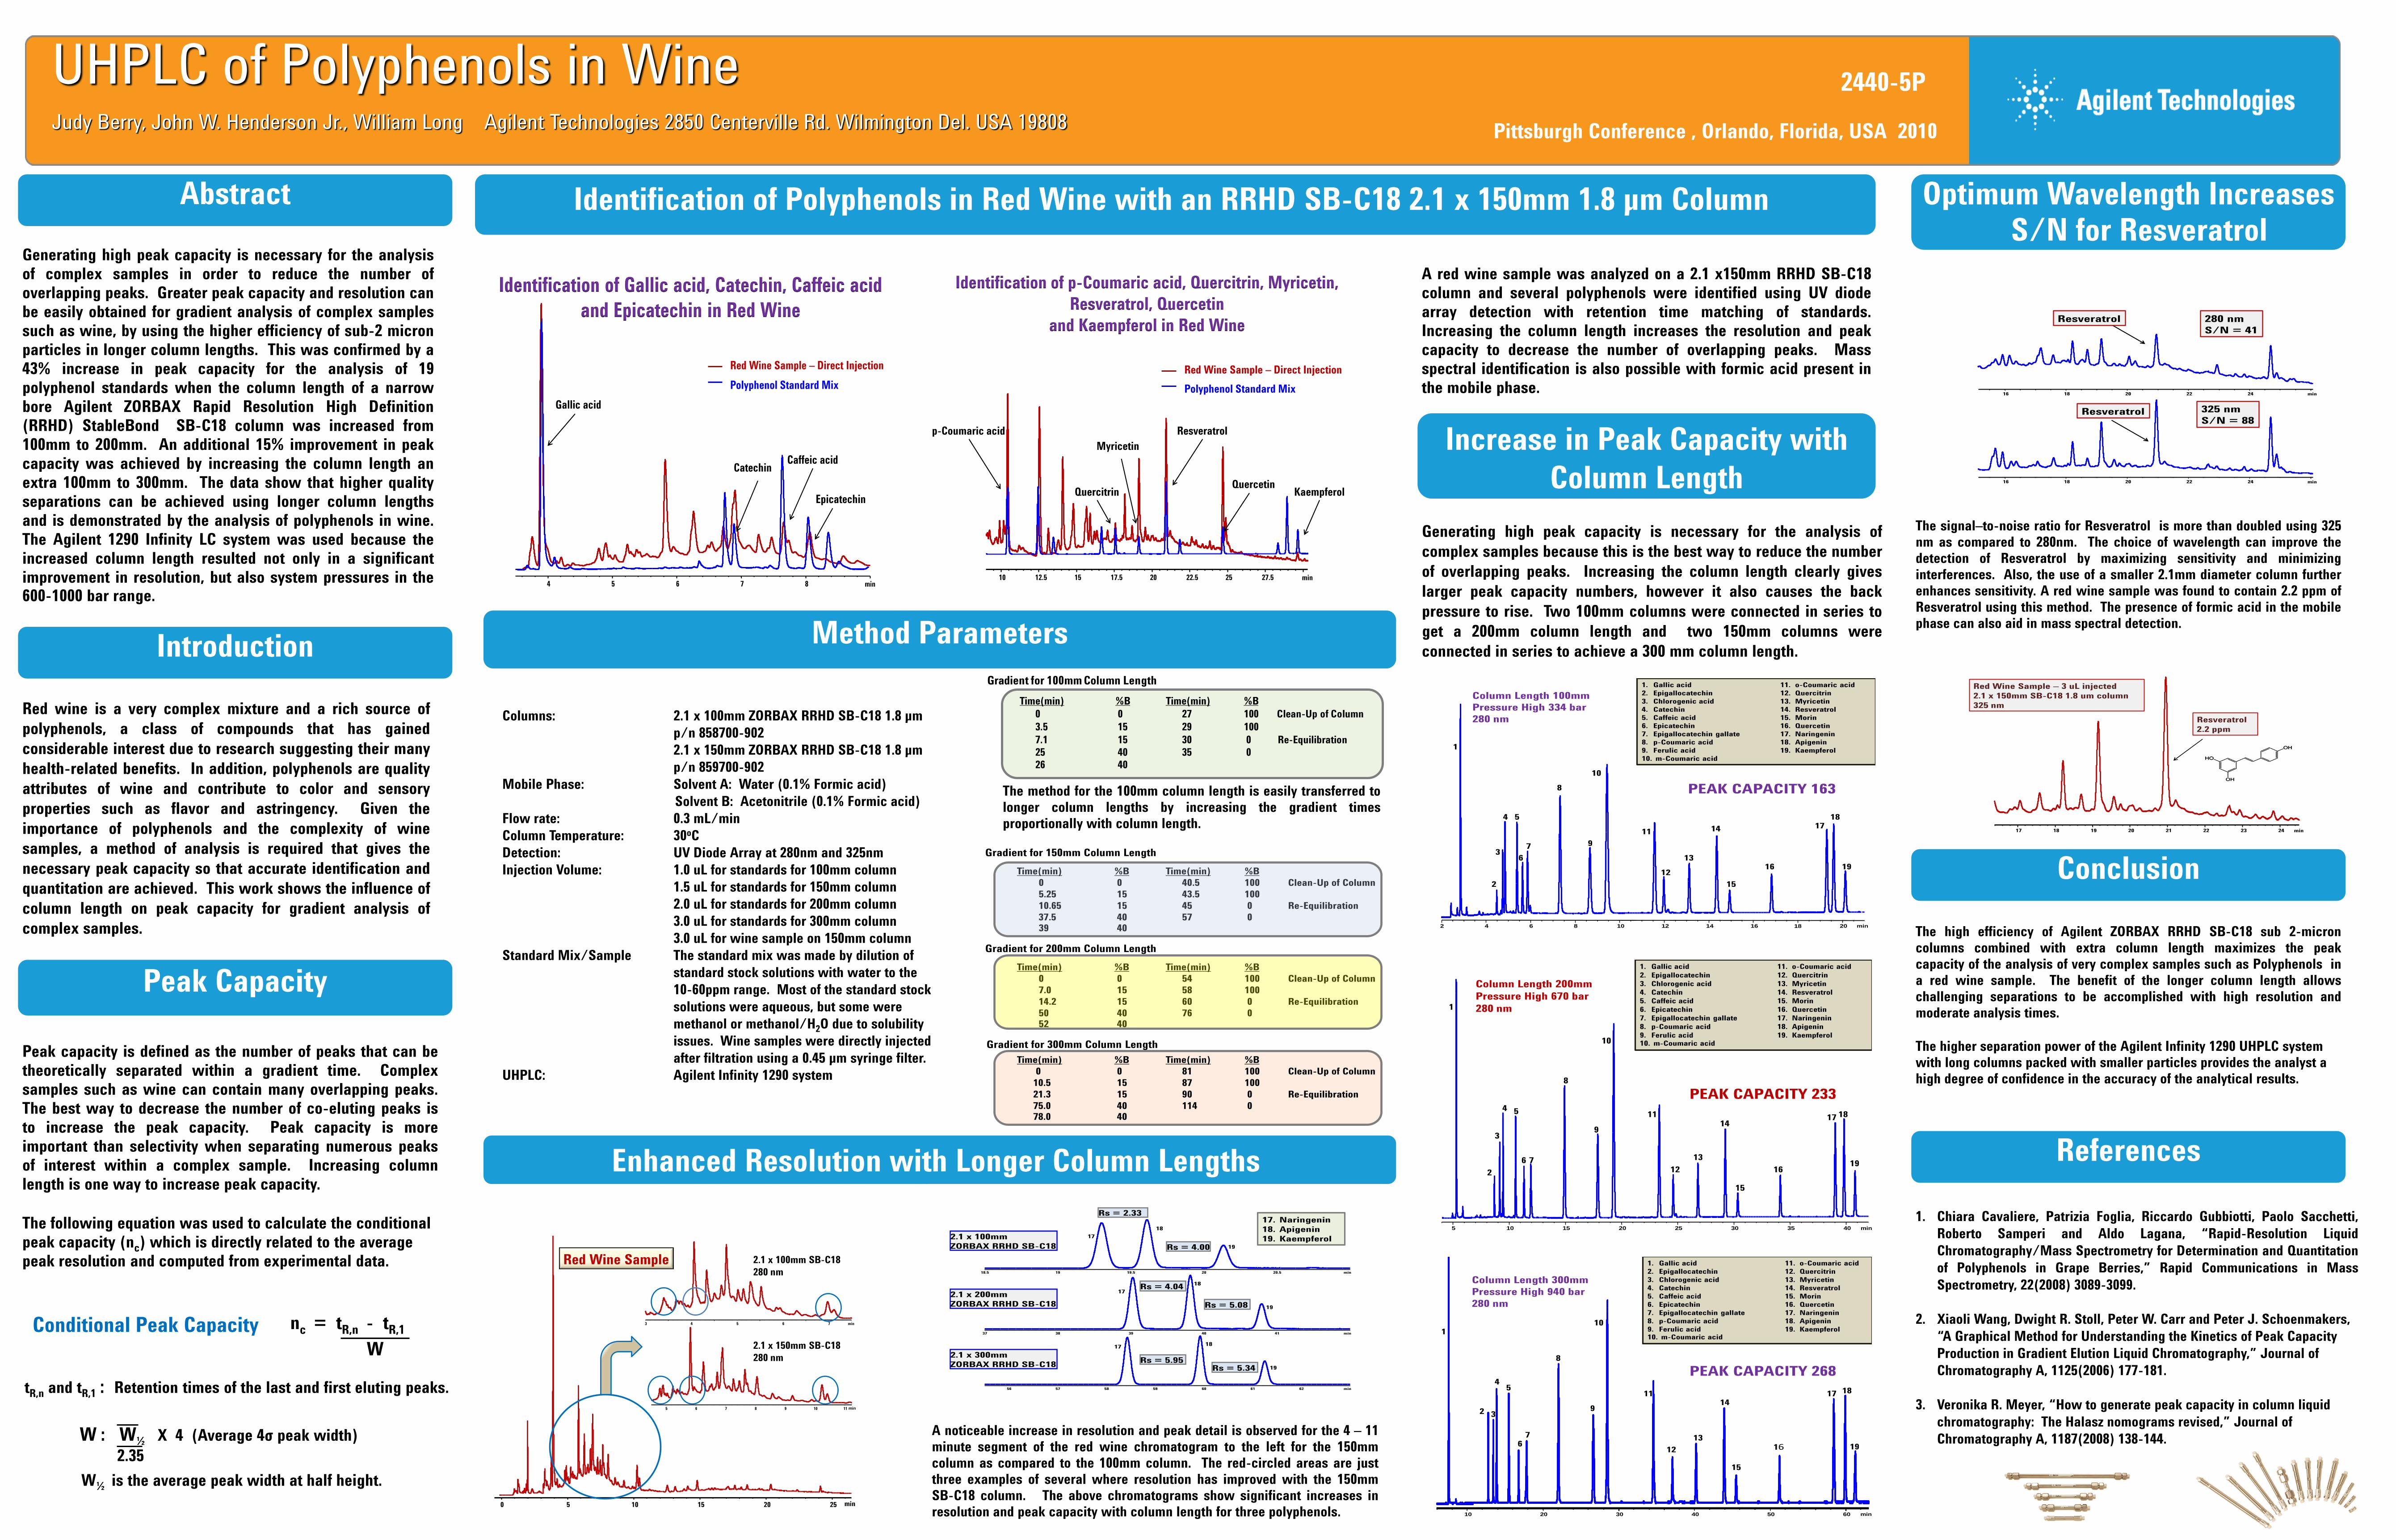
The signal–to-noise ratio for Resveratrol is more than doubled using 325
nm as compared to 280nm. The choice of wavelength can improve the
detection of Resveratrol by maximizing sensitivity and minimizing
interferences. Also, the use of a smaller 2.1mm diameter column further
enhances sensitivity. A red wine sample was found to contain 2.2 ppm of
Resveratrol using this method. The presence of formic acid in the mobile
phase can also aid in mass spectral detection.
Generating high peak capacity is necessary for the analysis of
complex samples because this is the best way to reduce the number
of overlapping peaks. Increasing the column length clearly gives
larger peak capacity numbers, however it also causes the back
pressure to rise. Two 100mm columns were connected in series to
get a 200mm column length and two 150mm columns were
connected in series to achieve a 300 mm column length.
min0 5 10 15 20 25
min3 4 5 6 7
min5 6 7 8 9 10 11
2.1 x 100mm SB-C18
280 nm
2.1 x 150mm SB-C18
280 nm
Red Wine Sample
The high efficiency of Agilent ZORBAX RRHD SB-C18 sub 2-micron
columns combined with extra column length maximizes the peak
capacity of the analysis of very complex samples such as Polyphenols in
a red wine sample. The benefit of the longer column length allows
challenging separations to be accomplished with high resolution and
moderate analysis times.
The higher separation power of the Agilent Infinity 1290 UHPLC system
with long columns packed with smaller particles provides the analyst a
high degree of confidence in the accuracy of the analytical results.
1. Chiara Cavaliere, Patrizia Foglia, Riccardo Gubbiotti, Paolo Sacchetti,
Roberto Samperi and Aldo Lagana, “Rapid-Resolution Liquid
Chromatography/Mass Spectrometry for Determination and Quantitation
of Polyphenols in Grape Berries,” Rapid Communications in Mass
Spectrometry, 22(2008) 3089-3099.
2. Xiaoli Wang, Dwight R. Stoll, Peter W. Carr and Peter J. Schoenmakers,
“A Graphical Method for Understanding the Kinetics of Peak Capacity
Production in Gradient Elution Liquid Chromatography,” Journal of
Chromatography A, 1125(2006) 177-181.
3. Veronika R. Meyer, “How to generate peak capacity in column liquid
chromatography: The Halasz nomograms revised,” Journal of
Chromatography A, 1187(2008) 138-144.
A red wine sample was analyzed on a 2.1 x150mm RRHD SB-C18
column and several polyphenols were identified using UV diode
array detection with retention time matching of standards.
Increasing the column length increases the resolution and peak
capacity to decrease the number of overlapping peaks. Mass
spectral identification is also possible with formic acid present in
the mobile phase.
Peak capacity is defined as the number of peaks that can be
theoretically separated within a gradient time. Complex
samples such as wine can contain many overlapping peaks.
The best way to decrease the number of co-eluting peaks is
to increase the peak capacity. Peak capacity is more
important than selectivity when separating numerous peaks
of interest within a complex sample. Increasing column
length is one way to increase peak capacity.
The following equation was used to calculate the conditional
peak capacity (nc) which is directly related to the average
peak resolution and computed from experimental data.
Columns: 2.1 x 100mm ZORBAX RRHD SB-C18 1.8 μm
p/n 858700-902
2.1 x 150mm ZORBAX RRHD SB-C18 1.8 μm
p/n 859700-902
Mobile Phase: Solvent A: Water (0.1% Formic acid)
Solvent B: Acetonitrile (0.1% Formic acid)
Flow rate: 0.3 mL/min
Column Temperature: 30oC
Detection: UV Diode Array at 280nm and 325nm
Injection Volume: 1.0 uL for standards for 100mm column
1.5 uL for standards for 150mm column
2.0 uL for standards for 200mm column
3.0 uL for standards for 300mm column
3.0 uL for wine sample on 150mm column
Standard Mix/Sample The standard mix was made by dilution of
standard stock solutions with water to the
10-60ppm range. Most of the standard stock
solutions were aqueous, but some were
methanol or methanol/H2O due to solubility
issues. Wine samples were directly injected
after filtration using a 0.45 μm syringe filter.
UHPLC: Agilent Infinity 1290 system
Conditional Peak Capacity nc = tR,n - tR,1
W
tR,n and tR,1 : Retention times of the last and first eluting peaks.
W : W½ X 4 (Average 4σ peak width)
2.35
W½ is the average peak width at half height.
min10 12.5 15 17.5 20 22.5 25 27.5
KaempferolQuercetin
Resveratrol
Myricetin
Quercitrin
p-Coumaric acid
Red Wine Sample – Direct Injection
Polyphenol Standard Mix
Identification of p-Coumaric acid, Quercitrin, Myricetin,
Resveratrol, Quercetin
and Kaempferol in Red Wine
min4 5 6 7 8
Gallic acid
CatechinCaffeic acid
Epicatechin
Red Wine Sample – Direct Injection
Polyphenol Standard Mix
Identification of Gallic acid, Catechin, Caffeic acid
and Epicatechin in Red Wine
min16 18 20 22 24
min16 18 20 22 24
280 nm
S/N = 41
325 nm
S/N = 88Resveratrol
Resveratrol
min17 18 19 20 21 22 23 24
Red Wine Sample – 3 uL injected
2.1 x 150mm SB-C18 1.8 um column
325 nm
Resveratrol
2.2 ppm
min18.5 19 19.5 20 20.5
min37 38 39 40 41
min56 57 58 59 60 61 62
Rs = 2.33
Rs = 4.00
Rs = 4.04
Rs = 5.08
Rs = 5.95Rs = 5.34
2.1 x 100mm
ZORBAX RRHD SB-C18
2.1 x 200mm
ZORBAX RRHD SB-C18
2.1 x 300mm
ZORBAX RRHD SB-C18
17. Naringenin
18. Apigenin
19. Kaempferol17
18
19
17
18
19
1718
19
min2 4 6 8 10 12 14 16 18 20
1. Gallic acid 11. o-Coumaric acid
2. Epigallocatechin 12. Quercitrin
3. Chlorogenic acid 13. Myricetin
4. Catechin 14. Resveratrol
5. Caffeic acid 15. Morin
6. Epicatechin 16. Quercetin
7. Epigallocatechin gallate 17. Naringenin
8. p-Coumaric acid 18. Apigenin
9. Ferulic acid 19. Kaempferol
10. m-Coumaric acid
1
2
3
4 5
6
7
8
9
10
11
12
13
14
15
16
1718
19
Column Length 100mm
Pressure High 334 bar
280 nm
PEAK CAPACITY 163
min5 10 15 20 25 30 35 40
Column Length 200mm
Pressure High 670 bar
280 nm
1. Gallic acid 11. o-Coumaric acid
2. Epigallocatechin 12. Quercitrin
3. Chlorogenic acid 13. Myricetin
4. Catechin 14. Resveratrol
5. Caffeic acid 15. Morin
6. Epicatechin 16. Quercetin
7. Epigallocatechin gallate 17. Naringenin
8. p-Coumaric acid 18. Apigenin
9. Ferulic acid 19. Kaempferol
10. m-Coumaric acid
1
2
3
4 5
6 7
8
9
10
11
12
13
14
15
16
17 18
19
PEAK CAPACITY 233
min10 20 30 40 50 60
Column Length 300mm
Pressure High 940 bar
280 nm
1. Gallic acid 11. o-Coumaric acid
2. Epigallocatechin 12. Quercitrin
3. Chlorogenic acid 13. Myricetin
4. Catechin 14. Resveratrol
5. Caffeic acid 15. Morin
6. Epicatechin 16. Quercetin
7. Epigallocatechin gallate 17. Naringenin
8. p-Coumaric acid 18. Apigenin
9. Ferulic acid 19. Kaempferol
10. m-Coumaric acid1
2 3
45
67
8
9
10
11
12
13
14
15
16
17 18
19
PEAK CAPACITY 268
2440-5P
Gradient for 100mm Column Length
Time(min) %B Time(min) %B
0 0 27 100 Clean-Up of Column
3.5 15 29 100
7.1 15 30 0 Re-Equilibration
25 40 35 0
26 40
Time(min) %B Time(min) %B
0 0 40.5 100 Clean-Up of Column
5.25 15 43.5 100
10.65 15 45 0 Re-Equilibration
37.5 40 57 0
39 40
Gradient for 200mm Column Length
Time(min) %B Time(min) %B
0 0 54 100 Clean-Up of Column
7.0 15 58 100
14.2 15 60 0 Re-Equilibration
50 40 76 0
52 40
Gradient for 300mm Column Length
Time(min) %B Time(min) %B
0 0 81 100 Clean-Up of Column
10.5 15 87 100
21.3 15 90 0 Re-Equilibration
75.0 40 114 0
78.0 40
Gradient for 150mm Column Length
Recommended