City of Edmonton Graffiti Vandalism Audit 2014 Prepared by: MGM Management April 2015 – EXECUTIVE SUMMARY

City of Edmonton Graffiti Vandalism Audit - 2014
EXECUTIVE SUMMARY
1
Table of Contents
Acknowledgements ......................................................................................................................... 3
Executive Summary ......................................................................................................................... 4
Table ES-1 Summary ....................................................................................................................... 5
Figure ES-1 Locations & Tag Summary ........................................................................................... 5
Introduction & Background ............................................................................................................. 8
Audit Methodology ....................................................................................................................... 10
City Graffiti Vandalism Observations ............................................................................................ 11
Choosing Neighbourhoods for Auditing ........................................................................................ 12
Selecting Hot Spot & Random Sample Areas ................................................................................ 13
Results of the Edmonton Audit ..................................................................................................... 15
Neighbourhood Graffiti Index & Rankings .................................................................................... 16
Size & Descriptor of Graffiti .......................................................................................................... 22
Target Properties & Categories ..................................................................................................... 25
Location Intensity Rating (LIR) ...................................................................................................... 28
Conclusions .................................................................................................................................... 31
APPENDIX A – Overview Audit Sample Locations ......................................................................... 33
APPENDIX B - Graffiti Observation Locations (Examples) ............................................................. 34
APPENDIX C – Glossary of Terms .................................................................................................. 37
Figure 1 – City Graffiti Observations (2008 - 2010) .................................................................................... 11
Figure 2 – Hot Spot & Random Sample Areas............................................................................................. 12
Figure 3 – Locations & Tag Count Summary ............................................................................................... 15
Figure 4 – Combined Graffiti Index Results - by Neighbourhood ............................................................... 18

City of Edmonton Graffiti Vandalism Audit - 2014
EXECUTIVE SUMMARY
2
Table 1 – Area of Hot Spots & Random Sample (Hectares) ........................................................................ 13
Table 2 – Neighbourhood Graffiti Index Results 2014 ................................................................................ 16
Table 3 – Combined Neighbourhood Graffiti Index Results 2014 .............................................................. 17
Table 4 – Graffiti Occurrence by Neighbourhood Sampled ........................................................................ 19
Table 5 – Comparison of Graffiti 2014 vs. 2013 Neighbourhoods .............................................................. 20
Table 6 – Graffiti Observed in 2014 is Mainly Small ................................................................................... 22
Table 7 – Summary of Graffiti Vandalism Observed in 2014 ...................................................................... 23
Table 8 – Graffiti Categories ....................................................................................................................... 24
Table 9 – Graffiti Targets & Category Results ............................................................................................. 26
Table 10 – Location Intensity Rating Analysis (2012-2014) ........................................................................ 29
Table 11 – Location Intensity Index – Top 50 Sites ..................................................................................... 30

City of Edmonton Graffiti Vandalism Audit - 2014
EXECUTIVE SUMMARY
3
Acknowledgements
Community Relations, Community Standards, Community Services
• Don Belanger, Acting Director, Community Relations, Community Standards Branch • Sharon Chapman, Senior Program Planner, Community Relations, Community Standards
Branch • Diana Kim, Research and Report Writer, Community Relations, Community Standards
Branch
Complaints & Investigations, Community Standards, Community Services
• Tiffany Sustrik, Supervisor, Complaints & Investigations, Community Standards • Mandi Friesen, Municipal Enforcement Officer, Complaints & Investigations, Community
Standards • Dan Bak, Municipal Enforcement Officer, Complaints & Investigations, Community
Standards • Amanda Lau, Municipal Enforcement Officer, Complaints & Investigations, Community
Standards • Ryan Podgurney, Municipal Enforcement Officer, Complaints & Investigations, Community
Standards • Chris Samy, Municipal Enforcement Officer, Complaints & Investigations, Community
Standards
Capital City Clean Up Operations Committee
• Chris Fowler, Waste Management & Utility Services Branch • Tim O’Donnell, Neighbourhood Parks and Community Recreation Branch • Don Turene, Transportation Operations Branch • Troy Courtoreille, Complaints and Investigations, Community Standards Branch • Trevor Dennehy, Edmonton Transit • Bruce Kobialko, Project Management and Maintenance Services • Grant Blaines, Community Peace Officers, Community Standards Branch
Information Technology
• Tim Beauchamp, BSS Coordinator – POSSE/PeopleSoft – Enhance, Corporate Services, Information Technology

City of Edmonton Graffiti Vandalism Audit - 2014
EXECUTIVE SUMMARY
4
Executive Summary The City of Edmonton engaged MGM Management, a British Columbia consulting firm, to design and conduct a graffiti vandalism audit in selected neighbourhoods within the City. The first graffiti vandalism audit occurred in November of 2010, with repeat audits in 2011, October 2012, October 2013 and October 2014. This report presents the results for observations made in October 2014, during the fifth graffiti vandalism audit conducted in Edmonton.
MGM Management specializes in environmental auditing, and has conducted seven litter audits (2007, 2009, 2010, 2011, 2012, 2013 and 2014) and four previous graffiti vandalism audits for the City of Edmonton, as well as 26 environmental audits for other clients in Canada and the USA.
Graffiti vandalism is a public nuisance offense that causes damage to public and private property. Graffiti is different from litter as it is both a bylaw infraction and criminal act (mischief under the Criminal Code of Canada). During each of Edmonton's graffiti audits the consultant examined graffiti vandalism in the most active neighbourhoods where graffiti is documented in Edmonton. Edmonton has 367 designated neighbourhoods. It would be cost and time prohibitive to audit all 367 of them, therefore a sample of neighbourhoods was used for audit purposes.
Graffiti auditing for 2014 has been done in the same 20 Edmonton neighbourhoods which have been audited since 2010. The neighbourhoods represent those with the highest incidents of graffiti complaints from citizens. In 2012, five neighbourhoods were added to increase the sample size of the audit. These five neighbourhoods were selected on the basis of greatest change in complaints from 2012 compared to 2011 incident reports in the City’s “POSSE” database. In 2013, these neighbourhoods were not sampled as it was recognized after the 2012 audit that these locations had insignificant levels of graffiti present.
In each of the chosen target neighbourhoods, a “hot spot sample area” and a “random sample area” were selected. Hot spot areas were those where significant reports of graffiti vandalism had been recorded in the City’s data system. For each sample area the consultant selected an area of 4 city blocks by 4 city blocks representing a size of approximately 20-25 hectares. For comparison a “random” area, the same approximate size as the “hot spot” was selected in each of the 20 neighbourhoods being audited. These “random areas” were selected from areas within the neighbourhood where there had been fewer or no reports of graffiti.
During the 2014 graffiti audit, the audit crew observed graffiti vandalism at 352 locations where graffiti vandalism was present, a reduction from 395 locations in 2013, representing an 11% decrease in locations compared to 2013. In these locations, 1,071 graffiti tags were observed in the current audit, compared to 1,413 tags in 2013, a decrease of 24% over the previous year.

City of Edmonton Graffiti Vandalism Audit - 2014
EXECUTIVE SUMMARY
5
Table ES-1 Summary
During the 2014 audit there were 11% fewer locations observed with graffiti present and 24% fewer tags observed, within the 20 original neighbourhoods examined, compared to the 2013.
Figure ES-1 Locations & Tag Summary
2014 2013 2012 2011 2010Locations
Total Locations where graffiti observed 352 395 438 543 646
Change from previous year -10.9% -9.8% -19.3% -15.9%Change from 2012 -19.6%Change from 2011 -35.2%Change from 2010 -45.5%
Graffiti Tags Graffiti tags observed in 20 neighbourhoods 1,071 1,413 1,116 1,133 1,978
Change from previous year -24.2% 26.6% -1.5% -42.7%Change from 2012 -4.0%Change from 2011 -5.5%Change from 2010 -45.9%
646543
438 395352
1978
11331116
1413
1071
0
500
1000
1500
2000
2500
2010 2011 2012 2013 2014
LOCATIONS
TAGS
11% reduction in locations since 2013
24% decrease in tags in 2014 compared to 2013

City of Edmonton Graffiti Vandalism Audit - 2014
EXECUTIVE SUMMARY
6
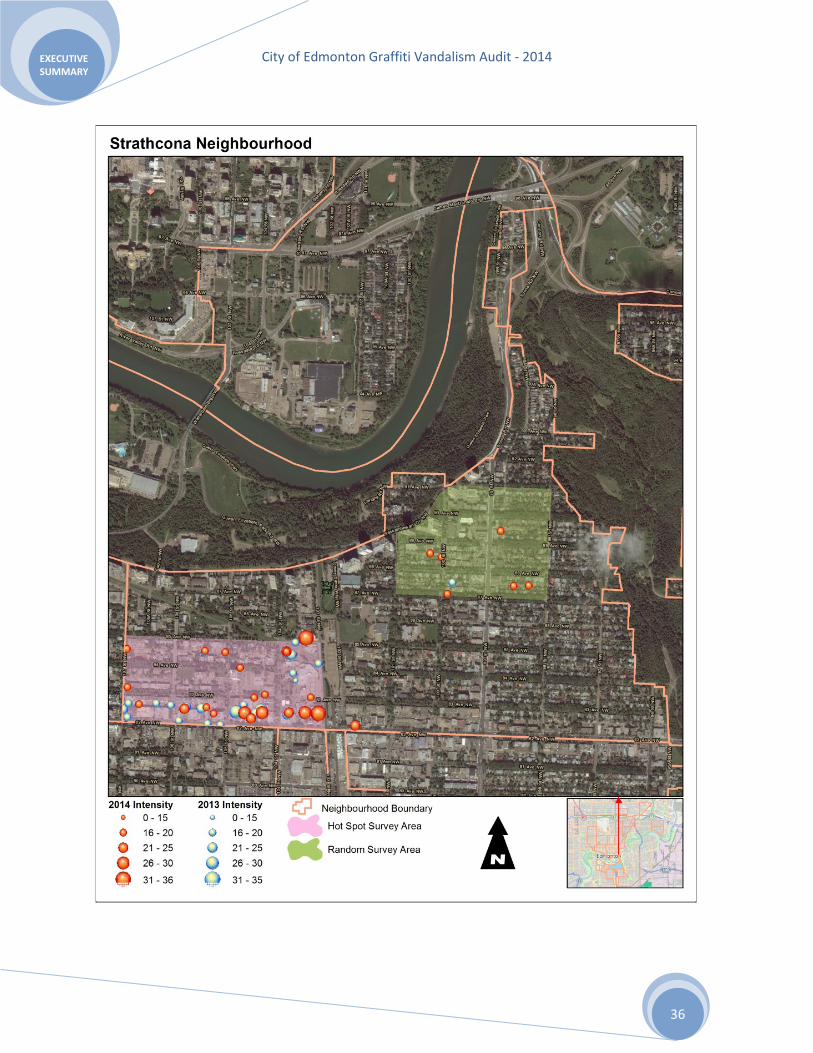
A significant observation of the current graffiti audit is that, in the Downtown neighbourhood, graffiti decreased from 325 tags in 2013 to 225 in 2014, a 31% decrease. There was also a significant decrease in the Strathcona neighbourhood where graffiti tags decreased from 203 tags in 2013 to 135 in 2014, a 33% decrease. Tags in Garneau also diminished from 120 tags in 2013 to 72 in 2014, a 40% decrease. In 2013 the largest contributors of tags came from those three neighbourhoods, which combined represented 46% of all graffiti observed.
The largest contributors of tags observed during the 2014 audit were from the Downtown, Strathcona and Boyle Street neighbourhoods, a result of the decrease in graffiti found in Garneau and an increase in the Boyle Street neighbourhood. Graffiti observed in these three neighbourhoods accounts for 42.8% of the total tags found in the 2014 audit with Downtown, Strathcona and Boyle Street representing 21%, 12.6% and 9.2% respectively.
The greatest increase in observed graffiti tags occurred in Beverly Heights (400% increase from 2 tags to 10); Ritchie with a 359% increase (from 17 to 78 tags) and in Queen Mary neighbourhood with a 96% increase (from 24 to 47 tags).
During the 2014 audit, the audit team traveled over 560 kilometres within Edmonton’s 20 sample neighbourhoods, on streets, in alleys and in laneways recording graffiti observations. During the course of this audit over 1,200 photographs were taken recording the graffiti observed. A comprehensive database was created to archive and analyse the data collected. Paper records, electronic data records and digital photographic records were archived to preserve the data gathered.
The method used by the City of Edmonton, as developed by the consultant for this audit provides a repeatable and unbiased way of auditing neighbourhoods for graffiti vandalism. The neighbourhoods examined in this audit can be examined in the future to determine whether the amount of graffiti vandalism is increasing or decreasing. During the 2014 graffiti vandalism audit the consultant calculated a Location Intensity Rating (LIR) to examine the amount and intensity of graffiti at each of the 352 locations. For comparison purposes these intensities (LIR) of graffiti are plotted on neighbourhood maps in Appendix B showing graffiti locations and LIRs for 2014 and 2013. Consistent with observing fewer graffiti tags in 2014, was the behavior of the graffiti index in 2014 compared to previous years. The graffiti index is a measure of the amount of graffiti observed per geographic area (hectares). This index decreased in 2014 from a combined index of 1.243 in 2013 to 0.932 in 2014. During the 2014 field work, auditors were accompanied by a City of Edmonton Municipal Enforcement Officer, from the Complaints and Investigations Section of the Community Standards Branch. The identification of taggers has been enhanced by having city staff participating in the audit, due to their skills as Municipal Enforcement Officers in reading tagger names.
City of Edmonton Graffiti Vandalism Audit - 2014
EXECUTIVE SUMMARY
7
During the 2014 audit the number of taggers observed was 400, compared to 424 taggers in 2013, 305 graffiti taggers in 2012 and 379 in 2011.
Most graffiti tags are small in size covering less than 0.185 sq.m (2 sq.ft.). In the current audit there were proportionately more small tags than in 2013 audit. In the 2014 audit 83% of the tags were small tags compared to 73% 2013. A similar proportion of medium sized tags (>2sq.ft. <9 sq.ft.) was seen in 2014 (11% in 2014 and 13% in 2013).
The graffiti observed in 2014 was predominantly “marker / plain” graffiti (92% in 2014 and 93% in 2013). This is graffiti that is textual or stylized in nature, and is in no way artistic in its design.
The removal of postal boxes by Canada Post Edmonton streets continues to provide a reduction of graffiti throughout the City. The consultant noted that the proportion of total graffiti on city assets (signs, ETS, park furniture etc.) has increased slightly in 2014, which may be a result of the removal of postal boxes.
Commercial waste bins, parking lot barricades, signs and posts continue to be common targets for taggers. Private residential and multi-family residential properties are often targets of graffiti vandals, especially on fences and garages in back alleys and laneways. In the 2014 audit the consultant observed that murals, throughout the City, were not generally defaced by graffiti tags. This reinforces previous observations that in general graffiti vandals avoid tagging murals.

City of Edmonton Graffiti Vandalism Audit - 2014
EXECUTIVE SUMMARY
8
Introduction & Background Graffiti vandalism is a property vandalism crime that places a financial burden on public and private property owners. Graffiti vandalism defaces property, resulting in significant cleanup efforts and remediation costs in a large municipality like Edmonton.
The City of Edmonton’s Capital City Clean Up (CCCU) program operates an active Graffiti Management Program (GMP). The Capital City Clean Up program provides support to property owners in understanding graffiti vandalism, removing graffiti, and engages the community in sharing the responsibility for graffiti vandalism prevention and removal.
Due to increased public concern and awareness, Community Standards Bylaw 14600, section 9, was amended effective April 1, 2008, requiring owners to remove graffiti vandalism from their properties upon notification. Community Standards bylaw enforcement allows for the issuing of a $250 ticket in the event of non-compliance. The City can also cause a forced cleaning to be implemented under the Municipal Government Act, with municipal assets conducting the cleanup. These costs are transferred back to the property owner by adding the cost to the tax roll for the specific property.
In 2008, in order to increase enforcement and removal, CCCU proactively created an inventory of graffiti vandalism in the City. In this inventory it was not possible to collect detailed information on the graffiti vandalism at each location. The inventory served as a starting point for graffiti enforcement in the spring of 2009. Subsequently, a second inventory was completed by City of Edmonton graffiti removal staff from November 1, 2009 to April 1, 2010.
Since 2008, information regarding graffiti has been gathered by the City through complaints and documentation from bylaw officers. This information has been entered into the City’s “POSSE” data management system for investigation and follow-up. Staff determined that some graffiti data was inaccurate or incomplete causing difficulties in follow-up activities for bylaw officers to conduct enforcement. Data entered into the City’s “POSSE” data management system formed the basis of designing the first graffiti audit in 2010, and has been used, as the source of data, in choosing which neighbourhoods would be sampled in graffiti vandalism audits. Information assembled on taggers and locations of graffiti is shared with the Edmonton Police Service to assist police in their investigations and to improve the success of charges laid for graffiti offences.
In October 2010, the City and MGM Management developed and implemented a method for auditing the graffiti vandalism in selected neighbourhoods in Edmonton. Using audit techniques the City is now able to compare the occurrence of graffiti offences in given neighbourhoods and has a new tool to compare graffiti vandalism intensity from one year to the next.
City bylaw enforcement staff have issued clean up notices to property owners based on the information gathered from the 2010, 2011, 2012 and 2013 Graffiti Vandalism Audits. This process has proven to be effective in identifying and reducing graffiti occurrences in Edmonton.

City of Edmonton Graffiti Vandalism Audit - 2014
EXECUTIVE SUMMARY
9
Commencing in mid-October 2014, the City conducted its fourth Graffiti Vandalism Audit. The original 20 neighbourhoods, examined in 2010, 2011 and 2013 were audited again in 2014.
By conducting graffiti audits Edmonton has developed a method for evaluating the occurrence and the intensity of graffiti vandalism in selected neighbourhoods. The results provide unbiased information about the street names (tagger names) of graffiti vandals while examining the types and size of graffiti vandalism and target properties where graffiti is placed.
This report describes how the 2014 graffiti audit was conducted and provides results based upon field audit observations.
The debate on graffiti street art versus graffiti vandalism has long been a contentious issue for Edmontonians. The City of Edmonton is committed to promoting safer, cleaner communities by reducing and preventing graffiti vandalism, while at the same time recognizing the artistic and cultural value street art can add when done tastefully, with permission and so that it does not contravene the Community Standards bylaw.

City of Edmonton Graffiti Vandalism Audit - 2014
EXECUTIVE SUMMARY
10
Audit Methodology Before the 2010 audit was conducted, the City of Edmonton (COE) searched existing literature sources to determine what services were available to conduct graffiti vandalism audits. It became evident that methods for auditing graffiti vandalism were not readily available in Canada or elsewhere. City of Edmonton staff in cooperation with MGM Management, a B.C. based environmental consulting firm, designed a method for auditing graffiti vandalism. The baseline audit was carried out in early November 2010. Subsequently a repeat graffiti vandalism audit was done in late October/early November in 2011 and 2012, and again in October 2013 and 2014 to determine changes in graffiti behaviour as compared to the baseline work.
MGM Management has extensive experience designing and conducting environmental audits. MGM Management has completed over 30 environmental audits for municipal and provincial clients since 2002.
Edmonton's use of a standardized method of observing graffiti, as a periodic audit of portions of the city, has become a reliable way of examining whether the occurrence of graffiti vandalism is changing over time. This method was recently adopted by the City of Hamilton in Ontario, who after consultation with the City of Edmonton, chose to use the same methodology for auditing graffiti vandalism in that municipality.
In addition to this graffiti study, this firm has completed seven litter audits for the City of Edmonton, in 2007, 2009, 2010, 2011, 2012, 2013 and 2014.
City of Edmonton Graffiti Vandalism Audit - 2014
EXECUTIVE SUMMARY
11
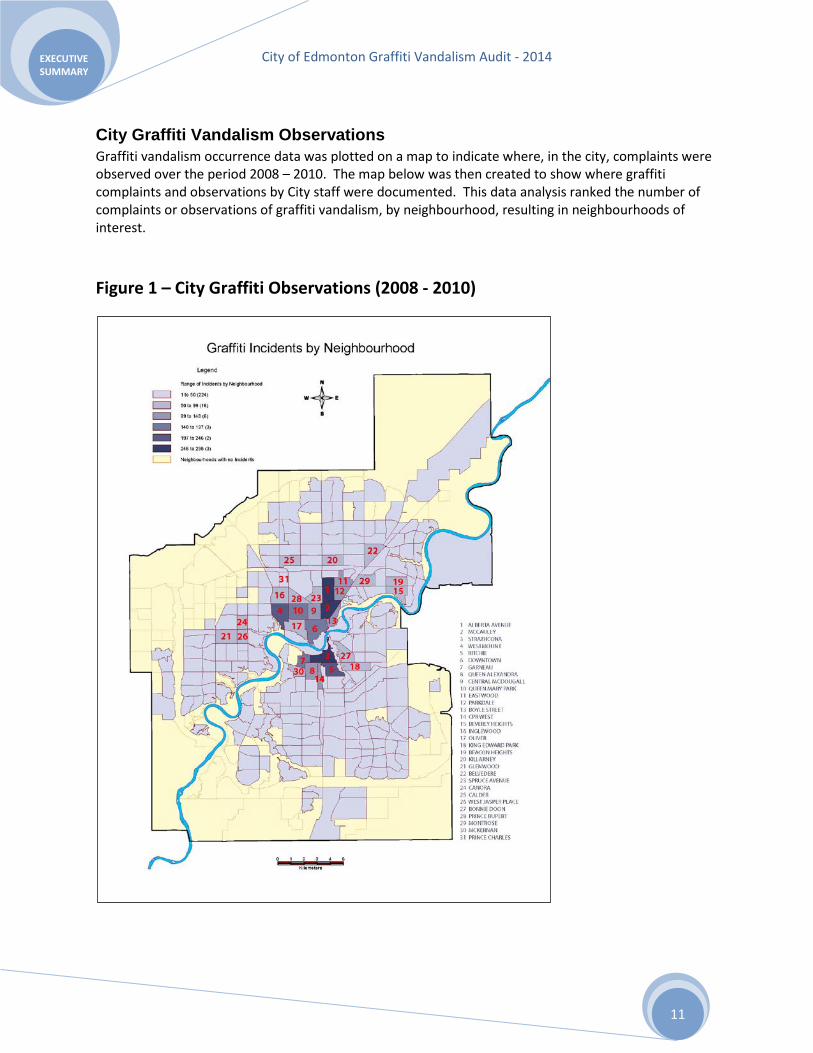
City Graffiti Vandalism Observations Graffiti vandalism occurrence data was plotted on a map to indicate where, in the city, complaints were observed over the period 2008 – 2010. The map below was then created to show where graffiti complaints and observations by City staff were documented. This data analysis ranked the number of complaints or observations of graffiti vandalism, by neighbourhood, resulting in neighbourhoods of interest.
Figure 1 – City Graffiti Observations (2008 - 2010)

City of Edmonton Graffiti Vandalism Audit - 2014
EXECUTIVE SUMMARY
12
Choosing Neighbourhoods for Auditing The City of Edmonton's graffiti data was used in 2010 to select the 20 original neighbourhoods that had the most significant reports of graffiti occurrences. The same neighbourhoods were audited in 2010, 2011, 2012, 2013 and for this audit in 2014.
Figure 2 – Hot Spot & Random Sample Areas

City of Edmonton Graffiti Vandalism Audit - 2014
EXECUTIVE SUMMARY
13
Selecting Hot Spot & Random Sample Areas Upon considering reported graffiti vandalism data, the locations of complaints and bylaw enforcement observations were examined based upon available municipal addresses within neighbourhoods of interest. From this assessment, the consultant identified an area within each target neighbourhood as a “hot spot”, meaning an area within each neighbourhood that historically had the largest occurrences of graffiti vandalism for that neighbourhood. For control purposes a second sample area within each neighbourhood was selected and termed a “random” sample area. These random areas were chosen to act as a control during the audit, regardless of whether or not there were documented graffiti vandalism activities in that part of the neighbourhood.
In order to keep neighbourhood sample size manageable, the consultant selected areas that were approximately 4 city blocks by 4 city blocks in size. This approximate size of 16 square city blocks was used for both “hot spot” and “random” sample areas. Using geospatial software techniques the exact geographical areas of each hot spot and random area were calculated, in hectares as presented in Table 1, below.
Table 1 – Area of Hot Spots & Random Sample (Hectares)
Sample areas were about 29 hectares (or just under 1/3 of a square kilometre in size) and proved to be a manageable size for field audit personnel. Due to the presence of alleys and laneways in some neighbourhoods and the shapes of some neighbourhoods, not all sample areas were square configurations.
Type NeighbourhoodArea
(Hectare)Area - (Sq. Kilometre) Type
Neighbourhood
Area (Hectare)
Area - (Sq. Kilometre)
Hot Spot Alberta Avenue 22.630 0.226 Hot Spot Inglewood 43.320 0.433Random Alberta Avenue 28.122 0.281 Random Inglewood 23.952 0.240
Hot Spot Beacon Heights 28.684 0.287 Hot Spot Killarney 29.299 0.293Random Beacon Heights 28.751 0.288 Random Killarney 23.275 0.233
Hot Spot Belvedere 25.922 0.259 Hot Spot McCauley 19.642 0.196Random Belvedere 34.713 0.347 Random McCauley 31.754 0.318
Hot Spot Beverley Heights 22.595 0.226 Hot Spot Oliver 32.319 0.323Random Beverley Heights 16.177 0.162 Random Oliver 28.786 0.288
Hot Spot Boyle Street 34.843 0.348 Hot Spot Parkdale 30.974 0.310Random Boyle Street 22.789 0.228 Random Parkdale 29.567 0.296
Hot Spot Central McDougall 40.769 0.408 Hot Spot Queen Alexandra 24.777 0.248Random Central McDougall 37.056 0.371 Random Queen Alexandra 26.733 0.267
Hot Spot CPR West/Strathcona Junction 13.335 0.133 Hot Spot Queen Mary Park 34.241 0.342Random CPR West/Strathcona Junction 26.033 0.260 Random Queen Mary Park 40.592 0.406
Hot Spot Downtown 50.673 0.507 Hot Spot Ritchie 25.696 0.257Random Downtown 48.353 0.484 Random Ritchie 34.079 0.341
Hot Spot Eastwood 28.204 0.282 Hot Spot Strathcona 23.828 0.238Random Eastwood 33.188 0.332 Random Strathcona 21.288 0.213
Hot Spot Garneau 16.279 0.163 Hot Spot Westmount 21.045 0.210Random Garneau 20.389 0.204 Random Westmount 24.678 0.247
Average area Sample size 28.70 0.287Hectare Sq. Km

City of Edmonton Graffiti Vandalism Audit - 2014
EXECUTIVE SUMMARY
14
Appendix A provides an overview map of the 20 neighbourhoods and the graffiti audit areas examined within those neighbourhoods.
Appendix B provides a sample of maps of graffiti observation locations in three of the original 20 neighbourhoods examined during the 2014 audit, and compared graffiti intensity to 2013 results.
City of Edmonton Graffiti Vandalism Audit - 2014
EXECUTIVE SUMMARY
15
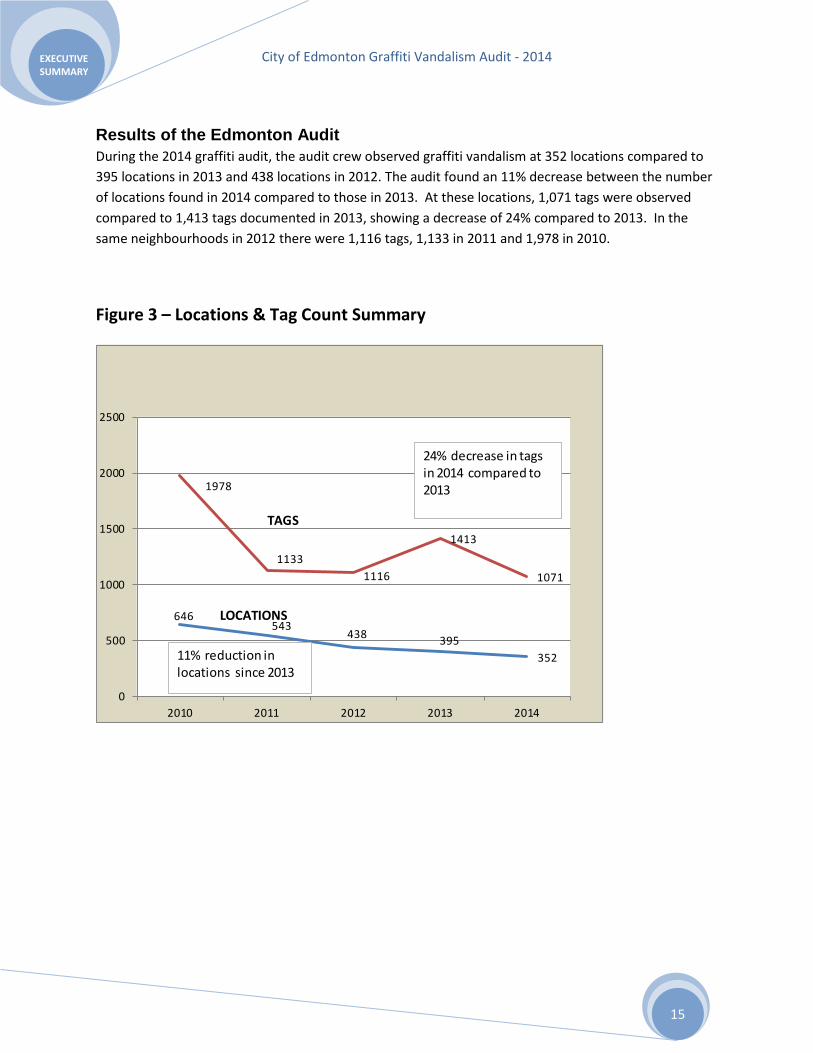
Results of the Edmonton Audit During the 2014 graffiti audit, the audit crew observed graffiti vandalism at 352 locations compared to 395 locations in 2013 and 438 locations in 2012. The audit found an 11% decrease between the number of locations found in 2014 compared to those in 2013. At these locations, 1,071 tags were observed compared to 1,413 tags documented in 2013, showing a decrease of 24% compared to 2013. In the same neighbourhoods in 2012 there were 1,116 tags, 1,133 in 2011 and 1,978 in 2010.
Figure 3 – Locations & Tag Count Summary
646543
438 395352
1978
11331116
1413
1071
0
500
1000
1500
2000
2500
2010 2011 2012 2013 2014
LOCATIONS
TAGS
11% reduction in locations since 2013
24% decrease in tags in 2014 compared to 2013

City of Edmonton Graffiti Vandalism Audit - 2014
EXECUTIVE SUMMARY
16
Neighbourhood Graffiti Index & Rankings A graffiti index was determined for each overall neighbourhood examined and for each individual “hot spot” and “random” sample area. Table 7 presents the “graffiti index” for each sample area.
Table 2 – Neighbourhood Graffiti Index Results 2014
The graffiti index is a way of examining the observations of graffiti in an indexed numerical comparison. Above in Table 7, we present the graffiti indexes for the "hot spot" and the "random areas." In Table 8, on the next page, the combined graffiti index for each neighbourhood is presented.
For the hot spot areas within each neighbourhood, the average graffiti index was slightly higher in 2014 at 1.528 compared to 1.375 in 2013. However, for the random sample areas the average graffiti index dropped significantly from 1.160 in 2013 to 0.46 in 2014, indicating significantly less graffiti activity in these sample areas during the current year.
Graffiti in Hot Spot
2014
Area Hot (Ha)
Index Hot Spot 2014
Index Hot Spot 2013
Index Hot Spot 2012
Index Hot Spot 2011
Index Hot Spot 2010
Graffiti in Random
2014
Area Random
(Ha)
Index Random
2014
Index Random
2013
Index Random
2012
Index Random
2011
Index Random
2010
Alberta Ave 25 22.63 1.105 0.972 1.061 0.354 0.930 8 28.122 0.284 0.605 1.458 0.462 1.740Beacon Heights 2 28.68 0.070 0.209 0.070 0.279 0.310 0 28.751 0.000 0.243 0.104 0.139 0.590Belvedere 47 25.92 1.813 0.964 1.080 1.505 0.690 0 34.713 0.000 0.893 0.375 0.173 0.320Beverly Heights 6 22.60 0.266 0.000 0.044 0.310 0.270 4 16.177 0.247 0.124 0.371 0.000 0.370Boyle Street 90 34.84 2.583 1.808 0.603 0.804 4.510 9 22.789 0.395 0.395 2.677 4.564 0.970Central McDougall 7 40.77 0.172 0.343 1.030 0.687 1.350 16 37.056 0.432 0.783 1.403 1.565 2.190CPR West/Strathcona Junction
57 13.33 4.275 3.225 1.200 1.350 1.420 9 26.033 0.346 0.653 0.038 0.307 0.150
Downtown 103 50.67 2.033 2.112 1.164 2.408 6.240 122 48.353 2.523 4.508 1.779 3.206 2.520Eastwood 19 28.20 0.674 2.376 1.241 0.461 1.630 14 33.188 0.422 1.175 0.362 0.271 0.510Garneau 57 16.28 3.501 6.266 3.563 0.614 4.610 15 20.389 0.736 0.883 2.060 0.981 2.600Inglewood 4 43.32 0.092 0.185 0.439 0.508 1.130 3 23.952 0.125 0.083 0.209 0.292 0.290Killarney 6 29.30 0.205 0.785 0.546 0.375 0.610 20 23.275 0.859 0.129 1.332 0.602 1.680McCauley 12 19.64 0.611 0.356 1.578 0.204 0.660 31 31.754 0.976 1.732 1.071 1.134 1.980Oliver 7 32.32 0.217 1.145 0.278 1.857 3.160 3 28.786 0.104 0.278 0.625 0.730 0.490Parkdale 5 30.97 0.161 1.259 0.581 0.291 0.610 4 29.567 0.135 0.406 0.203 0.101 0.740Queen Alexandra 77 24.78 3.108 4.480 0.646 1.493 1.740 2 26.733 0.075 0.337 0.037 0.262 0.970Queen Mary Park 20 34.24 0.584 0.146 1.782 0.993 0.730 27 40.592 0.665 0.468 0.665 0.616 0.860Ritchie 78 25.70 3.036 0.195 1.245 1.323 2.840 0 34.079 0.000 0.352 0.029 0.029 0.230Strathcona 124 23.83 5.204 0.336 4.155 3.819 8.790 11 21.288 0.517 9.160 0.752 0.658 0.700Westmount 18 21.05 0.855 0.336 2.613 1.330 3.560 9 24.678 0.365 0.000 0.851 0.689 1.740
Total 764 Average 1.528 307 Average 0.460Comparison - Original 20 neighbourhoods 1.375 1.188 0.928 1.978 1.160 0.731 0.679 0.956
City of Edmonton Graffiti Vandalism Audit - 2014
EXECUTIVE SUMMARY
17
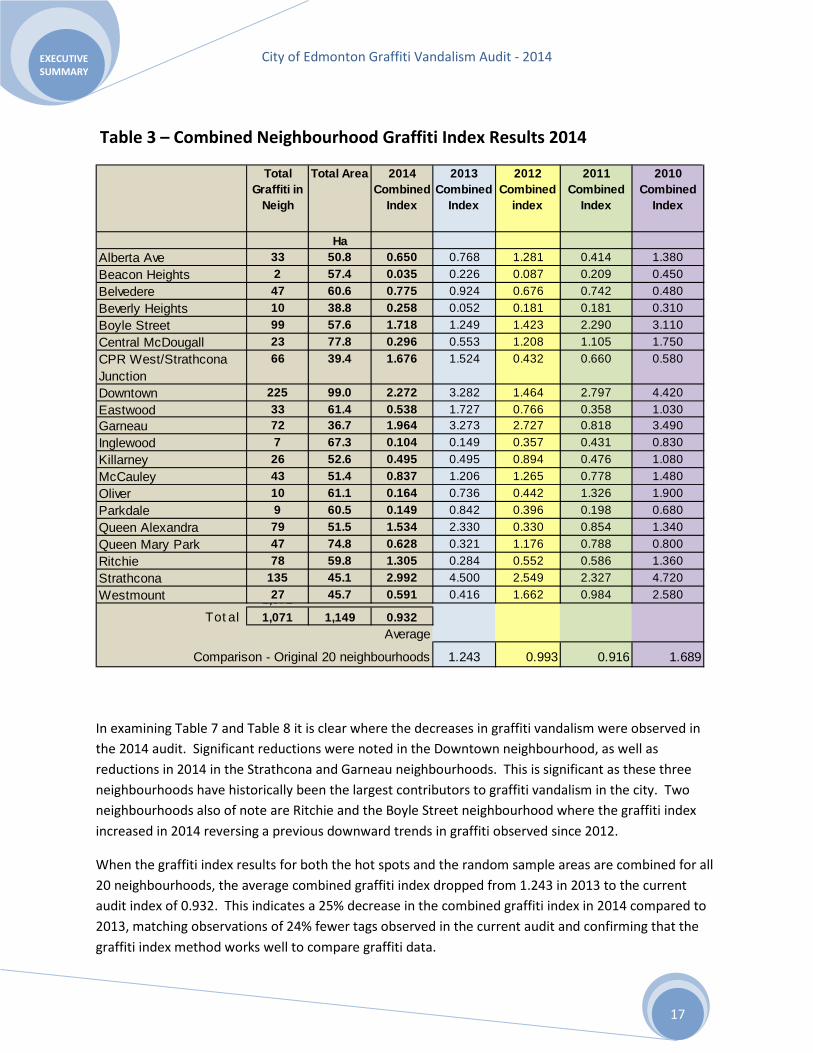
Table 3 – Combined Neighbourhood Graffiti Index Results 2014
In examining Table 7 and Table 8 it is clear where the decreases in graffiti vandalism were observed in the 2014 audit. Significant reductions were noted in the Downtown neighbourhood, as well as reductions in 2014 in the Strathcona and Garneau neighbourhoods. This is significant as these three neighbourhoods have historically been the largest contributors to graffiti vandalism in the city. Two neighbourhoods also of note are Ritchie and the Boyle Street neighbourhood where the graffiti index increased in 2014 reversing a previous downward trends in graffiti observed since 2012.
When the graffiti index results for both the hot spots and the random sample areas are combined for all 20 neighbourhoods, the average combined graffiti index dropped from 1.243 in 2013 to the current audit index of 0.932. This indicates a 25% decrease in the combined graffiti index in 2014 compared to 2013, matching observations of 24% fewer tags observed in the current audit and confirming that the graffiti index method works well to compare graffiti data.
Total Graffiti in
Neigh
Total Area 2014 Combined
Index
2013 Combined
Index
2012 Combined
index
2011 Combined
Index
2010 Combined
Index
HaAlberta Ave 33 50.8 0.650 0.768 1.281 0.414 1.380Beacon Heights 2 57.4 0.035 0.226 0.087 0.209 0.450Belvedere 47 60.6 0.775 0.924 0.676 0.742 0.480Beverly Heights 10 38.8 0.258 0.052 0.181 0.181 0.310Boyle Street 99 57.6 1.718 1.249 1.423 2.290 3.110Central McDougall 23 77.8 0.296 0.553 1.208 1.105 1.750CPR West/Strathcona Junction
66 39.4 1.676 1.524 0.432 0.660 0.580
Downtown 225 99.0 2.272 3.282 1.464 2.797 4.420Eastwood 33 61.4 0.538 1.727 0.766 0.358 1.030Garneau 72 36.7 1.964 3.273 2.727 0.818 3.490Inglewood 7 67.3 0.104 0.149 0.357 0.431 0.830Killarney 26 52.6 0.495 0.495 0.894 0.476 1.080McCauley 43 51.4 0.837 1.206 1.265 0.778 1.480Oliver 10 61.1 0.164 0.736 0.442 1.326 1.900Parkdale 9 60.5 0.149 0.842 0.396 0.198 0.680Queen Alexandra 79 51.5 1.534 2.330 0.330 0.854 1.340Queen Mary Park 47 74.8 0.628 0.321 1.176 0.788 0.800Ritchie 78 59.8 1.305 0.284 0.552 0.586 1.360Strathcona 135 45.1 2.992 4.500 2.549 2.327 4.720Westmount 27 45.7 0.591 0.416 1.662 0.984 2.5801,071
Total 1,071 1,149 0.932Average
Comparison - Original 20 neighbourhoods 1.243 0.993 0.916 1.689

City of Edmonton Graffiti Vandalism Audit - 2014
EXECUTIVE SUMMARY
18
Figure 4 – Combined Graffiti Index Results - by Neighbourhood
0.000
1.000
2.000
3.000
4.000
5.000
Combined Graffiti Index - 2010 - 2014
2010 2011 2012 2013 2014
City of Edmonton Graffiti Vandalism Audit - 2014
EXECUTIVE SUMMARY
19
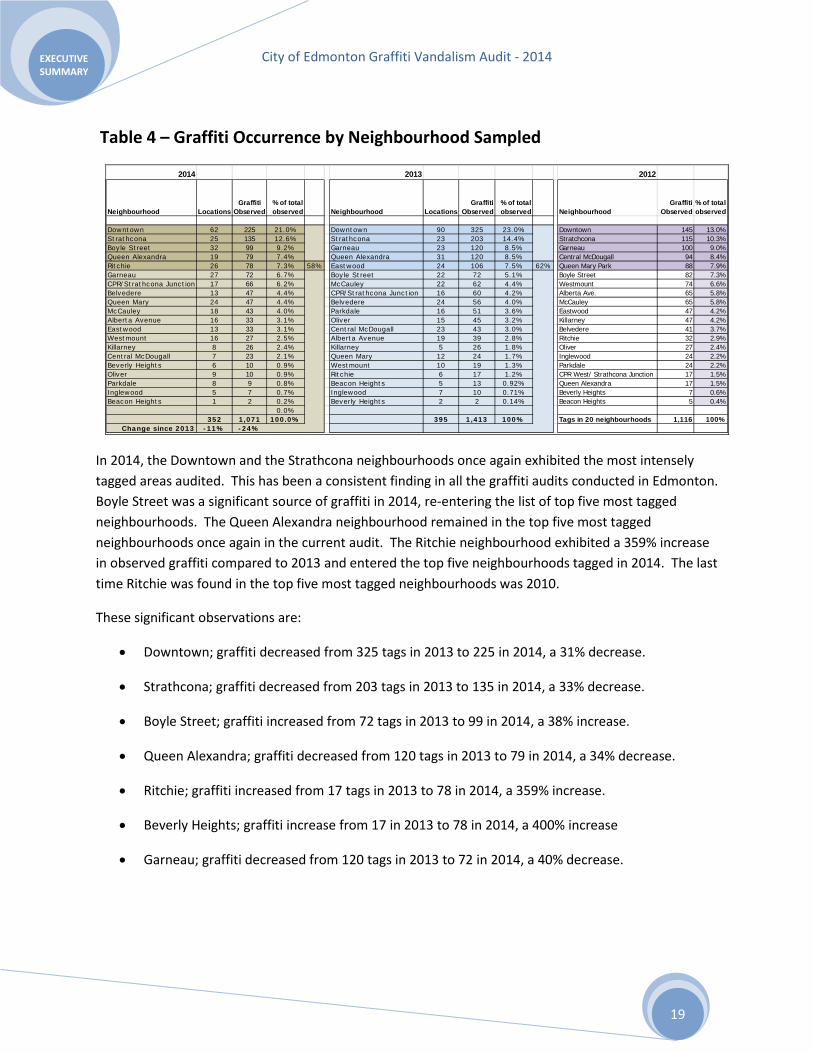
Table 4 – Graffiti Occurrence by Neighbourhood Sampled
In 2014, the Downtown and the Strathcona neighbourhoods once again exhibited the most intensely tagged areas audited. This has been a consistent finding in all the graffiti audits conducted in Edmonton. Boyle Street was a significant source of graffiti in 2014, re-entering the list of top five most tagged neighbourhoods. The Queen Alexandra neighbourhood remained in the top five most tagged neighbourhoods once again in the current audit. The Ritchie neighbourhood exhibited a 359% increase in observed graffiti compared to 2013 and entered the top five neighbourhoods tagged in 2014. The last time Ritchie was found in the top five most tagged neighbourhoods was 2010.
These significant observations are:
• Downtown; graffiti decreased from 325 tags in 2013 to 225 in 2014, a 31% decrease.
• Strathcona; graffiti decreased from 203 tags in 2013 to 135 in 2014, a 33% decrease.
• Boyle Street; graffiti increased from 72 tags in 2013 to 99 in 2014, a 38% increase.
• Queen Alexandra; graffiti decreased from 120 tags in 2013 to 79 in 2014, a 34% decrease.
• Ritchie; graffiti increased from 17 tags in 2013 to 78 in 2014, a 359% increase.
• Beverly Heights; graffiti increase from 17 in 2013 to 78 in 2014, a 400% increase
• Garneau; graffiti decreased from 120 tags in 2013 to 72 in 2014, a 40% decrease.
2014 2013 2012
Neighbourhood LocationsGraffiti
Observed% of total observed Neighbourhood Locations
Graffiti Observed
% of total observed Neighbourhood
Graffiti Observed
% of total observed
Downtown 62 225 21.0% Downtown 90 325 23.0% Downtown 145 13.0%Strathcona 25 135 12.6% Strathcona 23 203 14.4% Stratchcona 115 10.3%Boyle Street 32 99 9.2% Garneau 23 120 8.5% Garneau 100 9.0%Queen Alexandra 19 79 7.4% Queen Alexandra 31 120 8.5% Central McDougall 94 8.4%Ritchie 26 78 7.3% 58% Eastwood 24 106 7.5% 62% Queen Mary Park 88 7.9%Garneau 27 72 6.7% Boyle Street 22 72 5.1% Boyle Street 82 7.3%CPR/Strathcona Junction 17 66 6.2% McCauley 22 62 4.4% Westmount 74 6.6%Belvedere 13 47 4.4% CPR/Strathcona Junction 16 60 4.2% Alberta Ave. 65 5.8%Queen Mary 24 47 4.4% Belvedere 24 56 4.0% McCauley 65 5.8%McCauley 18 43 4.0% Parkdale 16 51 3.6% Eastwood 47 4.2%Alberta Avenue 16 33 3.1% Oliver 15 45 3.2% Killarney 47 4.2%Eastwood 13 33 3.1% Central McDougall 23 43 3.0% Belvedere 41 3.7%Westmount 16 27 2.5% Alberta Avenue 19 39 2.8% Ritchie 32 2.9%Killarney 8 26 2.4% Killarney 5 26 1.8% Oliver 27 2.4%Central McDougall 7 23 2.1% Queen Mary 12 24 1.7% Inglewood 24 2.2%Beverly Heights 6 10 0.9% Westmount 10 19 1.3% Parkdale 24 2.2%Oliver 9 10 0.9% Ritchie 6 17 1.2% CPR West/ Strathcona Junction 17 1.5%Parkdale 8 9 0.8% Beacon Heights 5 13 0.92% Queen Alexandra 17 1.5%Inglewood 5 7 0.7% Inglewood 7 10 0.71% Beverly Heights 7 0.6%Beacon Heights 1 2 0.2% Beverly Heights 2 2 0.14% Beacon Heights 5 0.4%
0.0%352 1,071 100.0% 395 1,413 100% Tags in 20 neighbourhoods 1,116 100%
Change since 2013 -11% -24%

City of Edmonton Graffiti Vandalism Audit - 2014
EXECUTIVE SUMMARY
20
Table 5 – Comparison of Graffiti 2014 vs. 2013 Neighbourhoods
In Table 10, above, we note changes in observed graffiti activity. As mentioned earlier, graffiti in the Ritchie neighbourhood, increased significantly from the current audit to the previous year, an increase of 359%.
Perhaps more notable were those neighbourhoods where graffiti activities decreased. Graffiti vandalism in the Downtown and Strathcona neighbourhoods were observed to have decreased by over 30% in 2014 compared to 2013 (-31% and -33% respectively), while the Garneau area saw a 40% decrease in observed tags in the current audit. The Eastwood neighbourhood had 69% fewer tags and the Oliver area was observed to have 78% fewer tags in in 2014 compared to the previous year.
In each of the graffiti vandalism audits unidentifiable (unknown) taggers are the largest single tagger group identified. When identifiable tags are examined, a relatively small number of individual taggers account for a significant amount of the graffiti in Edmonton. In 2014, 271 tags (25.3%) were unidentifiable (unknown) taggers, with 74.7% of tags being observed with readable tag names.
Graffiti Tags 2014
Change from 2013
Graffiti Tags 2013
Neighbourhood
Beverly Heights 10 400% 2Ritchie 78 359% 17Queen Mary 47 96% 24Westmount 27 42% 19Boyle Street 99 38% 72CPR/Strathcona Junction 66 10% 60Killarney 26 0% 26Alberta Avenue 33 -15% 39Belvedere 47 -16% 56Inglewood 7 -30% 10McCauley 43 -31% 62Downtown 225 -31% 325Strathcona 135 -33% 203Queen Alexandra 79 -34% 120Garneau 72 -40% 120Central McDougall 23 -47% 43Eastwood 33 -69% 106Oliver 10 -78% 45Parkdale 9 -82% 51Beacon Heights 2 -85% 13
1,071 -24% 1,413

City of Edmonton Graffiti Vandalism Audit - 2014
EXECUTIVE SUMMARY
21
The number of taggers in the current audit was 400, compared to 424 taggers in 2013, 305 in 2012 and 379 in 2011.
Figure 5 – Seven Most Active Neighbourhoods
Downtown 21%
Strathcona13%Boyle Street
9%
Queen Alexandra 7%
Ritchie 7%
Garneau 7%
CPR/Strathcona Junction 6%
Seven Neighbourhoods Equal 70% of Tags - 2014
Downtown 23%
Strathcona14%
Garneau8%
Queen Alexandra8%
Eastwood7%
Boyle5%
McCauley4%
2013 - Seven Neighbourhoods Account for 71% of Graffiti
City of Edmonton Graffiti Vandalism Audit - 2014
EXECUTIVE SUMMARY
22
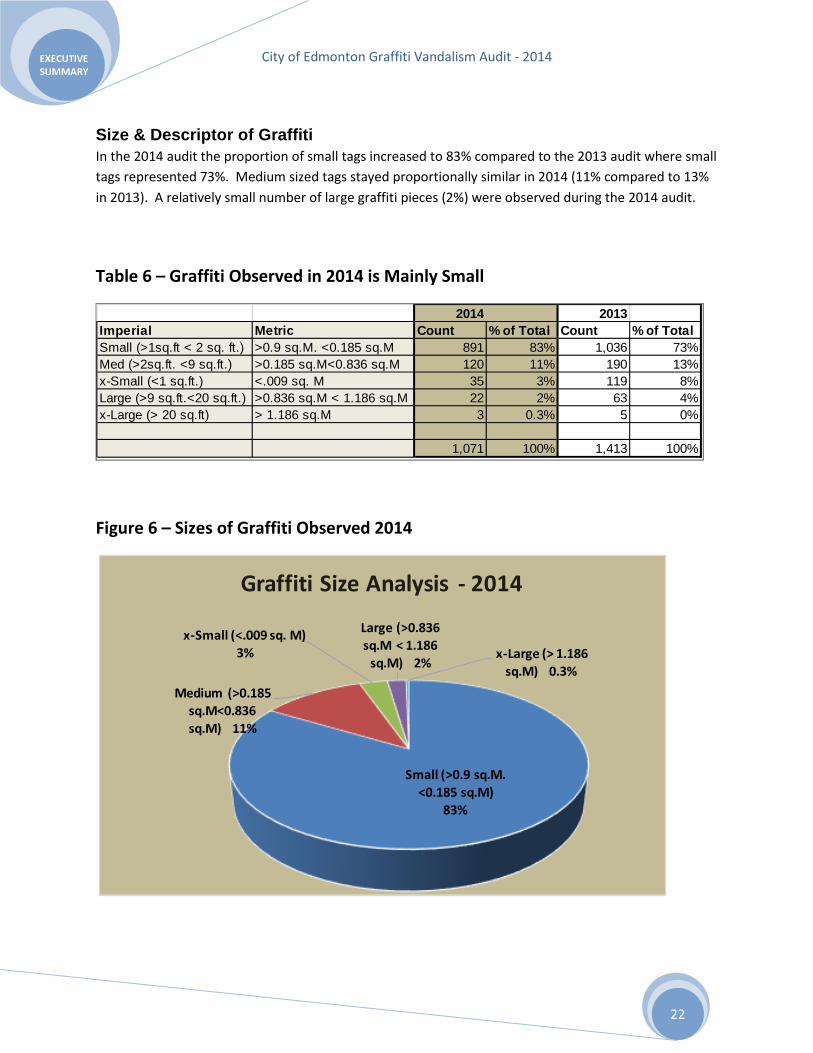
Size & Descriptor of Graffiti In the 2014 audit the proportion of small tags increased to 83% compared to the 2013 audit where small tags represented 73%. Medium sized tags stayed proportionally similar in 2014 (11% compared to 13% in 2013). A relatively small number of large graffiti pieces (2%) were observed during the 2014 audit.
Table 6 – Graffiti Observed in 2014 is Mainly Small
Figure 6 – Sizes of Graffiti Observed 2014
2014 2013Imperial Metric Count % of Total Count % of TotalSmall (>1sq.ft < 2 sq. ft.) >0.9 sq.M. <0.185 sq.M 891 83% 1,036 73%Med (>2sq.ft. <9 sq.ft.) >0.185 sq.M<0.836 sq.M 120 11% 190 13%x-Small (<1 sq.ft.) <.009 sq. M 35 3% 119 8%Large (>9 sq.ft.<20 sq.ft.) >0.836 sq.M < 1.186 sq.M 22 2% 63 4%x-Large (> 20 sq.ft) > 1.186 sq.M 3 0.3% 5 0%
1,071 100% 1,413 100%
Small (>0.9 sq.M. <0.185 sq.M)
83%
Medium (>0.185 sq.M<0.836 sq.M) 11%
x-Small (<.009 sq. M)3%
Large (>0.836 sq.M < 1.186
sq.M) 2%x-Large (> 1.186
sq.M) 0.3%
Graffiti Size Analysis - 2014

City of Edmonton Graffiti Vandalism Audit - 2014
EXECUTIVE SUMMARY
23
In regards to the artistic nature of graffiti vandalism observed throughout the 2014 audit, it was repeatedly observed that graffiti appeared to be scrawled quickly onto property, in a stylized design as free hand text and not completed with artistic merit. Of the 1,071 observations made in 2014 fully 93.9% was “text only”, which is consistent with the observation made in 2013.
Table 7 – Summary of Graffiti Vandalism Observed in 2014
Descriptor of Graffiti Observed2014 2013
Count % of Total
Text only (1.) 1,006 93.9% 93.0%Picture 40 3.7% 2.8%Stencil (2.) 7 0.7% 1.6%Splash/Slash (3.) 3 0.3% 1.3%Vulgar Text 13 1.2% 1.2%Vulgar Picture 1 0.1% 0.1%Political 0 0.0% 0.0%Hate motif 1 0.1% 0.0%Racist 0 0.0% 0.0%
1,071 100% 100%
1. Text only refers to no drawing, piece i s
s tyl i zed des ign or text only
2. Stenci l s are made with cut-outs & medium
3. Splash/ Slash i s an undefined graffi ti
piece, or pa int thrown onto property

City of Edmonton Graffiti Vandalism Audit - 2014
EXECUTIVE SUMMARY
24
The consultant found that over 90% of all graffiti is what is termed as marker or plain in nature, as compared to outline bubble-type graffiti or artistic drawings, a trend that has been observed in previous graffiti audits in Edmonton. Marker or plain graffiti tagging is textual in nature rather than being a picture or a drawing. Table 8 – Graffiti Categories
Figure 7 – Observed Graffiti is Not Artistic
Graffiti Category 2014 2013
Marker / Plain Graffiti 981 91.6% 93.3%Artistic Tag 48 4.5% 4.0%Outline Bubble Tag - No Fill 23 2.1% 1.0%Outline Bubble Tag - One Color 9 0.8% 1.0%Outline Bubble Tag - Two Colors 7 0.7% 0.5%Outline Bubble - Multiple Colors 2 0.2% 0.2%Etching 1 0.1% 0.0%
1071 100.0% 100.0%
Marker / Plain Graffiti
92%
Artistic Tag4%
Outline Bubble Tag - No Fill
2%
Outline Bubble Tag - One Color
1% Outline Bubble Tag - Two Colors
1%
Less Than 5% of Tags are Artistic

City of Edmonton Graffiti Vandalism Audit - 2014
EXECUTIVE SUMMARY
25
Target Properties & Categories The audit team determined whether each item of graffiti was placed on City, non-municipal government or private property.
In 2014, the same proportion of graffiti was observed on private property as was noted in 2013. Both audits show 84% of graffiti vandalism tags on private property. Graffiti on City assets increased from 9% (124 tags in 2013), to 12% (129 tags in 2014).
The number of tags on government (Provincial and Federal) property continued to follow a decreasing trend first noted in 2013, moving from 7% of total tags (104 tags) in 2013, to just 4% of total graffiti tags (43 tags) in 2014. The consultants noted that, in the past, the majority of tags on government property were mainly on Canada Post (grey) boxes. A large number of these boxes have now been phased out of service, by this agency and removed from city streets. This is likely the main contributing factor for the continued decreasing trend in the number of tags on government property noted over the past two years.
The proportion of graffiti tags on private waste management bins increased in 2014, from 21% (295 tags) in 2013, to 27% (289 tags) in 2014. City disposal and recycling bins were observed to have fewer tags than private waste bins.
Figure 8 – Graffiti Tags by Property Ownership
Private property84%
City assets 12%
Government assets 4%
Eighty-Four Percent Graffiti is on Private Property

City of Edmonton Graffiti Vandalism Audit - 2014
EXECUTIVE SUMMARY
26
Table 9 – Graffiti Targets & Category Results
# of Observations Property Owner 2014 2013
City of Edmonton 129 Waste Mangement Branch 58 4512% Transportation Dept. 1 17
Proportion of all graffiti 2014 12% Public Works 8 5Proportion of all graffiti 2013 9% Other Street assets 7 4Proportion of all graffiti 2012 10% ETS 53 40Proportion of all graffiti 2011 8% Parks 2 13
Other Sub-total 129 124
# of Observations Property Owner 2014 2013
Other Government Property 47 Canada Post 36 97
4% Gov't building 3Proportion of all graffiti 2014 4% Hospital 2Proportion of all graffiti 2013 7% Schools 9 4Proportion of all graffiti 2012 18%Proportion of all graffiti 2011 14%
Sub-total 47 104
# of Observations Property Owner 2013
Private Property 89584% Commercial - Parking barricades 13 19
Proportion 2014 84% - other commercial items 5 5Proportion 2013 84% - Disposl bin , small 2Proportion 2012 67% - Doors 5 15Proportion 2011 78% - Equipment 0
- Fence 5 - Lights 0 - Garage doors 4 - Poles / posts/ parking 1 5 - Signs 14 21 - Utility boxes 4 4 - Ventilation 3 4 - Walls 24 47 - Sea Can / Storage 9 8 - Windows 3 - Community League 3 1 - Vehicles/ Rolling Stock 6Church - Barricades/Other 8 8 - Walls 1 - Doors 0
City of Edmonton Graffiti Vandalism Audit - 2014
EXECUTIVE SUMMARY
27
# of Observations Property Owner 2014 2013
Private Property EPCOR - Poles & Light Standards 47 37 - Utility box 57 104 - Other EPCOR asset 5 1TELUS - Pole 0 - Utility box 29 16 - Booth & Other Asset 13 7Shaw - Utility box 1
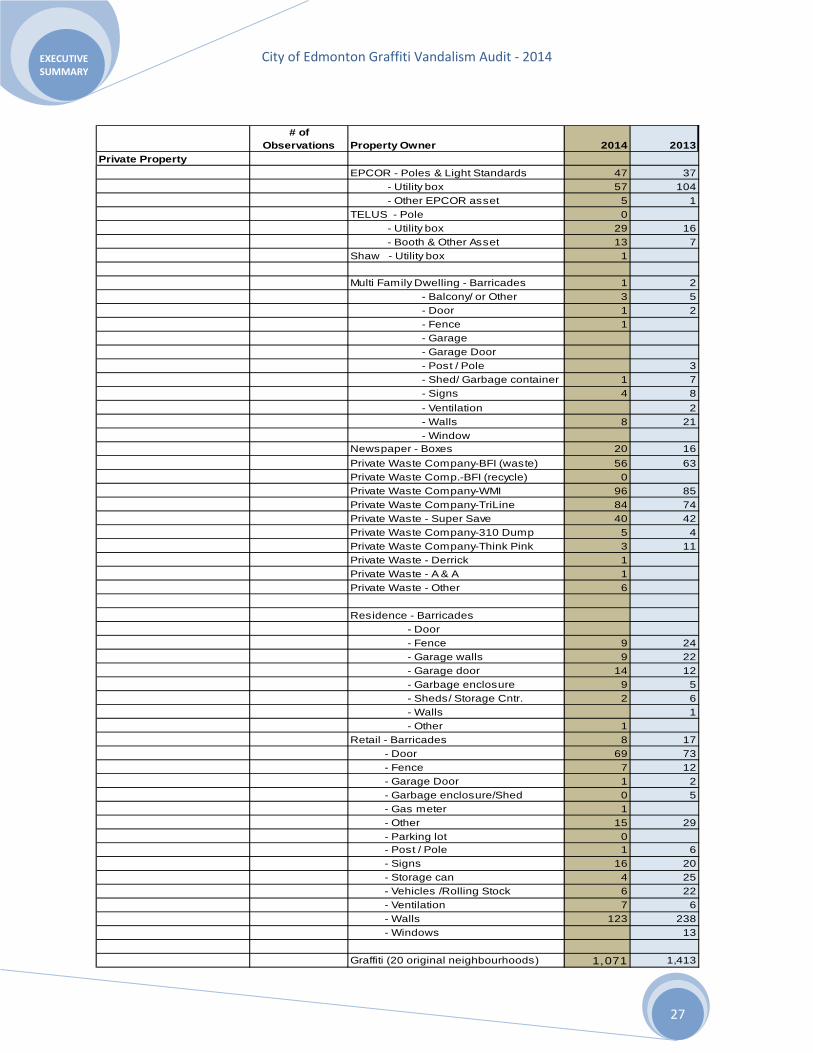
Multi Family Dwelling - Barricades 1 2 - Balcony/ or Other 3 5 - Door 1 2 - Fence 1 - Garage - Garage Door - Post / Pole 3 - Shed/ Garbage container 1 7 - Signs 4 8 - Ventilation 2 - Walls 8 21 - WindowNewspaper - Boxes 20 16Private Waste Company-BFI (waste) 56 63Private Waste Comp.-BFI (recycle) 0Private Waste Company-WMI 96 85Private Waste Company-TriLine 84 74Private Waste - Super Save 40 42Private Waste Company-310 Dump 5 4Private Waste Company-Think Pink 3 11Private Waste - Derrick 1Private Waste - A & A 1Private Waste - Other 6
Residence - Barricades - Door - Fence 9 24 - Garage walls 9 22 - Garage door 14 12 - Garbage enclosure 9 5 - Sheds/ Storage Cntr. 2 6 - Walls 1 - Other 1Retail - Barricades 8 17 - Door 69 73 - Fence 7 12 - Garage Door 1 2 - Garbage enclosure/Shed 0 5 - Gas meter 1 - Other 15 29 - Parking lot 0 - Post / Pole 1 6 - Signs 16 20 - Storage can 4 25 - Vehicles /Rolling Stock 6 22 - Ventilation 7 6 - Walls 123 238 - Windows 13
Graffiti (20 original neighbourhoods) 1,071 1,413

City of Edmonton Graffiti Vandalism Audit - 2014
EXECUTIVE SUMMARY
28
Location Intensity Rating (LIR) Location Intensity Rating (LIR) is calculated as a method to indicate the relative intensity of a location within a neighbourhood. The LIR differs from the graffiti index in that the graffiti index measures the intensity of the amount of graffiti in the entire neighbourhood or hot/random area. The LIR measures the intensity of the graffiti observed at each individual location. It also includes factors other than just the amount of graffiti. The factors that form the LIR are described below.
The consultant added the LIR to the observations obtained in the 2011 to 2014 graffiti vandalism audits. The LIR is a rating based on observations of each “location” where these features make the graffiti more or less noticeable to both trained and untrained observers. It is based upon:
Size
• Score 1 for extra small, score 5 for extra large
Colour
• Score 1 for low colour, score 5 for vibrant colour
Complexity
• Score 1 marker plain text, score 5 for Outline Bubble multiple colours
Artistic
• Score 1 not drawn / splash / slash, score 5 artistic execution
Visibility
• Score 1 barely noticeable , score 5 could not miss it
Longevity
• Score 1 old, faded, nearly not visible, score 5 recent, not removed
Access
• Score 1 easy access, no likelihood of being caught, score 5 dangerous location
Surface
• Score 1 bad surface, does not take paint easily, score 5 ideal graffiti surface
Reoccurrence
• Score 1 none apparent, score 5 heavy reoccurrence
The maximum LIR possible at any location is a score of 45 (9 factors x 5 points = 45)

City of Edmonton Graffiti Vandalism Audit - 2014
EXECUTIVE SUMMARY
29
The consultant was requested to conduct a standard deviation analysis on the collected graffiti data. Standard deviation measures how widely values in a set of data are dispersed from the average (mean) value of the data set.
Standard deviation was calculated for the 2014 LIR data which yields 3.44. The average (mean) LIR was calculated as 18.2. Using standard statistical analysis principles, 68% of the LIR ratings fall within 1 standard deviation of the average LIR, which is a range from LIR ratings of 15 to 22, a finding similar to that found in 2013. Statistical analysis theory also determines that 95% of LIR ratings are therefore between 2 standard deviations, or between LIRs of 11 and 25.
In Table 18 below, this analysis shows that the average Location Intensity Rating is slightly lower in 2014, at 18.24 compared to 18.30 in 2013, but significantly lower than 2012 which averaged 21.22. It also reveals median intensity rating (middle of the data) has remained at 17 for the past two years compared to 21 in 2012, and 20 in 2011.
Table 10 – Location Intensity Rating Analysis (2012-2014)
2014 Std Deviation AnalysisAverage of all LIR 18.24 (mean) 68% of all LIR fall within 1 ST DEVStd deviation 3.44 14.8 to 21.7
Median 17 95% within 2 ST DEV11.4 to 25.1
2013 Std Deviation AnalysisAverage of all LIR 18.30 (mean) 68% of all LIR fall within 1 ST DEV of 18.3Std deviation 3.24 15.1 to 21.5
Median 17 95% within 2 ST DEV11.8 to 24.8
2012 Std Deviation AnalysisAverage of all LIR 21.22 (mean) 68% of all LIR fall within 1 ST DEV of 18.3Std deviation 2.65 18.6 to 23.9
Median 21 95% within 2 ST DEV15.9 to 26.5
2011 Std Deviation AnalysisAverage of all LIR 20.04 (mean) 68% of all LIR fall within 1 ST DEV of 18.3Std deviation 2.58 17.5 to 22.6
Median 20 95% within 2 ST DEV14.9 to 25.2
City of Edmonton Graffiti Vandalism Audit - 2014
EXECUTIVE SUMMARY
30
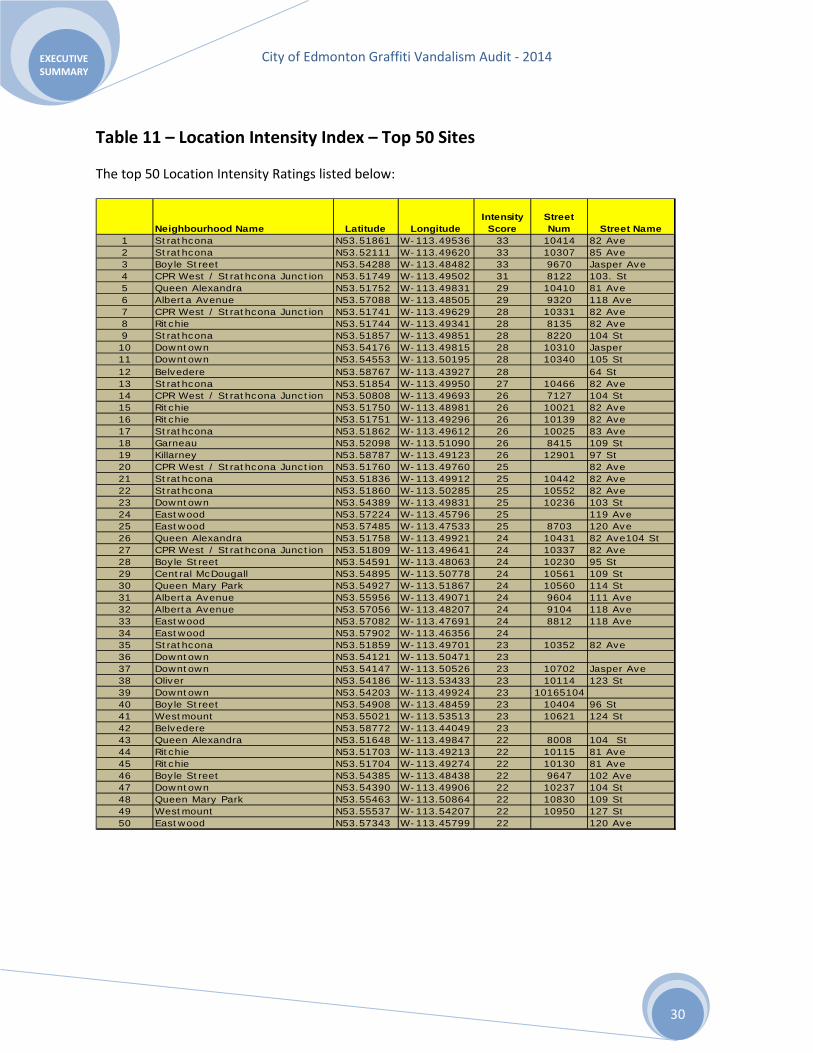
Table 11 – Location Intensity Index – Top 50 Sites
The top 50 Location Intensity Ratings listed below:
Neighbourhood Name Latitude LongitudeIntensity
ScoreStreet Num Street Name
1 Strathcona N53.51861 W-113.49536 33 10414 82 Ave2 Strathcona N53.52111 W-113.49620 33 10307 85 Ave3 Boyle Street N53.54288 W-113.48482 33 9670 Jasper Ave4 CPR West / Strathcona Junction N53.51749 W-113.49502 31 8122 103. St5 Queen Alexandra N53.51752 W-113.49831 29 10410 81 Ave6 Alberta Avenue N53.57088 W-113.48505 29 9320 118 Ave7 CPR West / Strathcona Junction N53.51741 W-113.49629 28 10331 82 Ave8 Ritchie N53.51744 W-113.49341 28 8135 82 Ave9 Strathcona N53.51857 W-113.49851 28 8220 104 St10 Downtown N53.54176 W-113.49815 28 10310 Jasper 11 Downtown N53.54553 W-113.50195 28 10340 105 St12 Belvedere N53.58767 W-113.43927 28 64 St13 Strathcona N53.51854 W-113.49950 27 10466 82 Ave14 CPR West / Strathcona Junction N53.50808 W-113.49693 26 7127 104 St15 Ritchie N53.51750 W-113.48981 26 10021 82 Ave16 Ritchie N53.51751 W-113.49296 26 10139 82 Ave17 Strathcona N53.51862 W-113.49612 26 10025 83 Ave18 Garneau N53.52098 W-113.51090 26 8415 109 St19 Killarney N53.58787 W-113.49123 26 12901 97 St20 CPR West / Strathcona Junction N53.51760 W-113.49760 25 82 Ave21 Strathcona N53.51836 W-113.49912 25 10442 82 Ave22 Strathcona N53.51860 W-113.50285 25 10552 82 Ave23 Downtown N53.54389 W-113.49831 25 10236 103 St24 Eastwood N53.57224 W-113.45796 25 119 Ave25 Eastwood N53.57485 W-113.47533 25 8703 120 Ave26 Queen Alexandra N53.51758 W-113.49921 24 10431 82 Ave104 St27 CPR West / Strathcona Junction N53.51809 W-113.49641 24 10337 82 Ave28 Boyle Street N53.54591 W-113.48063 24 10230 95 St29 Central McDougall N53.54895 W-113.50778 24 10561 109 St30 Queen Mary Park N53.54927 W-113.51867 24 10560 114 St31 Alberta Avenue N53.55956 W-113.49071 24 9604 111 Ave32 Alberta Avenue N53.57056 W-113.48207 24 9104 118 Ave33 Eastwood N53.57082 W-113.47691 24 8812 118 Ave34 Eastwood N53.57902 W-113.46356 2435 Strathcona N53.51859 W-113.49701 23 10352 82 Ave36 Downtown N53.54121 W-113.50471 2337 Downtown N53.54147 W-113.50526 23 10702 Jasper Ave38 Oliver N53.54186 W-113.53433 23 10114 123 St39 Downtown N53.54203 W-113.49924 23 1016510440 Boyle Street N53.54908 W-113.48459 23 10404 96 St41 Westmount N53.55021 W-113.53513 23 10621 124 St42 Belvedere N53.58772 W-113.44049 2343 Queen Alexandra N53.51648 W-113.49847 22 8008 104 St44 Ritchie N53.51703 W-113.49213 22 10115 81 Ave45 Ritchie N53.51704 W-113.49274 22 10130 81 Ave46 Boyle Street N53.54385 W-113.48438 22 9647 102 Ave47 Downtown N53.54390 W-113.49906 22 10237 104 St 48 Queen Mary Park N53.55463 W-113.50864 22 10830 109 St49 Westmount N53.55537 W-113.54207 22 10950 127 St50 Eastwood N53.57343 W-113.45799 22 120 Ave

City of Edmonton Graffiti Vandalism Audit - 2014
EXECUTIVE SUMMARY
31
Conclusions The City of Edmonton’s graffiti vandalism audit is an unbiased method of sampling graffiti vandalism in the City. Re-auditing the same neighbourhoods enables the City to document changes in the amount of graffiti observed in those areas. During the 2014 graffiti audit, the audit crew observed graffiti at 352 locations where graffiti vandalism was present, a reduction from 395 in 2013 and 438 locations in 2012. In these locations, 1,071 graffiti tags were observed, a 24% decrease from 1,413 graffiti tags in 2013 and 1,116 in 2012.
The 2014 audit observed 11% fewer locations observed with graffiti, within the 20 original neighbourhoods examined than in 2013.
Downtown neighbourhood graffiti decreased from 325 tags in 2013 to 225 in 2014, a 31% decrease. There was also a decrease in the Strathcona neighbourhood where graffiti tags decreased from 203 tags in 2013 to 135 in 2014, a 33% decrease. Tags in Garneau also diminished from 120 tags in 2013 to 72 in 2014, a 40% decrease. In 2013 the largest contributors of tags came from those three neighbourhoods, which combined represented 46% of all graffiti observed.
The largest contributors of tags observed during the 2014 audit were from the Downtown, Strathcona and Boyle Street neighbourhoods, a result of the decrease in graffiti found in Garneau and an increase in the Boyle Street neighbourhood. Graffiti observed in these three neighbourhoods accounts for 42.8% of the total tags found in the 2014 audit with Downtown, Strathcona and Boyle Street representing 21%, 12.6% and 9.2% respectively.
The greatest increase in observed graffiti tags occurred in Beverly Heights (400% increase from 2 tags to 10); Ritchie with a 359% increase (from 17 to 78 tags) and in Queen Mary neighbourhood with a 96% increase (from 24 to 47 tags).
During the 2014 audit, the audit team traveled over 560 kilometres within Edmonton’s 20 sample neighbourhoods, on streets, in alleys and in laneways recording graffiti observations. During the course of this audit over 1,200 photographs were taken recording the graffiti observed. A comprehensive database was created to archive and analyse the data collected. Paper records, electronic data records and digital photographic records were filed to preserve the data collected.
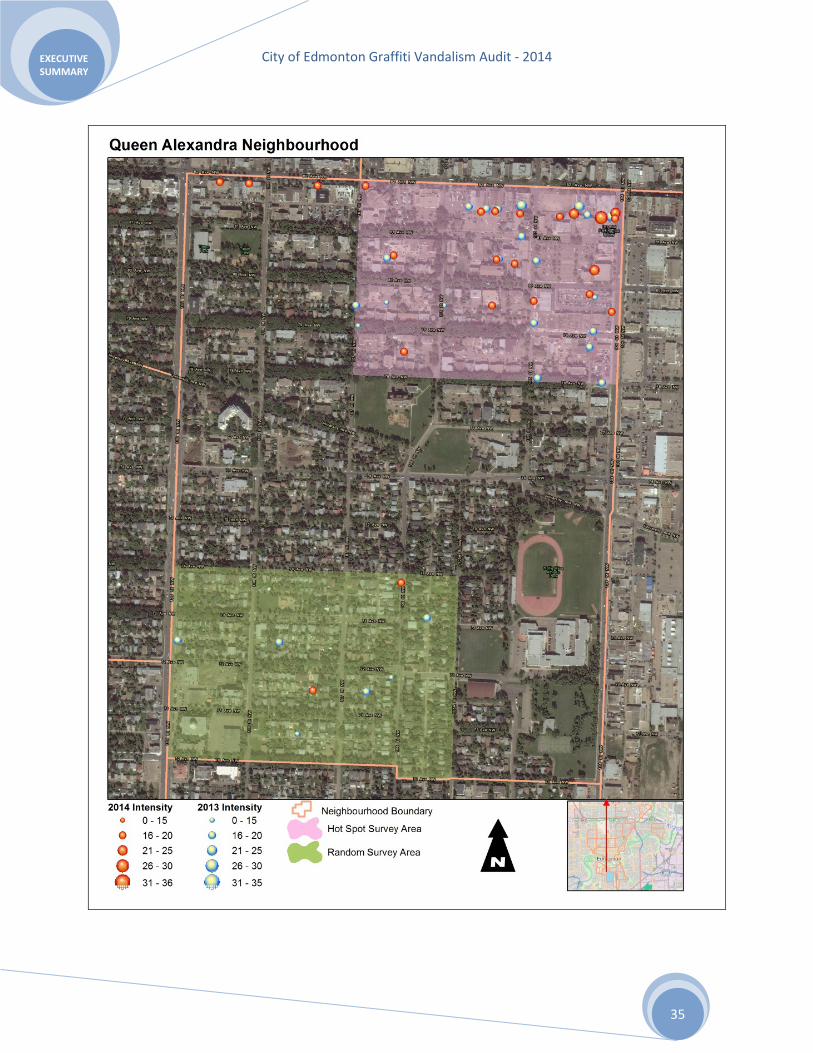
The consultant calculated a Location Intensity Rating (LIR) to examine the amount and intensity of graffiti at each of the 352 locations observed in 2014. For comparison purposes these intensities (LIR) of graffiti are plotted on neighbourhood maps in Appendix B showing graffiti locations and LIRs for 2014 and 2013. Consistent with observing fewer graffiti tags in 2014, was the behavior of the graffiti index in 2014 compared to previous years. The graffiti index is a measure of the amount of graffiti observed per geographic area (Hectares). This index decreased from a combined index of 1.243 in 2013 to 0.932 in 2014.

City of Edmonton Graffiti Vandalism Audit - 2014
EXECUTIVE SUMMARY
32
During the 2014 field work, auditors were accompanied by a City of Edmonton Municipal Enforcement Officer from the Complaints and Investigations Section of the Community Standards Branch. The identification of taggers has been enhanced by having these staff participate in the audit due to their ability to read tagger names.
During the 2014 audit the number of taggers observed was 400, compared to 424 taggers 2013, and 305 graffiti taggers 2012.
Most graffiti tags are small in size covering less than 0.185 sq.m (2 sq.ft.). In the current audit there were proportionately more small tags in 2014 than in 2013; at 83% small tags in the current year compared to 73 % of the graffiti observed as small tags in 2013. A similar proportion of medium sized tags (>2sq.ft. <9 sq.ft.) were seen in 2014 (11% in 2014 and 13% in 2013).
92% of graffiti observed in 2014 was “marker / plain” graffiti (93% in 2013). This predominate style of graffiti found during the audit is textual or stylized in nature, and is in no way artistic in its design.
Commercial waste bins, parking lot barricades, signs and posts continue to be common targets for taggers. Private residential and multi-family residential properties are often targets of graffiti vandals, especially fences and garages in back alleys and laneways.
In the 2014 audit the consultant observed that murals, throughout the City, were not generally defaced by graffiti tags. This reinforces previous observations that graffiti vandals appear to avoid tagging murals.

City of Edmonton Graffiti Vandalism Audit - 2014
EXECUTIVE SUMMARY
33
APPENDIX A – Overview Audit Sample Locations

City of Edmonton Graffiti Vandalism Audit - 2014
EXECUTIVE SUMMARY
34
APPENDIX B - Graffiti Observation Locations (Examples)
City of Edmonton Graffiti Vandalism Audit - 2014
EXECUTIVE SUMMARY
35
City of Edmonton Graffiti Vandalism Audit - 2014
EXECUTIVE SUMMARY
36

City of Edmonton Graffiti Vandalism Audit - 2014
FINAL Report
37
APPENDIX C – Glossary of Terms Note: the terms and definitions listed below are general descriptions that reflect how this report uses the terminology. These definitions do not necessary reflect exactly how others working in this area may define the terms.
Term DefinitionBusiness Revitalization Zones (BRZ)
Defined areas in the city of Edmonton that have experienced economic decline that are being targeted for development and enhancements. City of Edmonton bylaw requiring property owners to remove graffiti from their property: 9 (2) in Community Standards Bylaw 14600, for the purpose of greater certainty a nuisance, in respect of a building, means a building showing signs of a serious disregard for general maintenance and upkeep, whether or not it is detrimental to the surrounding area, some examples of which include:
(a.1) any graffiti displayed on the building that is visible from any surrounding property; reference (S.3, Bylaw 14752, February 13, 2008)
Crew A group of taggers that operate together to do graffiti. Crew Name Symbol or letters, used by a graffiti crew, which is placed near their
tag to identify their crew.Geospatial mapping Is the use of Geographical Information Software (GIS) for the
management, analysis and display of geographical information. GIS is used to produce maps which can be used for the analysis of simple or complex problems
Graffiti Descriptor Pre-determined categories used to classify the graffiti found during the audit: Text only, picture, stencil, splash/slash, vulgar text, vulgar picture, political hate, racist, or other distinguishing
Graffiti ID Identification assigned to each piece of graffiti found at each graffiti location.
Graffiti Index Way of expressing the observations of graffiti in an indexed numerical comparison of the data. (i.e. # observed divided by the area of the sample zone in Hectares)
Location ID -- Graffiti locations Specific locations identified by the auditor where graffiti was found.
Graffiti Size For the purposes of this report, the pre-defined categories used by the auditor to classify graffiti. Complete listing of styles listed in the report.
Community Standards Bylaw 14600, Section 9

City of Edmonton Graffiti Vandalism Audit - 2014
FINAL Report
38
Term DefinitionGraffiti Style For the purposes of this report, the pre-defined categories used by
the auditor to classify graffiti. Complete listing of styles listed in the report.
Graffiti Vandalism A public nuisance crime that causes damage to public and private property by applying paint, ink or chemicals to a surface.
Hot Spot Term used to describe the 16 square block area within the target neighbourhoods that had the highest incidences of graffiti.
Mischief Infraction/term, under Criminal Code of Canada, to describe the act of graffiti vandalism.
Location Intensity Rating (LIR) Location Intensity Rating (LIR) - The LIR measures the intensity of graffiti at a specific LOCATION within a sample area. The LIR measures the intensity of the graffiti at each location where graffiti is found, and is specific to a location within a hot spot or random sample area .
Municipal Standards Act The Alberta legislation which gives municipalities the authority to access and enforce clean up on private properties.
Posse Database system used by the City of Edmonton to record and track Municipal Community Standard/Bylaw complaints on private property.
Random Area An arbitrarily selected 16 square block area within the target neighbourhoods used as a comparison/control.
Street Name Name used by graffiti taggers to identify themselves in the graffiti sub-culture.
Tag An identifiable graffiti word or symbol repeatedly placed on property by a tagger.
Tagger Name used to describe an individual that does graffiti vandalism.Target Neighbourhoods Neighbourhoods, identified through the City of Edmonton
complaint tracking system “Posse”, that were the focus for the graffiti audit.
Recommended