Breddy, Scott (2018) The effect of starting velocity on maximal acceleration
capacity in elite level youth football players. MSc(R) thesis.
https://theses.gla.ac.uk/8924/
Copyright and moral rights for this work are retained by the author
A copy can be downloaded for personal non-commercial research or study,
without prior permission or charge
This work cannot be reproduced or quoted extensively from without first
obtaining permission in writing from the author
The content must not be changed in any way or sold commercially in any
format or medium without the formal permission of the author
When referring to this work, full bibliographic details including the author,
title, awarding institution and date of the thesis must be given
Enlighten: Theses
https://theses.gla.ac.uk/

The effect of starting velocity on maximal acceleration
capacity in elite level youth football players.
Scott Breddy
BSc (Hons)

Submitted in fulfilment of the requirements of the degree of:
MSc (Research) Sports Science
School of Life Sciences
College of Medical, Veterinary and Life Sciences
University of Glasgow
Supervisor:
Dr. Niall MacFarlane
March 2018
1
Abstract
Due to advancements in performance monitoring technology
(GPS & Accelerometry), practitioners are able to measure
accelerations and decelerations with a view to quantifying their
impact on training load in team sports. In practice, the
magnitude of these accelerations has typically been
categorized into low, moderate and high threshold bands
(similar to often-quoted speed and distance parameters).
Research suggests a value of greater than 2.78 m.s-2 (Varley
and Aughey, 2013) as a high acceleration threshold, based on
data measuring maximal acceleration capacity from a standing
start.
However, there has only been one study to our knowledge that
directly examines the effect of starting speed on the capacity to
maximally accelerate (Sonderegger et. al, 2016). Further, the
research fails to examine accelerations, measured via GPS or
Accelerometry in football specific context.
Therefore, the aim of this study is to quantify, via GPS and
Accelerometry, the impact of different commencement

2
velocities on the maximum voluntary acceleration capacity of
individuals during maximum efforts. A secondary aim of the
study is to analyse more dynamic situations involving a stretch-
shortening cycle by determining the impact of changing entry
speed and deceleration on the acceleration capacity of
individuals making maximum voluntary efforts.
Fifteen male football players from the Development Squad of a
Scottish Premier League club took part in the study during the
pre-season phase of the 2015/2016 season.
Subjects wore Catapult OptimEye X4 10-Hz GPS units with in-
built tri-axial accelerometer, gyroscope and magnetometer
sampling frequencies of 100-Hz
The players were asked to complete three different running
tests that would require them to accelerate maximally from
either a standing start position, from five increasing run-in
speeds or after a period of deceleration.
The data collected for analysis was; peak acceleration at point
of change of pace & peak deceleration at point of deceleration.
3
These were measured by both Doppler GPS method and from
the Vector of the tri-axial accelerometer data.
The results showed that peak accelerations achieved during
progressively increasing starting velocities were 2.34±0.35,
1.85±0.31, 1.5±0.26, 1.12±0.18 and 0.92±0.21 m.s-2 (Doppler
derived values). Accelerations were reduced to 1.42±0.57,
0.83±0.51, 0.61±0.26, 0.47±0.37 and 0.33±0.32 m.s-2 (Doppler
derived values) when the effort was preceded by a rapid
deceleration after similar entry speeds.
The reduction in observed acceleration with increased running
speed will be important in situations where the context changes
player behaviour, such as in; pitch-dimensions, number of
players and relative playing area. The consequences of this
misinformation may be that players initiate an acceleration
effort and pay metabolic cost but get further load applied
because that effort was not recorded. This could potentially
result in training overload.

4
Contents
Abstract…………………………………………………………… 1
List of Tables………………………………………………………5
List of Figures…………………………………………………….. 6
Acknowledgements……………………………………………….8
Abbreviations……………………………………………………...9
1. Introduction…………………………………………………….10
2. Literature Review……………………………………………..30
3. Methods………………………………………………………..57
4. Results…………………………………………………………69
5. Discussion……………………………………………………..83
6. References………………………………………………….. 100

5
List of Tables
Table 1: Absolute acceleration thresholds from current
literature
Table 2: Physical Profile of subjects including sports science
testing history
6
List of Figures
Figure 1: The Training Process (Impellizerri et al., 2005)
Figure 2: Example Position of GPS Unit wore in vest across
participants back.
Figure 3: 20m maximal acceleration from a standing start.
Figure 4a: Controlled speed entry set-up.
Figure 4b: Controlled speed entry protocol.
Figure 5a: ‘Hollow Sprint’ Test set-up.
Figure 5b: ‘Hollow Sprint’ Test protocol.
Figure 6: Comparing Doppler and Vector recorded values of
Peak Acceleration (0-5m)
Figure 7: Comparing Doppler and Vector recorded values of
Peak Acceleration (0-1.5s)
Figure 8: Mean recorded Entry Speed for Controlled Run-In Test
and Hollow Sprint Test
Figure 9: Peak acceleration at the point of change of pace
7
Figure 10: Peak Deceleration recorded at point of Deceleration
within the Hollow Test
Figure 11: Change of Speed after deceleration within the
Hollow Sprint Test
Figure 12: Peak Acceleration recorded at point of re-
acceleration within the Hollow Test
Figure 13: Relationship between the speed after deceleration
and the peak acceleration achieved at re-acceleration phase
Figure 14: Relationship between the magnitude of deceleration
and the subsequent peak re-acceleration
Figure 15: Difference between peak acceleration from a
controlled run-in or a Hollow Sprint Test.

8
Acknowledgements
Firstly, I would like to thank my principal advisor, Niall
Macfarlane for his support, guidance and knowledge
throughout the project. To him I owe a great debt of gratitude.
I am also very grateful to all the staff and youth players at Celtic
Football Club that helped me with their support through the
Internship programme and with the project itself.
Lastly, I would like to thank my family & Laura for their support
during my further education. This thesis is dedicated to them;
their support is what made this possible to begin with & what
kept me motivated throughout.
It was from this opportunity to undertake my MSc that I was
able to gain further employment and so to all those that have
supported me - I am very thankful.

9
Abbreviations
AFL Australian Football League
ATT Attacker
C DEF Central Defender
C MID Central Midfielder
CMJ Counter Movement Jump
FB DEF Full-Back Defender
FJ Free Jump
GK Goalkeeper
GPS Global Positioning System
HI High Intensity
HIR High Intensity Running
HSR High Speed Running
MIR Moderate Intensity Running
SD Standard Deviation
SE Standard Error
W MID Wide Midfielder

10
1. Introduction
1.1 Overview of football:
Soccer is a high-intensity intermittent sport consisting of
repeated periods of high speed running, sprints, tackles and
jumps interspersed with periods of low activity (walking or
jogging at low speed). Typically, a football match is played with
11 players versus 11 (10 outfield + 1 Goalkeeper on each
team) on pitch dimensions that range from 45-90 m width and
90-120 m length (FIFA, Laws of the Game 2015/16). At both
professional and amateur level, most teams are scheduled to
play one game per week, however it is common in the modern
era for many teams to compete in 2 games or even 3 matches
in 7 days. The structure and management of the training
programme around soccer match play has, as a result, become
crucial to achieve peak performance in matches and
competition. Therefore, in recent years there has been a large
focus on how sport science can positively impact on structuring
and evaluating the training programme, particularly at the elite
level.

11
Understanding the physical characteristics that underpin
football performance is of great importance. Consequently,
performance monitoring has become an important part of the
training process allowing practitioners to fully understand the
physical impact of both training sessions and match play and
thus helping to make a positive impact on the training
programme in optimising efficiency and reducing the risk of
injury.
1.2 Performance monitoring:
With the advent of performance monitoring techniques that
allow us to monitor the physiological characteristics of training,
sports scientists can instruct the coaches and athletes to train
‘smarter’ - to get a better understanding of the physical impact
of training and of the balance between fitness gain and fatigue.
Examining this training process is essential to understanding
why we measure the ‘training load’. By measuring the training
load, we are looking for a dose-response relationship with the
outcome parameter. The dose, or the training ‘load’, is the
prescribed exercise, and the response, in the case of football or
soccer, is the associated gain in fitness or fatigue or the risk in

12
injury. By examining this dose-response relationship or ‘training
load’ in this manner, we can improve our knowledge of how
individuals respond to a particular training mode.
Impellizzeri et. al (Impellizzeri, Rampinini and Marcora, 2005)
conceptualize this training process well in the following diagram
(Figure 1), showing how internal, external and individual
characteristics, all come together to form the overall training
load.
Measuring the training load is particularly difficult in sports like
soccer, because different exercise prescriptions lead to
different physiological and mechanical demands, and within
Figure 1. The Training Process (Impellizerri et al., 2005)

13
that there are inter-individual responses to these demands
(Bangsbo, Mohr and Krustrup, 2006).
The measurement of training load is often described as either
internal or external. Understanding what physical factors impact
the training load is crucial. Physical exertion can be dominated
by metabolic stress, by exerting the different energy systems
(e.g. aerobic or anaerobic). It can be dominated by
biomechanical stress and be static and explosive in nature (e.g.
jumps or power lifting moves), or it can be both combined
metabolic and biomechanical stress, involving slow to
moderate speed activity with repeated periods of high speed
and power. Understanding how to monitor their relative
contribution is of great importance.
Initially sports scientists looked to monitor the heart rate
response to training (described as the internal response).
Intensity of exercise has been measured objectively using HR
(Heart Rate) due to its linear relationship with oxygen
consumption (Bot and Hollander, 2000). Despite heart rate
monitoring being able to provide valuable feedback on the
physiological response to training stimulus and the impact of

14
exercise on the cardiovascular system and aerobic capacity,
there are limitations with using heart rate solely as a
performance monitoring tool. Mainly, heart rate monitoring does
not provide much information about the external load or pick up
the muscular load required in short and sharp explosive
movements such as jumping or accelerating over 0-5m. In
addition, due to a lag in the heart rate response to periods of
high speed bursts, heart rate monitoring fails to categorize the
quantity of efforts made.
Therefore, to gain a more holistic picture of the true impact of
training and match play in soccer, researchers and practitioners
looked to assess the external loading. In more recent history,
the use of automated camera systems has brought to the fore
the use of distances and breakdowns of the velocities at which
these distances are covered. This method has enabled the
determination of positional differences (Di Salvo et al., 2007),
levels of play (Mohr, Krustrup, and Bangsbo, 2003) and match-
to-match variation (Gregson et al., 2010). Even more recently,
the invention and subsequent use of GPS (Global Positioning
Systems) technology has revolutionised the way we track,
15
monitor and examine the external loading in sports and has
since become an extremely important and widely used tool.
1.3 GPS:
Research and understanding of sports performance has
advanced with the introduction of time motion analysis and
GPS. Global positioning satellite-based systems typically utilize
a network of 24 satellites in orbit around the Earth. Each
satellite is equipped with an atomic clock that emits, at the
speed of light, the exact time and the position of the satellite
(Macleod et. al, 2009). The GPS receiver compares the time
emitted by each satellite signal. The lag time, measured by the
receiver, is translated into distance by trigonometry. By
calculating the distance to at least four satellites, the exact
position and altitude of the receiver on the Earth’s surface can
be determined (Townshend, Worringham, & Stewart, 2008).
Townshend and colleagues (2008) have argued that an
increase in the accuracy of the non-differential variant of the
GPS technology is important because non-differential systems
are lighter, smaller, cheaper, and require less complex data
collection procedures, which means non-differential GPS

16
technology could have useful applications in many sporting
contexts.
The technology allows users to track the distance covered by
the athlete and the distance in relative speed zones – be it,
walking, jogging, running or sprinting.
Several companies have begun to market GPS technology for
sports performance across many sports and recreational
activities; cycling, jogging, swimming or use within team sport.
The wearable technology market is now larger than ever with
mobile phones, watches and even clothing garments containing
GPS technology capable of tracking distances covered among
other variables.
The leading companies on the market in measuring team
sports are Catapult Sports (GPSports, Playertek) and
Statsports. The validity and reliability of these units (5Hz &
10Hz) to measure distances covered has been well established
(Coutts & Duffield, 2010) It appears that the units are relatively
accurate for covering total distance and as the speeds increase
the units can accurately measure this – however it has been

17
shown that validity and reliability may drop as the speed of
movement increases. The units are available at different
sampling frequencies, typically from 5-Hz to 10-Hz.
As of July 2015, FIFA, the governing body of Soccer, approved
the wearing of GPS units in competitive match play in soccer,
so long as the respective domestic Leagues allowed. However,
despite its success, GPS technology also has its limitations,
particularly when extrapolating solely distance parameters to
equate to player load. For example, covering a greater total
distance doesn’t always necessarily mean an overall greater
training load. Using distance parameters such as high-speed
distance or sprint distance, set by arbitrary or even
individualised speed thresholds is convenient, but not ideal.
Due to the structure of training sessions, in small sided games
(SSG’s) for example, it is important for coaches and
practitioners to understand that the relative distance covered
will alter dependent on the duration, size of the pitch and the
number of players. If a pitch is small or the relative pitch area
per player is small, the players simply don’t have enough space
to move into to get to the speeds required for the technology to

18
register it as ‘high speed’ for example. It is also important to
understand the conditions placed on the training and games
that are being played. Small sided possession games will differ
with the addition of goalkeepers and goals at each end as the
game has a directional element. Observational data suggests
that players will naturally sit zonal in their positions and will
generally attack towards one end and defend another. This
generally creates more linear based shuttle running scenarios
and thus will have an impact on the distances covered and the
relative starting speeds at which the players move from.
Across playing positions in general match-play, we will also see
differences in the GPS outputs. Full-backs and wide players in
soccer will generally be required to cover more high speed and
sprint distance, central midfielders often cover the greatest total
distance whereas central defenders and attackers generally
cover less total distance. All-be-it this is dependent on systems,
formations and the nature of the game played (Bradley et al.
2011). However, in possession-based games where players
are tasked with keeping possession of the ball for their team
within a designated pitch area & where there are few conditions

19
set by the coaches about player position, players tend to move
more freely around and therefore can achieve greater average
speeds within games as they try to evade their marker and gain
possession of the ball or move to receive a pass.
Therefore, the main criticisms of the velocity-based distance
measures of training load via GPS are; 1. Movements that don’t
create vertical displacement are not accounted for and 2.
Activity isn’t considered high intensity until it breaches a certain
speed threshold, despite accounting for accelerations that do
not result in top speed are just as, if not more, energetically
demanding (Gaudino et al., 2013; Osgnach et al., 2010).
This has led to the development of both accelerometery-
derived load and metabolic-power calculations, both of which
are available from the latest GPS technology suppliers within
their software.
Thus, using GPS to provide simple time motion analysis is
limited in providing a full understanding of the training load
during an individual training session and match play. We
recognise that a large contribution to the total player load will

20
come from short, sharp, explosive movements that don’t get
recorded from the distances covered. As a result, recognising
the accelerations performed are of huge importance and
monitoring such efforts is made possible by the addition of
inertial sensor technology to the GPS units (e.g. tri-axial
accelerometers, gyroscopes and magnetometers).
1.4 Accelerations
As our understanding of football training and the effect of
different elements of the drills and their physical outputs
increases, the associated research has begun to look more at
biomechanical loading during sporting activity. Due to
improvements in the technology measuring these movements
(with accelerometers sampling at 100-Hz) researchers and
sports scientists are beginning to understand these movements
to a greater extent.
Current GPS units contain tri-axial accelerometers allowing
them to measure a vector magnitude by calculating the total
acceleration across three axes; x, y and z. To explain, when a
unit is stationary they will measure 0G across the x and z plane

21
but a gravitational force of -1G (or 9.8m.s-1) in the y (vertical)
axis due to the Earth’s standard acceleration due to gravity.
Unlike GPS receivers it is widely accepted that the greater
frequency of an accelerometer is beneficial given that they are
attempting to capture all movement and force going through the
unit. There are currently 100 Hz tri-axial accelerometers
integrated into the newest GPS units, measuring up to 16G on
each axis.
In physics terms, acceleration is defined as the rate of change
(or derivative with respect to time) of velocity. It is thus a vector
quantity with dimension length/time². Acceleration is measured
in meters per second² (m.s-2). Thus, to accelerate an object is
to change its velocity, which is accomplished by altering either
its speed or its direction in relation to time. In this strict
mathematical sense, acceleration can have positive and
negative values (deceleration).
Accelerations in football are extremely common - with reports
that players may change speed or direction around 1000 to
1500 times per game (Reilly, Science and Soccer, 2003). Since
we know that these movements are common, and because we

22
have established that the GPS technology and the training drills
we prescribe don’t always allow high speeds to be recorded,
the monitoring of accelerations and short explosive movements
and change of pace has taken on greater importance. Indeed,
when you consider match play in football – it is often a change
of pace or acceleration that has preceded a match winning
action – and, therefore, training and monitoring accelerations
must be importantly considered.
Traditionally, an individual’s maximal acceleration capacity has
been monitored during typical speed testing using light gates
by asking the player to sprint 20 - 40m as fast as they can and
examining the time taken to cover the first 5m. There is a well-
established link between maximal acceleration capacity and
players max speed (Little & Williams, 2005). However, not all
maximal accelerations lead to maximal speed efforts in training
and in games – due to the space limitations of the pitch
dimensions or coming into contact with opposition players
(Akenhead et al., 2014)
Now, with the introduction of accelerometer technology within
the GPS units, we can examine the number and magnitude of

23
acceleration efforts in training and in matches. As explained,
the technology works by using a tri-axial accelerometer that
measures the movement across 3 planes – x, y and z (or to the
side, forward and up). We can use these values collectively to
look at a vector quantity of acceleration or simply use the
Doppler based acceleration value which uses the change in
speed measured by GPS (i.e. comparing distances covered
during the time dictated by sampling frequency).
In practice, the magnitude of these accelerations have typically
been categorized into low, moderate and high (similarly to the
often quoted speed and distance parameters). The
establishment of these thresholds is interesting in that it
appears much of the research has come from varying high
intensity intermittent sports (e.g. in Hockey, Rugby League,
AFL) (Aughey, 2011)
Research suggests a value of greater than 2.78 m.s-2 (Varley
and Aughey, 2013) as a high acceleration threshold (based on
data measuring maximal acceleration capacity from a standing
start and predicting a range of 80-90%). With Dwyer and
Gabbett, (2012) suggesting that a sprint be defined as any

24
movement that reaches or exceeds the sprint threshold velocity
for at least 1 second and any movement with an acceleration
that occurs within the highest 5% of accelerations found in the
corresponding velocity range. However, it is unclear how often
soccer players accelerate maximally from a standing start
within match play or within training and so understanding how
the measurement of acceleration is affected by non-standing
starts should be of general interest (since it is the initiation of
any effort that may be the important aspect for training load). If
we truly want to understand training load, then we must take
into consideration all movements and not just those set above
an arbitrary acceleration or velocity threshold.
The initiation of any effort will be important for understanding
training load and consequently it is not appropriate to just
consider the distance covered. This assertion is logical if we
consider, by way of example, the power lifting action in strength
and conditioning environments. During a clean, or a snatch,
while the movements are extremely powerful and fast and
require significant effort, the athlete does not move across the
surface of the lifting platform. The triple extension action

25
involved in this exercise is a foundation to the acceleration
effort and is why training these movements have become
common practice for strength and conditioning coaches to
include in programmes designed to improve acceleration and
maximum speed. Therefore, if the action is transferrable to
prescribe an appropriate training load but the athlete is not
covering any distance then it is apparent that there is a
limitation in any system that purely monitors movement
displacement. It is the initiation of effort, independent of speed
over the ground or the distance over the ground covered that
will contribute to the overall training load.
Additionally, it is relevant to consider the stretch–shortening
cycle in relation to monitoring acceleration capacity. The
stretch–shortening cycle (SSC) of muscle function comes from
the observation that body segments are periodically subjected
to impact or stretch forces. Running, walking and hopping are
typical examples in human locomotion of how external forces
(e.g. gravity) lengthen the muscle. In this lengthening phase the
muscle is acting eccentrically, then a concentric (shortening)
action follows. The true definition of eccentric action indicates

26
that the muscles must be active during stretch. This
combination of eccentric and concentric actions forms a natural
type of muscle function called the stretch–shortening cycle
(SSC) (Komi, 2008). Its principles lie in Newtons third law that
every action must produce an equal and opposite reaction. The
principles of the stretch shortening cycle have led to the
formation of plyometric training by strength and conditioning
coaches. Plyometrics is often the term now applied to exercises
that have their roots in Eastern Europe, where they were first
known simply as “jump training”. The actual term plyometrics is
based on Latin origins, plyo + metrics, interpreted to mean
“measurable increases”.
For an exercise to be truly plyometric, it must be a movement
preceded by an eccentric action. This results not only in
stimulating the proprioceptors sensitive to rapid stretch, but
also in loading the serial elastic components (the tendons &
cross-bridges between the muscle fibres) with a tension force
from which they can rebound (Chu, 1998).
The reason the stretch-shortening cycle is important in relation
to monitoring training load is that it is likely to influence the

27
individuals’ acceleration capacity and therefore can be applied
as an experimental intervention to assess the measurement of
training load. From a static start (where the athlete is held at
the start), there is no significant stretch shortening cycle action
during a maximal acceleration, however, there could be
improved acceleration capacity if a stretch shortening action is
created before acceleration (i.e. rocking in the blocks or
swaying from a standing start). These types of movements
would be common within football with landing from jumps,
decelerating maximally and re-accelerating again to change
pace with maximal changes of direction. Thus, understanding
their impact is important again if we aim to provide a more
holistic approach to the training load concept.
1.5 Research Proposal
Firstly, and most importantly - in football it has been observed
that players are rarely moving from a standing start (Akenhead
et. al 2013) therefore, quantifying maximal accelerations based
on thresholds defined from standing start maximal efforts could
be flawed. Current GPS technology applies thresholds in their
software for high accelerations based on literature obtained
28
from testing maximal accelerations from a standing start
position or from accelerations observed within match-play
(Aughey, 2011; Dwyer & Gabbett, 2012) Research suggests a
value of 2.78m.s-2 is appropriate (Varley & Aughey, 2013)
across team sports, despite this value having been obtained
from sports where the nature of the game is different in such
that players more than often are at a standing start and
accelerate maximally to try and break the opposition line.
Therefore, in terms of examining player load and the impact of
accelerations, we could be under-estimating the true ‘effort’ by
players simply because the magnitude of acceleration that they
complete isn’t reaching the set threshold (despite the initiation
of the observed response being physically demanding for
them).
Therefore, the aim of this study is to quantify the impact of
different commencement velocities on the maximum voluntary
acceleration capacity of individuals making maximum efforts.
Furthermore, in more dynamic situations where a stretch-
shortening cycle is introduced, the aim of the study is to
determine the impact of changing entry speed and deceleration

29
on the acceleration capacity of individuals making maximum
voluntary efforts.
We hypothesise that initial running speed will have a
detrimental effect on the capacity to maximally accelerate.
However, the introduction of a sudden deceleration, could
produce a stretch-shortening cycle action that may ‘boost’ the
acceleration capacity and improve the change of pace effect.

30
2. Systematic Literature Review
2.1 Rationale
The use of GPS technology to monitor performance in team
sports has evolved considerably over the past decade. With
these advancements in performance monitoring technology,
coaches, researchers, and sports scientists are now able to
use in-built accelerometer data to support in quantifying training
load with the aim of giving a more accurate description of the
high intensity activities involved within soccer and other team
sports.
Researchers believe that the ability to increase velocity or
accelerate is decisive in critical activities such as being first to
the ball, moving into space before an opponent and creating
and stopping goal-scoring opportunities during team sports
(Carling et. al 2008) (Reilly et. al 2000). To date, most of the
research on the use of GPS technology within soccer has
mainly focused on distance parameters such as the total
distance or high intensity running (Bradley et. al, 2009 & 2011;
Aughey, 2011), while acceleration data remains relatively
unexplored.
While researchers may agree that the athletes starting velocity
will influence the subsequent acceleration effort, as yet, there
has been only one piece of research to our knowledge that
considers precisely what effect that the initial velocity has on

31
the athletes’ capacity to maximally accelerate (Sonderegger
et.al, 2016).
The aim of this proposed research is therefore not only to
further examine the effect of starting velocity on the ability to
maximally accelerate in elite-level soccer players, but also to
determine which method of determining and quantifying the
magnitude of accelerations may be most reliable. Not only that,
this research also aims to examine the effect on a player’s
capacity to maximally accelerate after performing a movement
more specific to the demands of football, such as a sudden
deceleration.
The following literature review examines the available research
into the use of GPS as a performance monitoring tool with
regards to accelerations. It will go on to review the available
research on quantifying training load when considering
accelerations and their impact on fatigue, and look at how
some studies have categorized accelerations into low, medium,
and high intensity thresholds. It will also review the effect of
altering different aspects of small-sided games, a commonly
prescribed training activity, as this is important in understanding
the range of velocities involved in soccer which could impact on
the players starting speed.

32
2.2 Methods
The eligibility criteria for inclusion within the literature review
was that the sport was a field-based intermittent, high intensity
(HI) team sport (Soccer, AFL, Field Hockey, Rugby) including
either male or female participants and both adult & youth teams
with participants greater than age 16 years.
The search was conducted using the electronic databases
available through PubMed, Web of Knowledge, MEDLINE and
Google Scholar.
The search strategy involved the input of a number of key
words into each of the databases.
The key words used for the search were as follows:
1. GPS AND (Team Sport) (Soccer) (Football) (AFL) (Rugby)
(Field Hockey)
2. GPS AND Accelerations
3. Accelerations Team Sports
4. GPS AND Accelerometry
5. Accelerations AND Soccer
6. Accelerations AND Team Sports
7. Accelerations OR Velocity AND (Team Sports) (Soccer)

33
The selected appropriate studies were identified by title and
abstract, mainly that they included the use of GPS and/or
Accelerometery and examined movement demands within
soccer or another field based sport. Review Studies were not
included. Studies that were selected in the initial search were
then read and analysed in full and inclusion within this literature
review was based on whether they would give detail on how
GPS has been used to determine training load within team
sports and or how the use of Accelerometery data is now
adding to the current base of research in attempting to better
understand the movement demands of team sports and the
concept of training load, particularly in soccer.
2.3 Study Summary
Profile of Subjects
Mainly, two sports were analysed during the review of the
literature, a number of which focussed specifically on soccer
and the other across AFL (Australian Rules Football). The
majority of the subjects analysed within the literature were of
elite status, with one or two studies using well-trained but sub-
elite, semi-professional or youth players. Of all the studies
analysed, all subjects were Male and all were all greater than
16 years old. This is consistent with the profile of subjects used
within this study.

34
GPS devices
The majority of the research examined used GPS devices from
the main suppliers; being either Catapult sports or GPSports.
The frequency of GPS units most commonly cited were 10Hz
units with some of the earlier research using 5Hz devices. One
paper analysed used a Local Position Measurement (LPM)
system. The accelerometers examined within the research
were sampling at 100Hz. This is consistent with the GPS
devices used within our study.
Validity & Reliability of GPS Devices
Aughey looked to compare both 5 Hz and 10 Hz GPS Units
with regards to measuring accelerations. Aughey noted that 10-
Hz GPS devices can at least accurately determine that an
acceleration or deceleration has occurred (Aughey, 2011). This
has implications for the analysis of team sports as researchers
can determine the number of accelerations or decelerations
undertaken by athletes during training or in match play.
However, it was further noted that the accuracy of measuring
these changes in velocity during the deceleration efforts was
poor. This is worth noting regarding our own proposed
research.
35
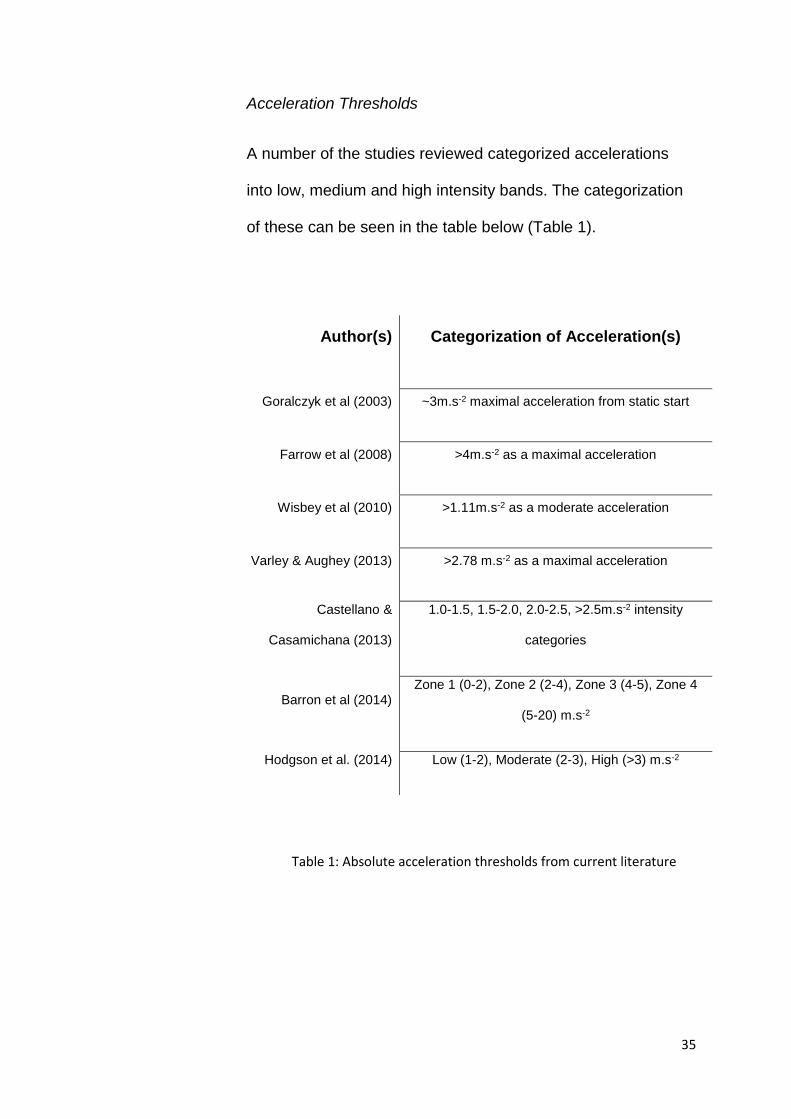
Acceleration Thresholds
A number of the studies reviewed categorized accelerations
into low, medium and high intensity bands. The categorization
of these can be seen in the table below (Table 1).
Author(s) Categorization of Acceleration(s)
Goralczyk et al (2003) ~3m.s-2 maximal acceleration from static start
Farrow et al (2008) >4m.s-2 as a maximal acceleration
Wisbey et al (2010) >1.11m.s-2 as a moderate acceleration
Varley & Aughey (2013) >2.78 m.s-2 as a maximal acceleration
Castellano &
Casamichana (2013)
1.0-1.5, 1.5-2.0, 2.0-2.5, >2.5m.s-2 intensity
categories
Barron et al (2014) Zone 1 (0-2), Zone 2 (2-4), Zone 3 (4-5), Zone 4
(5-20) m.s-2
Hodgson et al. (2014) Low (1-2), Moderate (2-3), High (>3) m.s-2
Table 1: Absolute acceleration thresholds from current literature

36
Controlling the Entry Speed
Two studies that were reviewed had previously used a protocol
to control player running speed to a prescribed value.
In the study by Aughey (2011) the participants were asked to
produce an acceleration effort from a range of starting
velocities common within team sports (1.0 - 6.0 m.s-1).
Participants were given a radio device to hold throughout each
trial which provided feedback through different audio cues. The
subjects would hear a low sounding pitch if their starting speed
was too low, a high pitch if they were running too fast and
silence if they were running at the correct prescribed speed.
The subjects would then hear an alternating pitch once they
had maintained constant velocity at the prescribed speed for a
minimum of 2 seconds at which they were informed to
accelerate maximally for several seconds before then
decelerating to a complete stop.
Sonderegger et.al (2016) used a paced runner who received
short auditory signals through a headset which ensured that
players met the targeted initial running speed before
acceleration. Markers were placed on the pitch every 5m that
indicated the target distance covered between two auditory
signals. Players on each side of the paced runner adopted the
target running speed. The players maintained this target
running speed for 25±40 m and at an arbitrary time point, the

37
paced runner blew a whistle, which signalled the players were
to accelerate maximally from that point.
2.4 Main findings
To fully understand accelerations and their effect on soccer
performance, it is important first that we understand their
physical definition and how they interact with other key
performance measures. Research by Little and Williams (2005)
was one of the first to examine this area.
Little & Williams acknowledged that the capacity of soccer
players to produce varied high-speed efforts had previously
been established to impact on soccer performance (Luhtanen
1994). They defined Acceleration as the rate of change in
velocity that allows a player to reach maximum velocity in a
minimum amount of time. This research noted that although the
average sprint distance in match-play is small, at around 17m
(Bangsbo 1994), players often initiate sprints when already
moving at moderate speeds (Young et. al 2001a; Young et. al
2001b). The purpose of Little and Williams study was to
determine the extent to which max speed, acceleration and
agility were distinct physical attributes in professional soccer
players.
106 male professional soccer players from the English league
teams took part in the Little & Williams study. GPS and inertial
sensor technology was not available at the time of this

38
research, and so acceleration was calculated using a 10m test
involving sprinting 10m as fast as possible from a stationary
start position (same method as previously used by Wilson et al
1993). According to the results of this study, it appeared that
acceleration, maximum speed, and agility were relatively
independent attributes in professional soccer players.
At the time, no criterion test existed for acceleration, maximum
speed and agility and it was suggested that further research is
needed to address this issue if research concerning sprint
performance was to progress in a coherent manner. The
findings suggested that testing procedures for acceleration,
maximum speed and agility should be utilised in sports science
support with elite soccer players. They proposed that the
specificity of acceleration, maximum speed and agility that they
observed may be attributed to differences in the musculature
recruited; in the requirements of strength to be developed at
specific muscle lengths; in the requirements for strength to be
developed in either shortening or lengthening contraction
modes; or in the complex motor control and coordination of
several muscle groups.
With the introduction of GPS technology, research on
accelerations could progress. Perhaps one of the most
important pieces of literature reviewed is that of Aughey in
2011, despite their research coming from Australian Football as
opposed to Soccer.
39
The authors noted that commercially available GPS units,
sampling at 5-Hz, which could enhance the ability to measure
short duration, high intensity activities, were heavily used within
Australian football. It should also be noted that Australian
football differs from soccer in several aspects, not solely
including the fact that unlimited substitutions are allowed during
matches, however there are also many performance aspects
that are similar to that in soccer.
The Aughey 2011 study used 5-Hz GPS devices to record
player movement. Running performance was expressed per
period of the match divided into low intensity activity (0.1-4.17
m.s-1), high intensity running (4.17-10 m.s-1) and maximal
accelerations (2.78–10m.s-2). It was found that maximal
acceleration performance was reduced towards each rotation
of the second half of matches. The study also found that both
high intensity running and maximal accelerations are reduced
later in games, indicative of significant fatigue in players.
The aim of the Aughey research was to quantify player work
rate in Australian football with 5-Hz GPS devices and express
player work rate per unit of game time played. 18 elite
Australian footballers took part in the study and data was
collected from the 18 players between 1 and 17 occasions from
29 individual matches. The player work rate measurements
were calculated via Catapult GPS devices. The number of
maximal (>2.78 m.s-2) changes in velocity (i.e. accelerations)
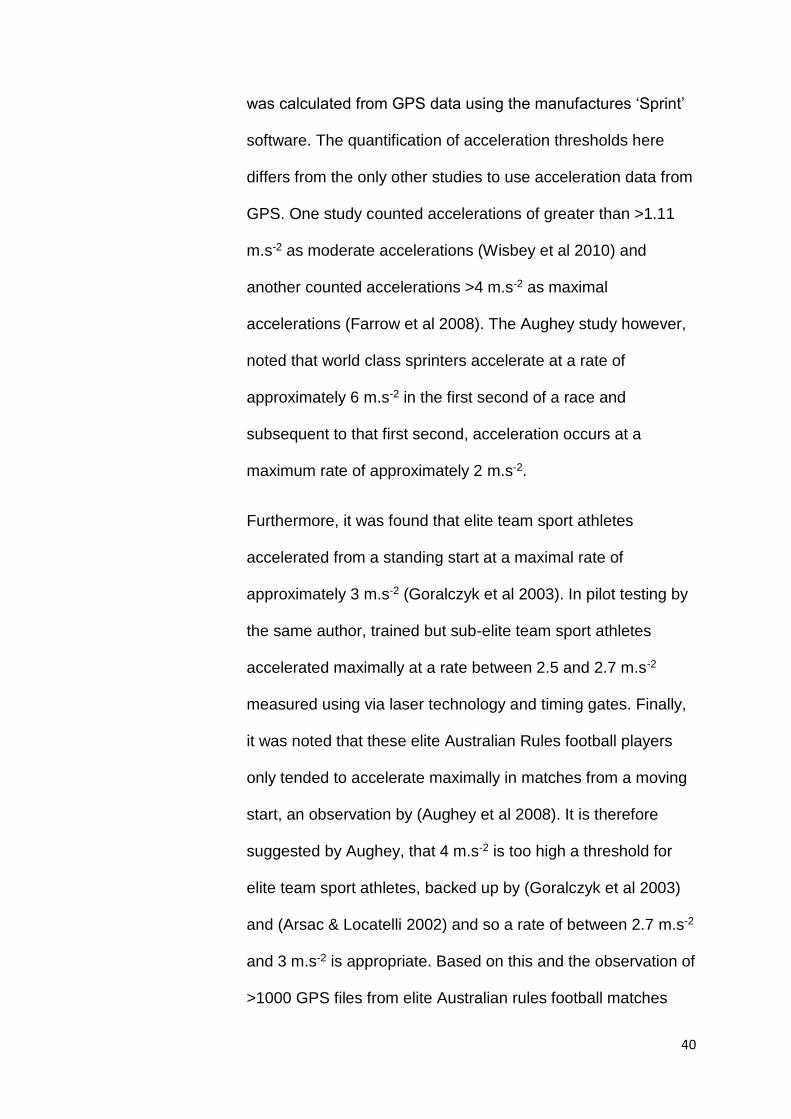
40
was calculated from GPS data using the manufactures ‘Sprint’
software. The quantification of acceleration thresholds here
differs from the only other studies to use acceleration data from
GPS. One study counted accelerations of greater than >1.11
m.s-2 as moderate accelerations (Wisbey et al 2010) and
another counted accelerations >4 m.s-2 as maximal
accelerations (Farrow et al 2008). The Aughey study however,
noted that world class sprinters accelerate at a rate of
approximately 6 m.s-2 in the first second of a race and
subsequent to that first second, acceleration occurs at a
maximum rate of approximately 2 m.s-2.
Furthermore, it was found that elite team sport athletes
accelerated from a standing start at a maximal rate of
approximately 3 m.s-2 (Goralczyk et al 2003). In pilot testing by
the same author, trained but sub-elite team sport athletes
accelerated maximally at a rate between 2.5 and 2.7 m.s-2
measured using via laser technology and timing gates. Finally,
it was noted that these elite Australian Rules football players
only tended to accelerate maximally in matches from a moving
start, an observation by (Aughey et al 2008). It is therefore
suggested by Aughey, that 4 m.s-2 is too high a threshold for
elite team sport athletes, backed up by (Goralczyk et al 2003)
and (Arsac & Locatelli 2002) and so a rate of between 2.7 m.s-2
and 3 m.s-2 is appropriate. Based on this and the observation of
>1000 GPS files from elite Australian rules football matches

41
and training sessions, it would appear that 2.78 m.s-2 is an
appropriate threshold for maximum acceleration in elite
Australian football players.
The Aughey study stated that for the first time, they have
characterized the number of maximal accelerations players
undertake during matches and reported a decline in this ability
in the latter stages of a match. It is perhaps not surprising that
this ability is impaired as to accelerate is extremely physically
demanding especially from low commencement velocities and
therefore it is likely to induce significant fatigue. Furthermore,
the researchers also agreed that accelerations are associated
with key elements of the game, including the ability to
accelerate towards or away from a tackle or move into space to
receive the ball. Notwithstanding that the measurement of
accelerations using GPS technology is potentially less reliable,
than the measure of say, total or high intensity running distance
(Jennings et al 2010), this may reflect an important indicator of
fatigue. They proposed that further work was therefore needed
to determine the reliability and validity of GPS for measuring
these accelerations.
Unsurprisingly then, this proposed research was carried out. It
is critical to establish the reliability of using GPS devices for
measuring accelerations for my proposed research to be valid.
Therefore, the research by Varley and Aughey in 2013 is an
important piece of literature that gives credit to this.

42
The researchers agreed that the ability to increase velocity or
accelerate (Little and Williams definition, 2005) is decisive in
critical activities such as being first to the ball, moving into
space before an opponent and creating and stopping goal-
scoring opportunities during team sports – also agreed by
(Carling et al 2008) & (Reilly et al 2000). In addition, they
believed that to accelerate is more energetically demanding
than constant velocity movement (an observation by research
from Osgnach et al 2010) but to date no method has been
satisfactorily validated for the measurement of these
accelerations in team sports. They acknowledged that
quantification of the acceleration and deceleration demands of
team sports would add great value to the existing body of
knowledge if a satisfactory measurement tool was available.
Little was then known about the ability of GPS to measure
these qualities but the use of GPS technology to quantify the
physical demands (in terms of distances etc.) of team sports
athletes was commonplace during training and match play (all
backed up by research from Aughey 2011, Brewer et al 2010,
Coutts et al 2010, Duffield et al 2009, Farrow et al 2008,
Wisbey et al 2010).
The aim of this piece of research (Aughey, 2011) therefore was
to determine the validity and reliability of 5- and 10-Hz GPS
devices for measuring instantaneous velocity during the

43
acceleration, deceleration and constant velocity phases of
straight line running.
In this study (Aughey 2011), 3 sub-elite team sport athletes
were used. As the primary measure of this study was the raw
GPS data, the number of participants did not reflect the sample
size as it is the number of samples collected and trials
undertaken that were of most importance. An important point to
note from the Aughey, 2011 study was the experimental
protocol and their methods in controlling the speed of running.
The participants were asked to perform straight line running
along a marked white line. Each trial required the participant to
establish and maintain a constant running velocity before
performing an acceleration effort and finally decelerating to a
complete stop. In total, 80 straight line running trials were
undertaken. The subjects wore either two 5-Hz or two 10-Hz
GPS Catapult devices on their back, in the standard position
between the scapulae. The participants were asked to produce
an acceleration effort from a range of starting velocities
common within team sports (1.0 - 6.0 m.s-1), an important point
to note for the design of my own proposed research.
Participants were provided with instant feedback on their
velocity during each of the trials. A computer was connected to
a laser and using custom software, instantaneous velocity data
was obtained during each run. The participants were also given
a radio device to hold throughout each trial which provided

44
feedback through different audio cues. The subjects would hear
a low sounding pitch if their starting speed was too low, a high
pitch if they were running too fast and silence if they were
running at the correct prescribed speed. The subjects would
then hear an alternating pitch once they had maintained
constant velocity at the prescribed speed for a minimum of 2
seconds at which they were informed to accelerate maximally
for several seconds before then decelerating to a complete
stop.
It was noted that higher starting velocities improved the
measurement accuracy for detecting accelerations with both
the 5- and the 10-Hz devices. – perhaps due to lower
acceleration rates. This study was the first to determine the
validity and reliability of 5- and 10-Hz GPS units for measuring
instantaneous changes in velocity. It was also noted that
participants reached a maximum speed of ~7.5 m.s-1.
Incidentally, similar top speeds have been reported in team
sports athletes including elite soccer players (~7.6 m.s-1)
(Bradley at al 2009) and also in Australian Footballers (~8.6
m.s-1) (Young et al 2001a).
Aughey noted that 10-Hz GPS devices can at least accurately
determine that an acceleration or deceleration has occurred.
This has implications for the analysis of team sports as
researchers can determine the number of accelerations or
decelerations undertaken by athletes during training or in

45
match play. However, it was further noted that the accuracy of
measuring these changes in velocity during the deceleration
efforts was poor. This is worth noting regarding our own
proposed research.
GPS accuracy was negatively affected by a high rate of change
in velocity when decelerating. Although an increased sampling
rate, i.e. the 10-Hz devices, improved this accuracy,
researchers may simply be limited to reporting the occurrence
of decelerations as opposed to attempting to quantify their
magnitude in terms of distance and duration.
The Aughey (2011) study was limited too in its specificity to
team sport movement demands as athletes often change
direction, whereas only linear running was recorded. Therefore,
importantly, it was suggested that future research should
investigate the validity and reliability of GPS technology for
measuring changes in velocity during non-linear movements
and changes of direction.
And so, with the establishment of reliable and valid acceleration
measurements from GPS technology, research moved forward
and sports scientists and researchers began trying to measure
these accelerations and examine what effect they had or what
impact they had on performance.
In terms of gaining an understanding of different training
modes, and being able to understand what effect that they

46
might have on the physical demands and acceleration profile
on soccer players, it is important to examine the research on
small-sided games. Small-sided games are a commonly used
training tool within soccer training and in terms of my proposed
research, I was interested to examine whether altering different
aspects of small-sided games would influence the speed at
which the players move, thus potentially altering their starting
velocity and perhaps then their acceleration capacity.
Therefore, the paper by Castellano & Casamichana in 2013
was one of the first to do this in terms of training and match
data in soccer.
The aim of this study (Castellano & Casamichana, 2013) was
to compare small-sided games and friendly matches with
respect to the number of accelerations in different intensity
ranges. The study used 27 semi-professional soccer players
from the Spanish third division. The data collected from friendly
matches was gathered from seven separate 11-a-side games
whereas the small-sided game data was gathered over a 5-
week period from 9 different training sessions and the formats
varied from 3v3, 5v5 and 7v7. The relative pitch area per player
was kept constant at 210m2 and the width to length ratio was
also maintained constant throughout. Each small-sided game
lasted 4 minutes, with 3 repetitions and 2 minutes recovery
(3x4mins:2mins). The study used 10 Hz Catapult GPS devices
and specifically the accelerometer data. This study monitored

47
each of the accelerations recorded within different intensity
ranges. These ranges were as follows; 1.0-1.5 m.s-2, 1.5-2.0
m.s-2, 2.0-2.5 m.s-2 and >2.5 m.s-2.
The categories therefore were not established per the maximal
accelerations achieved by the players used within the study.
Instead, the researchers referred to the study by Aughey in
2011 that found that semi-pro team sport athletes achieve
maximal acceleration values above 2.5 m.s-2. The numbers of
accelerations were normalised and made relative to per hour of
activity. The Castellano study found that there were significant
differences between small-sided games and friendly matches in
all but one of the acceleration intensity ranges, with the
exception being the highest category (>2.5 m.s-2). This
research was the first study in the soccer context to compare
small-sided games and friendly matches with respect to the
number of accelerations. The results showed that the number
of accelerations was higher during small-sided games used as
part of the training regime than it was in full size, 11v11 friendly
matches. The researchers suggested this could be due to a
greater neuromuscular fatigue and increased metabolic cost
during the matches, therefore limiting the amount of
accelerations due to fatigue (but the authors did not recognise
the increased player contacts that would arise from smaller
pitch game play as an important factor here).

48
However, what the Castellano study did highlight is that, when
monitoring player performance, it is important to consider
accelerations. Within small-sided games as part of training,
accelerations occur very frequently whereas high intensity and
sprint distance could remain low (this is most likely due to the
small pitch dimensions and lack of space to run in to in order to
reach higher speeds). Therefore, the failure to quantify
accelerations correctly could lead us to underestimate the
amount of high intensity activity engaged in by players, a
statement agreed with by the research from Varley & Aughey in
2013.
Hodgson et al (2014) aimed to quantify the time-motion
characteristics and technical demands of small-sided games
played on small, medium and large pitch sizes using the
Catapult GPS system that allowed assessment of acceleration
and deceleration patterns. The study used 8 male soccer
players who each played 4x4 minute with 3 minutes recovery
on a small (20x30 m), medium (40x30 m) and large (50x40 m)
pitch size. For this study, accelerations were organized or
categorized as low (1-2 m.s-2), medium (2-3 m.s-2) and high (>3
m.s-2). The researcher was interested at looking at the distance
covered within these acceleration zones. i.e. the distance spent
accelerating at low, medium or high intensity. The results from
this study showed that the total distance covered in the
different acceleration zones ranged from 230±111 to 356±72m.

49
The Hodgson et. al (2014) study provides more data
demonstrating the acceleration patterns observed in small
sided games and showing that they are relatively greater than
those observed during professional match play on larger pitch
sizes. With that in mind, the researchers suggested that small-
sided games might offer a density type conditioning stimulus
with regards to accelerations and decelerations.
Akenhead et al (2014) stated that recent advances in
technology have increased the location sampling rate of GPS
allowing a greater level of precision and increased ability to
account for discrete movement over short distances (backed up
by the paper by Varley et al 2012). These advances allow for a
more precise study of the high intensity activities that are
thought to better characterise soccer specific fitness. (Mohr,
Krustrup and Bangsbo, 2003). Additionally, this higher
frequency technology allows the acceleration demands to be
more accurately quantified (Varley et. al 2012). This research
also agreed that there is a greater energy cost and muscular
demand with acceleration movements and that previous time-
motion analysis research may have underestimated the
physical demands of soccer (Osgnach et al 2010, Varley &
Aughey 2013).
Within this study (Akenhead et al 2014), the pitch sizes gave a
relative pitch area per player of 60, 120 and 200 m2
respectively. The participants wore 10 Hz Catapult GPS units
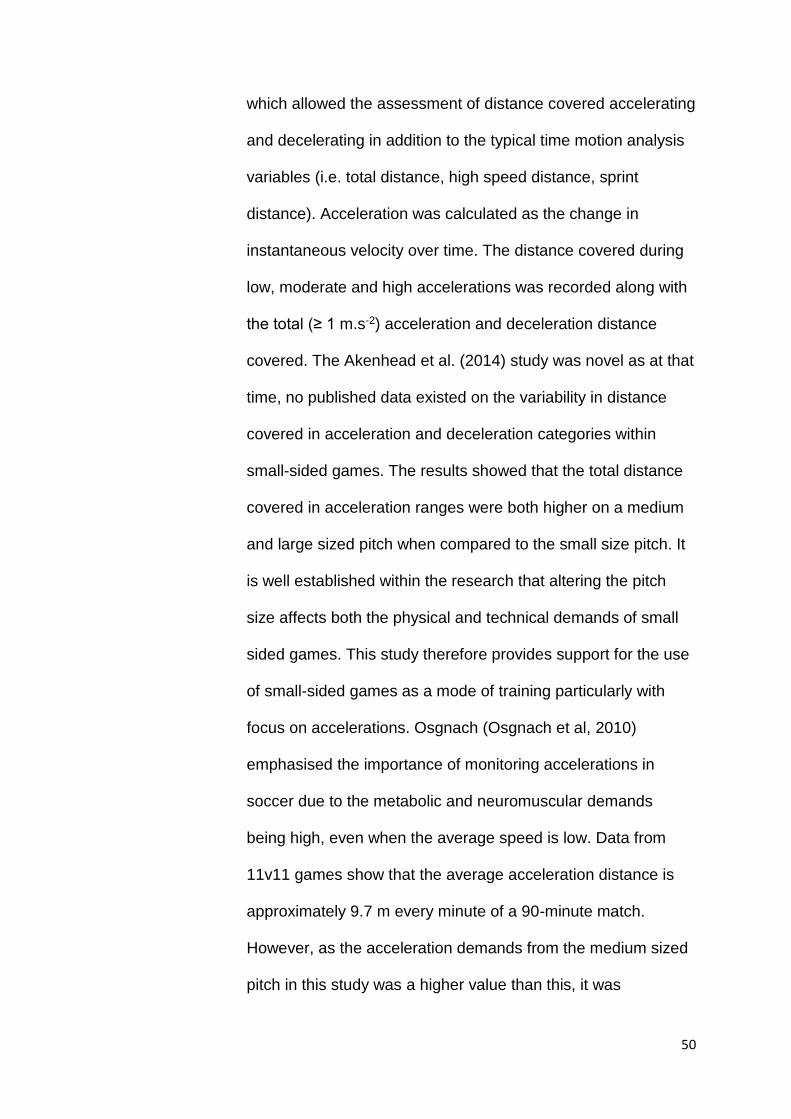
50
which allowed the assessment of distance covered accelerating
and decelerating in addition to the typical time motion analysis
variables (i.e. total distance, high speed distance, sprint
distance). Acceleration was calculated as the change in
instantaneous velocity over time. The distance covered during
low, moderate and high accelerations was recorded along with
the total (≥ 1 m.s-2) acceleration and deceleration distance
covered. The Akenhead et al. (2014) study was novel as at that
time, no published data existed on the variability in distance
covered in acceleration and deceleration categories within
small-sided games. The results showed that the total distance
covered in acceleration ranges were both higher on a medium
and large sized pitch when compared to the small size pitch. It
is well established within the research that altering the pitch
size affects both the physical and technical demands of small
sided games. This study therefore provides support for the use
of small-sided games as a mode of training particularly with
focus on accelerations. Osgnach (Osgnach et al, 2010)
emphasised the importance of monitoring accelerations in
soccer due to the metabolic and neuromuscular demands
being high, even when the average speed is low. Data from
11v11 games show that the average acceleration distance is
approximately 9.7 m every minute of a 90-minute match.
However, as the acceleration demands from the medium sized
pitch in this study was a higher value than this, it was
51
suggested that the small-sided games may offer a density type
condition stimulus with regards to accelerations.
With the smaller pitch size (20x30m), it was suggested that this
reduced the active playing area and required the players to
make faster decisions and execute skills with higher frequency
– as shown by the technical analysis within this study.
However, the potential for players to frequently accelerate
and/or attain a high running speed is compromised and this
could be why we see less efforts overall, particularly at the
higher ranges. However, it could also be due to the initial
starting velocities influencing the capacity to accelerate. This
was acknowledged by the researchers as they stated that there
remains a degree of error. The study was unable to distinguish
between acceleration movements commencing from different
speeds, suggesting that they have different mechanical and
physiological consequences. For example, an acceleration of 2
m.s-2 resulting in a change of velocity from 0 m.s-1 to 2 m.s-1 will
pose a different physical demand than an acceleration resulting
in a change of speed from 2 to 4 m.s-1. Whilst they were not
able to accurately characterise the incidence of different
starting speeds, by reporting the distance covered in the
acceleration ranges as opposed to the time spent, it is
suggested that they have been able to proportionally
discriminate between acceleration movements at high and low
speeds.

52
The importance of acceleration movements in football is an
area that warrants further research. The ability to repeat
acceleration efforts is an important ability to train, particularly if
these are the movements that may impact fatigue in football.
Furthermore, researchers and sports scientists are using the
accelerometer derived data to try and better establish player
loading and training load. One of the first papers to establish
this was from Barron et al in 2014. This study aimed to
investigate the acceleration, deceleration, and tri-axial player
load during competitive youth football. External loads are the
variables manipulated to induce internal stress and include the
number, duration and velocity of activities and acceleration or
deceleration movements (Lovell & Abt, 2013). They also
acknowledged that recently, at the elite level, highly portable
global positioning systems (i.e. the GPS devices) have been
adopted to monitor training activities. Also, they supported the
statement that successful performance is not simply related to
high speed movement but to the ability to accelerate, defined
as the rate of change in velocity (Little & Williams, 2005) and
that accelerations are energetically demanding tasks (Osgnach
2010) again linked to game changing movements (e.g. beating
an opponent to the ball, intercepting a pass or creating a
scoring opportunity). They quoted that “The integration of
accelerometers and GPS has enabled measurement of these
movements with the total mechanical stress experienced by the

53
player, recorded during quick changes in direction, jumping and
collisions” (Barret et. al, 2014).
The summation of acceleration/deceleration movements in
each anatomical plane provides an estimate of the total body
load (x –sideways, y – forwards, z – vertical). They claimed that
research into soccer is limited, but in Australian football; it was
found that 8 times as many accelerations were performed when
compared to maximum sprint efforts (Varley and Aughey,
2013). Again, interestingly, maximum accelerations do not
always precede a maximum velocity movement and failure to
describe this activity or these movements would underestimate
external load (Osgnach et al 2010, Akenhead et al 2013). What
was novel was that it also appears that these high acceleration
movements are dependent on playing position; where studies
show that central defenders completed fewer maximal
acceleration efforts when compared to wide defenders. The
Barron research used 38 well trained sub-elite youth soccer
players who each competed in 8 home English college fixtures
and wore 10Hz Catapult GPS units with accelerometer
sampling at 100Hz. The acceleration categories for this study
were categorized according to the manufactures ‘Sprint’
software default settings and were as follows. Zone 1 (0 to 2),
zone 2 (2 to 4), zone 3 (4 to 5), zone 4 (5 to 20 m.s-2) . This
study profiled the positional acceleration and deceleration
characteristics and ‘Player Load’ during competitive youth

54
soccer for the first time. Previous observations about
acceleration profiles within the research are, as we have seen,
mixed. Variation in playing formation produces different activity
profiles and logically different acceleration/deceleration profiles
(Bradley et al 2009).
It was found that between halves, there were no reductions in
the highest rates of acceleration or decelerations. Similar
findings were reported by Akenhead et al (2013) and Wehbe et
al (2014) and could suggest the idea of a pacing strategy.
Agreeing that accelerating is more energetically demanding
than constant velocity movement (Osgnach et al 2010) -
reducing low and moderate acceleration efforts may preserve
the capacity to perform high level changes in velocity.
In profiling the external characteristics of competitive youth
football and for the first time by identifying differences in
maximal acceleration and deceleration activity and tri-axial
player load, this study (Barron et al, 2014) produced data that
could be combined with video analysis to improve the
interpretation and usefulness of findings.
Sonderegger noted that the fact that acceleration decreases
with increasing initial running speed is ignored and therefore
introduces a bias. Therefore, percentage acceleration was
calculated as the ratio of the maximal acceleration of the action
and the maximal voluntary acceleration that can be achieved

55
for a particular initial running speed in an aim to remove this
bias (Sonderegger et. al, 2016).
In the Sonderegger study, seventy-two highly trained junior
male soccer players (17.1 ± 0.6 years) completed maximal
sprints from standing and three different constant initial running
speeds defined as; (trotting: ~6.0 km.h-1; jogging: ~10.8 km.h-1;
running: ~15.0 km.h-1).
The results from that study showed that the maximal
acceleration was 6.01 ± 0.55 m.s-2 from a standing start, 4.33 ±
0.40m.s-2 from trotting, 3.20 ± 0.49 m.s-2 from jogging and 2.29
± 0.34 m.s-2 from running. Importantly, the maximal
acceleration correlated significantly with the initial running
velocity (r = ±0.98).
Sonderegger proposed to classify high-intensity actions as
accelerations >75% of the maximal acceleration, corresponding
to acceleration values of >4.51 m.s-2 initiated from standing,
>3.25 m.s-2 from trotting, >2.40 m.s-2 from jogging, and >1.72
m.s-2 from running.
The main findings from the Sonderegger study were that the
use of percentage acceleration avoids the bias of
underestimating actions with high and overestimating actions
with low initial running speed. Furthermore, percentage
acceleration allows determining individual intensity thresholds
that are specific for one population or one single player.

56
However, limitations of the Sonderegger study were that it
wasn’t carried out using current GPS and Accelerometry units
from the main suppliers. Furthermore, it also failed to highlight
what impact more dynamic or football specific movements,
such as a deceleration may have on the consequent
acceleration.
In conclusion, this literature review has examined the use of
GPS technology within team sports and demonstrated that
accelerations are a vital performance aspect to measure when
assessing overall training and match loading on a player. The
literature agrees that there is still more to explore within this
area of research. The research conducted here will add to the
current research available as it further highlights the effect of
starting velocity on the capacity to measure maximum
acceleration using current GPS and Accelerometry technology
and additionally, will distinguish between different methods of
measuring these accelerations. Furthermore, it will examine to
what extent a sudden deceleration may impact acceleration
capacity – an area yet to be explored within the literature. The
data generated and its analysis will help researchers and sport
scientists better understand the limits on applying discrete
acceleration thresholds and promote individualisation of GPS
parameter thresholds that will improve our overall
understanding and quantification of the training load concept.

57
3. Methods
3.1. Participants
Fifteen male football players from the Development Squad of
an elite Scottish Premier League club took part in the study
during the pre-season phase of the 2015/2016 season in
Scotland. The players covered a range of playing positions
(GK, FB Def, W Mid, C Mid, Att). The subjects had a mean age
of 17.4±0.6 years, with a mean height of 176±8 cm and weight
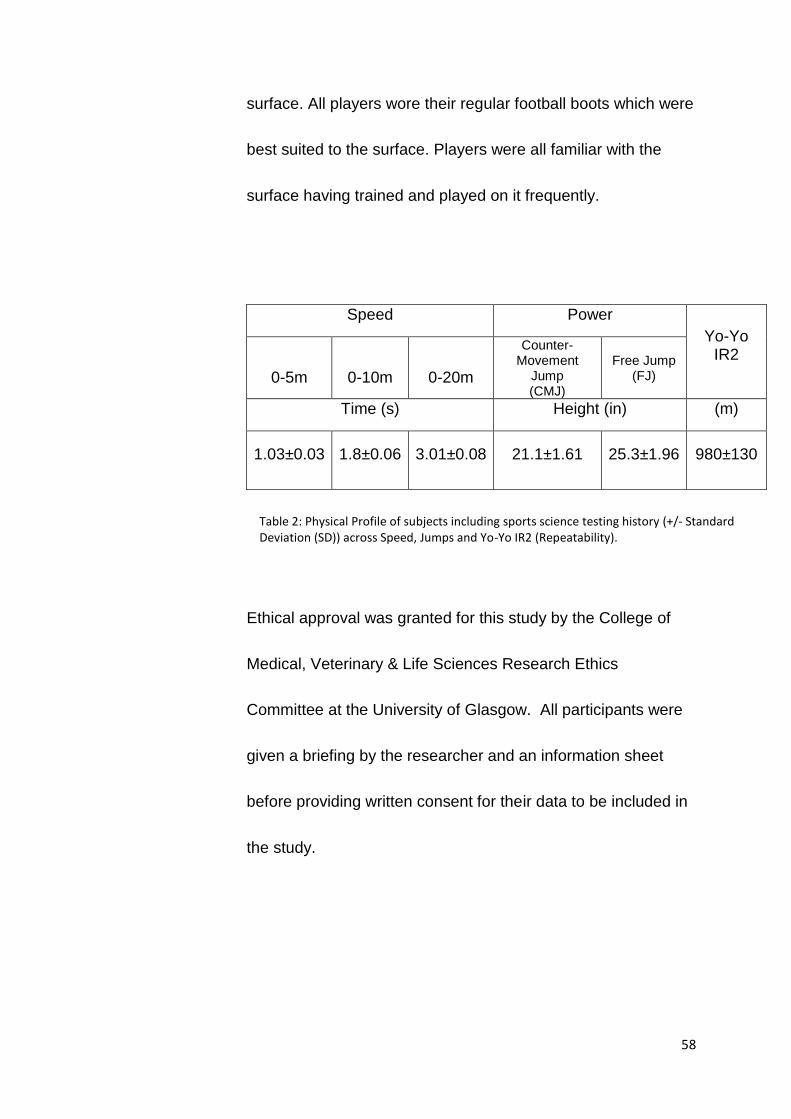
of 72±6 kg. Their physical profile along with sports science
testing history in standard speed and power tests can be seen
in Table 2.
Testing took place between July and August 2015 at the clubs
training ground. In total, each subject completed a minimum of
22 trials giving a total of 330 GPS data traces available for
analysis. Any efforts in which the participants did not meet the
required test protocol were ruled out and participants were
asked to complete the test again once fully recovered.
Weather conditions were consistent throughout the trials (dry,
no wind), with testing taking place outdoors on a 4G artificial
58
surface. All players wore their regular football boots which were
best suited to the surface. Players were all familiar with the
surface having trained and played on it frequently.
Speed Power
Yo-Yo IR2
0-5m
0-10m
0-20m
Counter-Movement
Jump (CMJ)
Free Jump (FJ)
Time (s) Height (in) (m)
1.03±0.03 1.8±0.06 3.01±0.08 21.1±1.61 25.3±1.96 980±130
Ethical approval was granted for this study by the College of
Medical, Veterinary & Life Sciences Research Ethics
Committee at the University of Glasgow. All participants were
given a briefing by the researcher and an information sheet
before providing written consent for their data to be included in
the study.
Table 2: Physical Profile of subjects including sports science testing history (+/- Standard Deviation (SD)) across Speed, Jumps and Yo-Yo IR2 (Repeatability).

59
3.2. GPS Units
Catapult OptimEye X4 10-Hz GPS units (Catapult Innovations,
Australia) were worn in vests designed by Catapult Sports with
a padded pouch for the unit located in the back. When placed
in the vest, the unit sits in the upper thoracic region of the spine
between the scapulae – See Figure 2.
The GPS units, measuring (96mm x 52mm x 14mm, &
weighing 67 g) have tri-axial accelerometer, gyroscope and
magnetometer sampling frequencies of 100-Hz. Participants
were all familiar with wearing the GPS units as they are worn
regularly during training. Each unit was assigned to a player
Figure 2. Example Position of GPS Unit wore in vest across participants back.

60
for the duration of the season and so for each trial, players
wore the same unit.
3.3. Test Protocol
The players were asked to complete 3 different running tests
that would require them to accelerate maximally from either a
standing start position, from a controlled run-in speed or after a
period of deceleration.
The first test required the players to complete a maximal
acceleration effort over 20m from a standing start. Players
assumed a static start position with two foot points of contact
and were instructed to run whenever they felt ready – there
was no reactions cue or stimulus to “go!” for the participant.
See Figure 3.
The second test required the players to complete a maximal
acceleration effort from a range of different run in speeds. The
selected speeds were 3, 4, 5, 6, & 7 m.s-1 respectively. These
speeds were selected to match the different speeds players
would often achieve in training and in match play as indicated
from the previous literature (Bradley et al. 2009).

61
The selected speeds in km.hr-1 translated as – 10.8, 14.4, 18,
21.6 & 25.2 km.hr-1. Our own speed thresholds currently set on
the system for monitoring training for velocity bands were <14
km.hr-1 – running, 14-21 km.hr-1 – fast running, 21-24 km.hr-1
– high intensity running, >24 km.hr-1 – sprinting.
Finally, the third test required the players to complete a
maximal acceleration in a ‘Hollow’ type sprint test. Typically,
‘Hollow sprints’ involve the performance of two sprints
interrupted by a short ‘hollow’ period of recovery that might
include walking or jogging. However, in our experimental
design we instructed the participant to decelerate within a 2m
zone, after a controlled run-in speed of between 3 and 7 m.s-1
as before, and on exiting the deceleration zone they were
instructed to maximally re-accelerate again.
In total, each player completed a minimum of 22 maximal
efforts over the course of the tests. The players completed
these tests on different days and in a randomly selected order
in an aim to reduce the impact of a learning or training effect.
For each testing trial, a consistent and standardized warm up
protocol led by the researcher was used which consisted of 15
62
minutes of dynamic movements, stretching and finishing with 3
sub-maximal 20m linear efforts. The GPS units were switched
on before the warm up to allow time for the GPS signal to be
picked up before the start of testing. The distances for each
trial were measured using a steel tape.
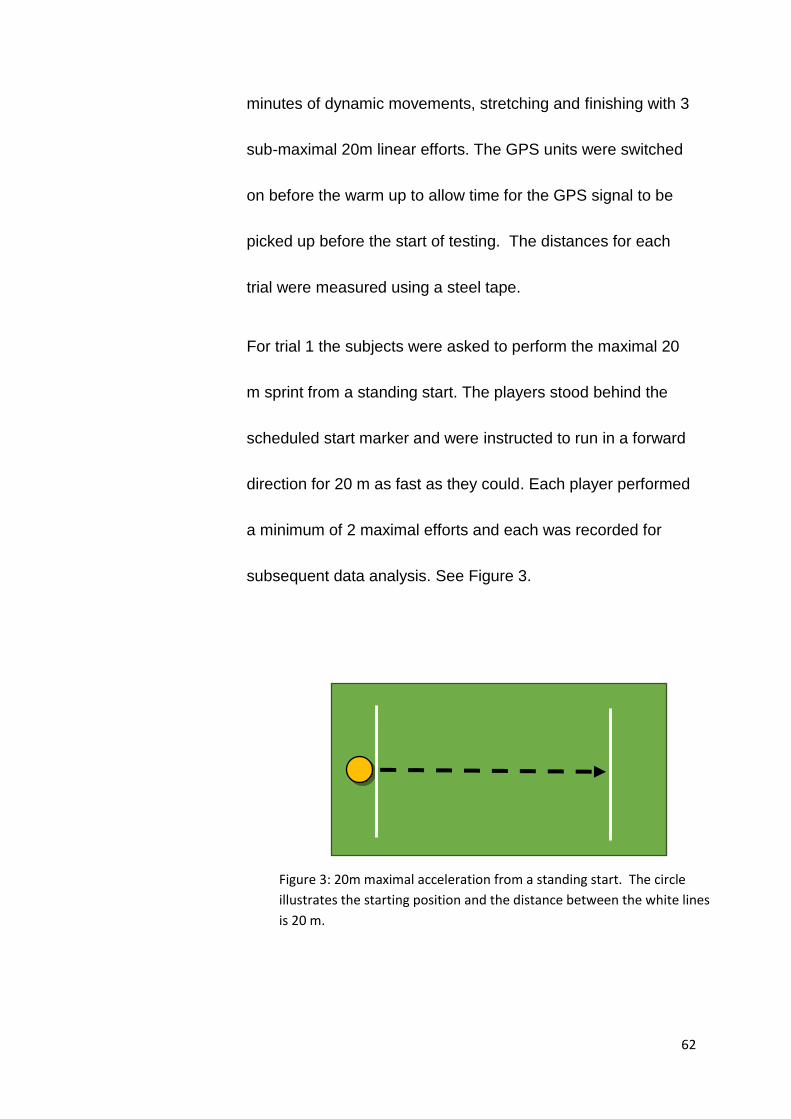
For trial 1 the subjects were asked to perform the maximal 20
m sprint from a standing start. The players stood behind the
scheduled start marker and were instructed to run in a forward
direction for 20 m as fast as they could. Each player performed
a minimum of 2 maximal efforts and each was recorded for
subsequent data analysis. See Figure 3.
Figure 3: 20m maximal acceleration from a standing start. The circle
illustrates the starting position and the distance between the white lines
is 20 m.

63
For trial 2, we wanted to simulate non-standing start conditions
and run-in speeds of 3, 4, 5, 6 & 7 m.s-1. To do so, marker
cones were placed at intervals of 3 m, 4 m, 5 m, 6 m, & 7 m
respectively and each player was instructed that they had 1s to
travel between each marker cone, before reaching the final
marker cone signalled by a different colour where they were
instructed to accelerate maximally from that point to 20 m. See
Figures 4a & 4b. The players were given the 1 second time
intervals by the researcher calling out elapsed seconds from a
stop-watch (i.e. “1, 2, 3, 4” etc.). The players speed,
acceleration, and distance covered were recorded on the GPS
devices and subsequently analysed. Each player performed 2
efforts at each of the controlled speed run in. The players were
given sufficient recovery times between efforts (2mins).

64
Figure 4b: Controlled speed entry protocol. The full circle illustrates the starting
position with the entry speed controlled by passing the open cones at 1 s intervals.
The total distance covered was dependent upon the point of initiating the 20 m
sprint.
Start Point
Point of Acceleration
Figure 4a: Controlled speed entry set-up.

65
For trial 3, the players were asked to repeat the same
controlled speed conditions as in trial 2, but this time a 2m
deceleration zone was introduced at the end of the controlled
speed run-in. The players were again instructed to travel
through each marker cone at 1s intervals before decelerating
within the 2m zone and maximally re-accelerating on exiting the
zone. (See Figure 5a. & 5b.) The players speed, acceleration,
deceleration and distance covered were recorded on the GPS
devices and subsequently analysed. Each player performed 2
efforts at each speed zone 3-7 m.s-1. Again, the players were
given sufficient recovery times between efforts (2mins).

66
- Deceleration
Zone
Figure 5b: Controlled speed running as indicated in trial 2, with a rapid
deceleration indicated by the black dotted box and a re-acceleration indicated
from the full circle within the deceleration zone.
2m Deceleration Zone
Start Point
Figure 5a: ‘Hollow Sprint’ Test set-up.

67
3.4. GPS Variables
The data collected for analysis was; distance covered, speed at
run-in, start speed and final speed.
Peak acceleration at point of change of pace & Peak
deceleration at point of deceleration was measured by both
Doppler GPS and from the Vector of the tri-axial accelerometer
data.
3.5. Data Analysis
After testing, the raw data was downloaded from the GPS units
using the suppliers mass USB device in the charging box, to
the proprietary software (Catapult Sprint 5.1). The Raw Data
CSV. File Microsoft Excel 2010 (Microsoft, California, USA)
reports for each run were exported and the analysis of each
trace was completed within the Sprint software. Analysis of the
trace was completed by locating the static start point (0 m.s-1)
for each trace and the point at which the velocity went above
this was assumed to be the commencement of movement. For
trial 1 (static start acceleration) – peak acceleration over 0-1 m,
0-2 m, 0-5 m and 0-10 m was analysed as well as the time-

68
based range 0-0.1 s, 0-0.2 s, 0-0.5 s, 0-1.0 s, 0-1.5 s and 0-5 s.
For trial 2 (controlled speed run-in), the velocity and
acceleration at set distances was analysed, equivalent to the
marker cone intervals for 3-7 m.s-1 (i.e. at 9 m for 3 m.s-1 and at
21 m for 7 m.s-1 and measured peak acceleration and change
of pace after this point (at the points that the players were
instructed to act in the protocol). The same approach was used
for trial 3 (The hollow sprint test), taking into consideration the 2
m deceleration zone to analyse the magnitude of deceleration
and provide a subsequent point for re-acceleration.
All data is presented as mean ± standard deviation (SD) or
standard error (SE) as indicated and effect sizes are stated
where appropriate.
Statistical analyses were conducted in “SPSS Version 22.0 for
Windows (SPSS Inc, Chicago, IL, USA). One-way ANOVA and
Tukey confidence interval tests were performed and one
sample t-tests and Mann-Whitney tests were used for post hoc
analysis. Effect sizes were calculated using Cohen’s d test
[ES=(Δ mean)/pooled SD] (Cohen, 1988) and magnitude of
effect was stated using the ranges reported by Batterham and
Hopkins (2006) and Hopkins (2009).
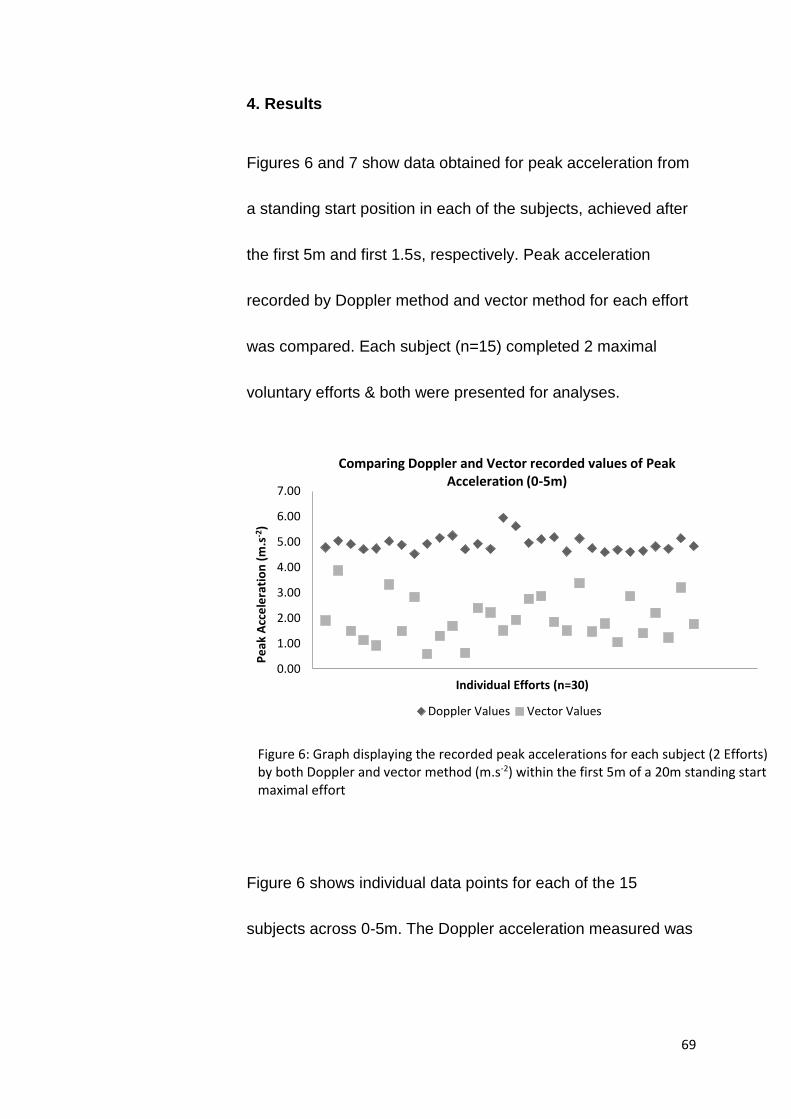
69
0.00
1.00
2.00
3.00
4.00
5.00
6.00
7.00
Pe
ak A
cce
lera
tio
n (
m.s
-2)
Individual Efforts (n=30)
Comparing Doppler and Vector recorded values of Peak Acceleration (0-5m)
Doppler Values Vector Values
4. Results
Figures 6 and 7 show data obtained for peak acceleration from
a standing start position in each of the subjects, achieved after
the first 5m and first 1.5s, respectively. Peak acceleration
recorded by Doppler method and vector method for each effort
was compared. Each subject (n=15) completed 2 maximal
voluntary efforts & both were presented for analyses.
Figure 6 shows individual data points for each of the 15
subjects across 0-5m. The Doppler acceleration measured was
Figure 6: Graph displaying the recorded peak accelerations for each subject (2 Efforts) by both Doppler and vector method (m.s-2) within the first 5m of a 20m standing start maximal effort
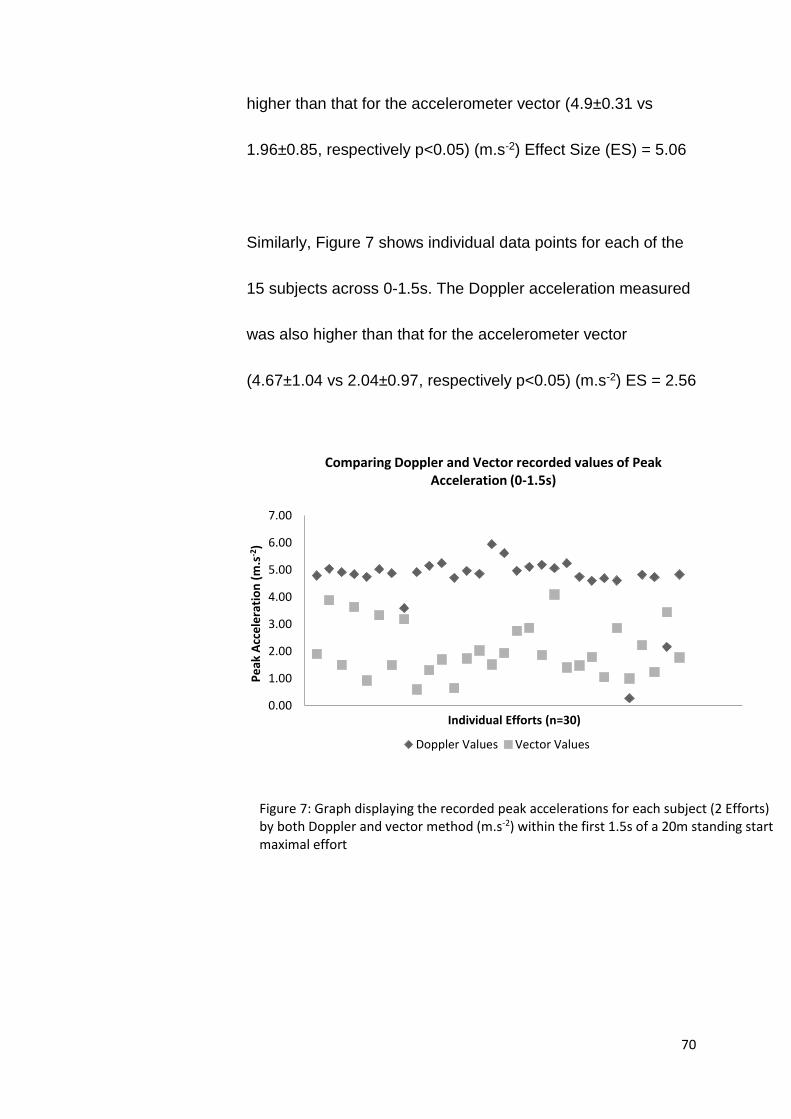
70
higher than that for the accelerometer vector (4.9±0.31 vs
1.96±0.85, respectively p<0.05) (m.s-2) Effect Size (ES) = 5.06
Similarly, Figure 7 shows individual data points for each of the
15 subjects across 0-1.5s. The Doppler acceleration measured
was also higher than that for the accelerometer vector
(4.67±1.04 vs 2.04±0.97, respectively p<0.05) (m.s-2) ES = 2.56
Figure 7: Graph displaying the recorded peak accelerations for each subject (2 Efforts) by both Doppler and vector method (m.s-2) within the first 1.5s of a 20m standing start maximal effort
0.00
1.00
2.00
3.00
4.00
5.00
6.00
7.00
Pe
ak A
cce
lera
tio
n (
m.s
-2)
Individual Efforts (n=30)
Comparing Doppler and Vector recorded values of Peak Acceleration (0-1.5s)
Doppler Values Vector Values

71
Doppler measures of acceleration were significantly higher than
the vector derived measures of acceleration with the mean
difference between Doppler and Vector recorded acceleration
data 2.97±0.86 m.s-2 for 0-5 m and 2.64±1.43 m.s-2 for 0-1.5s,
(p<0.05)
To establish the effect of the commencement running velocity
on the subsequent maximal acceleration capacity, the testing
protocol aimed to simulate a 3, 4, 5, 6 & 7m.s-1 entry before a
maximal voluntary acceleration.
The intended entry speed was not always achieved and the
true mean recorded entry speeds for both Trial 2 (Controlled
Run-In) and Trial 3 (Hollow Test) are shown in Figure 8.
0.00
1.00
2.00
3.00
4.00
5.00
6.00
7.00
8.00
9.00
10.00
3 4 5 6 7
Me
asu
red
Sp
ee
d (
m.s
-1)
Intended Speed (m.s-1)
Mean recorded Entry Speed for Controlled Run-In Test and Hollow Sprint Test
Controlled Run-In Hollow Test
Figure 8: Chart showing the intended run-in speeds (m.s-1) (x-axis) versus the actual group mean (n=15) measured run-in speeds (m.s-1) (y-axis) with standard error in both the controlled run-in test and the hollow sprint test.

72
While the intended commencement velocity for each test
protocol was 3, 4, 5, 6, & 7 m.s-1, for trial 2 (controlled run-in)
the recorded entry speeds were 4.39±0.52, 5.30±0.6,
6.26±0.31, 7.08±0.41 and 7.79±0.33 m.s-1, respectively.
Whereas the mean recorded entry velocities obtained during
the conditioning phase to trial 3 (Hollow Test) were in fact
3.69±0.24, 4.64±0.26, 5.62±0.25, 6.36±0.38 and 7.08±0.36
m.s-1, respectively.
Therefore, for trial 2 (Controlled run-in) the speed of entry was
always measured higher than that prescribed. In this case, it
was measured as 4.39±0.52 m.s-1 for a prescribed speed of 3
m.s-1, 5.30±0.6 m.s-1 for a prescribed speed of 4 m.s-1,
6.26±0.31 m.s-1 for a prescribed speed of 5 m.s-1, 7.08±0.41
m.s-1 for a prescribed speed of 6 m.s-1 and 7.79±0.33 m.s-1 for
a prescribed speed of 7 m.s-1
For trial 3 (Hollow Sprint Test) the speed of entry was also
always measured higher than that prescribed. In this case, it
was measured as 3.69±0.24 m.s-1 for a prescribed speed of 3
m.s-1, 4.64±0.26 m.s-1 for a prescribed speed of 4 m.s-1,
5.62±0.25 for a prescribed speed of 5 m.s-1, 6.36±0.38 for a
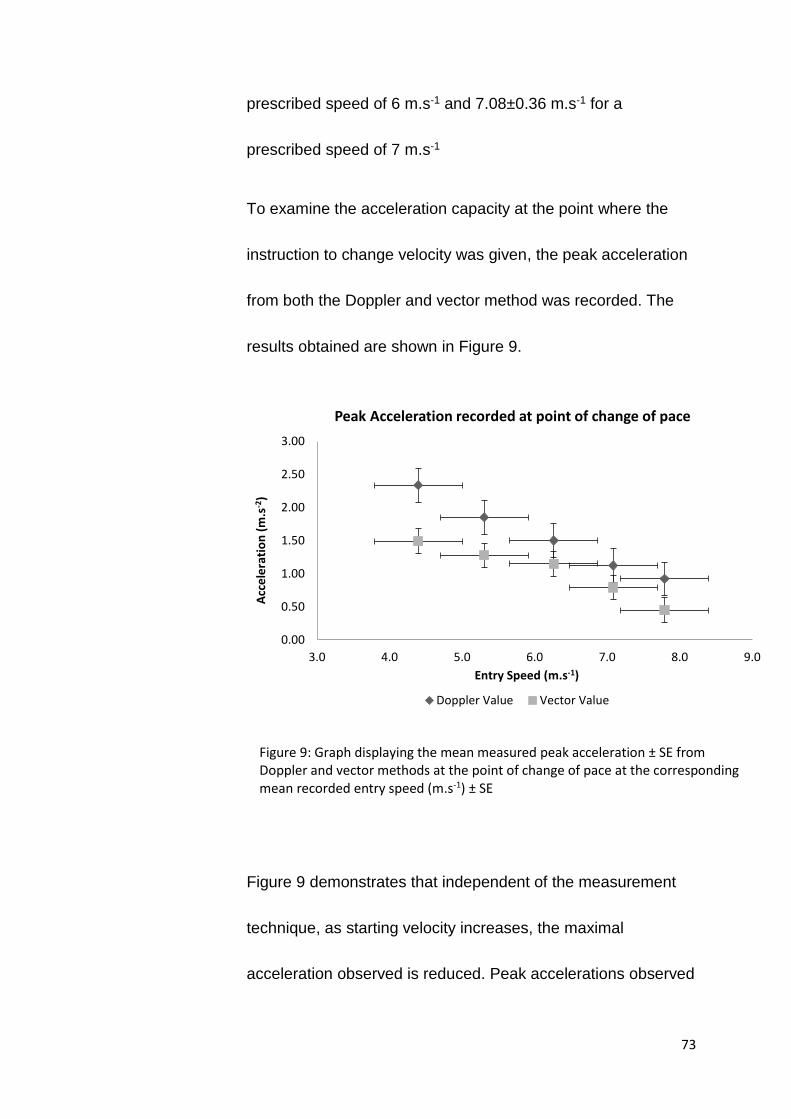
73
prescribed speed of 6 m.s-1 and 7.08±0.36 m.s-1 for a
prescribed speed of 7 m.s-1
To examine the acceleration capacity at the point where the
instruction to change velocity was given, the peak acceleration
from both the Doppler and vector method was recorded. The
results obtained are shown in Figure 9.
Figure 9 demonstrates that independent of the measurement
technique, as starting velocity increases, the maximal
acceleration observed is reduced. Peak accelerations observed
0.00
0.50
1.00
1.50
2.00
2.50
3.00
3.0 4.0 5.0 6.0 7.0 8.0 9.0
Acc
ele
rati
on
(m
.s-2
)
Entry Speed (m.s-1)
Peak Acceleration recorded at point of change of pace
Doppler Value Vector Value
Figure 9: Graph displaying the mean measured peak acceleration ± SE from Doppler and vector methods at the point of change of pace at the corresponding mean recorded entry speed (m.s-1) ± SE

74
from the presented starting velocities were 2.34±0.35 m.s-2 at
4.39 m.s-1, 1.85±0.31 m.s-2 at 5.30 m.s-1, 1.5±0.26 m.s-2 at 6.26
m.s-1, 1.12±0.18 m.s-2 at 7.08 m.s-1 and 0.92±0.21 m.s-2 at 7.79
m.s-1 measured by Doppler and 1.49±0.24 m.s-2 at 4.39 m.s-1,
1.28±0.27 m.s-2 at 5.30 m.s-1, 1.15±0.16 m.s-2 at 6.26 m.s-1,
0.79±0.65 m.s-2 at 7.08 m.s-1 and 0.45±0.32 m.s-2 at 7.79 m.s-1
measured by vector method.
The vector of acceleration was significantly lower than Doppler
measurement at all prescribed velocities (2.34±0.35 vs
1.49±0.24 at 4.39 m.s-1 p<0.05, 1.85±0.31 vs 1.28±0.27 at 5.30
m.s-1 p<0.05, 1.5±0.26 vs 1.15±0.16 at 6.26 m.s-1 p<0.05,
1.12±0.18 vs 0.79±0.65 at 7.08 m.s-1 and 0.92±0.21 vs
0.45±0.32 at 7.79 m.s-1 p<0.05). (T-Test)
As observed in a static start, the vector values appear to be
lower than the recorded Doppler based values. The observed
differences between methods in measured acceleration
(Doppler – vector) were 0.85±0.45, 0.57±0.45, 0.35±0.27,
0.33±0.22 and 0.47±0.26 m.s-2, respectively.

75
To assess whether the capacity to maximally accelerate was
influenced by a prior sudden deceleration, it is important to
establish what effect the entry speed had on the magnitude of
deceleration.
Figure 10 demonstrates that as the entry speed increases, the
magnitude of deceleration also increases. The mean Doppler
based deceleration values achieved were 0.29±0.35,
0.53±0.34, 0.84±0.37, 1.15±0.49 and 1.52±0.49 m.s-2 for
corresponding run-in speeds of 3.69±0.24, 4.64±0.26,
5.62±0.2, 6.36±0.38 and 7.08±0.36 m.s-1, respectively.
The vector derived deceleration values were 0.1±0.08,
0.21±0.14, 0.48±0.19, 0.69±0.24 and 1.11±0.27 m.s-2 for the
corresponding run-in speeds of 3.69±0.24, 4.64±0.26,
5.62±0.2, 6.36±0.38 and 7.08±0.36 m.s-1, respectively.
As before, the vector of acceleration (deceleration in this case)
was significantly lower than Doppler measurement at all
prescribed velocities (0.29±0.35 vs 0.1±0.08 p<0.05, 0.53±0.34
vs 0.21±0.14 p<0.05, 0.84±0.37 vs 0.48±0.19 p<0.05,
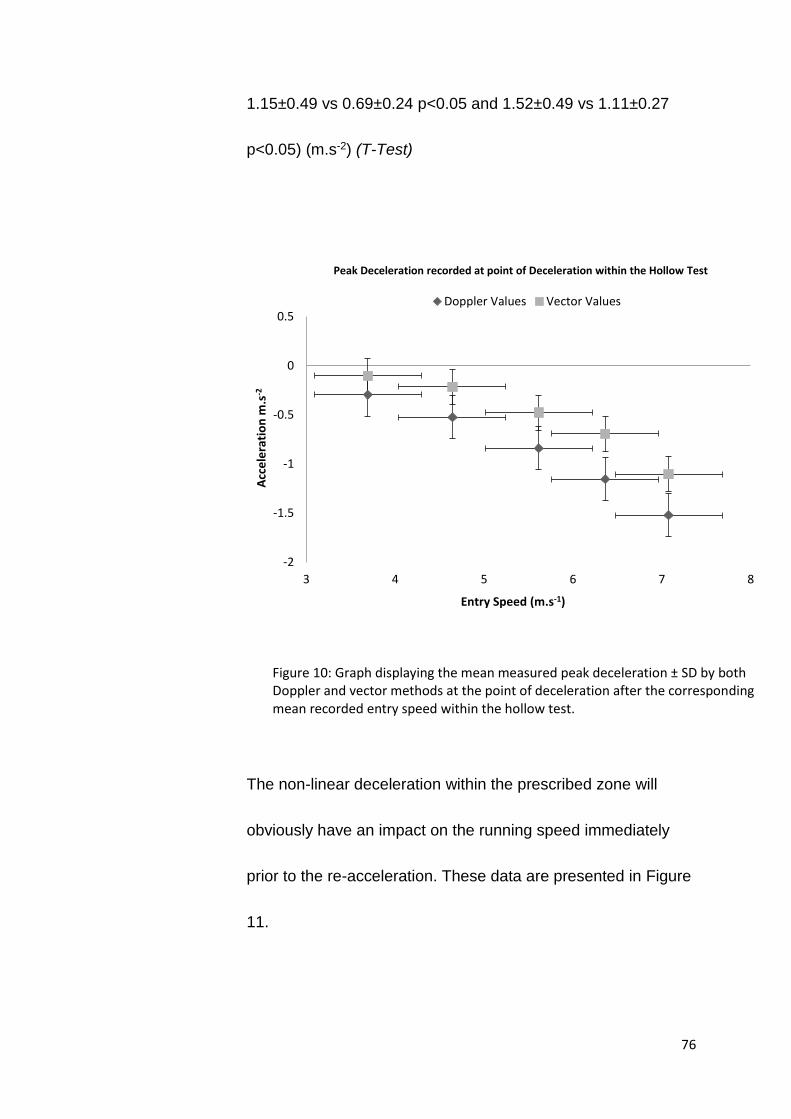
76
1.15±0.49 vs 0.69±0.24 p<0.05 and 1.52±0.49 vs 1.11±0.27
p<0.05) (m.s-2) (T-Test)
The non-linear deceleration within the prescribed zone will
obviously have an impact on the running speed immediately
prior to the re-acceleration. These data are presented in Figure
11.
-2
-1.5
-1
-0.5
0
0.5
3 4 5 6 7 8
Acc
ele
rati
on
m.s
-2
Entry Speed (m.s-1)
Peak Deceleration recorded at point of Deceleration within the Hollow Test
Doppler Values Vector Values
Figure 10: Graph displaying the mean measured peak deceleration ± SD by both Doppler and vector methods at the point of deceleration after the corresponding mean recorded entry speed within the hollow test.

77
Figure 11 shows that as the speed of entry increased across
trials 1-5 in line with the 3, 4, 5, 6, & 7 m.s-1 entry speed target,
the magnitude of the resultant deceleration increases. The
speed at the point of re-acceleration therefore increases. The
final speed being reduced by 0.74 m.s-1 in trial 1 and increasing
to a 2.6 m.s-1 reduction in trial 5.
0
1
2
3
4
5
6
7
8
1 2 3 4 5
Spe
ed
(m
.s-1
)
Trial
Change of Speed after deceleration within the Hollow Sprint Test
Entry Speed (m/s) Speed after Deceleration (m/s)
Figure 11: Chart showing the entry speed and speed after the deceleration phase of the hollow sprint test (±SE).
Entry Speed (m.s-1) Speed after Deceleration (m.s-1)

78
0
0.5
1
1.5
2
2.5
3
3 4 5 6 7 8
Acc
ele
rati
on
m.s
-2
Entry Speed (m.s-1)
Peak Acceleration recorded at point of re-acceleration within the Hollow Test
Doppler Value Vector Value
To examine the influence of these revised starting velocities
and the effect of the deceleration on the capacity to re-
accelerate; we again examined the peak acceleration at the
point of re-acceleration, in line with the test protocol. These
data are shown in in Figure 12.
Figure 12: Graph displaying the mean measured peak acceleration ± SD by both Doppler and vector methods at the point of re-acceleration after the corresponding mean recorded entry speed within the hollow test.
79
As with the controlled speed test, this data shows that as speed
of entry increases, maximal acceleration capacity is reduced.
The peak accelerations achieved as entry speed increased
were 1.42±0.57, 0.83±0.51, 0.61±0.26, 0.47±0.37 and
0.33±0.32 m.s-2 for Doppler and 0.88±0.28, 0.6±0.4, 0.4±0.17,
0.16±0.07 and 0.16±0.06 for the vector derived data
respectively.
To illustrate the relationship between the speed of entry,
magnitude of deceleration and their effect on the capacity to re-
accelerate, mean values are plotted for these variable in Figure
13 and Figure 14.

80
2
3
4
5
6
7
8
0
0.2
0.4
0.6
0.8
1
1.2
1.4
1.6
2 3 4 5 6 7 8
Spe
ed
(m
.s-1
)
Acc
ele
rati
on
(m
.s-2
)
Entry Speed (m.s-1)
Relationship between the speed after deceleration and the peak acceleration achieved at re-acceleration
phase
Max Acc dpr Max acc vectr Exit Speed
Figure 13: Graph showing the mean recorded entry speed and the speed recorded after deceleration within the hollow test. It also shows the peak acceleration recorded by both Doppler and vector methods that was achieved at the point of re-acceleration.
Figure 14: Graph displaying the relationship between the mean recorded entry speed and the corresponding Doppler and vector peak decelerations at the point of deceleration and the subsequent mean peak acceleration at the point of re-acceleration within the hollow test.
-1.6
-1.4
-1.2
-1
-0.8
-0.6
-0.4
-0.2
00
0.2
0.4
0.6
0.8
1
1.2
1.4
1.6
2 3 4 5 6 7 8
De
cele
rati
on
(m
.s-2
)
Acc
ele
rati
on
(m
.s-2
)
Entry Speed (m.s-1)
Relationship between the magnitude of Deceleration and the subsequent peak re-acceleration
acc dpr acc vctr dec dpr dec vctr
81
Finally, to compare the results from the controlled running
speed data and data obtained after a sudden deceleration we
can examine how each component impacts the capacity to
produce maximal accelerations.
Figure 15 demonstrates that as the starting velocity increases,
the capacity to change pace maximally both at constant speed
and after a sudden deceleration is reduced. The graph
suggests that the capacity to produce maximal accelerations is
greater compromised after a rapid deceleration.
The maximal acceleration achieved from the deceleration
‘Hollow’ test was 1.42±0.57 m.s-2 recorded by Doppler and
0.88±0.28 m.s-2 recorded by vector analysis compared to
2.34±0.35 m.s-2 by Doppler and 1.49±0.24 by vector analysis
from the controlled speed test.
By examining the peak accelerations achieved at similar run-in
speeds – those within the red box zone marked– it is apparent
that peak accelerations achieved from a controlled speed are
greater than those from a similar speed after a rapid
deceleration.
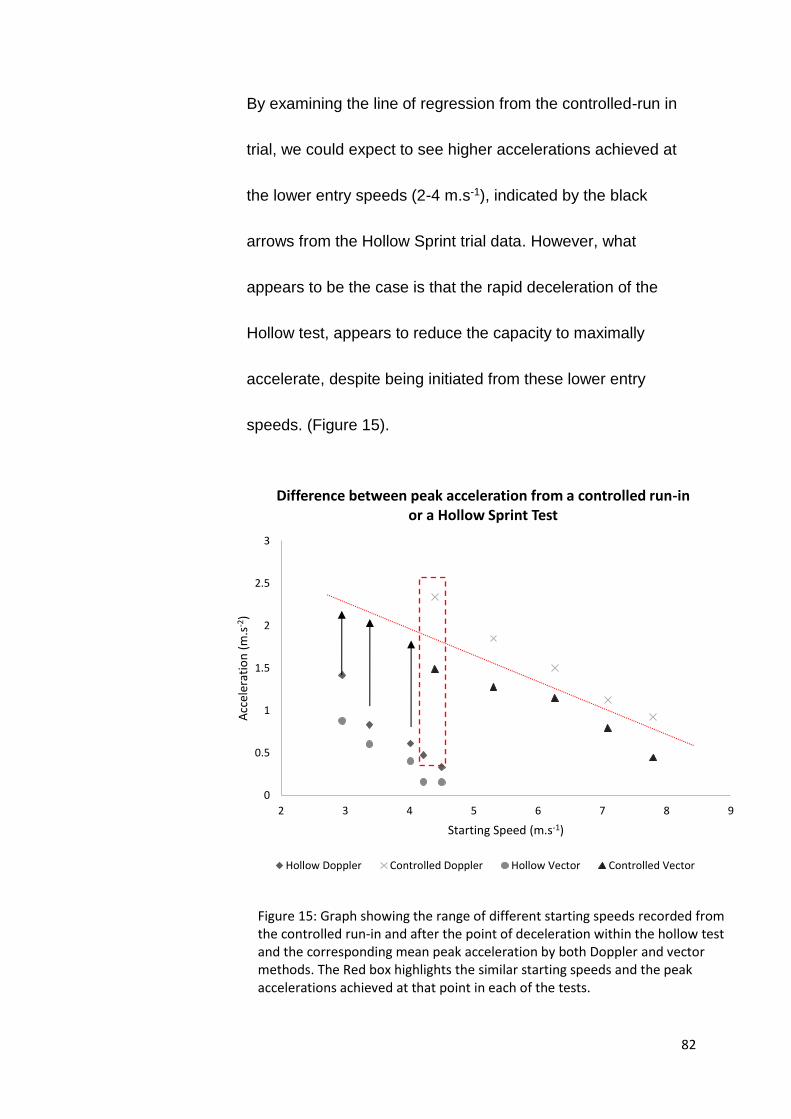
82
By examining the line of regression from the controlled-run in
trial, we could expect to see higher accelerations achieved at
the lower entry speeds (2-4 m.s-1), indicated by the black
arrows from the Hollow Sprint trial data. However, what
appears to be the case is that the rapid deceleration of the
Hollow test, appears to reduce the capacity to maximally
accelerate, despite being initiated from these lower entry
speeds. (Figure 15).
Figure 15: Graph showing the range of different starting speeds recorded from the controlled run-in and after the point of deceleration within the hollow test and the corresponding mean peak acceleration by both Doppler and vector methods. The Red box highlights the similar starting speeds and the peak accelerations achieved at that point in each of the tests.
0
0.5
1
1.5
2
2.5
3
2 3 4 5 6 7 8 9
Acc
eler
atio
n (
m.s
-2)
Starting Speed (m.s-1)
Difference between peak acceleration from a controlled run-in or a Hollow Sprint Test
Hollow Doppler Controlled Doppler Hollow Vector Controlled Vector
83
5. Discussion
5.1 Summary of Findings
The main findings from this study are that maximal acceleration
capacity is reduced when the speed at which the acceleration
is initiated increases.
In agreement with Sonderegger et. al (2016), our results show
a linear decrease in the acceleration capacity when maximum
voluntary efforts are initiated from increasing initial running
speed. This further highlights the importance of considering the
running entry speed prior to acceleration when acceleration
measurements are used to evaluate the intensity and load of
training stimulus.
By using absolute values, an acceleration of >2.78 m.s-2 is
often classified as a high acceleration (Varley and Aughey,
2013; Akenhead et al 2013; Akenhead et al 2014).
However, our results show that an acceleration of >2.78 m.s-2
would only represent up to 60% of the maximal voluntary
acceleration capacity from a standing start position that we
observed. In contrast, however, from an entry speed of 4.39

84
m.s-1, very few of our subjects could reach an acceleration of
2.78 m.s-2 & this number decreased as the entry speed got
quicker. Therefore, accelerations initiated from standing or low-
speed running would be overestimated and accelerations from
high-speed running underestimated, by using the current
absolute acceleration thresholds.
Similar to our findings, Sonderegger et. al (2016) also notes
that although the results reported by Varley and Aughey (2013)
indicated the issue of having absolute acceleration thresholds,
the authors did not explicitly address this problem. They
showed that nearly half of all actions with maximal
accelerations > 2.78 m.s-2 were initiated from speeds of < 3.6
km.h-1 and only 8% of these maximal accelerations were then
reported when the initial running speed was over 10.8 km.h-1
(3m.s-1). The authors interpreted this finding by concluding that
actions with maximal acceleration very rarely occur with initial
running speeds exceeding 10.8 km.h-1, rather than suggesting
that the initial running speed may have been the limiting factor
in the consequent acceleration effort.

85
However, based on our results, which illustrate a significant
decrease in the acceleration capacity with increasing initial
entry speed, it seems more likely that even if the players did
produce a maximum voluntary acceleration effort, they would
not be able to exceed the threshold value of >2.78 m.s-2 if the
initial running speed was over 10.8 km.h-1 (or 3 m.s-1 in the
case of our study.)
The data also shows that the data generated by Doppler and
accelerometer vector outputs can be influenced by the nature
of the movements being analysed (i.e a sudden deceleration or
change in pace). It appears that Doppler analysis provides a
more consistent reflection of acceleration capacity when
compared with the time motion analysis observed using
traditional timing gates. Furthermore, the ability to harness the
elastic contribution to force output (and thereby acceleration) is
compromised at higher running speeds where the higher
deceleration (and eccentric load) does not result in a higher re-
acceleration.

86
5.2 Maximal Acceleration from a Standing Start
The participants in the present study were young football
players at the start of their professional careers. They were all
training full-time and at the time of the study had been in full-
time training for over 2 years (including time in the performance
school partnership programme). As a consequence, their
performance in the standardised sprint and jump tests was on a
par with senior players within the first team squads (around 1s
for 5 m sprint performance and 21.5 inches, or 55 cm, for a
counter movement jump). These data are also consistent with
performances reported in the literature for professional football
players and provide confidence that the results obtained are
relevant to monitoring performance within professional sport.
A comparison of these players’ capacity to accelerate from a
static start allows validation of the current data with that already
available in the literature (validating the measurements
obtained under the different experimental interventions
applied).

87
When analysing peak acceleration from a static start, the 0-5m
distance and 0-1.5s time frame was chosen because they are
consistent with the testing protocols applied using traditional
light gate technology.
Given a mean sprint effort duration of 1.03 s over (0-5m), the
mean acceleration during this phase equates to 4.71 m.s-2.
Using the standard equation to calculate acceleration A = v-u/t;
where u = 0 m.s-1, t=1.03 s and v = the average speed covered
in 0-5m:
v=d/t = 5/1.03 = 4.85 m.s-1.
and therefore, a = 4.85/1.03 = 4.71 m.s-2.
This mean “maximal” acceleration observed is consistent with
the data described previously in the literature review and
supports the notion that accelerations measured in excess of
2.78 m.s-2 are a significant effort (Varley and Aughey, 2013;
Akenhead et al 2013, Akenhead et al 2014). The data
presented here also highlights the difference between using
Doppler derived acceleration values and accelerometer derived
vectors. The data presented within our findings demonstrates

88
that the vector of the tri-axial accelerometers can under
represent the magnitude of the acceleration observed in linear
running.
In an aim to establish a true maximal acceleration value from a
standing start, the good relationship between the Doppler
derived indices and the light gate data previous is logical given
that they are both measuring distance and time. However, the
tri-axial accelerometers are measuring displacement
(accounting for direction and magnitude of the GPS unit’s
movement) whereas the GPS coordinate and light gates are
scalar (measuring distance in relation to time). Therefore, it is
important to highlight that the position of the GPS unit could
have a big impact on the measured acceleration.
Due to the nature of the experimental protocol for the first trial
(the static start), the athletes naturally position themselves into
a forward lean position when accelerating from a standing start
(and as observed, will still be leaning forward over the short
distances we measured). While these data might suggest that
the Doppler derived measurements are therefore more valid, it

89
was important to continue analysing both options to determine
if there is any need to collect the accelerometer data.
This is important, because during the third trial (the ‘hollow
test’), it was observed that a number of the subjects would
position their body more upright during the deceleration phase,
lifting their trunk and extending their back, becoming more
upright as they decelerated and this may be an opportunity to
observe how body displacement may affect the measured
acceleration by simple Doppler-based analysis.
5.3 Maximal Acceleration from a Moving Start
The data presented here demonstrated the difficulty in
accurately controlling the prescribed running speeds during
experimental studies, however, in the experimental design
these data provide information on a continuum across the usual
running speeds (<14 km.hr-1 to >24 km.hr-1) observed in
training and competition in professional football (Bradley et al.
2010).
The results demonstrate clearly that as the velocity at which the
athlete runs increases, their capacity to accelerate is reduced.

90
However, this is perhaps not what we should expect in terms of
Newtonian Mechanics where applying a force to an object
should result in the same acceleration independent of the
speed it is travelling at. On the other hand, in biological
systems the capacity to generate force will be influenced by the
speed at which the muscle is contracting. Classic physiology
textbooks describe the force-velocity relationship where the
ability to generate force is inversely related to the velocity of
contraction (Vander, Sherman and Lucianno (1994).
Therefore, as running speed increases the muscle is
shortening progressively quicker to reduce ground contact time
(as cadence also increases) and increased angular velocity (as
the stride length increases). Thus, as the speed at which the
player is travelling increases, the capacity for the muscle to
generate force as a result of muscle activation is reduced and
the resultant acceleration is compromised. Importantly,
however, the metabolic cost of this reduced force output will not
change and will therefore still have consequences for the
training load concept. Moreover, this ability to change pace
during running is an important aspect of team sports and has

91
merit to be monitored individually in providing a sport specific
training impulse. Should we therefore consider training change
of pace as an independent physical characteristic?
The comparison of Doppler and accelerometer derived
acceleration data across the different running velocities
presented within the results are of particular interest. The
mean Doppler acceleration is consistently higher than the
vector of tri-axial accelerations across all of the running speeds
measured. However, the magnitude of the difference is much
reduced from a standing start and is further reduced at each
increase in prescribed running speed. This observation may be
important to explain the measurement differences observed.
The forward lean position of the subject that is adopted from a
standing start may produce an error in the vector of the
accelerometer (where the x, y and z planes are disorientated).
This error is reduced as the initial running speed increases
(and the change in forward lean from running and subsequent
acceleration is reduced).
These data may suggest that the positioning of the GPS unit
between the scapulae makes a significant contribution to the

92
measurement error observed. The Doppler data is measuring
the distance covered by the centre of mass during movement,
but the accelerometers are measuring movement in the trunk
(during hip flexion and extension) in addition to movements of
our centre of mass. The obvious experiment would be to place
the unit closer to the centre of mass and compare the resultant
outputs (however, in team sports the position between the
scapulae is preferred for minimising injury risk from impacts
with the GPS units). This could perhaps be scope for further
research.
5.4 The Influence of the Stretch Shortening Cycle on Maximal
Acceleration
The data observed during the third trial in this study (Hollow
Sprint Test) demonstrated that the magnitude of the observed
deceleration increased in direct proportion to the running
velocity prescribed for (or observed in) the players. This
deceleration is often accepted in the literature to provide an
eccentric load to the lower limbs. This ground contact and

93
eccentric load should provide a stretch-shortening cycle that
may be thought to improve subsequent re-acceleration.
However, as the speed of running into the deceleration zone
(and the resultant deceleration) increased, there was actually
an observed decrease in the resultant re-acceleration. Despite
being of initial surprise, this observation could be explained and
is consistent with the response in rebound jump height
observed with progressive increases in box drop heights for
plyometric training (De Villarreal, Kellis, Izquierdo 2009). The
increased height of drop leads to an increased ground reaction
force but also with increased ground contact time (so that rate
of force development and power are compromised) (Makaruk
and Sacewicz, 2011). The mechanisms responsible for this
observed reduction in performance have been related to the
increased requirement for the muscle and connective tissue to
absorb energy during the landing.
The data observed in the third trial (Hollow Sprint Test)
conducted here is consistent with these observations and adds
to the previous observation from trial two (controlled-speed
entry) that the acceleration observed may not necessarily

94
reflect the true metabolic or biomechanical load associated with
complex movements. During the rapid deceleration, the
muscle and connective tissue have an increased requirement
to absorb the energy from reduced forward motion (as opposed
to landing as described above) and this compromises the ability
to recruit the expected stretch-shortening cycle.
5.5 Review of Methods
In previous studies that aimed to control running speed, audio
cues and handheld devices have been used to signal when the
correct speed was achieved (Akenhead et al 2013) (Varley and
Aughey, 2013) (Sonderegger et. al, 2016).
Using such apparatus would certainly improve the ability to
control speed more accurately. However, since the speed at
the initiation of acceleration and the resultant acceleration were
measured simultaneously within our study, the need for precise
speed control was less relevant than in other studies.
Therefore, the important observation was that the speed of
entry was increasing, which then impacted on the following

95
acceleration or deceleration. The entry speeds observed were
still consistent with those reported in the literature to be
common speeds within soccer training and match play (Bradley
et al, 2010).
This is an important point to note for practitioners. The nature
of the ‘Hollow Sprint’ better reflects the movement demands
observed within soccer practice, particularly in SSGs with
regards to the amount of accelerations. Therefore, rather than
being a limitation of our study solely focusing on set, controlled
running speeds, our study has in-turn provided a wider range of
velocities and situations from which accelerations commenced
from. Therefore, the effect size of these results is more relevant
to the limitations on using these metrics for monitoring
purposes and provides useful information for other
practitioners.

96
5.6 Limitations
While the value of this study is in gaining a better
understanding of the monitoring of training and competition
load during football, the study protocols restricted the players to
running in a linear fashion. This approach does not directly
represent the free-movement patterns that need to be observed
in soccer training and match play and future studies should
focus on the capacity to change speed and direction and to aim
to accurately quantify player movement across all directions.

97
6. Conclusion and Potential Applications
Quantifying training load remains an important consideration for
football coaches and sports scientists, but finding the most
accurate measure of quantifying training load remains elusive.
The current approaches are developments on monitoring only
internal load and with advancements in technology we are able
to use GPS to perform time motion analysis in training and
game play. Although an improvement, this approach is still
flawed and its limitations need to be acknowledged and the
technology developed.
It is apparent that accelerations make a significant contribution
to the overall load experienced by the athlete during sport
specific activity (and quantifying load accurately has been a
research focus over the past few years). However, it is
important to understand that applying technology requires
consideration to make sure that what we report reflects the true
situation. Firstly, we must understand the different physical
demands that occur due to small technical changes made in
the training and match environments e.g. pitch size, player
numbers and tactics around the use of goalkeepers or

98
possession games will require crucially different physical
demands.
This study looked at controlled activity in running drills to set a
basis for understanding more complex situations within training
and match play. The results from this study suggest that
thresholds at which we measure acceleration, speed or
distance travelled must be relevant to the conditions of the
activity (i.e. they must be context specific and cannot be set as
unconditional end points).
The reduction in observed maximum voluntary acceleration
with increased running speed will be important in situations
where the context changes player behaviour. For example,
increasing the relative playing area during a training game will
increase the average speed during the period of play (and this
would lead to a reduced number of high level accelerations if
the threshold is set to an absolute value). The consequences
of this misinformation may be that players initiate an
acceleration effort and pay metabolic cost but get further load
applied because that effort was not recorded. This could result
in potential training overload.
99
It would seem appropriate that different training prescription
has specific speed, distance and acceleration thresholds
applied to give appropriate contextual understanding of the
measurements being made. Furthermore, in order to interpret
data from Accelerometry, we must consider the position of the
GPS unit worn and the movements made by the players as
these have been shown to impact the final measure of
acceleration presented.
This study provides useful information as a practitioner within
soccer with regards to monitoring accelerations and
understanding better the context of each situation that we are
aiming to monitor. Lastly, future study should aim to quantify
accelerations within a football specific context with regards to
player movements with an aim to analyse these in an
individualised approach to each player. This should provide
value in adding to the concept of assessing the Training Load.

100
References
Akenhead, R., French, D., Thompson, K.G. and Hayes, P.R.,
2014. The acceleration dependent validity and reliability of
10Hz GPS. Journal of Science and Medicine in Sport, 17(5),
pp.562-566.
Akenhead, R., Hayes, P.R., Thompson, K.G. and French, D.,
2013. Diminutions of acceleration and deceleration output
during professional football match play. Journal of Science and
Medicine in Sport, 16(6), pp.556-561.
Arsac, L.M. and Locatelli, E., 2002. Modeling the energetics of
100-m running by using speed curves of world
champions. Journal of Applied Physiology, 92(5), pp.1781-
1788.
Aughey, R.J. and Falloon, C., 2008. Description of
accelerations in Australian rules football: a new insight into high
intensity activity. International Journal of Sports Science &
Coaching, 3, p.16.
Aughey, R.J., 2011. Applications of GPS technologies to field
sports. International Journal of Sports Physiology and
Performance, 6(3), pp.295-310.
Bangsbo, J., 1994. Physiological demands. In Handbook of
Sports Medicine and Science Football (soccer) (pp. 43-58).
Blackwell Publishing Ltd.

101
Bangsbo, J., Mohr, M. and Krustrup, P., 2006. Physical and
metabolic demands of training and match-play in the elite
football player. Journal of Sports Sciences, 24(07), pp.665-674.
Barrett, S., Midgley, A. and Lovell, R., 2014. PlayerLoad™:
reliability, convergent validity, and influence of unit position
during treadmill running. International Journal of Sports
Physiology and Performance, 9(6), pp.945-952.
Barron, D.J., Atkins, S., Edmundson, C. and Fewtrell, D., 2014.
Accelerometer derived load according to playing position in
competitive youth soccer. International Journal of Performance
Analysis in Sport, 14(3), pp.734-743.
Batterham, A.M. and Hopkins, W.G., 2006. Making meaningful
inferences about magnitudes. International Journal of Sports
Physiology and Performance, 1(1), pp.50-57.
Bot, S.D.M. and Hollander, A.P., 2000. The relationship
between heart rate and oxygen uptake during non-steady state
exercise. Ergonomics, 43(10), pp.1578-1592.
Boyd, L.J., Ball, K. and Aughey, R.J., 2011. The reliability of
MinimaxX accelerometers for measuring physical activity in
Australian football. International Journal of Sports Physiology
and Performance, 6(3), pp.311-321.

102
Bradley, P.S., Carling, C., Archer, D., Roberts, J., Dodds, A., Di
Mascio, M., Paul, D., Gomez Diaz, A., Peart, D. and Krustrup,
P., 2011. The effect of playing formation on high-intensity
running and technical profiles in English FA Premier League
soccer matches. Journal of Sports Sciences, 29(8), pp.821-
830.
Bradley, P.S., Di Mascio, M., Peart, D., Olsen, P. and Sheldon,
B., 2010. High-intensity activity profiles of elite soccer players
at different performance levels. The Journal of Strength &
Conditioning Research, 24(9), pp.2343-2351.
Bradley, P.S., Sheldon, W., Wooster, B., Olsen, P., Boanas, P.
and Krustrup, P., 2009. High-intensity running in English FA
Premier League soccer matches. Journal of Sports
Sciences, 27(2), pp.159-168.
Brewer, C., Dawson, B., Heasman, J., Stewart, G. and
Cormack, S., 2010. Movement pattern comparisons in elite
(AFL) and sub-elite (WAFL) Australian football games using
GPS. Journal of Science and Medicine in Sport, 13(6), pp.618-
623.
Buchheit, M., Samozino, P., Glynn, J.A., Michael, B.S., Al
Haddad, H., Mendez-Villanueva, A. and Morin, J.B., 2014.
Mechanical determinants of acceleration and maximal sprinting
speed in highly trained young soccer players. Journal of Sports
Sciences, 32(20), pp.1906-1913.

103
Buchheit, M., Simpson, B.M., Peltola, E. and Mendez-
Villanueva, A., 2012. Assessing maximal sprinting speed in
highly trained young soccer players. International Journal of
Sports Physiology and Performance, 7(1), pp.76-78.
Carling, C., Bloomfield, J., Nelsen, L. and Reilly, T., 2008. The
role of motion analysis in elite soccer. Sports Medicine, 38(10),
pp.839-862.
Castellano, J. and Casamichana, D., 2013. Differences in the
number of accelerations between small-sided games and
friendly matches in soccer. Journal of Sports Science &
Medicine, 12(1), p.209.
Chu, D.A., 1998. Jumping into plyometrics. Human Kinetics,
Chapter 1, pp 1-3.
Coutts, A.J. and Duffield, R., 2010. Validity and reliability of
GPS devices for measuring movement demands of team
sports. Journal of Science and Medicine in Sport, 13(1),
pp.133-135.
De Villarreal, E.S.S., Kellis, E., Kraemer, W.J. and Izquierdo,
M., 2009. Determining variables of plyometric training for
improving vertical jump height performance: a meta-
analysis. The Journal of Strength & Conditioning
Research, 23(2), pp.495-506.

104
Di Salvo, V., Baron, R., Tschan, H., Montero, F.C., Bachl, N.
and Pigozzi, F., 2007. Performance characteristics according to
playing position in elite soccer. International Journal of Sports
Medicine, 28(03), pp.222-227.
Duffield, R., Coutts, A.J. and Quinn, J., 2009. Core temperature
responses and match running performance during intermittent-
sprint exercise competition in warm conditions. The Journal of
Strength & Conditioning Research, 23(4), pp.1238-1244.
Dwyer, D.B. and Gabbett, T.J., 2012. Global positioning system
data analysis: velocity ranges and a new definition of sprinting
for field sport athletes. The Journal of Strength & Conditioning
Research, 26(3), pp.818-824.
Farrow, D., Pyne, D. and Gabbett, T., 2008. Skill and
physiological demands of open and closed training drills in
Australian football. International Journal of Sports Science &
Coaching, 3(4), pp.489-499.
FIFA. (2015/16). Laws of the Game 2015/2016 (PDF). [online]
Available at:
https://www.fifa.com/mm/Document/FootballDevelopment/Refe
reeing/02/36/01/11/LawsofthegamewebEN_Neutral.pdf
[Accessed 17 May. 2015].

105
Gaudino, P., Iaia, F.M., Alberti, G., Strudwick, A.J., Atkinson,
G. and Gregson, W., 2013. Monitoring training in elite soccer
players: systematic bias between running speed and metabolic
power data. International Journal of Sports Medicine, 34(11),
pp.963-968.
Góralczyk, R., Mikolajec, K., Poprzecki, S., Zajac, A.,
Szyngiera, W. and Waskiewicz, Z., 2003. Kinematic analysis of
intermittent sprints of elite soccer players. Journal of Human
Kinetics, 10, pp.107-120.
Gregson, W., Drust, B., Atkinson, G. and Salvo, V.D., 2010.
Match-to-match variability of high-speed activities in premier
league soccer. International Journal of Sports Medicine, 31(04),
pp.237-242.
Haugen, T.A., Tønnessen, E., Hisdal, J. and Seiler, S., 2014.
The role and development of sprinting speed in
soccer. International Journal of Sports Physiology and
Performance, 9(3), pp.432-441.
Hodgson, C., Akenhead, R. and Thomas, K., 2014. Time-
motion analysis of acceleration demands of 4v4 small-sided
soccer games played on different pitch sizes. Human
Movement Science, 33, pp.25-32.

106
Hopkins, W., Marshall, S., Batterham, A. and Hanin, J., 2009.
Progressive statistics for studies in sports medicine and
exercise science. Medicine & Science in Sports & Exercise,
41(1), p.3.
Impellizzeri, F.M., Rampinini, E. and Marcora, S.M., 2005.
Physiological assessment of aerobic training in soccer. Journal
of Sports Sciences, 23(6), pp.583-592.
Jennings, D., Cormack, S., Coutts, A.J., Boyd, L. and Aughey,
R.J., 2010. The validity and reliability of GPS units for
measuring distance in team sport specific running
patterns. International Journal of Sports Physiology and
Performance, 5(3), pp.328-341.
Komi, P.V., 2008. Stretch-shortening cycle. Strength and power
in sport, p.184.
Larsson, P., 2003. Global positioning system and sport-specific
testing. Sports Medicine, 33(15), pp.1093-1101.
Little, T. and Williams, A.G., 2005. Specificity of acceleration,
maximum speed, and agility in professional soccer players. The
Journal of Strength & Conditioning Research, 19(1), pp.76-78.
Lovell, R. and Abt, G., 2013. Individualization of time–motion
analysis: a case-cohort example. International Journal of
Sports Physiology and Performance, 8(4), pp.456-458.

107
Luhtanen, P., 1994. Biomechanical aspects. Football (soccer),
pp.59-77.
MacLeod, H., Morris, J., Nevill, A. and Sunderland, C., 2009.
The validity of a non-differential global positioning system for
assessing player movement patterns in field hockey. Journal of
Sports Sciences, 27(2), pp.121-128.
Makaruk, H. and Sacewicz, T., 2011. The effect of drop height
and body mass on drop jump intensity. Biology of Sport, 28(1).
Mohr, M., Krustrup, P. and Bangsbo, J., 2003. Match
performance of high-standard soccer players with special
reference to development of fatigue. Journal of Sports
Sciences, 21(7), pp.519-528.
Osgnach, C., Poser, S., Bernardini, R., Rinaldo, R. and Di
Prampero, P.E., 2010. Energy cost and metabolic power in elite
soccer: a new match analysis approach. Medicine & Science in
Sports & Exercise, 42(1), pp.170-178.
Reilly, T., 2003. Science and soccer. Routledge.
Reilly, T., Williams, A.M., Nevill, A. and Franks, A., 2000. A
multidisciplinary approach to talent identification in
soccer. Journal of Sports Sciences, 18(9), pp.695-702.
108
Sonderegger, K., Tschopp, M. and Taube, W., 2016. The
challenge of evaluating the intensity of short actions in soccer:
A new methodological approach using percentage
acceleration. PloS one, 11(11), p.e0166534.
Townshend, A.D., Worringham, C.J. and Stewart, I.B., 2008.
Assessment of speed and position during human locomotion
using nondifferential GPS. Medicine & Science in Sports &
Exercise, 40(1), pp.124-132.
Vander, A.J., Sherman, J.H. and Luciano, D.S., Human
physiology, the mechanism of body function. 1994.
Varley, M.C. and Aughey, R.J., 2013. Acceleration profiles in
elite Australian soccer. International Journal of Sports
Medicine, 34(01), pp.34-39.
Varley, M.C., Fairweather, I.H. and Aughey, R.J., 2012. Validity
and reliability of GPS for measuring instantaneous velocity
during acceleration, deceleration, and constant motion. Journal
of Sports Sciences, 30(2), pp.121-127.
Wehbe, G.M., Hartwig, T.B. and Duncan, C.S., 2014.
Movement analysis of Australian national league soccer
players using global positioning system technology. The
Journal of Strength & Conditioning Research, 28(3), pp.834-
842.

109
Wilson, G.J., Newton, R.U., Murphy, A.J. and Humphries, B.J.,
1993. The optimal training load for the development of dynamic
athletic performance. Medicine & Science in Sports & Exercise,
25(11), pp.1279-1286.
Wisbey, B., Montgomery, P.G., Pyne, D.B. and Rattray, B.,
2010. Quantifying movement demands of AFL football using
GPS tracking. Journal of Science and Medicine in Sport, 13(5),
pp.531-536.
Young, W., Benton, D. and John Pryor, M., 2001b. Resistance
training for short sprints and maximum-speed sprints. Strength
& Conditioning Journal, 23(2), p.7.
Young, W.B., McDowell, M.H. and Scarlett, B.J., 2001a.
Specificity of sprint and agility training methods. The Journal of
Strength & Conditioning Research, 15(3), pp.315-319.
Recommended