XVI International Plant Nutrition Colloquium,Sacramento, CA, USA, August 26-30 2009
Bi f tif i B i ith l i (C )
, , , g
Biofortifying Brassica with calcium (Ca) and magnesium (Mg)1Broadley MR, 2Hammond JP, 3King GJ, 2Bowen HC, 2Hayden RM, 2Spracklen WP, 1Ó Lochlainn S, 4White PJ
1Plant and Crop Sciences Division, University of Nottingham, Sutton Bonington Campus, Loughborough, Leicestershire, LE12 5RD, UK2Warwick HRI, University of Warwick, Wellesbourne, Warwick CV35 9EF, UK3Rothamsted Research, Harpenden, Hertfordshire, AL5 2JQ, UK4The Scottish Crop Research Institute, Invergowrie, Dundee, DD2 5DA, UK

Overview
Dietary Ca and Mg deficiencies: the need for biofortificationy g
Brassica as a good target for Ca and Mg biofortificationBrassica as a good target for Ca and Mg biofortification
Potential for genetic improvement of BrassicaPotential for genetic improvement of Brassica
natural genetic variation
induced mutation
Integration and application
induced mutation

Dietary calcium (Ca) and magnesium (Mg) deficiencies
Relatively large amounts of Ca and Mg required in the human diet
Numerous health disorders associated with low Ca and Mg status
Relatively large amounts of Ca and Mg required in the human diet
e.g. Ca… bone-related (osteoporosis, rickets), etc.
e.g. Mg… heart dysfunction, hypertension, diabetes, pre-eclampsia, etc.
Soft-tissue biomarkers of Ca/Mg status unreliable, intake used to identify risk
http://www.eatwell.gov.uk/healthydiet/nutritionessentials/vitaminsandminerals/

Dietary calcium (Ca) and magnesium (Mg) deficiencies
White PJ, Broadley MR (2005). Biofortifying crops with essential mineral elements. Trends in Plant Science, 10, 586-593.

Dietary calcium (Ca) and magnesium (Mg) deficiencies
UK adult female Reference Nutrient Intake (RNI; ages 19-64)
opul
atio
n
0.8
1.0 Mgor
tion
of p
o
0.4
0.6
Prop
o
0 0
0.2
Intake from all sources (mg d-1)
0 100 200 300 400 5000.0
50.0% <270 mg magnesium d-1
Dietary calcium (Ca) and magnesium (Mg) deficiencies
UK adult female Reference Nutrient Intake (RNI; ages 19-64)
opul
atio
n
0.8
1.0 Mgor
tion
of p
o
0.4
0.6
Prop
o
0 0
0.2
Intake from all sources (mg d-1)
0 100 200 300 400 5000.0
2.5% <150 mg magnesium d-1 = Lower Reference Nutrient Intake (LRNI)50.0% <270 mg magnesium d-1

Dietary calcium (Ca) and magnesium (Mg) deficiencies
UK adult male Reference Nutrient Intake (RNI; ages 19-64)
opul
atio
n
0.8
1.0 Mgor
tion
of p
o
0.4
0.6
Prop
o
0 0
0.2
Intake from all sources (mg d-1)
0 100 200 300 400 5000.0
50.0% <300 mg magnesium d-1

Dietary calcium (Ca) and magnesium (Mg) deficiencies
UK adult male Reference Nutrient Intake (RNI; ages 19-64)
opul
atio
n
0.8
1.0 Mgor
tion
of p
o
0.4
0.6
Prop
o
0 0
0.2
Intake from all sources (mg d-1)
0 100 200 300 400 5000.0
2.5% <190 mg magnesium d-1 = Lower Reference Nutrient Intake (LRNI)50.0% <300 mg magnesium d-1

Dietary calcium (Ca) and magnesium (Mg) deficiencies
UK adult female actual intake (RNI; ages 19-64; NDNS, 2003)
opul
atio
n
0.8
1.0 Mgor
tion
of p
o
0.4
0.6
Prop
o
0 0
0.2
Intake from all sources (mg d-1)
0 100 200 300 400 5000.0
14.0% <150 mg magnesium d-1 = 3.2 million UK adult females <LRNI68.0% <270 mg magnesium d-1 = 16.3 million UK adult females <RNI

Dietary calcium (Ca) and magnesium (Mg) deficiencies
UK adult male actual intake (RNI; ages 19-64; NDNS, 2003)
opul
atio
n
0.8
1.0 Mgor
tion
of p
o
0.4
0.6
Prop
o
0 0
0.2
Intake from all sources (mg d-1)
0 100 200 300 400 5000.0
45.0% <300 mg magnesium d-1 = 16.3 million UK adult males <RNI12.0% <190 mg magnesium d-1 = 2.7 million UK adult males <LRNI
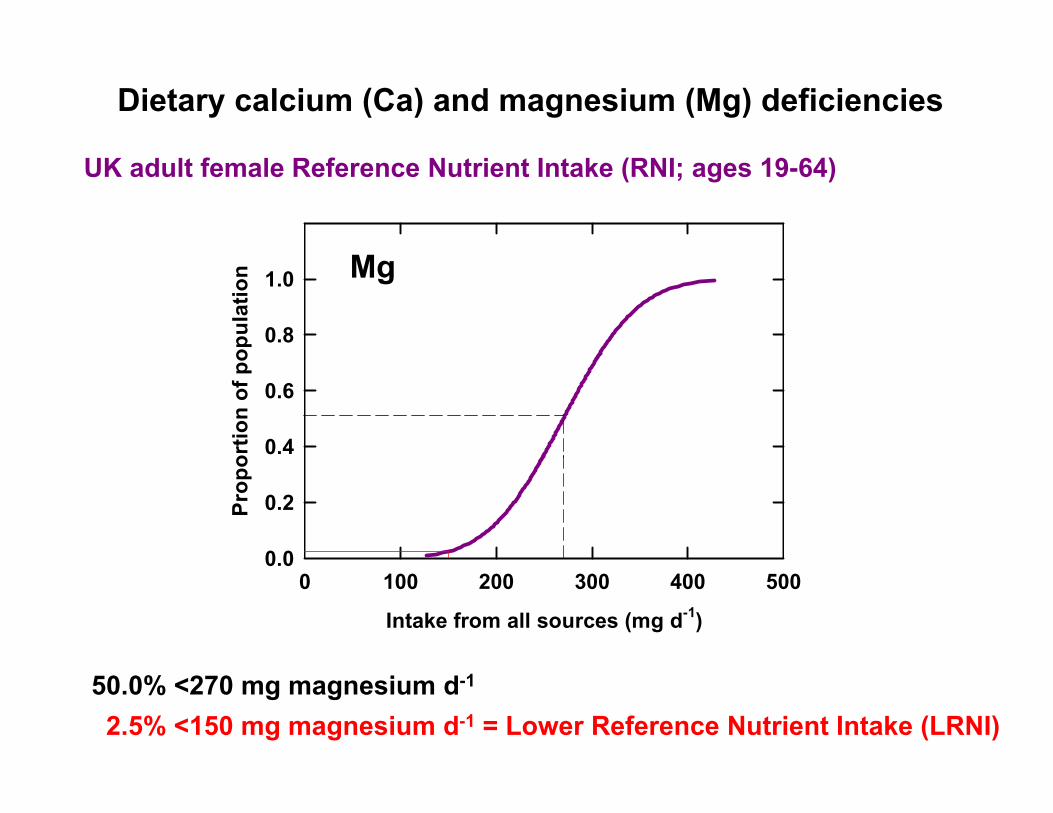
Dietary calcium (Ca) and magnesium (Mg) deficiencies
~6 million UK adults <LRNI for Mg
Calcium RNI = 700 mg d-1; LRNI = 400 mg d-1. [low compared to US]
~3 million UK adults <LRNI for Ca
UK diet high in dairy + mandatory Ca-fortification of non-wholemeal flour
Many more at risk globally?
Overview
Dietary Ca and Mg deficiencies: the need for biofortificationy g
Brassica as a good target for Ca and Mg biofortificationBrassica as a good target for Ca and Mg biofortification
Potential for genetic improvement of BrassicaPotential for genetic improvement of Brassica
natural genetic variation
induced mutation
Integration and application
induced mutation

Brassica as a good target for Ca and Mg biofortification

Brassica as a good target for Ca and Mg biofortification
Calcium
Karley & White (2009) Current Opinion in Plant Biology 12: 291-298

Brassica as a good target for Ca and Mg biofortification
Magnesium (& K)
Karley & White (2009) Current Opinion in Plant Biology 12: 291-298

Brassica as a good target for Ca and Mg biofortification

Brassica as a good target for Ca and Mg biofortification
2006 production: sica
"
60
80
2006 production:
68.9 Mt yr-1 cabbages / other brassica18.1 Mt yr-1 cauliflowers / broccoli
age
& o
ther
bra
spr
oduc
tion
(Mt)
40
60
cf. 64.4 Mt yr-1 onions and shallots "Cab
ba p
0
20
and
broc
coli"
tion
(Mt)
10
15
Brassica oleracea"C
aulif
low
er
prod
uct
5
10
19971998
19992000
20012002
20032004
20052006
0
http://faostat.fao.org/
Brassica as a good target for Ca and Mg biofortification
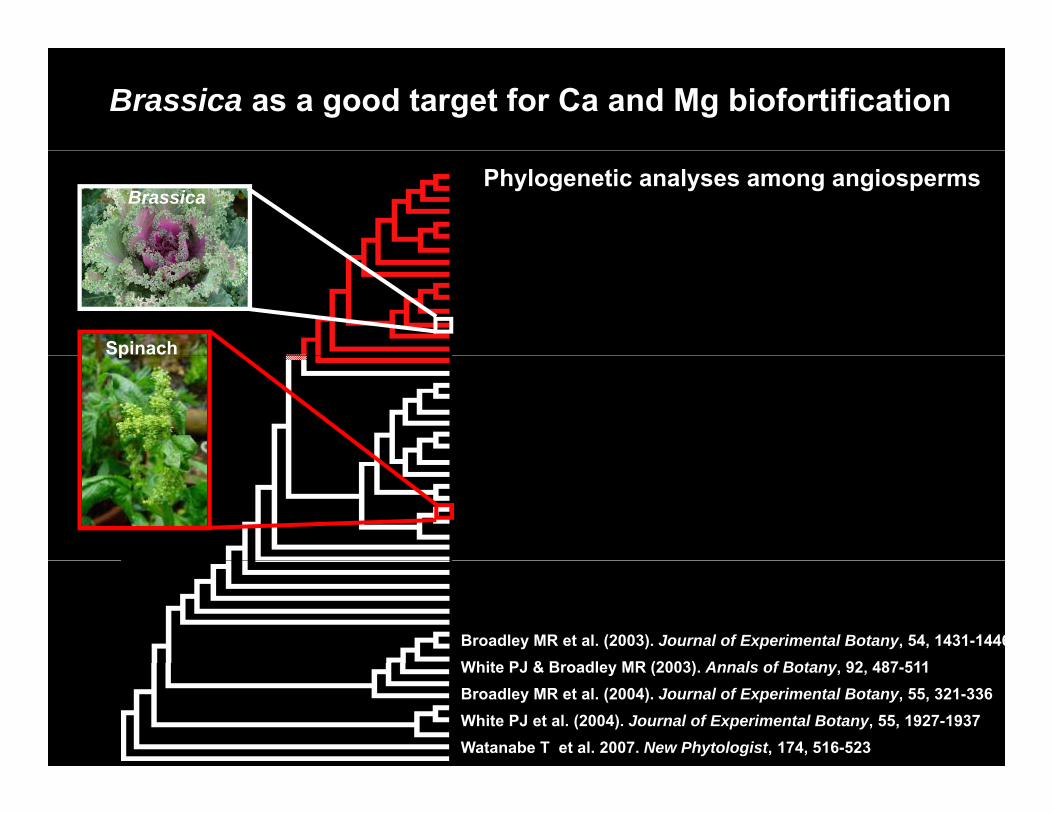
Phylogenetic analyses among angiospermsBrassica
Spinachp
Whit PJ & B dl MR (2003) A l f B t 92 487 511Broadley MR et al. (2003). Journal of Experimental Botany, 54, 1431-1446White PJ & Broadley MR (2003). Annals of Botany, 92, 487-511Broadley MR et al. (2004). Journal of Experimental Botany, 55, 321-336White PJ et al. (2004). Journal of Experimental Botany, 55, 1927-1937Watanabe T et al. 2007. New Phytologist, 174, 516-523

Brassica as a good target for Ca and Mg biofortification
Evolutionary conservation of leaf traits shown in variance components analysis
Proportion of variation
C M K N P SCa Mg K N P Se
64 65 50 9 7 5order and above (%) 64 65 50 9 7 5
36 35 50 91 93 95
order and above (%)
within order (%)
Ca and Mg low in commelinoid monocot leaves
C d M hi h i B i d th id
Mg and Mg:Ca high in Caryophyllales orders
Ca and Mg high in Brassicaceae and other rosids

10
Brassica as a good target for Ca and Mg biofortification
hoot
-Ca
. dev
.)
6
8
Can=670Brassica
Stan
dard
ised
s((x
-mea
n)/s
td
2
4 n=429
n=325Spinach
0
2.5
3.0
M
p
ardi
sed
shoo
t-Mg
mea
n)/s
td. d
ev.)
1.0
1.5
2.0Mg
Stan
da((x
-m
0.0
0.5
All species
Brassica
Spinach
Broadley MR et al. 2008. Plant Physiology, 146, 1707-1720

Overview
Dietary Ca and Mg deficiencies: the need for biofortificationy g
Brassica as a good target for Ca and Mg biofortificationBrassica as a good target for Ca and Mg biofortification
Potential for genetic improvement of BrassicaPotential for genetic improvement of Brassica
natural genetic variation
induced mutation
Integration and application
induced mutation

Potential for genetic improvement of Brassica
Brassica oleracea diversity
Image G King, G Teakle

Potential for genetic improvement of Brassica
~450 diversity accessions sampled:
Experiments in glasshouse and field environments (2002-2007)
450 diversity accessions sampled:
sabellica (borecole)italica (broccoli)b t ti ( lifl )botrytis (cauliflower) capitata (cabbage)gongylodes (Kohlrabi)alboglabra (Oriental kale)g ( )sabauda (Savoy cabbage)gemmifera (Brussels sprout)
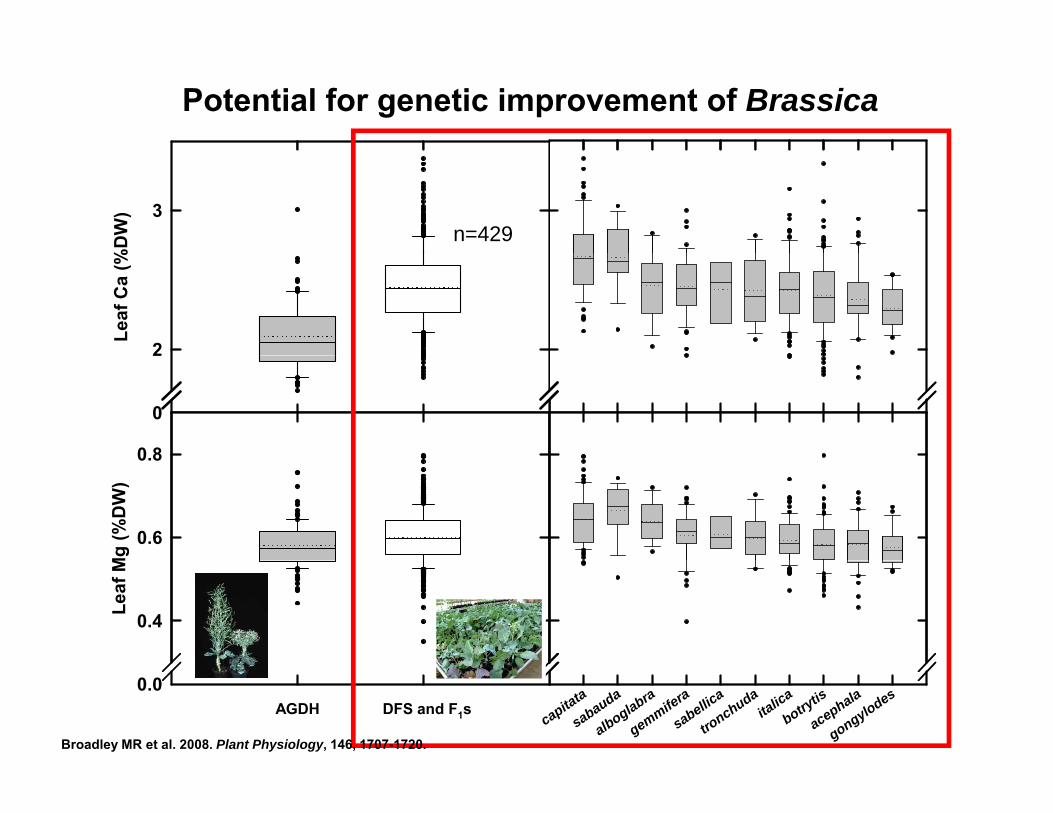
Potential for genetic improvement of Brassica%
DW
) 3n=429
Leaf
Ca
(%
2
0
2
0.8
Mg
(%D
W)
0.6
0.8
Leaf
M
0.4
capitata
sabauda
alboglabra
gemmifera
sabellica
tronchuda
italica
botrytis
acephala
gongylodes0.0
AGDH DFS and F1s
Broadley MR et al. 2008. Plant Physiology, 146, 1707-1720.

Potential for genetic improvement of Brassica
F1 hybrids in field vs glasshouse experiments (2002-2007)…
4 1 0
3
4
0.8
1.0Mg (%DW), R=0.65
perim
ent Ca (%DW), R=0.76
3
0.6
ssho
use
exp
0 2 3 4 50
2
0.0 0.3 0.4 0.5 0.60.0
0.4Gla
Fi ld i t Fi ld i tField experiment Field experiment
…indicates strong genetic component to leaf/shoot Ca and Mg
Broadley MR et al. 2008. Plant Physiology, 146, 1707-1720.

Potential for genetic improvement of Brassica%
DW
) 3
90
Leaf
Ca
(%
2
n=90
0
2
0.8
Mg
(%D
W)
0.6
0.8
Leaf
M
0.4
capitata
sabauda
alboglabra
gemmifera
sabellica
tronchuda
italica
botrytis
acephala
gongylodes0.0
AGDH DFS and F1s
Broadley MR et al. 2008. Plant Physiology, 146, 1707-1720.

Potential for genetic improvement of Brassica
V i C M K P Z FVariance component
Ca Mg K P Zn Fe
Genotype (VA) 36.0 37.7 22.2 7.4 18.5 7.1Genotype (VA) 36.0 37.7 22.2 7.4 18.5 7.1
[P]ext 0.2 4.0 2.2 43.1 7.2 3.5
[P]ext / 1.4 1.1 1.4 0.5 2.5 0.0genotype
‘other’ 62.4 57.2 74.2 49.0 71.8 89.4
High heritability in AG population (alboglabra X italica)
Broadley MR et al. 2008. Plant Physiology, 146, 1707-1720.

C2 C6 C7 C8
2A1B
1B
1B
5D
3D5A
1C
4B
1A
1E5E
3B5B 4A
D
C9
5B1
5F
Quantitative trait loci (QTL)
5E1DQuantitative trait loci (QTL)
for Ca and Mg
Broadley MR et al. 2008. Plant Physiology, 146, 1707-1720.

2.6A
Potential for genetic improvement of Brassica%
DW
)
2.3
2.4
2.5
Shoo
t-Ca
(%
2.1
2.2
2.3
******
***
**C
A12GD33
AGSL118
AGSL119
AGSL120
AGSL121
AGSL122
AGSL123
AGSL127
AGSL129
AGSL134
AGSL137
AGSL138
AGSL141
AGSL158
AGSL160
AGSL161
AGSL165
AGSL168a
AGSL168b
AGSL169
AGSL1730.0
2.0C8 C9 C8 C9 C8 C9 C8 C9C8 C9 C8 C9 C8 C9 C8 C9
(%D
W) 0.6
A A A A A A A A A A A A A A A A A AG A A
* * * * ***
B
Shoo
t-Mg
0.5***
Broadley MR et al. 2008. Plant Physiology 146, 1707-1720A12
GD33
AGSL118
AGSL119
AGSL120
AGSL121
AGSL122
AGSL123
AGSL127
AGSL129
AGSL134
AGSL137
AGSL138
AGSL141
AGSL158
AGSL160
AGSL161
AGSL165
AGSL168a
AGSL168b
AGSL169
AGSL1730.0
0.4

C2 C6 C7 C8
2A1B
1B
1B
5D
3D5A
1C
4B
1A
1E5E
3B5B 4A
D
C9
5B1
5F
Collinear with 106 genes on
5E1DCollinear with 106 genes on
Arabidopsis chromosome 5
Broadley MR et al. 2008. Plant Physiology, 146, 1707-1720.

Potential for genetic improvement of Brassica
AGSLs introgressed into maternal A12 ‘rapid’ cycling background (B1F2s)

Potential for genetic improvement of Brassica
Brassica napus diversity set

Potential for genetic improvement of BrassicaD
W)
4
DW
)
1.0
Ca Mg
ncen
trat
ion
(% D
3
ncen
trat
ion
(% D
0.6
0.8
♀ ♀♀ ♀
Ca Mg
n=130 n=130
ot o
r lea
f Ca
con
1
2
ot o
r lea
f Mg
con
0.4
0.6♀
♂
♀
♂♂ ♂
Shoo
0
1
Shoo
0.0
racea
DFS
cea A
GDH
napus D
FS
a rapa I
RRI
racea
DFS
cea A
GDH
napus D
FS
a rapa I
RRI
Brassic
a oler
a
Brassic
a oler
ace
Brassic
a nap
Brassic
a r
Brassic
a oler
a
Brassic
a oler
ace
Brassic
a nap
Brassic
a r
Brassica napus diversity set

Potential for genetic improvement of Brassica
Brassica rapa much more rapid-cycling, and it is our current major focus:
Brassica rapa, R-o-18, staged sowing
7 11 16 19 23 27 31 36 39 43 47 51 55
10 cm
7 11 16 19 23 27 31 36 39 43 47 51 55
Days after sowing (composite image)

Potential for genetic improvement of Brassica
R500 annual Yellow Sarson seed oil (R500) (ssp. tricolaris), USA (8 wks)
R-o-18 (8 wks)
IMB211 Rapid cycling Chinese cabbage (ssp. pekinensis), Japan (6 wks)

Potential for genetic improvement of Brassica(%
DW
)
4
(% D
W)
0 8
1.0
Ca Mg
conc
entr
atio
n (
2
3
g co
ncen
trat
ion
(
0.6
0.8
♀
♂
♀♀
♂♀
♂
Shoo
t or l
eaf C
a
1
2
Shoo
t or l
eaf M
g
0.4
♂ ♂♂
S
0
S
0.0
a olerac
ea D
FS
olerac
ea A
GDHsic
a nap
us DFS
ssica
rapa I
RRI
a olerac
ea D
FS
olerac
ea A
GDHsic
a nap
us DFS
ssica
rapa I
RRI
Brassic
a
Brassic
a ol
Brassic
Brass
Brassic
a
Brassic
a ol
Brassic
Brass

Potential for genetic improvement of Brassica
Overview
Dietary Ca and Mg deficiencies: the need for biofortificationy g
Brassica as a good target for Ca and Mg biofortificationBrassica as a good target for Ca and Mg biofortification
Potential for genetic improvement of BrassicaPotential for genetic improvement of Brassica
natural genetic variation
induced mutation
Integration and application
induced mutation

Potential for genetic improvement of BrassicaM d lli di t i ifi t i t t di l C t tModelling… predicts significant resistance to radial Ca-transport:
White PJ (1998). Annals of Botany, 81, 173-183; White PJ (2001). Journal of Experimental Botany, 52, 891-899; White PJ et al. (2002). New Phytologist, 153, 201-207.

Potential for genetic improvement of BrassicaC l i h t id tifi d f t t t t D S lt l b
9000
10000
Calcium-phenotype identified among fast-neutron mutants, Dave Salt lab:
g kg
-1 D
W)
7000
8000
9000
ot M
g (m
g
5000
6000
7000
Col-0
Shoo
3000
4000
5000esb1
Shoot Ca (mg kg-1 DW)
500010000
1500020000
2500030000
3500040000
450003000
(No Mg phenotype) Shoot Ca (mg kg DW)
Baxter I et al. (2009) PLoS Genetics, 5, e1000492.
PiiMS Database, www.ionomicshub.org
( g p yp )

Potential for genetic improvement of Brassica
Increased suberin deposition in esb1
Baxter I et al. (2009) PLoS Genetics, 5, e1000492.

Potential for genetic improvement of BrassicaHACC
(Annexin)DACC(TPC1)
KOR(SKOR,GORK)
VICC(GLR,CNGC)
Ca2+
(Annexin)(TPC1)(SKOR,GORK) (GLR,CNGC)
ACA8
Ca2+ Ca2+ Ca2+ Ca2+
cytoplasmACA4
CAX
SV Channel
HACC
Ca2+
Ca2+
H+
Ca2+
Ca2+
vacuole
V-typeATPase
ACA1IP3
IP6
H+
H+
Ca2+
Ca2+
plastid
ECA1
cADPRCa2+
NAADP-R
IP3-R CADPR-R
ECA1ACA1
endoplasmic reticulum
Vacuolar Ca accumulation via P2B-ATPases (ECA/ACA), Ca2+/H+ antiporters (CAX)
endoplasmic reticulum

Potential for genetic improvement of Brassica
CAX1-related phenotypes
Ca2+ : Mg2+ = 0 04 mol : mol
e.g. cax1 on faux-serpentine media
Bradshaw HD (2005). New Phytologist 167: 81–88.
Ca : Mg 0.04 mol : mol
e.g. overexpression of a modified CAX1 (sCAX1) increases bioavailable Ca
[carrot, lettuce, tomato, potato…]
Park et al., 2004; Park et al., 2005a,b; Kim et al., 2006; Morris et al., 2008; Park et al., 2009

Potential for genetic improvement of Brassica
)1000
Col-0
g kg
-1 D
W
600
800 cax1
cax3
ot M
g (m
g
400
cax1cax3
Shoo
0
200
Shoot Ca (mg kg-1 DW)
0500
10001500
20002500
30000
Shoot Ca (mg kg DW)
(Ca and Mg phenotype in cax1cax3) PiiMS Database, www.ionomicshub.org

Overview
Dietary Ca and Mg deficiencies: the need for biofortificationy g
Brassica as a good target for Ca and Mg biofortificationBrassica as a good target for Ca and Mg biofortification
Potential for genetic improvement of BrassicaPotential for genetic improvement of Brassica
natural genetic variation
induced mutation
Integration and application
induced mutation
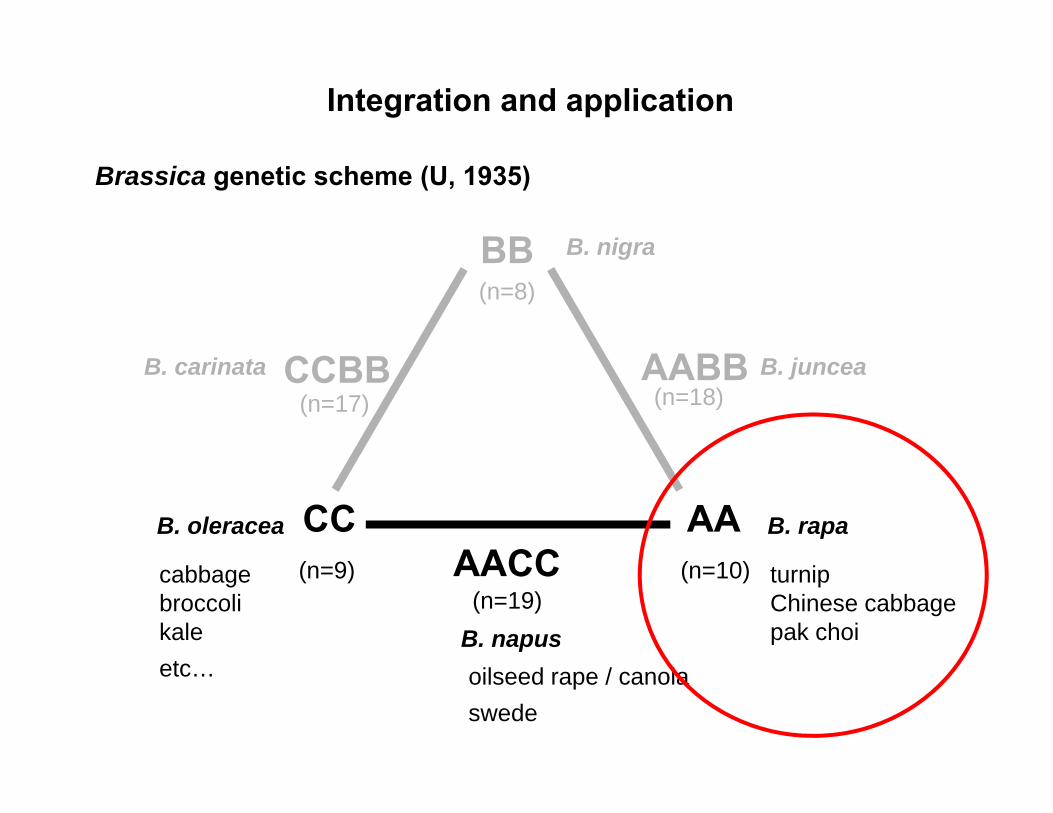
Integration and application
BB B. nigra
Brassica genetic scheme (U, 1935)
BB B. nigra
AABB
(n=8)
AABB B. junceaCCBBB. carinata(n=18)(n=17)
AACCB. oleracea B. rapa
AACCAACC
B. napus
cabbagebroccolikale
t
turnipChinese cabbagepak choi
(n=9) (n=10)(n=19)
etc… oilseed rape / canolaswede

Integration and applicationB i ‘Chiif ’ l t i 2009 ( 500 Mb)
A2A1 A4A3 A7A5 A8A6 A10A9
Brassica rapa ‘Chiifu’ sequence complete in 2009 (~500 Mb)
BraCAX1
BraCAX3
KBrHOO4D08 anchored B. rapa ‘Chiifu’ BACÓ Lochlainn S et al. unpublished
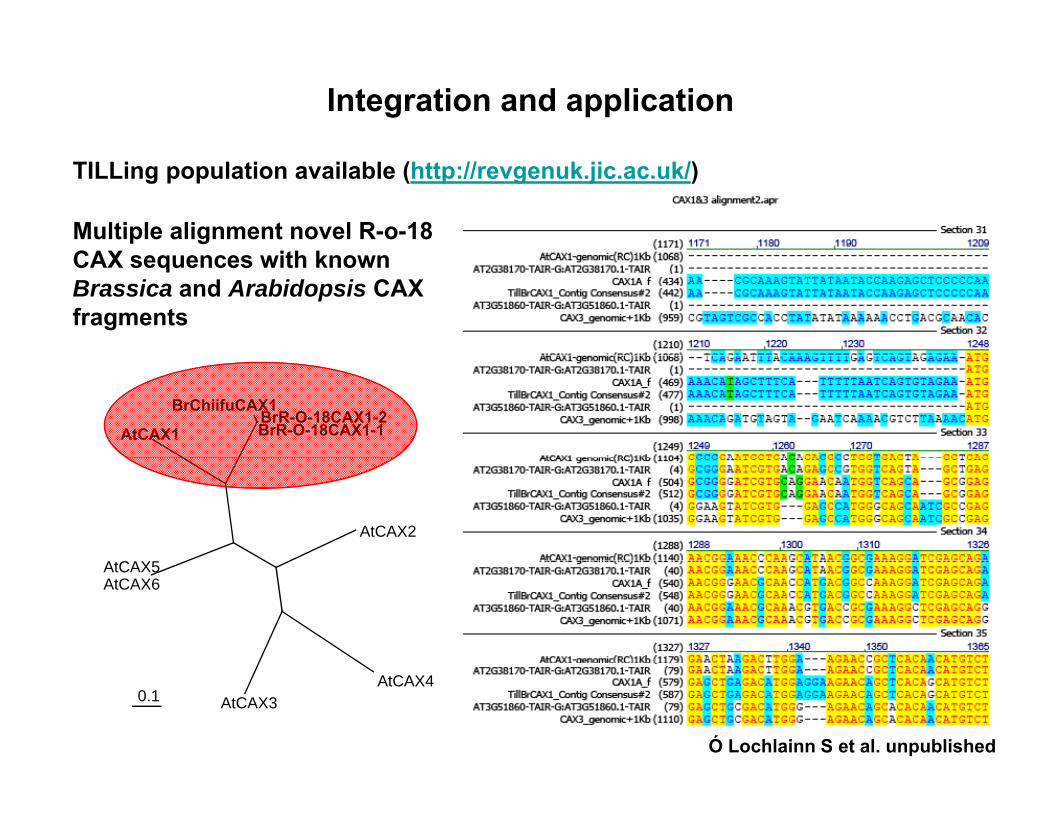
Integration and application
TILLing population available (http://revgenuk.jic.ac.uk/)
Multiple alignment novel R-o-18 CAX ith kCAX sequences with known Brassica and Arabidopsis CAX fragments
AtCAX1
BrChiifuCAX1BrR-O-18CAX1-2BrR-O-18CAX1-1
AtCAX2
AtCAX6AtCAX5
Ó Lochlainn S et al. unpublished
0.1AtCAX4
AtCAX3

Integration and application
New project (2009-2013) aims to integrate Brassica phenotypic data (natural variants, eQTLs) with Arabidopsis IonomeHub
“Getting the Brassicaceae genomes/ionomes talking” [cyberinfrastrcture]Getting the Brassicaceae genomes/ionomes talking [cyberinfrastrcture]

Integration and application
UK adult female actual intake (RNI; ages 19-64; NDNS, 2003)
popu
latio
n
0.8
1.0or
tion
of p
0.4
0.6
Prop
0.0
0.2 Mg
Intake from all sources (mg d-1)
0 100 200 300 400 500
14.0% <150 mg magnesium d-1 = 3.2 million UK adult females <LRNI68.0% <270 mg magnesium d-1 = 15.3 million UK adult females <RNI

Integration and application1,700,000
+1 portion of curly kale (UK Food Standards Agency)
popu
latio
n
0.8
1.0or
tion
of p
0.4
0.6
Prop
0.0
0.2 Mg
Intake from all sources (mg d-1)
0 100 200 300 400 500
6.5% <150 mg magnesium d-1 = 1.5 million UK adult females <LRNI51.5% <270 mg magnesium d-1 = 11.6 million UK adult females <RNI

Integration and application500,000
+1 portion of Chinese cabbage (UK Food Standards Agency)
popu
latio
n
0.8
1.0or
tion
of p
0.4
0.6
Prop
0.0
0.2 Mg
Intake from all sources (mg d-1)
0 100 200 300 400 500
12.0% <150 mg magnesium d-1 = 2.7 million UK adult females <LRNI65.0% <270 mg magnesium d-1 = 14.6 million UK adult females <RNI

Integration and application2,900,000
+1 portion of our “best” Brassica rapa
popu
latio
n
0.8
1.0or
tion
of p
0.4
0.6
Prop
0.0
0.2 Mg
Intake from all sources (mg d-1)
0 100 200 300 400 500
1.5% <150 mg magnesium d-1 = 0.3 million UK adult females <LRNI29.0% <270 mg magnesium d-1 = 6.5 million UK adult females <RNI

Integration and application
Or even a pint of best!!
popu
latio
n
0.8
1.0or
tion
of p
0.4
0.6
Prop
0.0
0.2 Mg
Intake from all sources (mg d-1)
0 100 200 300 400 500

XVI International Plant Nutrition Colloquium,Sacramento, CA, USA, August 26-30 2009
Bi f tif i B i ith l i (C )
, , , g
Biofortifying Brassica with calcium (Ca) and magnesium (Mg)1Broadley MR, 2Hammond JP, 3King GJ, 2Bowen HC, 2Hayden RM, 2Spracklen WP, 1Ó Lochlainn S 4White PJ
1Plant and Crop Sciences Division, University of Nottingham, Sutton Bonington Campus, Loughborough, Leicestershire, LE12 5RD, UK2Warwick HRI, University of Warwick, Wellesbourne, Warwick CV35 9EF, UK3Rothamsted Research, Harpenden, Hertfordshire, AL5 2JQ, UK4The Scottish Crop Research Institute, Invergowrie, Dundee, DD2 5DA, UK


Brassica as a good target for Ca and Mg biofortification100
1
%D
W) Ca
44 elements in plant leaves
0.01
com
posi
tion
(%
Mg
0.0001
leaf
min
eral
c
0.000001Plan
t
Sources:Broadley MR Bowen HC Cotterill HL Hammond JP Meacham MC Mead A White PJ (2004) Phylogenetic variation in the shoot mineral concentration of angiosperms Journal of Experimental Botany 55 321 336
0.000000010.00000001 0.000001 0.0001 0.01 1 100
Human mineral composition (%DW)
Watanabe T, Broadley MR, Jansen S, White PJ, Takada J, Satake K, Takamatsu T, Jaya Tuah S, Osaki M. (2007). Evolutionary control of leaf element composition in plants. New Phytologist, 174, 516-523.
Epstein E. (1972). Mineral nutrition of plants: principles and perspectives. New York, USA: John Wiley and Sons, Inc.
Emsley J. (1998). The elements, 3rd ed. Oxford, UK: Clarendon Press
Broadley MR, Bowen HC, Cotterill HL, Hammond JP, Meacham MC, Mead A, White PJ. (2004). Phylogenetic variation in the shoot mineral concentration of angiosperms. Journal of Experimental Botany, 55, 321-336.
Hodson MJ, White PJ, Mead A, Broadley MR. (2005). Phylogenetic variation in the silicon composition of plants. Annals of Botany, 96, 1027-1046.
Marschner H. (1995). Mineral Nutrition of Higher Plants, 2nd Edition. Academic Press, London, UK.
Kay CE, Tourangeau PC, Gordon CC. (1975). Fluoride levels in indigenous animals and plants collected from uncontaminated ecosystems. Fluoride, 8, 125-133.


Brassica as a good target for Ca and Mg biofortification
“Cabbage and other brassica” “Cauliflower and broccoli”
on to
nnes
)
30
40
on to
nnes
)
8
10
odcu
tion
(mill
io
20
odcu
tion
(mill
io
4
6
hinandia tio
n c ofpan
aineesia and
ania rica any
Nam
2006
pro
0
10
hinandia ric
apain Italy nce
xico anddom stan any key
2006
pro
0
2
Chin Ind
Russian Federatio
Korea, Republic o
JapaUkrain
IndonesPolan
Roman
United States of Americ
Germany
Viet Nam
Chin Ind
United States of Americ Spai Ita
yFranc
MexicPolan
United Kingdom
Pakista
Germany
Turkey
http://faostat.fao.org/
Recommended