1
Becle, S.A.B. de C.V. Reports Fourth Quarter and Full Year 2019 Unaudited Financial
Results
Mexico City, Mexico, February 27, 2020 /BUSINESSWIRE/ -- BECLE, S.A.B. de C.V.
(“Cuervo”, “BECLE” or the “Company”) (BMV: CUERVO) today announced financial results
for the quarter and full year ended December 31, 2019.
All figures in this release are derived from the Interim Consolidated Financial Statements of the Company as of
December 31, 2019, and for the three-month and twelve-month periods then ended, which are prepared in
accordance with International Financial Reporting Standard (IFRS).
Fourth Quarter 2019 Highlights
• Volume increased 6.4% on an underlying basis to 7.6 million nine-liter cases;
• Net sales increased 5.2% on an underlying basis to P$10,434 million pesos;
• Gross profit decreased 8.3% to P$5,312 million pesos. Gross margin was 50.9%;
• EBITDA increased 1.6% to P$2,259 million pesos. EBITDA margin was 21.6% and;
• Consolidated net income decreased 30.6% to P$1,429 million pesos, resulting in
earnings per share of P$0.40.
Full Year 2019 Highlights
• Volume increased 7.5% on an underlying basis to 22.1 million nine-liter cases;
• Net sales increased 9.2% on an underlying basis to P$29,348 million pesos;
• Gross profit decreased 3.2% to P$15,666 million pesos; Gross margin was 52.7%;
• EBITDA increased 0.4% to P$6,096 million pesos. EBITDA margin was 20.5% and;
• Consolidated net income decreased 7.8% to P$3,718 million pesos, resulting in
earnings per share of P$1.04.
All abovementioned increases and decreases have been determined in comparison to the corresponding period
in the preceding year.
Management Commentary
Becle finished 2019 with strong underlying volume and net sales growth during the fourth
quarter, delivering consistent top line growth driven by solid performance in the U.S. and
Canada, and Mexico regions. For the full year 2019, the Company generated 7.5% and
9.2% underlying volume and net sales growth, respectively. The Company continued to see
strong depletion trends in the U.S. and Canada while efficiently managing distributor’s
tequila inventories across all geographies. Growth was once again led by the
premiumization trend toward super premium tequilas across all regions as well as increased
pricing in the Mexican region. Despite cost pressures, fourth quarter underlying net sales
and volume grew 5.2% and 6.4%, respectively, contributing to EBITDA growth. The
Company remains well positioned in the global spirits industry, with strong brands in high
growth regions and categories.
2
Fourth Quarter 2019 Results
Volume by Region 4Q19 (in 000s nine-liter cases)
Region 4Q19 4Q18 4Q18 PF* (Var. %
YoY) PF* (Var.% YoY)
U.S. & Canada 3,914 3,800 3,630 7.8% 3.0%
Mexico 2,771 2,614 2,612 6.1% 6.0%
Rest of the World 883 889 874 1.0% -0.7%
Total 7,568 7,303 7,116 6.4% 3.6%
* Pro forma for the non-renewal of the distribution agreement for the The Cholula Food Company in
April of 2019. For comparison purposes only.
During the fourth quarter of 2019, total volume increased 6.4% on an underlying basis to 7.6
million nine-liter cases (+3.6% reported). The year-over-year growth reflected 7.8% increase
in the U.S. and Canada on an underlying basis (+3.0% reported), driven by strong consumer
take-away and depletion trends, led by continued strong performance of tequila; a 6.1%
increase in Mexico on an underlying basis (+6.0% reported), driven by continued strong
shipments of tequila partially offset by a deceleration of the non-alcoholic beverage portfolio;
and an 1.0% increase in the Rest of the World (RoW) region on an underlying basis (-0.7%
reported).
52%36%
12%
Volume breakdown by region 4Q19
U.S. & Canada Mexico Rest of the World

3
Net Sales by Region 4Q19 (in MXN$ millions)
Region 4Q19 4Q18 4Q18 PF* (Var. %
YoY) PF* (Var.% YoY)
U.S. & Canada 6,207 6,404 6,081 2.1% -3.1%
Mexico 2,836 2,422 2,420 17.2% 17.1%
Rest of the World 1,391 1,442 1,419 -2.0% -3.5%
Total 10,434 10,268 9,920 5.2% 1.6%
* Pro forma for the non-renewal of the distribution agreement for the The Cholula Food Company in
April of 2019. For comparison purposes only.
Fourth quarter 2019 net sales increased 5.2% on an underlying basis to P$10,434 million
pesos (+1.6% reported). Net sales in Mexico increased 17.2% on an underlying basis
(+17.1% reported), primarily driven by the strong volume growth in super premium tequilas
as a result of the price increases implemented in the last twelve months. In the same period,
U.S. and Canada net sales increased 2.1% on an underlying basis (-3.1.% reported),
primarily reflecting the non-renewal of the distribution agreement for the The Cholula Food
Company and the Mexican peso appreciation against the U.S. dollar on a year on year
comparison. Net sales of the RoW region decreased by 2.0% on an underlying basis (-3.5%
reported) when compared to the fourth quarter of 2018.
60%27%
13%
Net sales breakdown by region 4Q19
U.S. & Canada Mexico Rest of the World
4
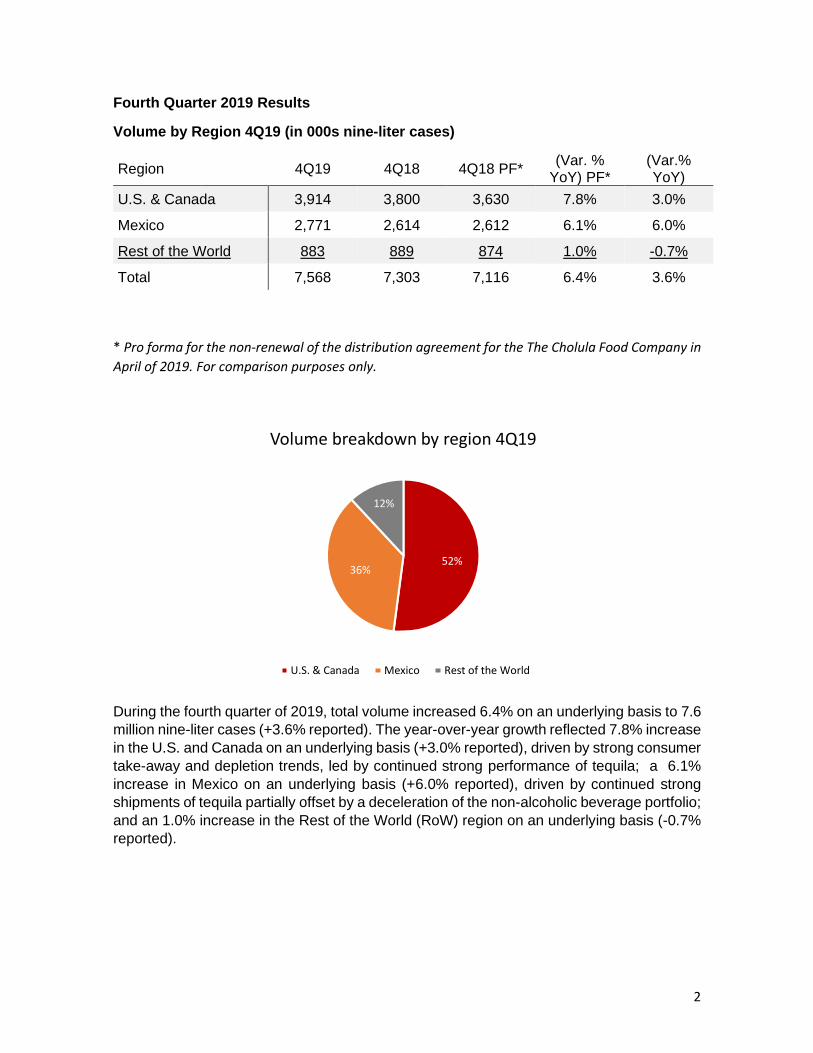
Volume by Category 4Q19 (in 000s nine-liter cases)
Category 4Q19 4Q18 4Q18 PF* (Var. %
YoY) PF* (Var.% YoY)
Jose Cuervo 2,644 2,425 2,425 9.1% 9.1%
Other Tequilas 1,373 1,244 1,244 10.4% 10.4%
Other Spirits 1,785 1,693 1,693 5.4% 5.4%
Non-Alcoholic and Other 960 1,180 993 -3.3% -18.7%
RTD 806 761 761 5.8% 5.8%
Total 7,568 7,303 7,116 6.4% 3.6%
* Pro forma for the non-renewal of the distribution agreement for the The Cholula Food Company in
April of 2019. For comparison purposes only.
Volume of Jose Cuervo increased 9.1% compared to the same period in 2018 and
represented 34.9% of total volume for the fourth quarter of 2019. Other Tequila brands
represented 18.1% of total volume, with volume increasing 10.4% compared to the prior
year period. Other Spirits brands represented 23.6% of total volume in the period and
experienced a 5.4% increase in volume over the fourth quarter of 2018. Volume of Non-
alcoholic and Other represented 12.7% of total volume and volume decreased 3.3% on an
underlying basis (-18.7% reported) compared to the prior year period primarily driven by the
non-renewal of the distribution agreement for the The Cholula Food Company brand in April
of this year. Volume of ready-to-drink (RTD) represented 10.6% of total volume and grew by
5.8% compared to the prior year period.
35%
18%
24%
12%
11%
Volume breakdown by category 4Q19
Jose Cuervo Other Tequilas Other Spirits Non-Alcoholic and Other RTD
5
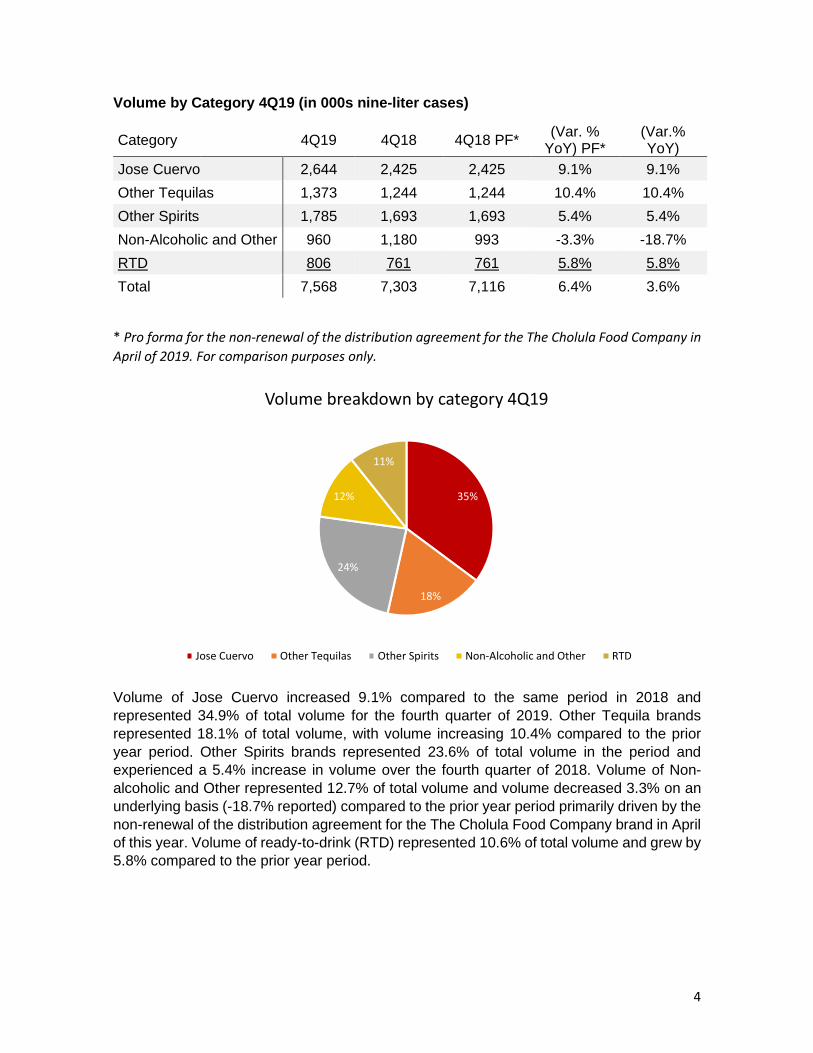
Net Sales by Category 4Q19 (in MXN$ millions)
Category 4Q19 4Q18 4Q18 PF* (Var. %
YoY) PF* (Var.% YoY)
Jose Cuervo 3,825 3,613 3,613 5.9% 5.9%
Other Tequilas 2,949 2,643 2,643 11.6% 11.6%
Other Spirits 2,554 2,612 2,612 -2.2% -2.2%
Non-alcoholic and other 437 766 419 4.4% -43.0%
RTD 669 633 633 5.6% 5.6%
Total 10,434 10,268 9,920 5.2% 1.6%
* Pro forma for the non-renewal of the distribution agreement for the The Cholula Food Company in
April of 2019. For comparison purposes only.
Net sales of Jose Cuervo increased 5.9% compared to the same period in 2018 and
represented 36.7% of total net sales for the fourth quarter of 2019. Net sales of Other Tequila
brands increased 11.6% compared to the prior year period and represented 28.3% of total
net sales. Other Spirits brands represented 24.5% of total net sales in the period and
decreased 2.2% compared to the fourth quarter of last year. Net sales of Non-alcoholic and
Other represented 4.2% of total net sales and increased 4.4% on an underlying basis
(-43.0% reported) compared to the prior year period reflecting the non-renewal of the
distribution agreement for the The Cholula Food Company. Net sales of RTDs represented
6.4% of total net sales and increased 5.6% compared to the prior year period.
37%
28%
25%
4%6%
Net sales breakdown by category 4Q19
Jose Cuervo Other Tequilas Other Spirits Non-alcoholic and Other RTD

6
Gross profit during the fourth quarter of 2019 decreased 8.3% over the same period in 2018
to P$5,312 million pesos. Gross margin was 50.9% for the fourth quarter of 2019 compared
to 56.4% for the fourth quarter of 2018, primarily reflecting agave price increases in COGS
and to a lesser degree the Mexican peso appreciation against the U.S. Dollar impacting our
net sales.
Advertising, marketing and promotion (AMP) expenses decreased 14.5% to P$2,156 million
pesos when compared to the fourth quarter of 2018. As a percentage of net sales, AMP
decreased to 20.7% from 24.6% in the prior year period. This decrease reflects the planned
timing of AMP spend relative to the prior year period.
Distribution expenses decreased 20.4% to P$344 million when compared to the fourth
quarter of 2018. As a percentage of net sales, distribution expenses decreased to 3.3% from
4.2% in the prior year period, mainly driven by lower fuel costs.
Selling and administrative (SG&A) expenses increased 8.5% to P$807 million pesos when
compared to the fourth quarter of 2018. As a percentage of net sales, SG&A increased to
7.7% from 7.2% in the prior year period, driven by inflation, backfilling of strategic personnel
positions and investments in our route to market structures.
Operating income during the fourth quarter of 2019 decreased 1.1% to P$2,038 million
pesos compared to the same period last year. Operating margin decreased to 19.5% as
compared to 20.1% in the prior year period.
EBITDA in the fourth quarter of 2019 increased 1.6% to P$2,259 million pesos compared to
the fourth quarter of 2018. EBITDA margin was 21.6% for the fourth quarter of 2019 versus
21.7% in the same period of last year.
Net financial results were a gain of P$17 million pesos during the fourth quarter of 2019, a
decrease of 95.2% compared to the fourth quarter of 2018, driven by an exchange gain that
was partially offset by net interest expense.
Consolidated net income in the fourth quarter of 2019 decreased 30.6% to P$1,429 million
pesos, compared to P$2,059 million pesos in the prior year period. Net margin was 13.7%
for the fourth quarter of 2019, compared to 20.1% in the fourth quarter of 2018. Earnings
per share were P$0.40 in the fourth quarter of 2019, compared to P$0.58 in the same period
of the prior year.

7
Full Year 2019 Results
Volume by Region for Full Year 2019 (in 000s nine-liter cases)
Region 2019 2019 PF* 2018 2018 PF* (Var.%
YoY) PF* (VAR.% YOY)
U.S. & Canada 12,460 12,269 12,016 11,359 8.0% 3.7% Mexico 7,297 7,294 6,746 6,735 8.3% 8.2% Rest of the World
2,560 2,549 2,518 2,473 3.1% 1.7%
Total 22,317 22,112 21,279 20,566 7.5% 4.9%
* Pro forma for the non-renewal of the distribution agreement for the The Cholula Food Company in
April of 2019. For comparison purposes only.
During the full year of 2019, total volume growth was 7.5% to 22.1 million nine-liter cases
on an underlying basis (+4.9% reported). Reflecting an underlying 8.0% increase in the U.S.
and Canada (+3.7 reported), 8.3% underlying increase in sales volumes in Mexico (+8.2%
reported) and a 3.1% underlying increase in the RoW region (+1.7% reported).
56%33%
11%
Volume breakdown by region 2019
U.S. & Canada Mexico Rest of the World
8
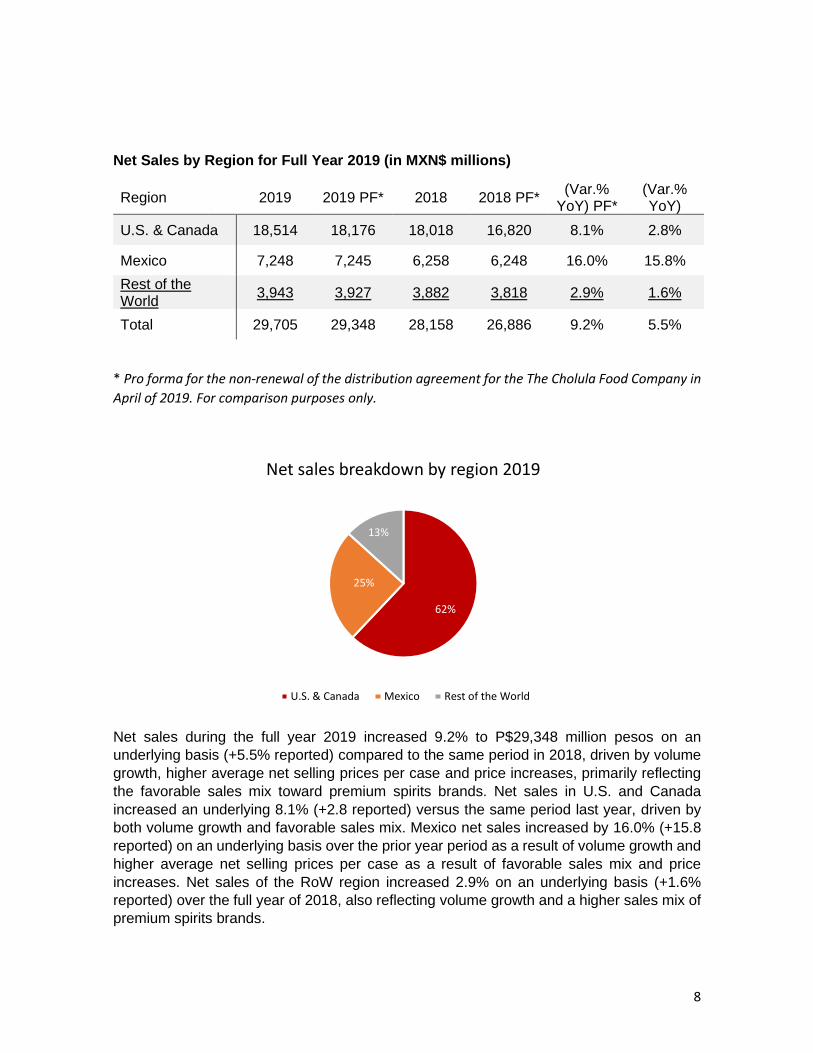
Net Sales by Region for Full Year 2019 (in MXN$ millions)
Region 2019 2019 PF* 2018 2018 PF* (Var.%
YoY) PF* (Var.% YoY)
U.S. & Canada 18,514 18,176 18,018 16,820 8.1% 2.8%
Mexico 7,248 7,245 6,258 6,248 16.0% 15.8%
Rest of the World
3,943 3,927 3,882 3,818 2.9% 1.6%
Total 29,705 29,348 28,158 26,886 9.2% 5.5%
* Pro forma for the non-renewal of the distribution agreement for the The Cholula Food Company in
April of 2019. For comparison purposes only.
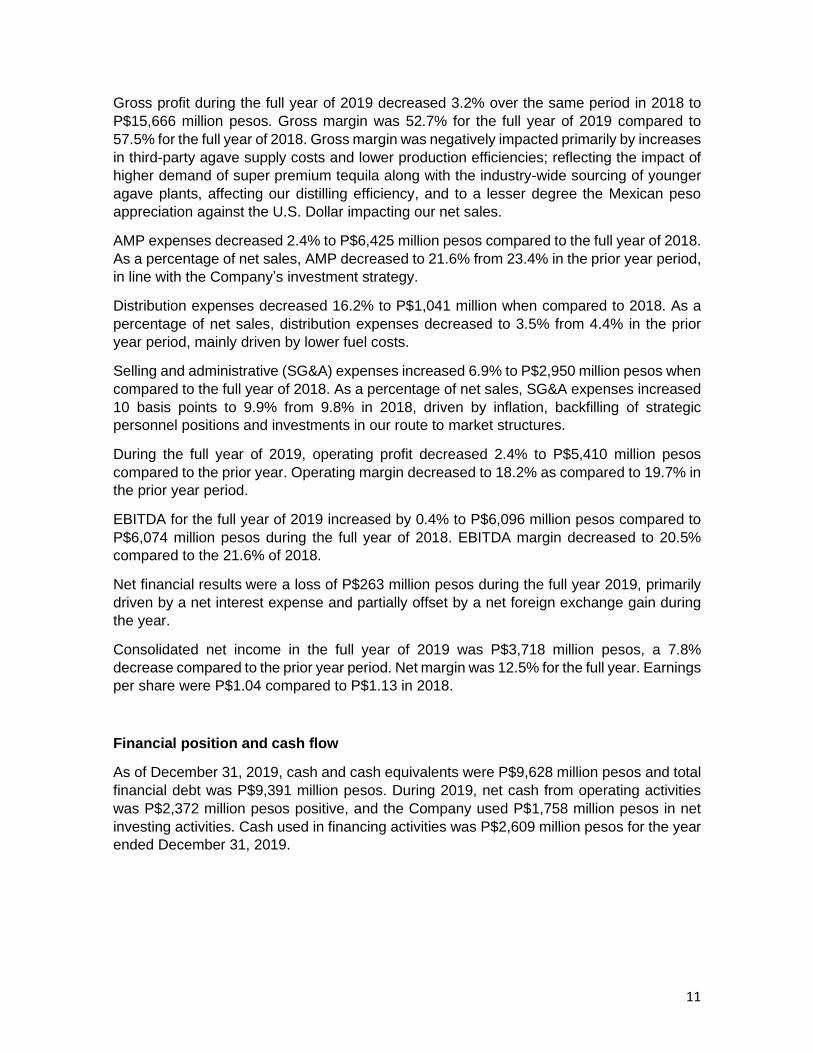
Net sales during the full year 2019 increased 9.2% to P$29,348 million pesos on an
underlying basis (+5.5% reported) compared to the same period in 2018, driven by volume
growth, higher average net selling prices per case and price increases, primarily reflecting
the favorable sales mix toward premium spirits brands. Net sales in U.S. and Canada
increased an underlying 8.1% (+2.8 reported) versus the same period last year, driven by
both volume growth and favorable sales mix. Mexico net sales increased by 16.0% (+15.8
reported) on an underlying basis over the prior year period as a result of volume growth and
higher average net selling prices per case as a result of favorable sales mix and price
increases. Net sales of the RoW region increased 2.9% on an underlying basis (+1.6%
reported) over the full year of 2018, also reflecting volume growth and a higher sales mix of
premium spirits brands.
62%
25%
13%
Net sales breakdown by region 2019
U.S. & Canada Mexico Rest of the World

9
Volume by Category for Full Year 2019 (in 000s nine-liter cases)
Category 2019 2019 PF* 2018 2018 PF* (Var.%
YoY) PF* (VAR.% YOY)
Jose Cuervo 7,296 7,296 6,692 6,692 9.0% 9.0%
Other Tequilas
3,574 3,574 3,268 3,268 9.3% 9.3%
Other Spirits 4,452 4,452 4,236 4,236 5.1% 5.1%
Non-Alcoholic and Other 3,929 3,724 4,274 3,562 4.6% -8.1%
RTD 3,067 3,067 2,808 2,808 9.2% 9.2%
Total 22,317 22,112 21,279 20,566 7.5% 4.9%
* Pro forma for the non-renewal of the distribution agreement for the The Cholula Food Company in
April of 2019. For comparison purposes only.
Volume of Jose Cuervo grew 9.0% versus the prior year and represented 32.7% of total volume for the full year of 2019. The Company’s Other Tequila brands represented 16.0% of total volume and increased 9.3% compared to the prior year. The Company’s Other Spirits brands represented 19.9% of total volume in the period and increased 5.1% over the full year of 2018. Volume of Non-alcoholic and Other represented 17.6% of total volume, growing 4.6% on an underlying basis compared to the prior year (-8.1% reported) driven by the non-renewal of the distribution agreement for the The Cholula Food Company brand in April of 2019. Volume of ready-to-drink (RTDs) represented 13.7% of total volume and increased by 9.2% compared to the prior year period.
33%
16%20%
17%
14%
Volume breakdown by category 2019
Jose Cuervo Other Tequilas Other Spirits Non-Alcoholic and Other RTD

10
Net Sales by Category for Full Year 2019 (in MXN$ millions)
Category 2019 2019 PF* 2018 2018 PF* (Var.%
YoY) PF* (VAR.% YOY)
Jose Cuervo 10,697 10,697 9,592 9,592 11.5% 11.5%
Other Tequilas 7,463 7,463 6,573 6,573 13.5% 13.5%
Other Spirits 6,765 6,765 6,582 6,582 2.8% 2.8%
Non-Alcoholic and Other 2,273 1,916 3,110 1,838 4.3% -26.9%
RTD 2,507 2,507 2,302 2,302 8.9% 8.9%
Total 29,705 29,348 28,158 26,886 9.2% 5.5%
Net sales of Jose Cuervo represented 36.0% of total net sales for the full year of 2019 and
reported an increase in net sales of 11.5% compared to 2018. The Company’s Other Tequila
brands represented 25.1% of total net sales and increased net sales 13.5% compared to
the prior year. The Company’s Other Spirits brands represented 22.8% of total net sales in
the period and reported a 2.8% increase in net sales compared to the full year of 2018. Net
sales of Non-alcoholic and Other represented 7.7% of total net sales with net sales
increasing 4.3% on an underlying basis (-26.9% reported) compared to the prior year driven
by the non-renewal of the distribution agreement for the The Cholula Food Company brand
in April of 2019. Net sales of ready-to-drink (RTDs) represented 8.4% of total net sales and
reported an increase of 8.9% compared to the prior year.
36%
25%
23%
8%
8%
Net sales breakdown by category 2019
Jose Cuervo Other Tequilas Other Spirits Non-alcoholic and Other RTD
11
Gross profit during the full year of 2019 decreased 3.2% over the same period in 2018 to
P$15,666 million pesos. Gross margin was 52.7% for the full year of 2019 compared to
57.5% for the full year of 2018. Gross margin was negatively impacted primarily by increases
in third-party agave supply costs and lower production efficiencies; reflecting the impact of
higher demand of super premium tequila along with the industry-wide sourcing of younger
agave plants, affecting our distilling efficiency, and to a lesser degree the Mexican peso
appreciation against the U.S. Dollar impacting our net sales.
AMP expenses decreased 2.4% to P$6,425 million pesos compared to the full year of 2018.
As a percentage of net sales, AMP decreased to 21.6% from 23.4% in the prior year period,
in line with the Company’s investment strategy.
Distribution expenses decreased 16.2% to P$1,041 million when compared to 2018. As a
percentage of net sales, distribution expenses decreased to 3.5% from 4.4% in the prior
year period, mainly driven by lower fuel costs.
Selling and administrative (SG&A) expenses increased 6.9% to P$2,950 million pesos when
compared to the full year of 2018. As a percentage of net sales, SG&A expenses increased
10 basis points to 9.9% from 9.8% in 2018, driven by inflation, backfilling of strategic
personnel positions and investments in our route to market structures.
During the full year of 2019, operating profit decreased 2.4% to P$5,410 million pesos
compared to the prior year. Operating margin decreased to 18.2% as compared to 19.7% in
the prior year period.
EBITDA for the full year of 2019 increased by 0.4% to P$6,096 million pesos compared to
P$6,074 million pesos during the full year of 2018. EBITDA margin decreased to 20.5%
compared to the 21.6% of 2018.
Net financial results were a loss of P$263 million pesos during the full year 2019, primarily
driven by a net interest expense and partially offset by a net foreign exchange gain during
the year.
Consolidated net income in the full year of 2019 was P$3,718 million pesos, a 7.8%
decrease compared to the prior year period. Net margin was 12.5% for the full year. Earnings
per share were P$1.04 compared to P$1.13 in 2018.
Financial position and cash flow
As of December 31, 2019, cash and cash equivalents were P$9,628 million pesos and total
financial debt was P$9,391 million pesos. During 2019, net cash from operating activities
was P$2,372 million pesos positive, and the Company used P$1,758 million pesos in net
investing activities. Cash used in financing activities was P$2,609 million pesos for the year
ended December 31, 2019.
12
IFRS 16: Leases
IFRS 16 was issued on January 2016 and replaces existing lease guidance, including IAS
17 Leases, IFRIC 4 Determining whether an Arrangement contains a Lease, SIC-15
Operating Leases – Incentives and SIC-27 Evaluating the Substance of Transactions
Involving the Legal Form of a Lease.
IFRS 16 introduces a single, on-balance sheet lease accounting model for lessees. A lessee recognizes a right-of-use asset representing its right to use the underlying asset and a lease liability representing its obligation to make lease payments. Subsequently, the lessee recognizes an amortization expense of the assets by right of use and an interest expense on the lease liabilities. There are recognition exemptions for short-term leases and leases of low-value items. Lessor accounting remains similar to the current standard – i.e. lessors continue to classify leases as finance or operating leases and only some disclosure requirements are added. For lessees, IFRS 16 also modifies its cash flows presentation related to leases, since cash flow outflows from operating activities are reduced and outflows of cash flows from financing activities increased. The Company adopted IFRS 16 initially on January 1, 2019, using the modified retrospective approach. Therefore, the cumulative effect of adopting IFRS 16 was recognized as an adjustment to the opening balance (increase in assets and liabilities). As of January 1, 2019, with no restatement of comparative information.
13
Conference Call
The Company plans to host a conference call for investors at 8:30 a.m. Mexico City Time
(9:30 a.m. US Eastern Time) tomorrow, Friday, February 28th, 2020, to discuss the
Company’s fourth quarter and full year 2019 unaudited financial results. Interested parties
may also listen to a simultaneous webcast of the conference call by logging onto the
Company’s website at https://engage.vevent.com/rt/beclesadecvao~02282020 or
www.becle.com.mx.
Fourth Quarter 2019 Unaudited Financial Results Conference Call and Webcast
Details:
Date: Friday, February 28, 2020
Time: 8:30 a.m. Mexico City Time (9:30 a.m. EST)
Participants: Juan Domingo Beckmann (CEO)
Fernando Suárez (CFO)
Dial-In: Mexico Toll-free 01 800 9269-157
U.S. Toll-free 1-(855) 493-3490
Toll/International 1-(720) 405-2153
Conference ID: 6367745
Webcast: https://engage.vevent.com/rt/beclesadecvao~02282020 or www.becle.com.mx
*Those participating via the webcast will be unable to participate in live Q&A
About Becle Becle is a globally renowned company in the spirits industry and the world’s largest producer of tequila. Its extraordinary portfolio of over 30 spirits brands, some of them owned, some of them agency brands distributed only in Mexico, has been developed throughout the years to participate in key categories with high growth potential, serving the world’s most important alcoholic beverage markets and attending key consumer preferences and tendencies. The portfolio strength of Becle is based in the profound legacy of its iconic internally developed brands such as Jose Cuervo®, combined with complementary acquisitions such as Three Olives®, Hangar 1®, Stranahan’s®, Bushmills®, Pendleton® and Boodles®, as well as a relentless focus on innovation that during the years has created renowned brands such as 1800®, Maestro Dobel®, Centenario®, Kraken®, Jose Cuervo® Margaritas and B:oost®, among others. Some of Becle’s brands are sold and distributed in more than 85 countries.
EBITDA EBITDA is a measure used in the Company’s financial analysis that is not recognized under
IFRS but is calculated from amounts that derive from the Company’s Financial Statements.
We calculate EBITDA as net income plus depreciation and amortization, income tax
expense, and interest expense, less interest income, plus foreign exchange gain (loss) .

14
EBITDA is not an IFRS measure of liquidity or performance, nor is EBITDA a recognized
financial measure under IFRS. We believe that EBITDA can be useful to facilitate
comparisons of operating performance between periods on a combined basis, but these
metrics may be calculated differently by other issuers. EBITDA should not be construed as
alternatives to (i) net income as an indicator of the Company’s operating performance or (ii)
cash flow from operating activities as a measure of the Company’s liquidity.
Disclaimer This press release contains certain forward-looking statements which are based on Becle’s
current expectations and observations. Actual results obtained may vary significantly from
these estimates. The information related to future performance contained in this press
release should be read jointly with the risks included in the “Risk Factors” section of the
Annual Report filed with the Comision Nacional Bancaria y de Valores (Mexican National
Banking and Securities Commission). This information, as well as future statements made
by Becle or by any of its legal representatives, either in writing or verbally, may vary
significantly from the actual results obtained. These forward-looking statements speak only
as of the date on which they are made, and no assurance can be made as to the actual
results obtained. Becle undertakes no obligation and does not intend to update or review
any of such forward-looking statements, whether as a result of new information, future
developments and other related events.
Investor Relations: Mariana Rojo [email protected] Alfredo Rubio [email protected]
Corporate Affairs
Mauricio García Perera [email protected]
15
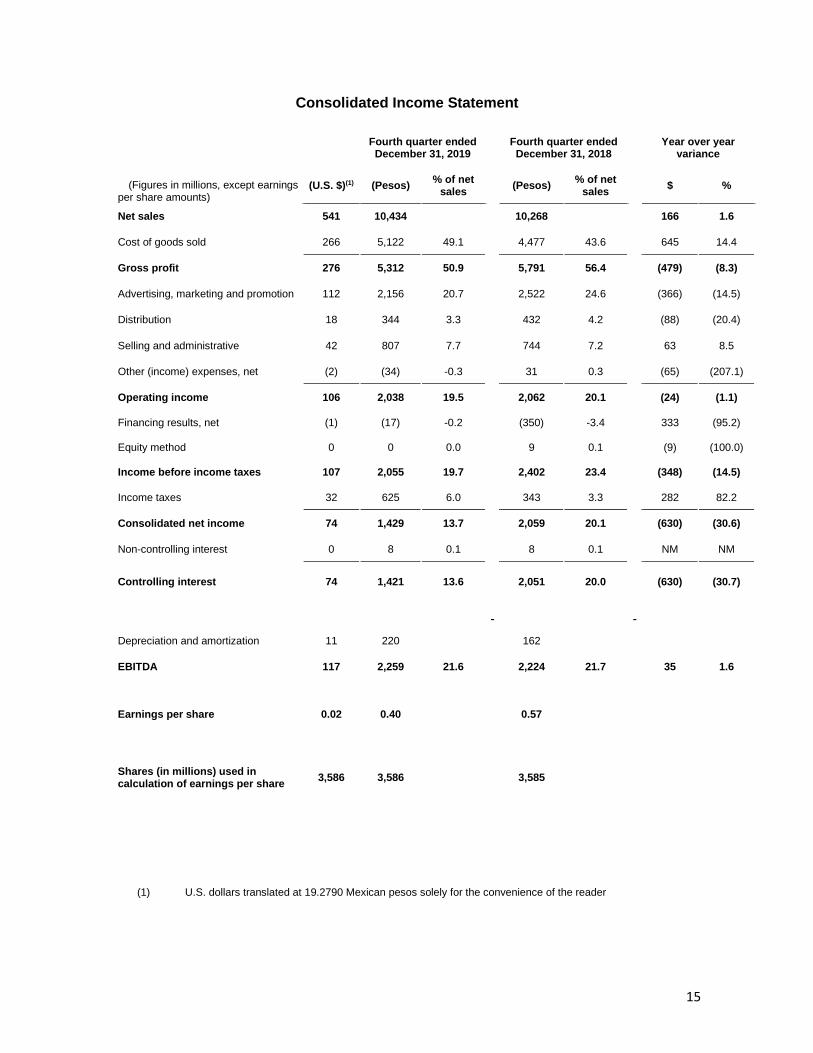
Consolidated Income Statement
Fourth quarter ended December 31, 2019
Fourth quarter ended December 31, 2018
Year over year
variance
(Figures in millions, except earnings per share amounts)
(U.S. $)(1) (Pesos) % of net
sales (Pesos)
% of net sales
$ %
Net sales 541 10,434
10,268
166 1.6
Cost of goods sold 266 5,122 49.1
4,477 43.6
645 14.4
Gross profit 276 5,312 50.9
5,791 56.4
(479) (8.3)
Advertising, marketing and promotion 112 2,156 20.7
2,522 24.6
(366) (14.5)
Distribution 18 344 3.3
432 4.2
(88) (20.4)
Selling and administrative 42 807 7.7
744 7.2
63 8.5
Other (income) expenses, net (2) (34) -0.3
31 0.3
(65) (207.1)
Operating income 106 2,038 19.5
2,062 20.1
(24) (1.1)
Financing results, net (1) (17) -0.2
(350) -3.4
333 (95.2)
Equity method 0 0 0.0
9 0.1
(9) (100.0)
Income before income taxes 107 2,055 19.7
2,402 23.4
(348) (14.5)
Income taxes 32 625 6.0
343 3.3
282 82.2
Consolidated net income 74 1,429 13.7
2,059 20.1
(630) (30.6)
Non-controlling interest 0 8 0.1
8 0.1
NM NM
Controlling interest 74 1,421 13.6
2,051 20.0
(630) (30.7)
Depreciation and amortization 11 220
162
EBITDA 117 2,259 21.6 2,224 21.7 35 1.6
Earnings per share 0.02 0.40
0.57
Shares (in millions) used in calculation of earnings per share
3,586 3,586
3,585
(1) U.S. dollars translated at 19.2790 Mexican pesos solely for the convenience of the reader

16
Consolidated Income Statement
Twelve months ended December 31, 2019
Twelve months ended
December 31, 2018
Year over year variance
(Figures in millions, except earnings per share amounts)
(U.S. $)(1) (Pesos) % of net
sales (Pesos)
% of net sales
$ %
Net sales 1,576 29,705
28,158
1,547 5.5
Cost of goods sold 745 14,039 47.3
11,975 42.5
2,064 17.2
Gross profit 831 15,666 52.7
16,183 57.5
(518) (3.2)
Advertising, marketing and promotion
341 6,425 21.6
6,580 23.4
(155) (2.4)
Distribution 55 1,041 3.5
1,242 4.4
(201) (16.2)
Selling and administrative 157 2,950 9.9
2,759 9.8
191 6.9
Other (income) expenses, net (8) (160) -0.5
60 0.2
(219) (368.0)
Operating income 287 5,410 18.2
5,543 19.7
(133) (2.4)
Financing results, net 14 263 0.9
387 1.4
(124) (32.1)
Equity method 0 0 0.0
9 0.0
(9) (100.0)
Income before income taxes 273 5,147 17.3
5,146 18.3
1 0.0
Income taxes 76 1,430 4.8
1,113 4.0
316 28.4
Consolidated net income 197 3,718 12.5
4,033 14.3
(315) (7.8)
Non-controlling interest 0 6 0.0
8 0.0
NM NM
Controlling interest 197 3,712 12.5
4,025 14.3
(313) (7.8)
Depreciation and amortization 36 685 531
EBITDA 323 6,096 20.5 6,074 21.6 22 0.4
Earnings per share 0.06 1.04
1.12
Shares (in millions) used in calculation of earnings per share
3,586 3,586
3,585
(1) U.S. dollars translated at 18.8452 Mexican pesos solely for the convenience of the reader

17
(1) U.S. dollars translated at 18.8452 Mexican pesos solely for the convenience of the reader
Statement of financial position
December 31, 2019
December 31,
2018
(Figures in millions) (U.S. $)(1) (Pesos) (Pesos)
Assets
Cash and cash equivalents 511 9,628 12,028
Trade receivable 493 9,295 8,536
Inventories, net 549 10,353 8,190
Other current assets 126 2,374 2,502
Total current assets 1,679 31,650 31,256
Non-current inventories 409 7,710 6,832
Property, plant and equipment, net 369 6,945 5,506
Right-of-use assets 109 2,046 0
Deferred income tax 70 1,314 1,454
Intangible assets and trademarks, net 755 14,230 14,664
Goodwill 332 6,253 6,354
Other assets 31 577 646
Total non-current assets 2,073 39,075 35,456
Total assets 3,753 70,725 66,711
Liabilities and stockholders' equity
Short term senior notes 2 46 48
Trade payable 116 2,183 2,594
Leases 24 446 0
Accruals 124 2,333 2,348
Other liabilities 89 1,680 102
Total current liabilities 355 6,687 5,092
Long term senior notes 496 9,345 9,745
Non-current leases 90 1,703 0
Environmental reserve 6 118 121
Other long-term liabilities 10 191 314
Deferred income taxes 217 4,089 3,568
Total non-current liabilities 820 15,445 13,748
Total liabilities 1,174 22,133 18,840
Controlling interest 2,575 48,520 47,805
Non-controlling interest 4 73 67
Total stockholders' equity 2,578 48,592 47,872
Total liabilities and stockholders’ equity 3,753 70,725 66,711

18
(1) U.S. dollars translated at 18.8452 Mexican pesos solely for the convenience of the reader
Cash flows statement
(Figures in millions)
Twelve months ended December
31, 2019
Twelve months ended December
31, 2018
(U.S. $)(1) (Pesos) (Pesos)
Operating activities: Income before income taxes 273 5,147 5,146
Adjustment from Items not implying cash flow: Depreciation and amortization 36 685 531
Loss on sale of property, plant and equipment 5 95 57
Interest income (10) (191) (193)
Equity method on associate 0 9
Gain on the sale of The Cholula Food Company (1) (19) 0
Unrealized foreign exchange (12) (218) (151)
Interest expense 29 543 443
Subtotal 321 6,042 5,842
Changes in:
Trade receivables (56) (1,064) (1,426)
Related parties 3 57 129
Other receivables (5) (99) (580)
Inventories (184) (3,461) (2,861)
Prepayments (4) (74) (85)
Trade payables (20) (371) 284
Other assets 16 294 177
Other accounts payable 77 1,460 (369)
Income taxes paid or recoverable (24) (461) (1,123)
Employee benefits 2 46 (170)
Net cash from operating activities 126 2,372 (181)
Investment activities: Property, plant and equipment (108) (2,038) (811)
Intangible assets (10) (189) (189)
Acquisition of subsidiaries, net of cash 0 0 (4,218)
Sale of The Cholula Food Company 14 266 0
Interest income 10 191 193
Investment in associate 0 0 (231)
Sale of property, plant and equipment 1 12 8
Net cash used in investing activities (93) (1,758) (5,248)
Financing activities: Dividends paid (104) (1,962) (1,819)
Repurchase of shares, net 8 155 (231)
Acquisition of minoritary interest (1) (21) 0
Principal lease payments (13) (251) 0
Interest paid (28) (530) (432)
Net cash used in financing activities (138) (2,609) (2,482)
Net decrease in cash and cash equivalents (106) (1,996) (7,911)
Effects of exchange rate change on cash (21) (404) (61)
Cash and cash equivalents: At beginning of the period 638 12,028 19,996
At end of period 511 9,628 12,028

19
Quarterly Cholula 2018 and 2019 top line by region
Supplemental Information (unaudited)
Quarterly volume by region 2018 (in 000s nine-liter cases)
Region Q1 Q2 Q3 Q4
U.S. & Canada 164 170 153 170
Mexico 3 3 2 3
Rest of the World 8 11 11 15
Total 175 184 166 187
Quarterly net sales by region 2018 (in MXN$ millions)
Region Q1 Q2 Q3 Q4
U.S. & Canada 285 314 277 323
Mexico 3 2 2 2
Rest of the World 11 16 15 23
Total 298 332 293 348
Quarterly volume by region 2019 (in 000s nine-liter cases)
Volume Q1 Q2 Q3 Q4
U.S. & Canada 178 13 - -
Mexico 3 0 - -
Rest of the World 9 2 - -
Total 189 15 - -
Quarterly net sales by region 2019 (in MXN$ millions)
NSV Q1 Q2 Q3 Q4
U.S. & Canada 319 17 - -
Mexico 3 0 - -
Rest of the World 13 3 - -
Total 334 21 - -
Recommended