Basics of Oceanography
Department of Ocean Engineering & Naval Architecture
Indian Institute of Technology Kharagpur, India
Dr. Prasad K. Bhaskaran

Oceanography is a multi-discipline science studying the
World ocean.
It includes:
- Physical oceanography
- Marine geology
- Marine chemistry
- Marine biology
- Marine technology
- etc.
In this course, we discuss on topics that include instruments,
measuring ocean properties and earth-orbiting satellites.
Another topic of satellite oceanography is the measurements of ocean
color, which can be used as assessments of phytoplankton biomass
and are of great interest to marine biologists.

What drives ocean currents?
Two external forces influence the World Ocean
generating ocean currents - gravitation and the energy
flux from the sun.
Gravitation includes tidal forces resulting from the
interaction of water mass with the moon and the sun,
and rotation of the Earth.
The radiation flux from the sun results in wind stress,
heating and cooling of the ocean surface, and
evaporation and precipitation of water.
A complex process of interaction between these forces
results in a complex and variable pattern of ocean
circulation.

Visual illustration of latitudinal gradient of insolation

Major latitudinal
displacements of
surface air currents:
convection currents
drive Hadley cells,
pulling air at surface
into Inter-Tropical
Convergence Zone,
ITCZ); Ferrel Cells
driven by low
pressure zone at 20º-
30º lat.; Mid-
latitude westerlies
converge into jet
stream; polar cells
driven by high
pressure (cold) flows
out of polar region
along Earth’s surface
towards south.

Classification of vegetation
types partially based on kinds
of plants, which tolerate
different climatic conditions.

Temperature Measurements
Reversing Thermometer
Unlike most conventional
mercury thermometers, a
reversing thermometer is able
to record a given temperature
to be viewed at a later time. If
the thermometer is flipped
upside down, the current
temperature will be shown until
it is turned upright again. This
was the primary device used by
oceanographers to determine
water temperatures below the
surface of the ocean from
around 1900 to 1970.

Temperature Measurements
CTD

Temperature Measurements
XBT

Temperature
Measurements
NOAA AHVRR
SST
Applications to
Potential Fishing
Zones

Z

Sea Surface Temperature
Winter data from Levitus and Boyer (1994)
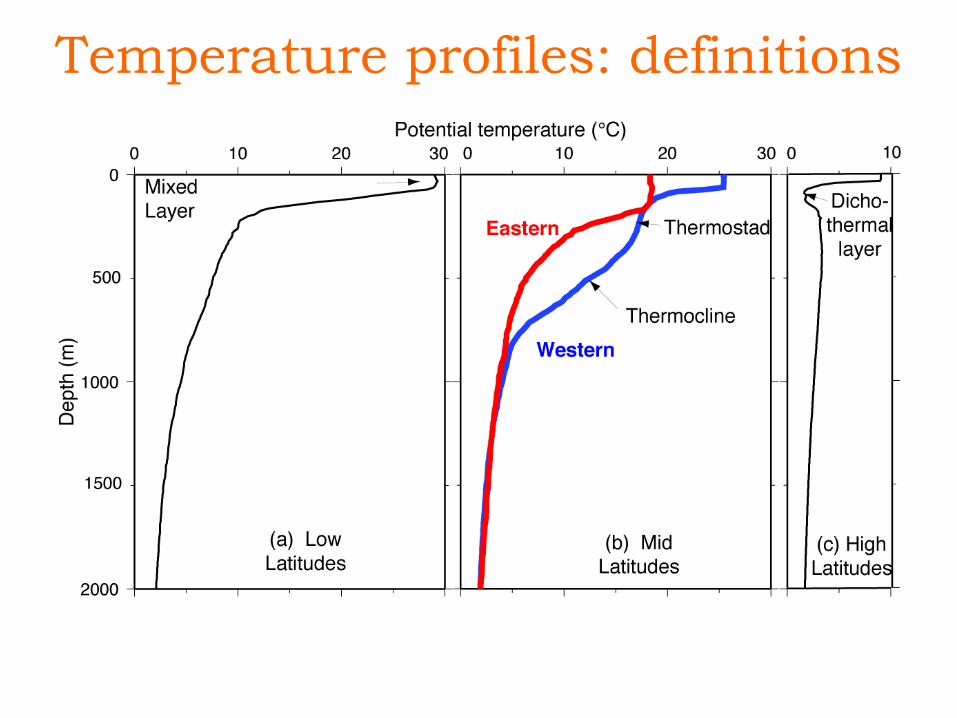
Temperature profiles: definitions

Temperature section

Seawater properties affected by
Radiation, Flux and DiffusionRadiation, Advection & Diffusion three processes which change things physically inside the ocean.
Radiation how heat and light (electro-magnetic waves) radiates.
– more important to atmosphere than oceans.
– penetration effects seen till euphotic zone.
– Ocean also radiates back heat to the atmosphere.
Advection movement of parcel carrying heat and salt with it.
– Volume transport = V.A (where, V=velocity; A=area of surface)
– Mass transport = ρVA (where, ρ = water density)
– Transport of dissolved materials = CρVA (where, C = concentration of mass (or) molecules of matter unit mass).

Flux directly related to transport (transport per unit area).
• Heat flux (Watts/m2).
• Change in flux is related to change in properties within a closed box.
An Example Let us consider there is a large flux of heat INTO a box that OUT of the box.
• This implies water coming out of box is cooler and must have cooled inside the box.
• Where has this heat lost and by what process??
• Loss of heat out of sea-surface if one face of box is at sea-surface.

Another Example Let us consider there is higher flux of oxygen into a box that outside
the box.
– This implies oxygen is consumed within the box by bacteria.
Change of flux through box flux divergence (more comes out than goes in)
Flux convergence less comes out than goes in.
Advection is similar to flux refers to what happens at a point rather than side of a volume.
Fluid Mechanics Advective terms explains how convergence or divergence of flux occurs at that point.
Diffusion similar to flux convergence/divergence at extremely small spatial scales.

Ficks Law of Diffusion
X
CADNx
where, Nx = mass flux ; A = area of plane of diffusion (m2)
D = diffusion coefficient (molecular/turbulent) in m2/min
C = concentration difference (mg m-3)
X = distance over which concentration gradient exists (L)
C/X = concentration gradient

Surface heat flux (W/m2)
into ocean

• Density of pure water is 1000 kg/m3.
• Ocean water is more dense because of the presence
of salt. Density of ocean water at the sea-surface is
about 1027 kg/m3.
• Two main factors that make ocean water more or
less dense than 1027 kg/m3 the temperature of
sea-water and its salinity.
• Ocean water gets denser as temperature goes
down. Hence, cold water are more denser.
• Increasing salinity also increases the density of sea
water.
Density of Seawater
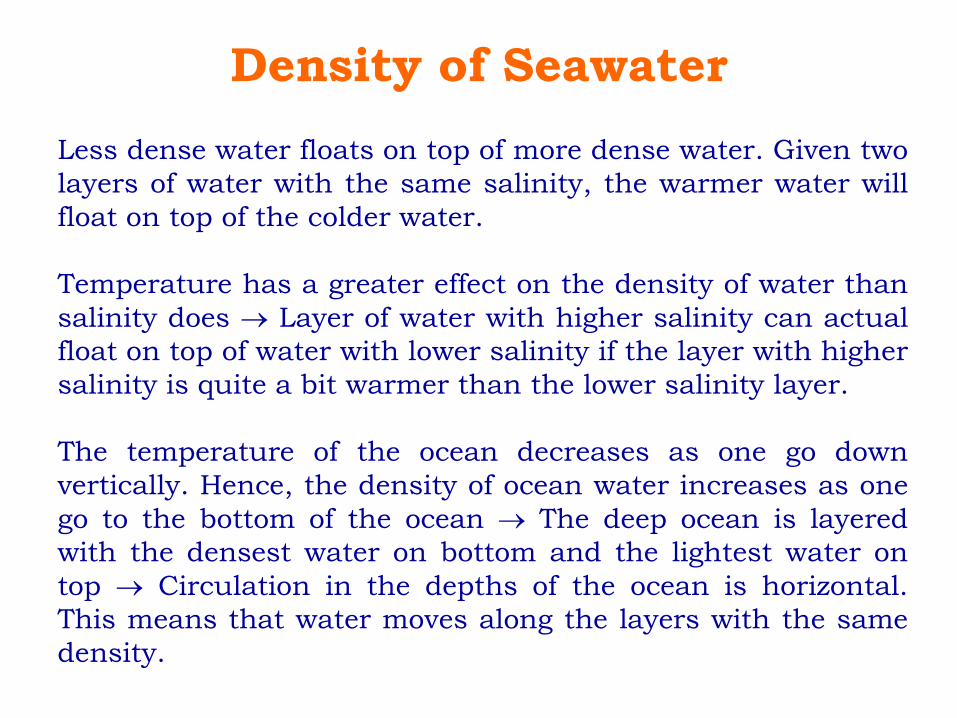
Less dense water floats on top of more dense water. Given two
layers of water with the same salinity, the warmer water will
float on top of the colder water.
Temperature has a greater effect on the density of water than
salinity does Layer of water with higher salinity can actual
float on top of water with lower salinity if the layer with higher
salinity is quite a bit warmer than the lower salinity layer.
The temperature of the ocean decreases as one go down
vertically. Hence, the density of ocean water increases as one
go to the bottom of the ocean The deep ocean is layered
with the densest water on bottom and the lightest water on
top Circulation in the depths of the ocean is horizontal.
This means that water moves along the layers with the same
density.
Density of Seawater

• The density of ocean water is rarely measured
directly. If one want to measure the density of
ocean water, one need to collect the sample of
sea water and bring it back to the laboratory
to be measured.
• Density is usually calculated using an
equation. One need to measure the salinity,
temperature and pressure to be able to
find density. These measurements are
often made with a CTD instrument, where the
instrument is placed in the ocean water from
a ship or a platform.
Density of Seawater

A CTD recorder, which stands for Conductivity-
Temperature-Depth recorder, measures the
physical properties of seawater.
As the CTD instrument is lowered through the
water measurements of conductivity, temperature
and depth are recorded continuously. General
data acquisition for a CTD profiler is up to 24 Hz,
which means that each parameter could be
measured up to 24 times each second. This
provides a very high resolution description of the
water being tested.
CTD instruments measure three important
parameters directly - conductivity, temperature
and pressure. By measuring conductivity
scientists can get a measurement of that water
sample's salinity. This is because electric current
passes much more easily through water with a
higher salt content. So if we know the
conductivity of the water, we know how much salt
is in the water. Accuracy of the measurement is
generally better than 0.005 psu for a standard
CTD profiler.

CTD instrument usually uses a thermistor, a platinum
thermometer, or a combination of these to measure the
temperature of the water. Temperature as measured by a CTD
instrument has an accuracy of greater than 0.005 degrees
Celsius.
Finally, a CTD instrument measures pressure using either a
strain gauge pressure monitor or a quartz crystal-based digital
pressure gauge. Pressure is recorded in decibars, and since
depth and pressure are directly related, a measurement in
decibars can be converted to depth in meters.
For example the pressure in "X" decibars is almost exactly
equal to the pressure found at "X" meters of depth. For
instance, at about 500 meters below the surface, the pressure
is almost around 500 dbars. The CTD instrument can measure
pressure to within an error margin of about 1%.
CTD

The Global Salinity Budget
• There is a riverine source …BUT…
salinity of the ocean is nearly
constant.
• Salinity is altered by air-sea
exchanges and sea ice formation.
• Useful for budgeting water mass

The Global Salinity Budget
• 3.6x10¹² kg salts are added to ocean each
year from rivers.
• Mass of the oceans is 1.4x10²¹ kg
• IF only riverine inputs, increase in
salinity is S ~ 1000 * 3.6x1012 kg/y /
1.4x10²¹ kg = 2.6x10⁻⁶ ppt per year
• Undetectable, but not geologically…
• Salinity is therefore constant (at least on
oceanographic time scales)

Global Salinity Distribution

The Global Salinity Budget
• Salinity follows (E-P) to high degree
through tropics and subtropics.
• Degree of correspondence falls off
towards the poles (sea ice…).
• Atlantic salinities are much higher
than Pacific or Indian Oceans.

Global Salinity Distribution

Surface salinity

1 Sverdrup = 106 m3 s-1
Why is the Atlantic so salty?

Salinity Measurements – ARGO Floats

T-S Diagram

Water Mass – T/S diagram


(Salinity - Temperature) graph for
month of January
(Near the Strait of Hormuz)
(Salinity - Depth) graph for month of
January (Near the Strait of Hormuz)
Water Masses in Persian Gulf

(Salinity - Temperature) graph for
month of January (1000Km away
from the Strait of Hormuz)
Water Masses in Persian Gulf
(Salinity - Depth) graph for month
of January (1000Km away from
the Strait of Hormuz)

Water-mass for the month of February (1000Km
away from the Strait of Hormuz)

Water-mass for the month of March (1000Km away
from the Strait of Hormuz)

Waveguides

Sound in the Oceans

SOFAR Channel

Gradients – Sound Propagation

Shadow Zones


Optical properties of seawater

Optical properties of seawater

Secchi Disk – Transparency of
seawater

MicroSAS

Recommended